

Abstract
Background
Although used widely, there is limited evidence of the BioMedical Admissions Test's (BMAT) predictive validity and incremental validity over prior educational attainment (PEA). We investigated BMAT's predictive and incremental validity for performance in two undergraduate medical schools, Imperial College School of Medicine (ICSM), UK, and Lee Kong Chian School of Medicine (LKCMedicine), Singapore. Our secondary goal was to compare the evidence collected with published evidence relating to comparable tools.
Methods
This was a retrospective cohort study of four ICSM (1188 students, entering 2010–2013) and three LKCMedicine cohorts (222 students, 2013–2015). We investigated associations between BMAT Section 1 (‘Thinking Skills’), Section 2 (‘Scientific Knowledge and Applications’) and Section 3a (‘Writing Task’) scores, with written and clinical assessment performance across all programme years. Incremental validity was investigated over PEA (A‐levels) in a subset of ICSM students.
Results
When BMAT sections were investigated independently, Section 2 scores predicted performance on all written assessments in both institutions with mainly small effect sizes (standardised coefficient ranges: ICSM: 0.08–0.19; LKCMedicine: 0.22–0.36). Section 1 scores predicted Years 5 and 6 written assessment performance at ICSM (0.09–0.14) but nothing at LKCMedicine. Section 3a scores only predicted Year 5 clinical assessment performance at ICSM with a coefficient <0.1. There were no positive associations with standardised coefficients >0.1 between BMAT performance and clinical assessment performance. Multivariable regressions confirmed that Section 2 scores were the most predictive. We found no clear evidence of incremental validity for any BMAT section scores over A‐level grades.
Discussion
Schools who wish to assess scientific knowledge independently of A‐levels may find BMAT Section 2 useful. Comparison with previous studies indicates that, overall, BMAT seems less useful than comparable tools. Larger scale studies are needed. Broader questions regarding why institutions adopt certain admissions tests, including those with little evidence, need consideration.
Short abstract
The authors use exploration of the BMAT to invite readers to reflect on why institutions adopt certain admissions tests even in the face of little utility evidence.
1. BACKGROUND
Selection into medical school is ‘high‐stakes’. It is high stakes for individual applicants because medical training substantially shapes their lives and careers; for stakeholders in medical education because training doctors is expensive in terms of time and money; and for the general population because the skill and composition of the medical workforce has implications for population health. 1 , 2 , 3 , 4
Medical school selection processes thus aim to identify the ‘best’ applicants: those who will do well on medical school and other assessments necessary for progression; become competent clinicians; and deliver care that meets the health care needs of diverse populations. 4 , 5 , 6 How to define ‘best’ continues to be actively debated, 7 , 8 and there is increasing awareness that definitions may differ by context. 4 However, in practical terms, schools across the world are regularly required to select the best candidates from a pool of well‐qualified applicants, many of whom also possess the personal qualities considered desirable in a medical student and doctor. 5 , 9 For example, in 2019, 22 340 applicants applied to study medicine in the UK, with only 9409 places available. 10 , 11 To make admissions decisions, medical schools typically draw on information gathered via a range of tools, which together make up their selection process. These tools may include academic records (e.g., pre‐university or prior educational attainment [PEA]), interviews or multiple‐mini interviews, personal statements, aptitude or other admissions tests, and references. 4 , 5
Admissions tests have become increasingly common worldwide in medical selection. 5 , 12 The advantages of admissions tests include offering a standardised measurement of all applicants on the same scale, distinguishing between applicants performing similarly in terms of PEA, measuring properties that are specifically relevant to medicine that may not be well measured by PEA, and widening access to medicine by offering a ‘level playing field’ by using tests that are (or are claimed to be) less affected by educational background and social class than PEA. 13
The research evidence on the relative strengths of admissions tests and other medical school selection tools varies in its quality and quantity, and there are clear gaps in our understanding of the utility of some specific tools. 4 , 5 This is a major issue. Although every admissions tool must be considered in the context of how and why it is used, 7 , 12 it is critical to understand the psychometric properties of each individual tool. In reference to Kane's validity framework, this equates to evaluating whether a specific assessment tool (selection being the first assessment of medical school 5 ) delivers what it claims, by testing those claims against empirical evidence. 14 In contexts like the United Kingdom, where medical schools can choose what admissions test to adopt, it is also useful to compare the properties of different admissions tests to inform decisions as to which tool is most fit for purpose.
In this paper, we examine a specific example of an admissions test, one which is currently used by more than 40 medical schools globally, but for which there is very limited evidence of its psychometric values: the BioMedical Admissions Test (BMAT). 15 A short description of BMAT is provided in Box 1.
Box 1. The Biomedical Admissions Test (BMAT).
The BMAT was designed to assist in the student selection process specifically for a number of ‘traditional’ UK (English) medical courses with clear pre‐clinical and clinical phases and a strong focus on science teaching in the early years. It is positioned as assessing “academic readiness for demanding science‐based study, not fitness to practise. It measures fundamental scientific understanding and clearly defined, learnable skills that medical admissions tutors regard as important to course success” (p. 559). 15 It comprises three sections. Section 1, ‘thinking skills’, measures skills in ‘problem‐solving, argument comprehension, data and graphical interpretation and inference’. 16 Section 2, ‘scientific knowledge and applications’, assesses knowledge of core mathematics, biology, chemistry and physics to the level of age‐16 qualifications. Section 3, the ‘writing task’, requires test takers to answer one of three short essay questions in 30 min. Initially, Section 3 was not marked by the test provider and it was used “only as a piece of qualitative evidence and to promote discussion during the interview” (p. 42559/60). 15
BMAT was first introduced in 2000, at the University of Cambridge, UK, in response to concerns that traditional academic selection tools were socially biased and unable to distinguish between applicants to medicine because of grade inflation. At the time of carrying out the current study more than 20 years later, only two papers had been published focusing on the validity of BMAT with respect to performance during medical school. These used data from the early 2000s, from one medical school, and showed that scores on one of the three BMAT components (Section 2) had small‐moderate associations with academic performance on written, knowledge‐based examinations in the first 2 years of a preclinical medical degree programme, 17 , 18 suggesting some predictive validity. However, there are no studies examining the association between BMAT scores and performance in other medical schools, on clinical examinations or performance in the later years of medical school. This paucity of research contrasts sharply with that reporting on other commercially available selection tests, such as the UCAT, formerly the UK Clinical Aptitude Test (the most widely used admissions test in the UK). 16 , 19 Moreover, the two published BMAT studies referred to above and BMAT generally have been criticised for lacking reliability and validity data, with several authors calling for more rigorous and independent research examining the use and properties of BMAT. 20 , 21
Although these calls for more research were more than 10 years ago, no more studies or technical reports were published by the test company, and no independent research was commissioned. Yet in this time, many more medical schools from several different countries (e.g., Thailand, Singapore, Hungary, Croatia, etc.; see https://bmat.edu.sg/school-list/) have adopted the BMAT, despite the very limited evidence of its utility in the context for which it was designed, let alone the very different contexts in which it is now used.
BMAT data have recently been included in the UK's Medical Education Research Database (UKMED) 22 and three recent studies found some indications that BMAT scores are modestly associated with postgraduate performance in the written components of three UK Royal College membership examinations. 23 , 24 , 25 The most recent of these studies also looked at the association between BMAT scores and performance on the clinical assessment of the MRCP (practical assessment of clinical evaluation skill [PACES]) and found a modest correlation between performance on the BMAT aptitude and skills subtest and PACES outcomes. 25 While very welcome, these studies do not address that gap in the literature about the extent to which BMAT predicts performance at medical school and particularly how well it predicts early years performance (as per the test claims).
It could be argued that how well an admissions test predicts performance as a doctor is more important than how it predicts performance as a medical student, given selection into medical school is, for all intents and purposes, selection into the profession of medicine in most contexts. However, medical schools need to have confidence that selection tools identify the best candidates as regards a medical school's mission and own, more proximal, measures of performance. Finally, around half of all BMAT test takers are students at international universities, 26 but no study has investigated its predictive validity in non‐UK contexts.
Our aim in this paper is to address these gaps in the literature by carrying out an independent study examining the predictive and incremental validity of the BMAT throughout medical school for both written and clinical examinations, using data from two medical schools, one based in the United Kingdom and one in Singapore.
Our research questions were as follows:
What predictive validity does BMAT scores have for medical school assessment performance?
Which section/sections of the BMAT have the most predictive validity?
What incremental validity does BMAT scores have for medical school assessment performance, over A‐level performance?
Finally, a secondary goal of this study was to compare the evidence we collected to published evidence relating to comparable tools. We do not carry out a direct analysis but report comparisons in the discussion, to help readers interested in admissions to consider the relative utility of different admissions tests.
2. METHODS
2.1. Design
This was a retrospective observational study of data from four cohorts of Imperial College London School of Medicine (ICSM) medical students and three cohorts of Lee Kong Chian School of Medicine, Singapore (LKCMedicine) students.
2.2. Context
ICSM at Imperial College London, in its current form, was established in 1997 through a combination of major west London medical schools. LKCMedicine is a partnership between ICSM and Nanyang Technological University (NTU), Singapore, taking its first intake of students in 2013. Students graduating from LKCMedicine are awarded a joint degree from Imperial and NTU. The MBBS programmes in both schools are monitored according to the standards in the UK Quality Code for Higher Education (2018) of the Quality Assurance Agency and the requirements of the UK's General Medical Council.
The MBBS programmes at both medical schools have similar annual gate‐keeping assessments and professional requirements that regulate student progression. The one notable difference between the programmes is that an intercalating BSc year is mandatory at ICSM—the core MBBS curriculum is delivered in Years 1–3, then Years 5 and 6. At the time of writing, this paper there was no intercalating year at LKCMedicine. Instead, LKCMedicine students progress directly through Years 1–5.
The principles underling the admissions processes at both medical schools are similar and broadly reflect widespread medical school admissions processes. 5 Achieving (or being predicted to achieve) a certain level of prior academic attainment is the first hurdle, then applicants sit the BMAT, and a number of applicants who achieve the qualification and BMAT expectations are invited to interview (latterly an MMI 27 ). Approximately three to four applicants are interviewed for each place in each institution. However, prospective medical students in the United Kingdom submit their applications via a national system, whereas applications in Singapore are at a local level.
2.3. Populations
We used data from three cohorts of LKCMedicine students (2013–2015 entrants) and four cohorts of ICSM students (2010–2013 entrants or equivalent). We followed LKCMedicine student progression from first year to graduation. At ICSM, we included students enrolled on courses A100 (standard undergraduate Medicine course) or A300 (Clinical Medicine, who transferred to ICSM for the clinical years of the course (3, 5 and 6) after completing the preclinical course at Oxford or Cambridge). Those on ICSM graduate entry programmes were not included in this study. ICSM students must have had complete assessment data for at least one of the years of the course, excluding the intercalated BSc year (i.e., Years 1, 2, 3, 5 and 6; ICSM intercalating data were excluded from this analysis). Where an individual repeated examinations, only their first attempts were included in the analyses.
2.4. Assessments at ICSM and LKCMedicine
The written and clinical (OSCE) examinations were similar across the two Schools. Data from eight assessments were included in the ICSM data (written exams in Years 1, 2, 3, 5 and 6; clinical exams in Years 3, 5 and 6). The written assessments in Years 1 and 2 focused more on basic science, although assessments in later years focused more on clinical knowledge and integration of science with clinical reasoning. There were nine assessments in LKCMedicine data (written exams in Years 1–5, clinical exams in Years 2–5). Clinical assessments were objective structured clinical examinations (OSCEs) and (at Imperial only) PACES. All assessment scores were converted to percentages prior to standardisation.
2.5. BMAT and BMAT sections
The BMAT comprises three sections (for a full description, see Cambridge Assessment Admissions Testing 15 and Box 1): Section 1, ‘thinking kills’; Section 2, ‘scientific knowledge and applications’; and Section 3, the ‘writing task’. Section 3 is marked in two parts, both scored on a 1–5 scale: 3a scores the quality of the content, 3b scores the quality of written English. Section 1 has face validity as a measure of fluid intelligence (reasoning that depends minimally on prior learning), while Section 2 resembles more a test of ‘crystallised intelligence’, focusing on acquired scientific knowledge. 28 , 29
We included scores from BMAT Section 1, Section 2 and Section 3a in the analyses. BMAT Section 3b scores showed very limited variability so were excluded from analysis: 76.0% of ICSM students scored the maximum 5 points and 19.6% scored 4. 100% of LKCMedicine students scored 5.
2.6. PEA: A‐level performance
Selection of medical students in the United Kingdom and elsewhere depends heavily on measures of PEA. In the United Kingdom, there are various qualifications, including A‐levels and Scottish Qualifications Authority (SQA) Highers and Advanced Highers. We limited our investigations of incremental validity to A‐levels because these are the most common pre‐university qualifications in ICSM applicants, 30 and there is no satisfactory way to standardise analyses across different types of pre‐university attainment. Individual A‐level grades were not available for LKCMedicine students, so our investigation of incremental validity used ICSM data only.
We used the following additional criteria for inclusion in incremental validity analyses at ICSM: Students must have completed three or more A‐levels (A2 level), excluding general studies, critical thinking or A‐levels that had been repeated in multiple years. Following Tiffin et al., 31 we calculated a score based on the three highest eligible A‐levels at A2 level. We used the following formula: A* = 12 points, A = 10 points, B = 8 points, C = 6 points, D = 4 points, and E = 2 points.
2.7. Standardising variables
Data came from multiple assessments across multiple years at both institutions. To account for variability across years and to enable comparison with the wider literature on medical school admissions tests, we z‐transformed each assessment variable and BMAT variable, within each year and institution. Data from ICSM and LKCMedicine were analysed separately to avoid assuming the same effects across institutions. For incremental validity analyses of ICSM data, we z‐transformed the scores for A‐level attainment within each year. By standardising variables in this way, we could express the predictive and incremental validity of the BMAT as standardised validity coefficients, interpretable similarly to correlation coefficients. We used Cohen's heuristics to describe coefficients as ‘small’ (0.1–0.29), ‘moderate’ (0.3–0.49) and ‘large’ (0.5–1). 32
2.8. Statistical analyses
On the basis of our research questions, we carried out the following analyses:
“What predictive validity do BMAT scores have for medical school assessment performance?” We investigated this using a series of univariable linear regressions (one independent and one dependent variable) with each assessment as the outcome and scores on each BMAT section as the predictor.
“Which section/sections of the BMAT have the most predictive validity?” We investigated this using a series of multivariable regressions (one dependent and multiple independent variables) with each assessment as the outcome, in which scores on all three BMAT sections were entered as predictors simultaneously.
“What incremental validity does the BMAT have for medical school assessment performance, over A‐level performance?” First, we investigated whether A‐level performance predicted ICSM assessment performance using univariable linear regressions with each assessment as the outcome and A‐level score as the predictor. We then investigated the incremental validity of scores on individual BMAT sections over A‐level performance by including individual BMAT section scores and A‐level performance as predictors in multivariable linear regressions predicting ICSM assessment performance.
In our experience, scores on medical school summative assessments data tend to be negatively skewed. We therefore ran all analyses as robust regressions, in which weights are assigned to the observations according to the size of their residual. Observations with very small residuals were assigned a weight of 1, while observations with large residuals had smaller weights assigned to them which limited their influence on model estimates. As sensitivity analyses, we also ran non‐robust versions of all analyses and compared the qualitative patterns of results. Unless otherwise stated, there were no substantive differences between robust and non‐robust analyses.
For the main regression analyses with standardised variables, we reported standardised regression coefficients (β) and their 95% confidence intervals (CIs) as tests of significance. Associations were significant if the CIs did not include 0. CIs were constructed using bootstrapping with 10 000 samples. Bootstrapping was used to avoid making distributional assumptions because data were generally negatively skewed. As convention, we also reported p values based on an approximation of the normal distribution of the test statistic in the Supporting Information. Each set of analyses resulted in multiple comparisons. We focused on interpretation of effect sizes over statistical significance, so did not correct for multiple comparisons, but given the large number of tests performed, we exercise caution when interpreting associations where the CIs were close to zero.
All analyses were implemented in R Version 4.1.0. 33 Robust linear regressions were run using the lmrob function from R package robustbase. 34
2.9. Ethical approval
Ethical approval was granted by the Educational Ethics Review Process at Imperial College London in the United Kingdom (EERP 2021‐009) and the NTU Institutional Review Board in Singapore (IRB‐2020‐10‐010).
2.10. Data management and governance
We performed a data protection impact assessment at Imperial College London to ensure appropriate storage, access and retention of data from ICSM and LKCMedicine, in accordance with the UK Data Protection Act (2018). All data were pseudonymised and stored securely on Imperial College servers with access limited to the immediate research team.
3. RESULTS
3.1. Data
At ICSM, the four cohorts contained 1188 students who were eligible for inclusion in the study. One thousand eighteen (85.7%) did not repeat years or change cohort. One hundred sixty‐two students (13.6%) appeared in two cohorts, and eights students (0.7%) appeared in three cohorts. The three cohorts at LKCMedicine contained 222 eligible students; five of whom (2.3%) appeared in two cohorts.
Table 1 shows the demographic features of the cohorts and the numbers of students per cohort. The demographic profiles of each cohort were similar within each institution. The cohorts were similar within institutions in terms of gender. Students at LKCMedicine were slightly older on average and had more variability in age, likely explained by compulsory national service for men in Singapore. Bearing in mind the different population structures in the United Kingdom and Singapore, there were more ethnic minority students (non‐white) at ICSM compared with LKCMedicine (non‐Chinese).
TABLE 1.
The numbers of students and descriptive statistics of student demographics, by cohort and medical school
| Institution | Variable | Cohort 1 | Cohort 2 | Cohort 3 | Cohort 4 |
|---|---|---|---|---|---|
| ICSM | Entry year | 2011 | 2012 | 2013 | 2014 |
| ICSM | N | 302 | 307 | 307 | 272 |
| ICSM | N male (%) | 165 (54.6%) | 187 (60.9%) | 176 (57.3%) | 156 (57.4%) |
| ICSM | N non‐White ethnicity (%) | 110 (36.4%) | 94 (30.6%) | 104 (33.9%) | 85 (31.2%) |
| ICSM | Mean (SD) age | 18.6 (1.2) | 18.7 (1.2) | 18.7 (1.3) | 18.4 (0.7) |
| ICSM | Median (IQR) age | 18 (1) | 18 (1) | 18 (1) | 18 (1) |
| LKCMedicine | Entry year | 2013 | 2014 | 2015 | |
| LKCMedicine | N | 54 | 78 | 90 | |
| LKCMedicine | N male (%) | 38 (70.4%) | 48 (61.5%) | 55 (61.1%) | |
| LKCMedicine | N non‐Chinese ethnicity (%) | 4 (7.4%) | 9 (11.5%) | 8 (8.9%) | |
| LKCMedicine | Mean (SD) age | 19.8 (0.9) | 19.5 (0.8) | 19.4 (0.8) | |
| LKCMedicine | Median (IQR) age | 20 (1) | 19 (1) | 19 (1) |
Abbreviations: ICSM, Imperial College School of Medicine, UK; IQR, interquartile range; LKCMedicine, Lee Kong Chian School of Medicine, Singapore.
At ICSM, 955 (80.3%) of students had complete score data for all summative assessments, excluding the Year 6 clinical assessments that were disrupted by COVID‐19 in 2020. There were no missing data for any assessments at LKCMedicine. BMAT score data was available for all LKCMedicine students but not all ICSM students. Table 2 shows the number of eligible students who completed each assessment for each cohort at ICSM, with the numbers and percentages with data available for scores from the three BMAT sections. BMAT scores were available for between 86.4% and 100% of students for each assessment. We performed all analyses using complete cases data.
TABLE 2.
The numbers of students who completed each assessment and the numbers and proportions with complete data available on each section of the BMAT at Imperial College School of Medicine
| Cohort | Outcome | N students per assessment | N (%) with BMAT S1 | N (%) with BMAT S2 | N (%) with BMAT S3a |
|---|---|---|---|---|---|
| 1 | Year 1 written | 273 | 271 (99.3%) | 271 (99.3%) | 255 (93.4%) |
| Year 2 written | 262 | 260 (99.2%) | 260 (99.2%) | 244 (93.1%) | |
| Year 3 clinical | 260 | 257 (98.8%) | 257 (98.8%) | 241 (92.7%) | |
| Year 3 written | 260 | 257 (98.8%) | 257 (98.8%) | 241 (92.7%) | |
| Year 5 written | 273 | 252 (92.3%) | 252 (92.3%) | 236 (86.4%) | |
| Year 5 clinical | 273 | 252 (92.3%) | 252 (92.3%) | 236 (86.4%) | |
| Year 6 written | 269 | 249 (92.6%) | 249 (92.6%) | 233 (86.6%) | |
| Year 6 clinical | 269 | 249 (92.6%) | 249 (92.6%) | 233 (86.6%) | |
| 2 | Year 1 written | 270 | 268 (99.3%) | 268 (99.3%) | 268 (99.3%) |
| Year 2 written | 260 | 258 (99.2%) | 258 (99.2%) | 258 (99.2%) | |
| Year 3 clinical | 281 | 262 (93.2%) | 262 (93.2%) | 261 (92.9%) | |
| Year 3 written | 281 | 262 (93.2%) | 262 (93.2%) | 261 (92.9%) | |
| Year 5 written | 281 | 260 (92.5%) | 260 (92.5%) | 259 (92.2%) | |
| Year 5 clinical | 281 | 260 (92.5%) | 260 (92.5%) | 259 (92.2%) | |
| Year 6 written | 269 | 249 (92.6%) | 249 (92.6%) | 248 (92.2%) | |
| Year 6 clinical | 269 | 249 (92.6%) | 249 (92.6%) | 248 (92.2%) | |
| 3 | Year 1 written | 270 | 270 (100%) | 270 (100%) | 270 (100%) |
| Year 2 written | 261 | 261 (100%) | 261 (100%) | 261 (100%) | |
| Year 3 clinical | 292 | 273 (93.5%) | 273 (93.5%) | 273 (93.5%) | |
| Year 3 written | 292 | 273 (93.5%) | 273 (93.5%) | 273 (93.5%) | |
| Year 5 written | 281 | 258 (91.8%) | 258 (91.8%) | 258 (91.8%) | |
| Year 5 clinical | 280 | 257 (91.8%) | 257 (91.8%) | 257 (91.8%) | |
| Year 6 written | 282 | 259 (91.8%) | 259 (91.8%) | 259 (91.8%) | |
| Year 6 clinical | 282 | 259 (91.8%) | 259 (91.8%) | 259 (91.8%) | |
| 4 | Year 1 written | 269 | 269 (100%) | 269 (100%) | 269 (100%) |
| Year 2 written | 267 | 267 (100%) | 267 (100%) | 267 (100%) | |
| Year 3 clinical | 297 | 274 (92.3%) | 274 (92.3%) | 274 (92.3%) | |
| Year 3 written | 297 | 274 (92.3%) | 274 (92.3%) | 274 (92.3%) | |
| Year 5 written | 269 | 269 (100%) | 269 (100%) | 269 (100%) | |
| Year 5 clinical | 268 | 268 (100%) | 268 (100%) | 268 (100%) | |
| Year 6 written | 265 | 265 (100%) | 265 (100%) | 265 (100%) | |
| Year 6 clinical | 0 |
Abbreviation: BMAT, BioMedical Admissions Test.
At ICSM, 1148 students (96.6%) had data available for pre‐university qualifications, of whom 1013 (88.2%) were eligible for analyses of incremental validity (i.e., had data for three or more A‐levels at A2 level, excluding general studies, critical thinking or A‐levels that had been repeated). Table S1 shows the combinations of three highest A‐level grades present in the data, with the prevalence of each pattern and the associated number of points. The most common pattern of A‐level grades was three A*s (30% of students with A‐levels).
3.1.1. Descriptive statistics
Table S2 shows descriptive statistics for untransformed assessment variables and BMAT variables for ICSM and LKCMedicine for each cohort. On inspection, the distributions of assessment scores and BMAT scores were largely comparable across the two institutions, with most assessment performance distributions being negatively skewed.
3.1.2. Univariable regressions: What predictive validity do BMAT scores have for medical school assessment performance?
Figure 1 shows results for ICSM, and Figure 2 shows results for LKCMedicine. Full results, including CIs and p values, are reported in Table S3. At ICSM, BMAT Section 1 scores showed very small associations with written assessment performance at ICSM in Years 1 and 5 (coefficients < 0.1) and a small association with written assessment performance in year 6 (coefficient = 0.14, 95% CI 0.08–0.21). At LKCMedicine, BMAT Section 1 scores showed no associations with any assessment outcomes.
FIGURE 1.
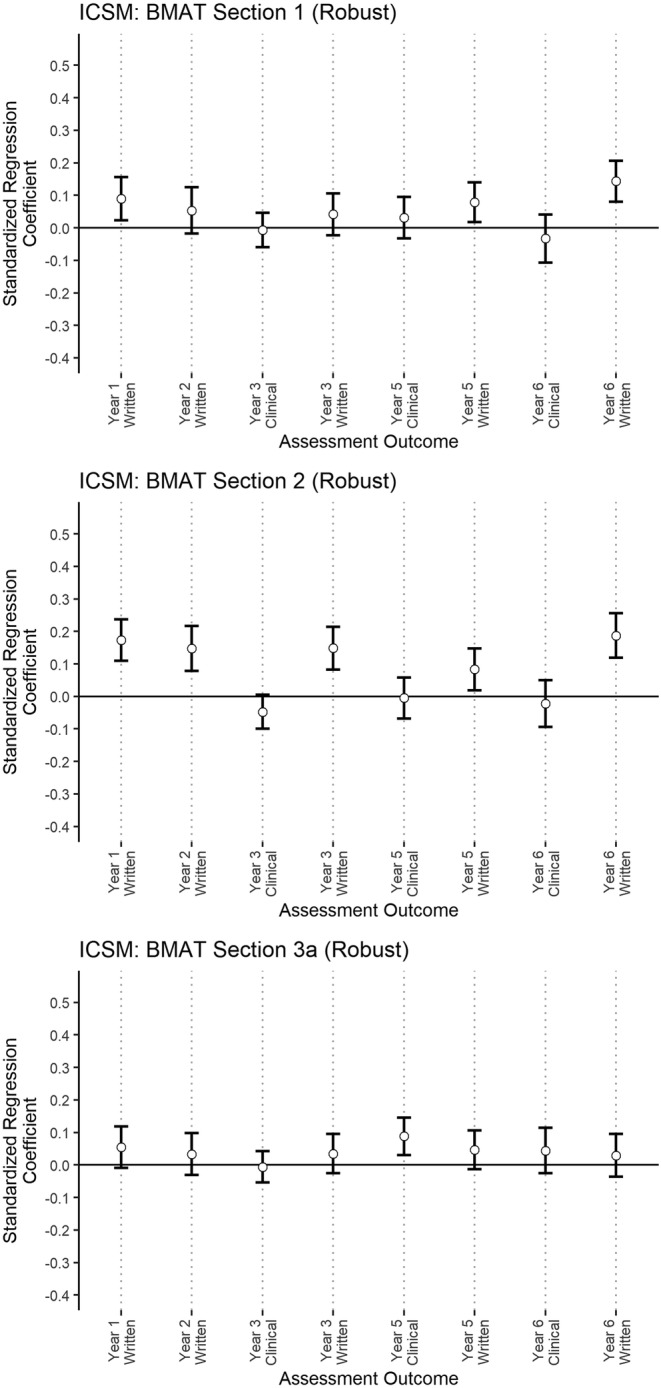
The standardised regression coefficients from univariable robust linear regressions investigating associations between individual BioMedical Admissions Test (BMAT) sections and assessment performance at ICSM. The bars indicate the 95% bootstrap CIs of the standardised coefficient (BMAT Section 1 = ‘thinking skills’, BMAT Section 2 = ‘scientific knowledge and applications’, BMAT Section 3a = writing content of the ‘writing task’)
FIGURE 2.
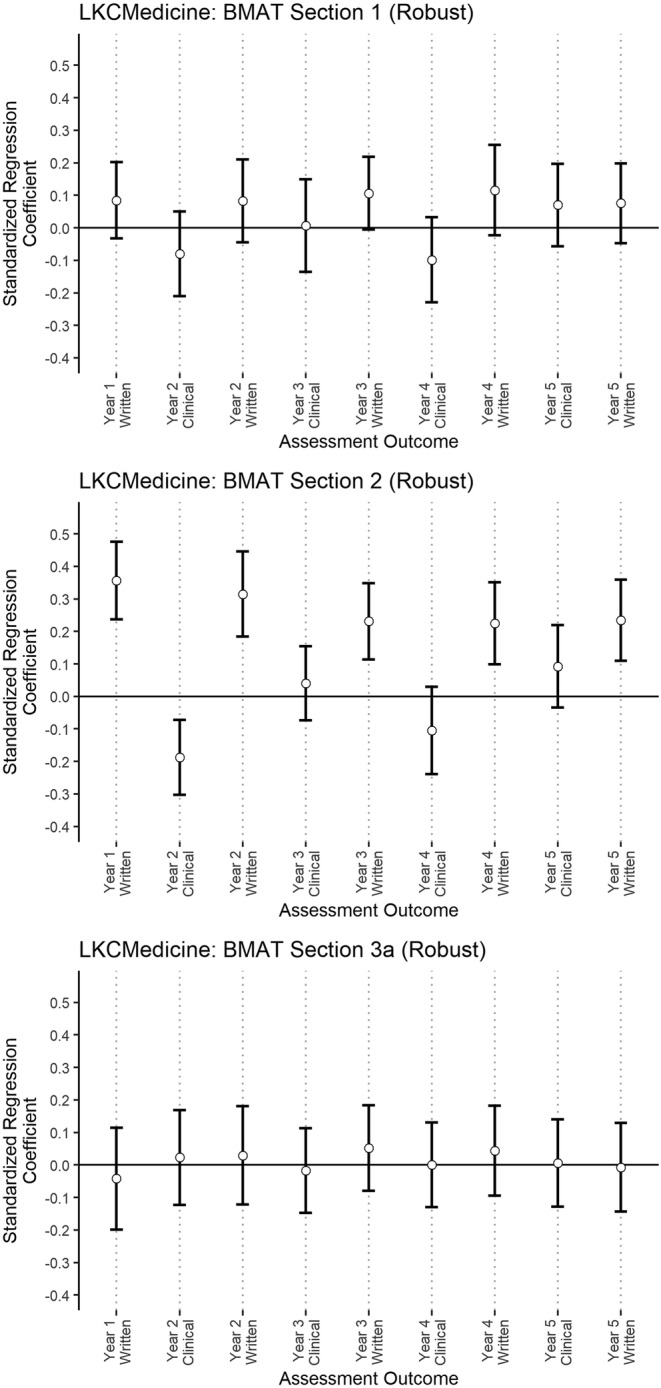
The standardised regression coefficients from univariable robust linear regressions investigating associations between individual BioMedical Admissions Test (BMAT) sections and assessment performance at LKCMedicine. The bars indicate the 95% bootstrap confidence intervals of the standardised coefficient (BMAT Section 1 = ‘thinking skills’, BMAT Section 2 = ‘scientific knowledge and applications’, BMAT Section 3a = writing content of the ‘writing task’)
At both LKCMedicine and ICSM, scores on BMAT Section 2 were significantly associated with higher performance on all written assessments. These coefficients became statistically non‐significant (p > 0.05) once the potential influence of PEA was controlled for in the regression. At ICSM, there were small associations with written assessment performance in Years 1, 2, 3 and 6 (coefficients ranging from 0.15–0.19) and an association with coefficient <0.1 in Year 5. At LKCMedicine, there were moderate associations between BMAT Section 2 scores and written assessment performance in Years 1 and 2 (coefficients = 0.36, 95% CI 0.24–0.48; 0.31, 95% CI 0.18–0.45, respectively), and small associations with written assessment performance in all later years (coefficients ranging from 0.22–0.23). There was a small negative association between BMAT Section 2 scores and clinical assessment performance at LKCMedicine (coefficient = −0.19, 95% CI −0.3 to −0.07). There were no associations between BMAT Section 2 scores and performance on any other clinical assessments at either institution.
At ICSM, BMAT Section 3a scores were significantly associated with higher performance on Year 5 clinical exams at ICSM, but with a coefficient <0.1. At LKCMedicine, scores on BMAT Section 3a showed no associations with any assessment outcomes.
3.1.3. Multivariable regressions: Which section/sections of the BMAT have the most predictive validity?
At ICSM, scores on all sections of the BMAT showed significant but small rank correlations (Sections 1 and 2: rho = 0.27, p < 0.0001; Sections 1 and 3a: rho = 0.10, p = 0.0004; Sections 2 and 3a: rho = 0.11, p < 0.0001). At LKCMedicine, only BMAT Sections 1 and 2 scores showed a rank correlation (rho = 0.31, p < 0.0001). There were no significant correlations between scores on Sections 1 and 3a or 2 and 3a.
To investigate which of the BMAT variables had the most predictive utility, we included scores from Sections 1, 2 and 3a simultaneously in a further set of robust linear regressions. Full results are shown in Table S4. The results were similar to those of univariable analyses above. At ICSM, we found small associations between BMAT Section 2 scores and written assessment performance in Years 1, 2, 3 and 6 (coefficients ranging from 0.14–0.16), and an association of effect size <0.1 with written assessment performance in Year 5. At ICSM, we found a small association between BMAT Section 1 scores and Year 6 written assessment performance (coefficient = 0.11, 95% CI 0.05–0.17). We also found a significant association of effect size <0.1 between BMAT Section 3a scores and Year 5 clinical assessment performance.
At LKCMedicine, we found significant associations between BMAT Section 2 scores and written assessment performance in all years, which were moderate for Years 1 and 2 (coefficients 0.37, 95% CI 0.24–0.5; 0.33, 95% CI 0.19–0.46, respectively) and small for years 3–5 (coefficients ranging from 0.21–0.24). We found a small negative association between BMAT Section 2 scores and Year 2 clinical assessment performance (coefficient = −0.18, 95% CI −0.31 to −0.05).
3.1.4. What incremental validity do BMAT scores have for medical school assessment performance, over A‐level performance?
We investigated incremental validity over A‐level attainment in the ICSM data. In a series of robust linear regressions with A‐level scores as the predictor, we found moderate associations between A‐level scores and written assessment performance in Years 1, 2, 3 and 6 (coefficients ranging from 0.34–0.43) and a small association with written assessment performance in Year 5 (coefficient = 0.26, 95% CI 0.2–0.32). We found small associations between A‐level performance and performance on all clinical assessments (coefficients ranging from 0.1–0.2). Full results are shown in Table S5.
We then included scores from each BMAT section and A‐level score as predictors in a series of robust linear regressions with assessment performance as the outcome (Figure 3). Full results are shown in Table S6. When adjusting for A‐level scores, we found significant associations of effect size <0.1 between BMAT Section 2 scores and written assessment performance in Year 6 and BMAT Section 3a scores and clinical assessment performance in Year 5. Importantly, we found no associations with effect size over 0.1. We also found significant negative associations (coefficients ranging from −0.08 to −0.1) between BMAT Section 2 scores and clinical assessment performance in Years 3 and 6. Sections 1 scores showed no significant associations with assessment performance after adjusting for A‐level performance. We therefore found no clear evidence of incremental validity of BMAT scores for predicting assessment performance over attained A‐level scores.
FIGURE 3.
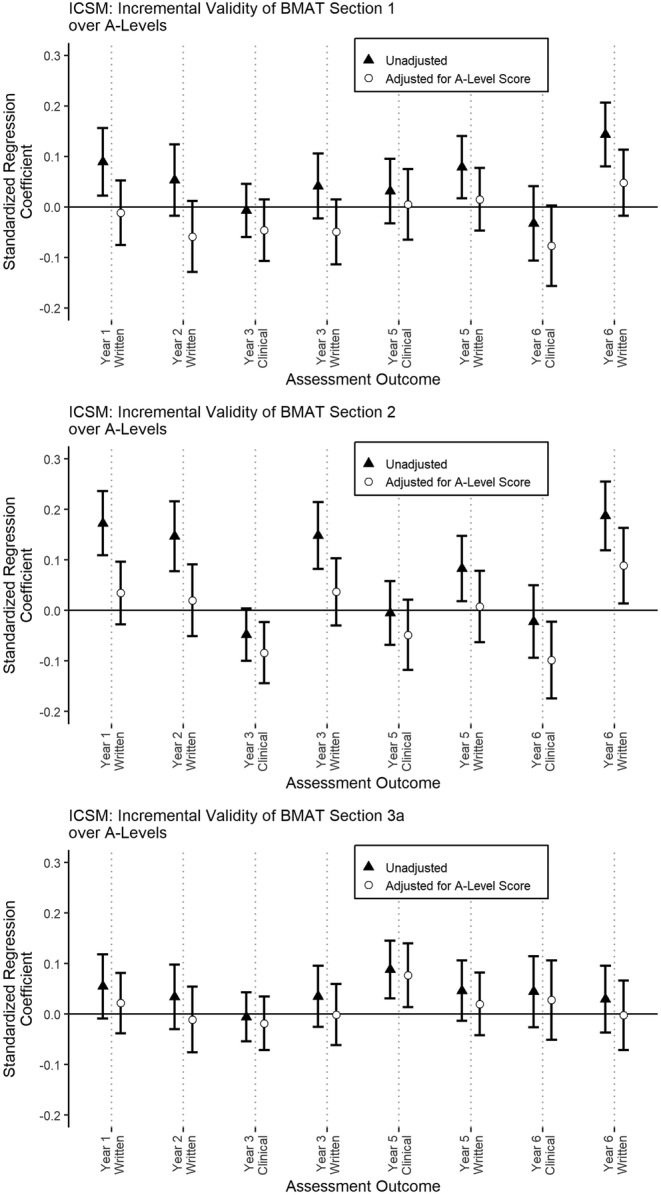
The standardised regression coefficients from multivariable robust linear regressions investigating how individual BioMedical Admissions Test (BMAT) sections and A‐level performance predicted assessment performance at Imperial College School of Medicine (ICSM). Only coefficients for associations between BMAT sections and assessment performance are shown, for clarity. The bars indicate the 95% bootstrap confidence intervals of the standardised coefficient. Triangles show the unadjusted coefficients from univariable analyses, for comparison. Circles show the coefficients after adjusting for A‐level performance (BMAT Section 1 = ‘thinking skills’, BMAT Section 2 = ‘scientific knowledge and applications’, BMAT Section 3a = writing content of the ‘writing task’)
4. DISCUSSION
This is the first independent study examining the predictive validity of the BMAT. With reference to Kane's validity framework, 14 we tested the predictive validity of BMAT scores for performance in the science‐focused early years of medical school. With reference to the bigger picture of medical school selection—as a gateway into the profession—we also examined whether BMAT performance was associated with performance in the later years and on clinical assessments (OSCEs). We were able to answer these questions using data from two medical schools located in different countries and with different student populations but with very similar admissions processes and degree programmes. Furthermore, we examined the incremental validity of BMAT over prior attainment (A‐level performance) in the UK dataset.
We will discuss the predictive validity of each section of the BMAT in turn, comparing our findings with published data from other medical school admissions tests. These include tests positioned for use with undergraduate medical programmes, and which focus on assessing aptitude—specifically the University Clinical Aptitude Test 35 (UCAT, formerly UKCAT) and the Undergraduate Medicine and Health Sciences Admissions Test 36 (UMAT). We also compared the BMAT to two admissions tests aimed at selection into graduate medical school, and which claim to assess knowledge rather than aptitude: the pre‐2015 and newer versions of the Medical College Admissions Test 37 (MCAT) and Graduate Australian Medical School Admissions Test 38 (GAMSAT).
4.1. Section 1: Weak evidence of predictive validity, not as strong as other admissions tests
Our findings suggest that Section 1 of the BMAT (‘thinking skills’) underperforms with respect to both predictive and incremental validity. Scores on BMAT Section 1 had standardised validity coefficients <0.1 for written assessment performance in Years 1 and 5 and a small standardised coefficient (0.14) for Year 6 written assessment performance at ICSM only. BMAT Section 1 scores had no predictive validity for written assessments at LKCMedicine and no predictive validity for clinical assessments in either institution. We (and others) posit that BMAT Section 1 seems to test fluid intelligence. 15 , 17 , 18 , 20 Yet in these cohorts it predicted performance at medical school less than the fluid intelligence components of, for example, UCAT. 16 , 19 , 39 , 40
Importantly, these last two studies found evidence of incremental validity of the UCAT over PEA, whereas we found no incremental validity for BMAT Section 1 scores over A‐levels. This suggests that BMAT Section 1 is not as useful as UCAT for predicting performance over and above A‐level scores.
4.2. Section 2: Some predictive but little incremental validity
Scores on Section 2 of the BMAT, measuring ‘scientific knowledge and applications’, predicted performance on all written exams across both institutions. This is consistent with patterns reported in the two existing BMAT studies 17 , 18 and similar to that seen in the pre‐2015 MCAT and GAMSAT. 41 , 42 However, the standardised coefficients were mostly small (in univariable analyses, see Table S3 and Figures 1 and 2), ranging from 0.08–0.19 at ICSM and 0.22–0.36 at LKCMedicine.
The standardised coefficients of BMAT Section 2 scores were comparable to those found for UCAT predictive validities (mainly small [0.1–0.29] but some moderate [0.3–0.49] coefficients 16 , 19 ) and similar to, or exceeding, UMAT predictive validity (variable coefficients, ranging from non‐predictive to coefficients of around 0.2 42 , 43 ). BMAT Section 2 predictive validity falls below the moderate‐large validity coefficients found for the new MCAT (~0.5–0.7) 44 and for the pre‐2015 MCAT for final exams (~0.5 for the science sections). 41 It appears comparable to the science sections in the GAMSAT (coefficient ~0.2) 42 and the pre‐2015 MCAT for preclinical performance (coefficients ~ 0.2–0.3). 41 When associations between scores on all BMAT sections and assessment performance were considered simultaneously in multivariable regressions, only Section 2 had a consistent pattern of predictive validity for written assessments across both institutions.
Importantly, we found no convincing evidence of incremental validity over attained A‐levels. The only positive association between BMAT Section 2 scores and assessment performance, after adjusting for attained A‐levels, was with written performance in Year 6 at ICSM only, with a standardised coefficient <0.1. We also found two negative associations of BMAT Section 2 scores with clinical assessment performance in Years 3 and 6 (coefficients ranging from −0.1 to −0.08). Given the large number of comparisons made and the small effect sizes, we do not interpret these as strong evidence that BMAT Section 2 performance is a negative predictor of clinical assessment performance. The overall pattern was of no clear incremental validity of BMAT Section 2 scores over attained A‐levels for medical school assessment performance.
In summary, scores on Section 2 of BMAT have some predictive utility for medical school performance in written exams without adjusting for PEA, with effect sizes similar to those of other admissions tests. The predictive validity of BMAT Section 2 scores is small‐moderate, similar to UCAT, UMAT and the science section of GAMSAT. Contrary to the assertion by BMAT that A‐level performance has insufficient variability to distinguish students, 18 we found that A‐level performance predicted performance on all written and clinical assessments (coefficients from 0.26–0.43 for written assessments and 0.1–0.2 for clinical assessments). Scores on Section 2 of BMAT did not clearly predict anything over and above PEA, perhaps because both are largely indices of attainment.
4.3. Section 3a: No evidence of predictive utility
We found one association between scores on BMAT Section 3a (writing quality of the ‘writing task’) and clinical assessment performance in Year 5 at ICSM with a standardised coefficient <0.1, and no associations between performance on this section and performance on any assessment at LKCMedicine. We therefore consider that we found no consistent evidence of predictive utility for BMAT Section 3a. This mirrors similar findings for writing tasks within the pre‐2015 MCAT 41 and GAMSAT. 42
In summary, we found evidence that BMAT Section 2 was consistently predictive of medical school performance on written assessments, but the associations were mainly small and appeared to offer little over the predictive utility of actual A‐level grades. Scores on Sections 1 and 3a appeared to be of little use in terms of predictive or incremental validity. Our comparison with previous published literature suggests BMAT has less utility than other widely used admissions tests.
4.4. Strengths and limitations
This study has several strengths. It is a reasonably large, two‐centre, international study using multiple cohorts and investigating associations with both written and clinical assessment performance throughout medical school. The two schools studied align with BMAT's market positioning: They have with a strong emphasis on science teaching in the first 2 years and are undergraduate entry programmes, and most of their applicants have A‐levels as the main indicator of PEA. The patterns, in terms of predictive validity, were similar across the two centres, which may reflect common characteristics in their core curricula, given that LKCMedicine is a partnership between Imperial College and NTU.
Importantly, we investigated incremental validity over the most common type of pre‐university qualification in the United Kingdom. We focused on adjustment for PEA only because, as has been discussed in similar studies on other admissions tests, 23 , 39 , 45 it is the only aspect of admissions that can be quantified in a relatively standardised way. Finally, we used robust statistical methods.
Of course, our study has several limitations. First, our data will be subject to range restriction, whereby we only had data available for successful applicants (see McManus et al., 46 for a full discussion of this issue of construct‐level predictive validity). We could not adjust for this without knowing properties of the full distribution of applicants and not just entrants (successful applicants), which was not available to us. Range restriction could be expected to attenuate associations between predictors and outcomes, so validity coefficients might be expected to increase as has been found for UCAT. 40 We have attempted to mitigate this by comparing our coefficients to uncorrected coefficients in the literature. Second, we did not adjust for possible grade inflation changes across cohorts. However, the study time period was relatively short, and so we believe this would not be a significant confounding factor. 47 Finally, issues of the fairness of the BMAT were mostly beyond the scope of the current study because of the complexity in comparing socio‐economic backgrounds across countries and require further study.
4.5. Suggestions for future research and practice
This was the first international study examining the validity of the BMAT. We found similar patterns of findings across two institutions, but extreme caution must be taken when transferring an admissions test (or any standardised measure) from one context to another. 4 Related to this, BMAT is marketed internationally, but there is no published research looking at the associations between BMAT and indices of attainment in the range of countries where it is used (e.g., Thailand's Advanced National Educational Test) or prior degrees where it is used for selection into graduate entry programmes. We call for collaboration across schools using BMAT to enable a more comprehensive examination of the extent to which this test predicts medical school—and postgraduate—performance in different student populations across different countries. More generally, studies are needed to examine patterns and relationships between prior attainment and performance for any admissions test that is used outside the contexts for which they were developed. 4 , 5
We also consider practical issues. First, the ethical implications of requiring candidates to pay for, and prepare for, a test in which two of its three sections have little to no predictive validity should be considered. Is it ethical to require applicants take a test that is demanding in terms of cost, preparation time and associated stress, 48 if it is of limited usefulness when assessed on its objectives—especially in comparison to A‐levels? This economic/ethical issue is not unique to BMAT. Although some countries and systems offer financial support for less affluent applicants, this is not always available, so the cost of sitting an admissions test may represent a barrier to application for some groups and individuals, perpetuating inequalities. 49 , 50 , 51 , 52
Second, medical schools are constrained by their wider systems and timelines. In the United Kingdom, for example, most prospective students only have teacher‐predicted grades at the point of applying to study medicine through the national university admissions system (the issues with predicted grades are beyond the remit of the current paper, but are discussed elsewhere 23 , 53 ). It is not feasible to interview every applicant who has been predicted to obtain the necessary academic requirements. 5 Selection tests represent a relatively cheap and acceptable method (from the selector's perspective) to compare and select applicants for interview, 4 , 48 , 54 thus whittling down the numbers of applicants to manageable numbers. This is a reality of the selection process but raises another point for consideration. Defending the use of BMAT and other selection tests needs to be considered within the framework of local structures. For example, in the United Kingdom, research that looks at BMAT's incremental validity in relation to teacher‐predicted grades not just actual grades is necessary given the selection process mostly occurs pre‐qualification. If not, then is it ethical to expect applicants to pay for any admissions test if the only utility of these tests is an administrative one, for the medical school to manage numbers of applicants? It is also difficult to defend rejecting (or indeed making an offer to) an applicant based on performance on any test that has low predictive utility for how well an individual will perform at medical school and does not add further predictive utility over PEA.
This leads us to the bigger issues. Any new admissions test or tool cannot be expected to have a sound evidence base—evidence has to be accumulated over time. We believe test companies have the ethical responsibility to encourage and support independent research examining the psychometric properties of their tools, particularly where the tool is funded from applicant fees. This has been managed quite successfully by some admissions test companies (e.g., UCAT https://www.ucat.ac.uk/research/ and MCAT https://www.aamc.org/services/mcat-admissions-officers/mcat-validity-research), less so by others (BMAT clearly, and similarly CASPER https://caspertestprep.com/blog/casper-test-review). Moreover, working from the position that the use of any admissions test is a necessary part of medical school selection processes in contexts where there are more applicants with the required PEA than there are places, which test is best? And what is ‘best’? The predictive and incremental validity of admissions tools are one consideration. However, other factors like stakeholder views, context and the goals and mission of the medical school must be taken into account when considering whether to use a selection test, and if so, which one to use. 4 , 5 , 7 Our experience at the coalface of selection and as selection researchers suggests that the hard sell of commercially available products and/or the ‘reflected glory’ of using an admissions test associated with a high‐status university may, for some, be more influential than its psychometric properties. These and other reasons why institutions adopt certain admissions tests, including those with little evidence of utility, merit in‐depth qualitative exploration.
Second, what are we selecting for? We would argue that medical schools are not selecting applicants who are ready for demanding science‐based study per se. They are identifying applicants who have the capability to become doctors, not just pass science courses. To use a test that in practice assesses only science knowledge (Section 2) either assumes other parts of the selection process will do the job of assessing personal qualities, or privileges science knowledge as being more important than personal qualities befitting a career in medicine such as compassion, team working skills and integrity. 12 , 55 , 56 Of course, other tools may be more appropriate for assessing personal qualities. 5 However, typically applicants have to reach a threshold on tests such as BMAT to even be invited for further assessments, and many medical schools only use PEA and/or a selection test to make offers. Therein lies the dilemma.
5. CONCLUSION
This paper has provided evidence for the predictive and incremental validity of the BMAT. Schools who wish to assess scientific knowledge, independently of A‐levels, may find Section 2 useful. However, overall, BMAT seems less useful than comparable tools. Future work should examine the value of BMAT on a larger scale and in other contexts and investigate group‐level differences in BMAT performance. This study also highlights broader questions and the need for research exploring why institutions adopt admissions tests, including those with little evidence of utility.
CONFLICT OF INTEREST
JC was formerly a member of UKCAT (UCAT) Research Committee but had left this role before engaging with the current study. Otherwise the authors have no conflicts of interest.
AUTHOR CONTRIBUTIONS
JC and AS conceptualised and designed the study. DD and RC acquired and analysed the data, with support from KM and SK. All authors contributed to interpreting the data and the drafting and critical revision of the paper. All authors approved the final manuscript for submission.
ETHICAL APPROVAL
Ethical approval was granted by the Educational Ethics Review Process at Imperial College London in the United Kingdom (EERP 2021‐009) and the Nanyang Technological University Institutional Review Board in Singapore (IRB‐2020‐10‐010).
Supporting information
Table S1: A‐level grade combinations at Imperial College School of Medicine (ICSM)
Table S2: Descriptive statistics of performance variables across both institutions
Table S3: Univariable analyses: associations between performance on individual BMAT sections and assessment outcomes across both institutions
Table S4: Multivariable analyses: associations between performance on all BMAT sections considered simultaneously and assessment outcomes across both institutions
Table S5: Associations between A‐level performance and assessment performance at Imperial College School of Medicine
Table S6: Incremental validity: associations between performance on individual BMAT sections and assessment performance at Imperial College School of Medicine, controlling for A‐level performance
ACKNOWLEDGMENTS
We thank the colleagues at Imperial College London's Strategic Planning Division who provided data on pre‐university assessments for analysis, and to the ICSM and LKCMedicine Admissions and Assessment teams who provided the majority of data for analysis.
Davies DJ, Sam AH, Murphy KG, Khan SA, Choe R, Cleland J. BMAT's predictive validity for medical school performance: A retrospective cohort study. Med Educ. 2022;56(9):936‐948. doi: 10.1111/medu.14819
Funding Information The authors did not seek external funding for this study.
DATA AVAILABILITY STATEMENT
The data that support the findings of this study are available from the corresponding author upon reasonable request.
REFERENCES
- 1. Frenk J, Chen L, Bhutta ZA, et al. Health professionals for a new century: transforming education to strengthen health systems in an interdependent world. Lancet. 2010;376(9756):1923‐1958. doi: 10.1016/S0140-6736(10)61854-5 [DOI] [PubMed] [Google Scholar]
- 2. Schreurs S, Cleland J, Muijtjens AMM, oude Egbrink MGA, Cleutjens K. Does selection pay off? A cost–benefit comparison of medical school selection and lottery systems. Med Educ. 2018;52(12):1240‐1248. doi: 10.1111/MEDU.13698 [DOI] [PMC free article] [PubMed] [Google Scholar]
- 3. Gorman D. Matching the production of doctors with national needs. Med Educ. 2018;52(1):103‐113. doi: 10.1111/MEDU.13369 [DOI] [PubMed] [Google Scholar]
- 4. Patterson F, Roberts C, Hanson MD, et al. 2018Ottawa consensus statement: Selection and recruitment to the healthcare professions. Med Teach. 2018;40(11):1091‐1101. doi: 10.1080/0142159X.2018.1498589 [DOI] [PubMed] [Google Scholar]
- 5. Patterson F, Knight A, Dowell J, Nicholson S, Cousans F, Cleland J. How effective are selection methods in medical education? A systematic review. Med Educ. 2016;50(1):36‐60. doi: 10.1111/medu.12817 [DOI] [PubMed] [Google Scholar]
- 6. Kreiter CD, Axelson RD. A perspective on medical school admission research and practice over the last 25 years. Teach Learn Med. 2013;25(sup1):S50‐S56. doi: 10.1080/10401334.2013.842910 [DOI] [PubMed] [Google Scholar]
- 7. Cleland JA, Patterson F, Hanson MD. Thinking of selection and widening access as complex and wicked problems. Med Educ. 2018;52(12):1228‐1239. doi: 10.1111/MEDU.13670 [DOI] [PubMed] [Google Scholar]
- 8. Schreurs S, Cleutjens KBJM, Cleland J, oude Egbrink MGA. Outcomes‐based selection into medical school: predicting excellence in multiple competencies during the clinical years. Acad Med. Published online. 2020;95(9):1411‐1420. doi: 10.1097/ACM.0000000000003279 [DOI] [PMC free article] [PubMed] [Google Scholar]
- 9. Hecker K, Norman G. Have admissions committees considered all the evidence? Adv Heal Sci Educ 2016 222. 2017;22(2):573‐576. doi: 10.1007/S10459-016-9750-1 [DOI] [PubMed] [Google Scholar]
- 10. Office for Students . Medical and dental intakes—office for students. Published Online January 2019. https://www.officeforstudents.org.uk/advice-and-guidance/funding-for-providers/health-education-funding/medical-and-dental-intakes/
- 11. UCAS . Record number of applicants for ‘early deadline’ university courses |Undergraduate|.
- 12. Cleland JA, Dowell J, McLachlan J, Nicholson S, Patterson F. Identifying best practice in the selection of medical students: literature review and interview survey. Gen Med Counc. 2012(November 2012):1‐106. http://www.gmc-uk.org/Identifying_best_practice_in_the_selection_of_medical_students.pdf_51119804.pdf [Google Scholar]
- 13. Nicholson S. The benefits of aptitude testing for selecting medical students. BMJ. 2005;331(7516):559‐560. doi: 10.1136/bmj.331.7516.559 [DOI] [PMC free article] [PubMed] [Google Scholar]
- 14. Kane MT. Validating the interpretations and uses of test scores. J Educ Meas. 2013;50(1):1‐73. doi: 10.1111/JEDM.12000 [DOI] [Google Scholar]
- 15. Cambridge Assessment Admissions Testing . BMAT. https://www.admissionstesting.org/for-test-takers/bmat/
- 16. Bala L, Pedder S, Sam AH, Brown C. Assessing the predictive validity of the UCAT—a systematic review and narrative synthesis. Med Teach. 2021;23:1‐9. doi: 10.1080/0142159X.2021.1998401 [DOI] [PMC free article] [PubMed] [Google Scholar]
- 17. Emery JL, Bell JF, Vidal Rodeiro CL. The BioMedical Admissions Test for medical student selection: issues of fairness and bias. Med Teach. 2011;33(1):62‐71. doi: 10.3109/0142159X.2010.528811 [DOI] [PubMed] [Google Scholar]
- 18. Emery JL, Bell JF. The predictive validity of the BioMedical Admissions Test for pre‐clinical examination performance. Med Educ. 2009;43(6):557‐564. doi: 10.1111/j.1365-2923.2009.03367.x [DOI] [PubMed] [Google Scholar]
- 19. Greatrix R, Nicholson S, Anderson S. Does the UKCAT predict performance in medical and dental school? A systematic review. BMJ Open. 2021;11(1):e040128. doi: 10.1136/BMJOPEN-2020-040128 [DOI] [PMC free article] [PubMed] [Google Scholar]
- 20. McManus IC, Ferguson E, Wakeford R, Powis D, James D. Predictive validity of the Biomedical Admissions Test: an evaluation and case study. Med Teach. 2011;33(1):53‐57. doi: 10.3109/0142159X.2010.525267 [DOI] [PubMed] [Google Scholar]
- 21. Ramachandran S, Venkatesh H. A call for greater transparency in the evidence base supporting the BMAT. Med Teach. 2015;37(3):302. doi: 10.3109/0142159X.2014.956066 [DOI] [PubMed] [Google Scholar]
- 22. Dowell J, Cleland J, Fitzpatrick S, et al. The UK medical education database (UKMED) what is it? Why and how might you use it? BMC Med Educ. 2018;18(1):6. doi: 10.1186/s12909-017-1115-9 [DOI] [PMC free article] [PubMed] [Google Scholar]
- 23. McManus IC, Woolf K, Harrison D, et al. Predictive validity of A‐level grades and teacher‐predicted grades in UK medical school applicants: a retrospective analysis of administrative data in a time of COVID‐19. BMJ Open. 2021;11(12):e047354. doi: 10.1136/bmjopen-2020-047354 [DOI] [PMC free article] [PubMed] [Google Scholar]
- 24. Ellis R, Brennan P, Scrimgeour DSG, Lee AJ, Cleland J. Performance at medical school selection correlates with success in Part A of the intercollegiate Membership of the Royal College of Surgeons (MRCS) examination. Postgrad Med J Published Online. 2021;postgradmedj‐2021‐139748. doi: 10.1136/POSTGRADMEDJ-2021-139748 [DOI] [PubMed] [Google Scholar]
- 25. Paton LW, McManus IC, Cheung KYF, Smith DT, Tiffin PA. Can achievement at medical admission tests predict future performance in postgraduate clinical assessments? A UK‐based national cohort study. BMJ Open. 2022;12(2):e056129. doi: 10.1136/BMJOPEN-2021-056129 [DOI] [PMC free article] [PubMed] [Google Scholar]
- 26. Devine A, Taylor L, Cross B. The biomedical school applicant: considering the test taker in test development and research. 2017. https://www.admissionstesting.org/Images/570632-chapter-2-applying-the-socio-cognitive-framework-to-the-biomedical-admissions-test.pdf
- 27. Eva KW, Reiter HI, Rosenfeld J, Norman GR. The ability of the multiple mini‐interview to predict preclerkship performance in medical school. Acad Med. 2004;79(10 Suppl):S40‐S42. doi: 10.1097/00001888-200410001-00012 [DOI] [PubMed] [Google Scholar]
- 28. Cattell RB. Theory of fluid and crystallized intelligence: a critical experiment. J Educ Psychol. 1963;54(1):1‐22. doi: 10.1037/h0046743 [DOI] [PubMed] [Google Scholar]
- 29. Blair C. How similar are fluid cognition and general intelligence? A developmental neuroscience perspective on fluid cognition as an aspect of human cognitive ability. Behav Brain Sci. 2006;29(2):109‐125. doi: 10.1017/S0140525X06009034 [DOI] [PubMed] [Google Scholar]
- 30. McManus ICC, Woolf K, Dacre J, Paice E, Dewberry C. The academic backbone: longitudinal continuities in educational achievement from secondary school and medical school to MRCP (UK) and the specialist register in UK medical students and doctors. BMC Med. 2013;11(1):242. doi: 10.1186/1741-7015-11-242 [DOI] [PMC free article] [PubMed] [Google Scholar]
- 31. Tiffin PA, Dowell JS, McLachlan JC. Widening access to UK medical education for under‐represented socioeconomic groups: modelling the impact of the UKCAT in the 2009 cohort. BMJ. 2012;344(7853):e1805. doi: 10.1136/bmj.e1805 [DOI] [PMC free article] [PubMed] [Google Scholar]
- 32. Cohen J. Statistical power analysis. Curr Dir Psychol Sci. 1992;1(3):98‐101. doi: 10.1111/1467-8721.EP10768783 [DOI] [Google Scholar]
- 33. Team RC . Team: R: a language and environment for statistical. Google Scholar. URL http//www R‐project org. Published online 2015.
- 34. Maechler M, Rousseeuw P, Croux C, Todorov V. Package “robustbase”. Published Online 2021. Accessed March 10, 2022. https://cran.irsn.fr/web/packages/robustbase/robustbase.pdf
- 35. About the University Clinical Aptitude Test (UCAT) , UCAT Consortium. https://www.ucat.ac.uk/
- 36. UMAT Australia , Undergraduate Medical Admission Test. https://www.australiaeducation.info/tests/higher-education-standardised-tests/umat
- 37. AAMC , About the MCAT exam. https://students-residents.aamc.org/about-mcat-exam/about-mcat-exam
- 38. About GAMSAT|Graduate Medical School Admissions Test|GAMSAT|ACER. https://gamsat.acer.org/about-gamsat
- 39. McManus IC, Dewberry C, Nicholson S, Dowell JS. The UKCAT‐12 study: educational attainment, aptitude test performance, demographic and socio‐economic contextual factors as predictors of first year outcome in a cross‐sectional collaborative study of 12 UK medical schools. BMC Med. 2013;11(1):244. doi: 10.1186/1741-7015-11-244 [DOI] [PMC free article] [PubMed] [Google Scholar]
- 40. Tiffin PA, Mwandigha LM, Paton LW, et al. Predictive validity of the UKCAT for medical school undergraduate performance: A national prospective cohort study. BMC Med. 2016;14(1):1‐19. doi: 10.1186/S12916-016-0682-7/TABLES/6 [DOI] [PMC free article] [PubMed] [Google Scholar]
- 41. Donnon T, Paolucci EO, Violato C. The predictive validity of the MCAT for medical school performance and medical board licensing examinations: a meta‐analysis of the published research. Acad Med. 2007;82(1):100‐106. doi: 10.1097/01.ACM.0000249878.25186.b7 [DOI] [PubMed] [Google Scholar]
- 42. Mercer A, Hay M, Hodgson WC, Canny BJ, Puddey IB. The relative predictive value of undergraduate versus graduate selection tools in two Australian medical schools. Med Teach. 2018;40(11):1183‐1190. doi: 10.1080/0142159X.2018.1426839 [DOI] [PubMed] [Google Scholar]
- 43. Edwards D, Friedman T, Pearce J. Same admissions tools, different outcomes: a critical perspective on predictive validity in three undergraduate medical schools. BMC Med Educ. 2013;13(1):173. doi: 10.1186/1472-6920-13-173 [DOI] [PMC free article] [PubMed] [Google Scholar]
- 44. Busche K, Elks ML, Hanson JT, et al. The validity of scores from the new MCAT exam in predicting student performance: results from a multisite study. Acad Med. 2020;95(3):387‐395. doi: 10.1097/ACM.0000000000002942 [DOI] [PubMed] [Google Scholar]
- 45. McManus IC, Smithers E, Partridge P, Keeling A, Fleming PR. A levels and intelligence as predictors of medical careers in UK doctors: 20 year prospective study. BMJ. 2003;327(7407):139‐142. doi: 10.1136/BMJ3277407139 [DOI] [PMC free article] [PubMed] [Google Scholar]
- 46. McManus ICC, Dewberry C, Nicholson S, Dowell JS, Woolf K, Potts HWW. Construct‐level predictive validity of educational attainment and intellectual aptitude tests in medical student selection: meta‐regression of six UK longitudinal studies. BMC Med. 2013;11(1):1‐21. doi: 10.1186/1741-7015-11-243/FIGURES/5 [DOI] [PMC free article] [PubMed] [Google Scholar]
- 47. Babcock P. Real costs of nominal grade inflation? New evidence from student course evaluations. Econ Inq. 48(4):983‐996. doi: 10.1111/j.1465-7295.2009.00245.x [DOI] [Google Scholar]
- 48. Kelly ME, Patterson F, OFlynn S, Mulligan J, Murphy AW. A systematic review of stakeholder views of selection methods for medical schools admission. BMC Med Educ. 2018;18(1):1‐26. doi: 10.1186/s12909-018-1235-x [DOI] [PMC free article] [PubMed] [Google Scholar]
- 49. Esping‐Andersen G. Untying the gordian knot of social inheritance. Res Soc Stratif Mobil. 2004;21(C):115‐138. doi: 10.1016/S0276-5624(04)21007-1 [DOI] [Google Scholar]
- 50. Gorard S, Siddiqui N. How trajectories of disadvantage help explain school attainment. SAGE Open. 2019;9(1):215824401882517. doi: 10.1177/2158244018825171 [DOI] [Google Scholar]
- 51. Gale T, Parker S. Widening participation in Australian higher education: report submitted to HEFCE and OFFA published online 2013. http://www.hefce.ac.uk/pubs/rereports/Year/2013/wpeffectiveness/Title,92183,en.html
- 52. Milburn A. Fair access to professional careers: a progress report by the independent reviewer on social mobility and child poverty; 2012.
- 53. Richardson PH, Winder B, Briggs K, Tydeman C. Grade predictions for school‐leaving examinations: do they predict anything? Med Educ. 1998;32(3):294‐297. doi: 10.1046/j.1365-2923.1998.00225.x [DOI] [PubMed] [Google Scholar]
- 54. Cleland JA, Foo J, Ilic D, Maloney S, You Y. “You cant always get what you want …”: economic thinking, constrained optimization and health professions education. Adv Heal Sci Educ. 2020;25(5):1163‐1175. doi: 10.1007/s10459-020-10007-w [DOI] [PMC free article] [PubMed] [Google Scholar]
- 55. Albanese MA, Snow MH, Skochelak SE, Huggett KN, Farrell PM. Assessing personal qualities in medical school admissions. Acad Med. 2003;78(3):313‐321. doi: 10.1097/00001888-200303000-00016 [DOI] [PubMed] [Google Scholar]
- 56. Frank JR, Snell L, Sherbino JE. CanMEDS 2015 physician competency framework. In: Frank J, Snell L, Sherboni J, eds. CanMEDS 2015 Physician Competency Fram Ottawa R Coll Physicians Surg Canada. Published online. Vol.2015:1‐30. Accessed March 10, 2022 http://www.royalcollege.ca/portal/page/portal/rc/canmeds/resources/publications [Google Scholar]
Associated Data
This section collects any data citations, data availability statements, or supplementary materials included in this article.
Supplementary Materials
Table S1: A‐level grade combinations at Imperial College School of Medicine (ICSM)
Table S2: Descriptive statistics of performance variables across both institutions
Table S3: Univariable analyses: associations between performance on individual BMAT sections and assessment outcomes across both institutions
Table S4: Multivariable analyses: associations between performance on all BMAT sections considered simultaneously and assessment outcomes across both institutions
Table S5: Associations between A‐level performance and assessment performance at Imperial College School of Medicine
Table S6: Incremental validity: associations between performance on individual BMAT sections and assessment performance at Imperial College School of Medicine, controlling for A‐level performance
Data Availability Statement
The data that support the findings of this study are available from the corresponding author upon reasonable request.