



Abstract
Type 1 diabetes (T1D) is a complex autoimmune disease characterized by an absolute deficiency of insulin. It affects more than 20 million people worldwide and imposes an enormous financial burden on patients. The underlying pathogenic mechanisms of T1D are still obscure, but it is widely accepted that both genetics and the environment play an important role in its onset and development. Previous studies have identified more than 60 susceptible loci associated with T1D, explaining approximately 80%‐85% of the heritability. However, most identified variants confer only small increases in risk, which restricts their potential clinical application. In addition, there is still a so‐called ‘missing heritability’ phenomenon. While the gap between known heritability and true heritability in T1D is small compared with that in other complex traits and disorders, further elucidation of T1D genetics has the potential to bring novel insights into its aetiology and provide new therapeutic targets. Many hypotheses have been proposed to explain the missing heritability, including variants remaining to be found (variants with small effect sizes, rare variants and structural variants) and interactions (gene–gene and gene–environment interactions; e.g. epigenetic effects). In the following review, we introduce the possible sources of missing heritability and discuss the existing related knowledge in the context of T1D.
Keywords: gene–environment interactions, gene–gene interactions, missing heritability, rare variants, structural variants, type 1 diabetes
1. INTRODUCTION
Currently, type 1 diabetes (T1D) is defined as an autoimmune‐mediated multifactorial disorder with a strong genetic component. 1 Previous studies have identified more than 60 candidate loci for T1D. 2 , 3 Different candidate genes are involved in different stages of T1D. For instance, some alleles in HLA (human leukocyte antigen) and the PTPN22 (protein tyrosine phosphatase, non‐receptor type 22) rs247701 locus are associated with autoimmunity, while variants in CTLA‐4 (cytotoxic T lymphocyte‐associated protein 4), IFIH1 (interferon induced helicase C domain 1), SH2B3 (SH2B adaptor protein 3) and PTPN22 are related to the occurrence of multiple autoantibodies. 4 There are also considerable racial differences in T1D genetics. A recent study indicated that approximately one‐fifth of the susceptible loci reported in Caucasians were non‐polymorphic or had a comparatively low frequency in the Chinese population, which might explain the lower T1D incidence in China. 3
Before the advent of the genome‐wide association study (GWAS) era, only a few genetic loci were known to be associated with T1D. The HLA region was the first established risk locus for T1D and was identified by linkage studies. 5 For many years, linkage studies have been used for genetic mapping of Mendelian and biological traits with familial segregation, and this method has been proven to have high power to detect risk factors with large effect sizes or genetic diseases with a known mode of inheritance. However, from an evolutionary standpoint, risk variants with large effect sizes are prone to be rare in the population because of negative selection. Therefore, the power of linkage studies is comparatively restricted for complex diseases.
By contrast, association studies are more powerful for detecting common alleles with comparatively small effect sizes. 6 At first, association studies focused on candidate genes, and several genes, including INS (insulin), 7 CTLA‐4, 8 PTPN22 9 and IL2RA (interleukin 2 receptor α), 10 were identified to be associated with an increased risk of T1D. Clearly, the candidate gene approach investigates only the selected loci and ignores the rest of the regions.
The development of the GWAS has dramatically improved the pace and efficiency of identifying T1D loci. The GWAS approach represents tremendous improvements compared with candidate gene study, in which the variant assay is confined to few functionally related loci and the sample sizes are always smaller. A large number of additional T1D loci have been discovered by GWAS because this technology is able to test the variants in a hypothesis‐free context. 2 For instance, GWAS not only confirmed the previously discovered T1D loci but also uncovered some novel variants, such as those near the KIAA0350 gene 11 and at UBASH3A (ubiquitin‐associated and SH3 containing A). 12 These studies have provided valuable insights into the full elucidation of the genetic architecture of T1D.
The application of the GWAS approach is based on the ‘common disease, common variant’ theory, assuming that common diseases at least partially result from common variants. However, it has been indicated that most common variants contribute a comparatively small increase in the risk of disease and explain only a small portion of heritability for human biological traits or complex diseases. For instance, hundreds of independent variants have been identified to be associated with human height, an easy‐to‐measure biological trait with high heritability. 13 However, these loci explain only approximately less than 50% of the phenotypic variance. In addition, more than 700 loci with small effect sizes for type 2 diabetes (T2D) have been identified, explaining 20% of the total heritability. 14 In the context of T1D, the identified loci can explain approximately 80% of the heritability. 15 However, the high known heritability of T1D may be attributed to the two major candidate genes of T1D, HLA class II genes and the INS gene, which contribute approximately 50% and 10% risk to T1D genetic susceptibility, respectively. 16
2. THE HERITABILITY OF T1D
Heritability refers to the scale of the phenotypic variance in a population that is attributable to genetic effects and represents the extent to which a trait or disease is genetically determined. The total phenotypic variance (V P) can be divided into the genetic component (V G) and the environmental component (V E) in the traditional view, and the broad sense of heritability is then defined as the ratio V G/V P. The estimation of heritability is performed by analysing the empirical data of observed and expected phenotypic resemblance between relatives. 17 One classic design is to estimate the phenotypic resemblance between monozygotic (MZ) and dizygotic (DZ) twins. Of note, confounding may cause bias in the estimated heritability. For instance, the estimate of heritability will be biased upward if the resemblance partly results from common environmental effects.
Previous studies have indicated that genetic factors play an important role in T1D susceptibility. The mean prevalence of T1D in siblings is 6%, compared with 0.4% in the general population. In addition, the concordance rates for T1D are more than 50% in MZ twins and 6%‐10% in DZ twins after long‐term follow‐up, emphasizing the importance of genetic predisposition in T1D progression. T1D heritability is estimated as more than 50%. Notably, heritability is the genetic effect in a given environment (e.g. it would vary among different populations). For instance, the additive genetic contribution of T1D was estimated to be 72%‐88% for populations of European origin according to twin studies. 18 , 19 Another family study indicated that the heritability estimate of T1D was 66.5% in East Asian populations. 20 The discrepancy might be attributed to the different effects of environmental factors among various populations. Besides, heritability estimate is largely based on childhood‐onset T1D and, given that concordance rates decline with age at onset, so the heritability will decrease. 21 The heritability estimates from different traits or diseases depend strongly on their genetic architecture. For instance, the estimated heritability is more than 50% 13 for height and 30%‐70% for T2D. 22
3. THE MISSING HERITABILITY OF T1D
The majority of the heritability for T1D has been revealed. In fact, single nucleotide polymorphism (SNP)‐based heritability can explain 80%‐85% of the estimates of pedigree heritability. 23 However, approximately 20% of heritability remains to be further identified, and this discrepancy is always referred to as the missing heritability phenomenon. Given that individual differences in disease susceptibility are largely attributed to genetic factors, fully understanding the genetic component of T1D will contribute to improved prevention, diagnosis and treatment of this disease. Many explanations for the potential sources of missing heritability have been proposed, including large amounts of unmapped common variants with smaller effect sizes, rare and low‐frequency variants that are poorly detected by existing genotyping arrays, structural variants poorly captured by available arrays and limited power to detect gene–gene interactions and gene–environment interactions (e.g. epigenetic effects) (Figure 1). 24
FIGURE 1.
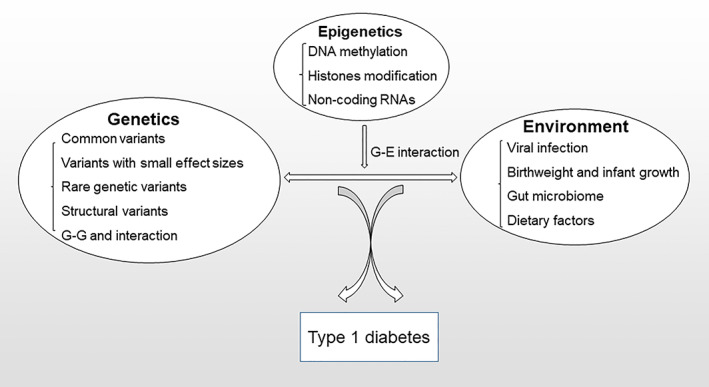
The potential sources of missing heritability of type 1 diabetes. G‐G interaction, gene–gene interaction; G‐E interaction, gene–environment interaction
3.1. Genetic variants with small effect sizes
The first theory is that the GWAS approach cannot capture variants with small effect sizes. A very stringent threshold value is used to reduce the occurrence of false positives when carrying out the significance tests. However, many real associations may be missed, especially if variants have small effect sizes but still contribute to phenotype variability and disease susceptibility. Therefore, heritability could be improved by incorporating genetic variants with small effect sizes. For instance, it has been indicated that 45% of the variance in human height can be explained by including all SNPs simultaneously, compared with 5% of phenotypic variance when considering only the SNPs that reach genome‐wide significance. 25 Several potential solutions have been proposed to solve this issue. For instance, a method was developed to assess the genomic heritability of quantitative traits when fitting all SNPs simultaneously by using a linear mixed model, and it has been indicated that a substantial proportion of variation in liability is tagged by common SNPs for Crohn's disease (CD), bipolar disorder and T1D. 26 Furthermore, user‐friendly software was developed to evaluate missing heritability by including all SNPs. 27 In addition, a new method, called phenotype correlation–genotype correlation (PCGC) regression, has been developed to estimate the contribution of common variants, and researchers found that PCGC regression improved the heritability explained by common variants substantially for some common diseases, such as T1D. 28 Additionally, this hypothesis is supported by the fact that more new genetic variants are detected with increasing sample sizes. For T1D, with increasing sample sizes, especially meta‐analyses of T1D GWASs, an increasing number of risk loci have been identified.
In fact, given that large numbers of low odds ratio variants associated with T1D have been identified, a polygenic risk score (PRS) that aggregates the effects of SNPs based on their estimated effect sizes has been developed to measure and quantify the heritable risk of diseases. 29 , 30 In contrast to GWAS with a very strict threshold value, the PRS can be constructed by including larger numbers of SNPs with more lenient signals. 31 In practice, the PRS can be used for T1D prediction. 32 , 33 For example, a study to predict the progression of islet autoimmunity and T1D in high‐risk children indicated that the PRS could serve as an independent predictor of disease development. 33 In addition, the PRS can aid in the discrimination between T1D and T2D. It is becoming increasingly difficult to distinguish T1D and T2D with the rising incidence of obesity. The Exeter group developed a T1D‐PRS, and this system plus autoantibodies showed highly discriminative ability for T1D and T2D. 34 It should be noted that cases were further selected by age at onset of diabetes in a given population so the effect may not apply to other populations when diagnosed at different ages. Interestingly, the PRS may also contribute to the detection of missing heritability. A recent GWAS on T1D patients with low genetic risk scores identified 41 unreported loci, including two loci with common variants and 39 loci with rare variants. 35 The new strategy highlights the importance of further grouping patients in the exploration for heritability because T1D itself is a heterogeneous and complex disease.
In addition, some researchers have suggested that genetic elements, such as the genome‐encoded T‐cell receptor (TCR), might be ignored for technical reasons. 36 The TCR is the cognate partner of major histocompatibility complex (MHC) molecules, and the TCR genotype has been implicated in autoimmune diseases such as multiple sclerosis. 37 T1D is a T‐cell–mediated autoimmune disease. Nevertheless, the associations between the TCR haplotype and T1D are understudied. It has been observed that genome‐encoded TCRs play an important role in T1D susceptibility in an MHC‐dependent fashion in non‐obese diabetic (NOD) mice and in multiple strains of rats that model T1D. 36 For example, rats expressing a high‐risk class II MHC haplotype and TCR‐Vβ13a simultaneously are highly susceptible to T1D. However, in the absence of TCR‐Vβ13a, rats with a high‐risk MHC manifest low penetrance of T1D. In addition, it has been indicated that the depletion of Vβ13+ T cells could prevent the development of T1D. 38 , 39 Therefore, germline variants within TCR regions may be viable candidates for T1D susceptibility and may explain the missing heritability. However, the exact role of TCR in human T1D needs further investigation.
3.2. Rare genetic variants
It has been suggested that rare genetic variants contribute to the missing heritability of common complex diseases. At present, there is considerable debate over the nature of genetic contributions to susceptibility to common diseases. In contrast to the traditional ‘common disease, common variant’ model, the ‘common disease, rare variant’ hypothesis argues that abundant rare genetic variants with comparatively high penetrance play a major role in the increased risk of common diseases. 40 The population genetics theory suggested that strongly deleterious variants were rapidly removed from the general population by negative selection, while mildly deleterious variants could remain present but at low frequencies. 41 , 42 Population genetics studies have shown that most genetic variants with large functional effect sizes are prone to be rare and private, except for a small proportion of variants with large effect sizes that were common among different populations. 43 , 44 Indeed, recent deep‐sequencing studies have shown that rare and low‐frequency genetic variants account for a surprisingly high proportion of the variants in different populations. 45 , 46 , 47 In fact, some researchers believe that both common variants (minor allele frequency [MAF] > 5%) with low penetrance (small effect size) and rare variants (MAF < 1%) with high penetrance (large effect size) contribute to common complex diseases in the whole population. 40
Rare genetic variants do not occur frequently enough to be captured by the GWAS approach, 48 and their effect sizes are not large enough to be detected by linkage analysis in family studies. Therefore, the identification of rare genetic variants is challenging for traditional sequencing technologies. However, the rapid development of next‐generation DNA sequencing tools has markedly enhanced the ability to detect rare variants. In addition, population biobanks have increased the power to detect disease associations because of the accessibility of massive population cohorts. For example, a recent study performed whole‐exome sequencing of the combined data from the UK Biobank and FinnGen to assess associations of multiple phenotypes with protein‐coding variants and identified abundant novel disease associations, most notably in rare and low‐frequency spectra. 49 It has been indicated that rare variants could explain a substantial proportion of the missing heritability for human physiological traits and disease susceptibility. For instance, researchers performed whole‐genome sequencing (WGS) in pulmonary arterial hypertension, and the proportion of cases explained by genetics increased to 23.5% from the previously established 19.9% by including identified rare variants. 50 In addition, recent research has implied that rare variants, especially those in regions of low linkage disequilibrium, are an important source of the missing heritability of height and body mass index. 13 However, some contradictory results were obtained. Studies on T2D and associated quantitative traits reflecting glycaemic control did not detect rare variants, 51 which is in agreement with previous findings where whole‐genome and whole‐exome sequencing did not identify any rare variants related to T2D in a large case‐control study. 52
Some studies have investigated the role of rare and low‐frequency genetic variants in the context of T1D. 23 Nejentsev et al. identified four rare variants by resequencing the exons and splice sites of 10 T1D candidate genes. 53 These four rare variants were located on IFIH1 and were predicted to lower the risk of T1D by altering the structure and expression. The identification of four rare variants within IFIH1 pinpoints causal genes in genetic regions previously discovered by GWAS. Ge et al. identified rare deleterious variants in PTPN22 by deeply sequencing protein‐coding genes located in 49 initially reported T1D risk loci among multiple‐affected sibships of European ancestry. 54 A major challenge in identifying rare variants is the limited resolution of traditional DNA sequencing technologies. WGS plus imputation can enhance the ability to detect rare variants. For instance, Forgetta et al. identified 27 independent variants, among which three were novel with a MAF less than 5%, by undertaking deep imputation of genotyped data followed by GWAS testing. 55 This finding indicates that the identification of rare variants also leads to the discovery of T1D risk genes. In addition, a recently developed deep learning method for HLA imputation improves the accuracy of the identification of low‐frequency and rare variants within MHC regions, which harbour extremely complex sequence variations and haplotypes. 56 In conclusion, rare variants explain at least a proportion of the missing heritability of T1D. In addition, given that rare variants tend to be population specific and that existing studies focus on European people, future studies should pay more attention to other ethnic populations.
3.3. Structural variants
Structural variants (SVs), especially copy number variants (CNVs), have been proposed as a potential source of missing heritability in complex diseases because previous association studies ignored them because of the insufficient coverage of SNP genotyping arrays. In fact, SVs, and CNVs in particular, encompass more nucleotides in the genome than SNPs and represent an important form of variation. The mutation rate to generate new CNVs is 100 to 1000 times the rate of DNA base‐pair changes, and these variations have a substantial effect on phenotypic variance. 57 Therefore, it is plausible that SVs are important contributors to human diversity and disease susceptibility. SVs refer to long‐length sequence or position changes in the genome, such as insertions, deletions, inversions, microsatellites and CNVs. The alterations of SVs predominantly reside in non‐coding regions and do not directly lead to changes in protein composition. 58 However, it has been indicated that SVs can modulate gene expression by affecting regulatory elements. 59 In the context of T1D, a variable number of tandem repeats (VNTRs) 596 bp upstream of the translational start site of the INS gene was found to be associated with T1D. 60 VNTRs can influence the negative selection of insulin‐specific autoimmune T lymphocytes in the thymus, thus affecting immune tolerance by regulating insulin mRNA transcription. 16
Some studies have been performed to evaluate the contributions of SVs to complex traits and disease susceptibility. 61 , 62 , 63 CNVs, which are larger than 1 kb in genomic regions and manifest as a variable number of copies in the population, 64 have gained attention as detection methods have improved. 61 , 65 In 2010, the Welcome Trust Case Control Consortium performed a large GWAS to assess the association between CNVs and eight common diseases, including T1D, among 16 000 cases and 3000 shared controls by using a purpose‐designed array. The results indicated that the majority of common CNVs were strongly correlated with SNPs genotyped by the HapMap project, and the authors concluded it was improbable that common CNVs accounted for much of the heritability of complex diseases. 66 However, the contributions of CNVs might be underevaluated because of ignorance of allele dosage when analysing SNP‐chip data. 67 , 68 Another study explored the association between CNVs that were in low linkage disequilibrium with SNPs and T1D by using a custom comparative genomic hybridization array specifically designed to array untagged CNV loci, and did not identify novel T1D associations. 69 Therefore, it is improbable that untagged CNVs contribute substantially to T1D heritability. Although common CNVs might fail to explain the missing heritability of T1D, a study suggested that rare CNVs could increase the burden of susceptibility to T1D. 70 Future association studies of rare CNVs in large datasets could enable the identification of specific regions, thus providing insights into T1D pathogenesis.
There are still some challenges for SV studies. For instance, given the variable nature and repeat structure, many SVs remain poorly characterized by existing sequencing platforms. 71 , 72 In addition, previous studies mostly focus on genomic elements that are large, and small variable regions remain under investigation. 72 , 73
3.4. Gene–gene interactions
Another theory to explain the missing heritability is the presence of gene–gene interactions, also called epistasis. 74 The term ‘epistasis’ was first used to describe a masking effect of one variant by another variant at a separate locus. This concept has been developed into any statistical departure from the simple additive combination of two loci on a specific outcome scale. 75 In a genetic association study, if the effect of one variant is altered or masked by another variant at a different locus, the power to elucidate the initial variant is probably reduced, and the detection of the combined effects of two variants will be impeded by their interaction. 76 Furthermore, the situation will become more complicated if more than two loci are involved. 76 Notably, epistasis refers to statistical interactions instead of biological and mechanical interactions where direct physical or chemical reactions take place between different factors. 77 Although the value of the identification of epistasis cannot lead to the elucidation of the underlying pathogenic mechanisms of complex diseases, it will improve power for the detection of genetic effects behind the phenotypes. 76 For instance, in the analysis of real data for T1D, improved evidence for linkage at a single locus was present when considering the interaction with another locus. 78 , 79
It has been increasingly recognized that genetic interactions might account for a substantial proportion of the missing heritability. For instance, approximately 140 candidate loci of CD can explain approximately 14% of the heritability of the disease. 80 Inspiringly, it can explain almost 80% of the missing heritability when taking into account genetic interactions. 74 The estimation of heritability is based on the premise that there are no interactions among the disease‐causing variants. Therefore, the missing heritability may not only result from the yet‐to‐be identified variants but also from the ignored genetic interactions. 81 However, other research has also suggested that the additive effects of genetic factors could explain a large proportion of continuous traits, while epistatic effects play only a comparatively small role. 82 This phenomenon might be caused by most genetic factors contributing to the quantitative traits collectively, and each factor plays only a small role, making the effect additive. In complex diseases, there are always a small number of major loci that can interact with each other through epistasis, thus explaining the missing heritability. 83
Some studies have investigated gene–gene interactions in T1D. However, the results of genetic interaction of T1D‐associated loci sometimes conflict. For example, Bergholdt et al. reported a statistical interaction between two genes, CBLB (casitas‐B‐lineage lymphoma b) and CTLA‐4, both of which are involved in T‐cell activation in T1D, and found that the rs3772534 G allele of CBLB was overtransmitted to offspring with the G/G genotype of rs3087243 in CTLA‐4. 84 However, in a later study with a larger collection, there was no support for the interaction between rs3772534 and rs3087243. 85 Similarly, contradictory results have been obtained concerning the interaction between IL4R, IL4 and IL13. 86 , 87 Given the inadequate sample sizes, the positive reports are probably false because the false‐discovery rate would be high in underpowered studies. Other research has indicate the interaction of different HLA class II haplotypes in T1D and found that these interactions explain moderate but significant fractions of phenotypic variance. 88 , 89 , 90 In addition, evidence of a statistical interaction between HLA class II and PTPN22 as well as CTLA‐4 has been shown in some sufficiently well‐powered studies. 91 , 92 , 93 In conclusion, existing results indicated that gene–gene interactions could explain a fraction of missing heritability in T1D. Future studies need large sample sizes to enhance the power to detect more genetic interactions in T1D.
3.5. Gene–environment interactions
Gene–environment interactions have also been suggested as a possible explanation for the missing heritability of complex diseases (Figure 1). 94 , 95 Although genetic factors represent the major determinant of T1D risk, genetics alone cannot explain the dramatic changes in the T1D epidemic. The incidence of T1D has increased considerably over the past 30 years. 96 This rising trend can only be explained by changes in environmental factors because genetics remain almost stagnant over such a short time. Furthermore, the increasing incidence of T1D accompanied by a lower percentage of high‐risk genotypes of HLA emphasizes an amplification of environmental pressure. 97 In addition, it has been indicated that the age of onset is associated with distinct clinical profiles of T1D. 98 An immigrant study also indicated that the second generation of immigrants to Sweden, a country with a high prevalence of T1D, shows an increased risk of developing T1D. 99 These studies have shown that environmental factors play an important role in T1D. In fact, it is often hypothesized that genetic factors determine the predisposition for developing T1D, while environmental factors provide the trigger for the onset of disease (Figure 2). 100 Therefore, a better understanding of the environmental determinants of T1D not only contributes to revealing the underlying pathogenic mechanisms, but also provides novel targets to prevent or delay the disease.
FIGURE 2.
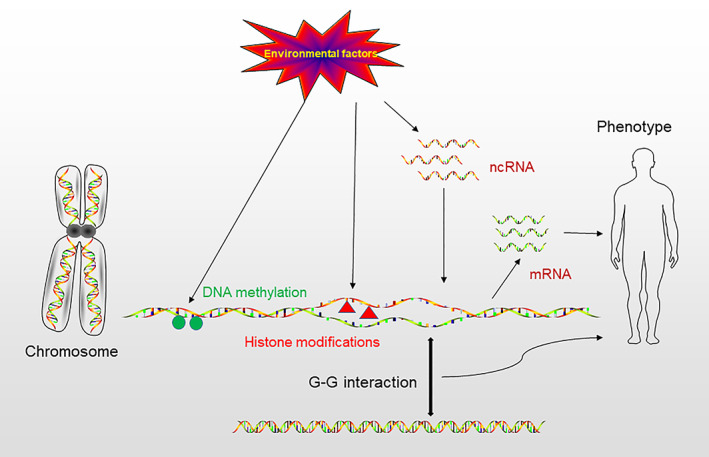
The pathogenesis of type 1 diabetes (T1D). Both genetic and environmental factors contribute to the onset and development of T1D. Epigenetics serves as a bridge between these two factors. G‐G interaction, gene–gene interaction
The involvement of both genetic and environmental factors in T1D is well established. However, most research has focused on identifying these factors in isolation. It has been indicated that inclusion of gene–environment interactions can improve the statistical power to identify gene‐disease associations. 101 , 102 In addition, for observational studies aiming to elucidate adverse environmental factors, which are not applicable to randomized controlled trials, demonstration of the expected gene–environment interactions can provide evidence to further validate a causal inference. 94 Furthermore, identifying gene–environment interactions will lead to an improved understanding of biological interactions at the molecular level. There are two categories of evidence for gene–environment interactions in various complex diseases. 103 The direct evidence is a statistical evaluation of gene–environment interactions. For instance, both the NOD2 gene and cigarette smoking are well‐characterized risk factors for the pathogenesis of CD. A case‐only study investigated their relationship and found a significant negative interaction. 104 However, this finding needs to be confirmed in epidemiological studies, and the potential mechanisms warrant further investigation. In addition to direct evidence, there is more indirect evidence for gene–environment interactions. An apparent example is the epigenetics in disease risk. Epigenetics, which mainly includes DNA methylation, histone modification and non‐coding RNA, is defined as heritable changes in gene expression and thus cell function, but without alteration of DNA sequences. 105 Epigenetics, which is malleable, can be impacted by environmental exposures and is considered a bridge between heritable and environmental factors (Figure 2). 106 For instance, it has been shown that smoking could alter DNA methylation at various loci. 107 In addition, a recent study indicated that the human microbiome could influence important traits by interacting with human genotypes. 108 , 109 However, the epigenetic contribution would be systematically missed by conventional GWAS because epigenetic modifications do not alter genomic sequences. Therefore, a new model of epigenetic inheritance, as a supplement to Mendelian heredity, may explain the missing heritability caused by the lack of detection in DNA sequence‐based analysis. 95 In addition, epigenome‐wide association studies (EWASs) provide an efficient approach to systematically assess epigenetic variation related to traits or complex diseases. Furthermore, it has been indicated that the missing heritability might be associated with stochastic effects that were involved in unstable genomes and environmental triggers rather than the mutations in particular sets of genes. 110 Genetically identical organisms in the same controlled environment exhibit distinct phenotypes and this phenomenon may be attributed to stochastic variations. 111
Gene–environment interactions are associated with the onset and development of T1D. A case‐only study observed differences in birth month distributions among individuals carrying various HLA‐DQ genotypes. 112 Different birth seasons are associated with different rates of viral infections and different levels of vitamin D. 113 Therefore, this study showed the influence of environmental factors on T1D risk attributed to HLA alleles. Furthermore, an EWAS identified 132 differentially methylated loci for T1D in monocytes among 15 pairs of MZ twins. 114 Later, the same group performed an EWAS across 406 365 CpGs in 52 MZ twins discordant for T1D and identified a substantial enrichment of differentially variable CpG positions in patients with T1D compared with their healthy co‐twins and unrelated healthy individuals. 115 In addition, it has been indicated that T1D risk variants could alter susceptibility to viral infections, thus affecting autoimmune responses. 116 For instance, an in vitro study indicated that the T1D risk allele HLA‐DR4 was involved in the hyper‐responsiveness of T cells to Coxsackie B4 virus (CBV4) antigens, and multiple lines of evidence have suggested that CBV4 is associated with the onset of T1D. 117 Therefore, it is plausible that the interactions of infection with genes contribute to T1D risk and account for some missing heritability. In conclusion, existing studies have indicated that gene–environment interactions contribute to the pathogenesis of T1D and might partially explain the lack of heritability. However, large‐scale gene–environment interaction research encounters significant practical and methodological challenges. For example, the unified measurement of environmental exposures is difficult to achieve in different studies.
4. DISCUSSION
Identifying the genes that confer susceptibility to common diseases is a major challenge for genetic epidemiology. However, over the past several years, technological progress, especially the development of the GWAS, has allowed further characterization of the genetic components of common diseases. Based on the obtained GWAS data, the heritability explained by SNPs is lower than the estimated heritability using traditional epidemiological measures. This is the so‐called missing heritability phenomenon. Several hypotheses have been put forward to explicate the ‘dark matter’ of genomics, which mainly includes the variants remaining to be found and gene–gene or gene–environment interactions. Previous GWASs have identified more than 60 loci associated with T1D, which explain 80%‐85% of the heritability. However, complex diseases, including T1D, result from multiple genetic and environmental factors that interact through extremely complex networks. The objective of heritability measures is to quantify the phenotypic variability explained by genetics and the environment. It is difficult to make this distinction. These interactions should also be considered when exploring disease pathogenesis. These theories have achieved improved heritability to a certain degree in some cases. However, given that this research area is still in its infancy, further efforts are warranted to overcome numerous theoretical and practical obstacles.
Although the development of high‐throughput sequencing technologies has enabled the identification of numerous genetic variants or loci related to complex diseases, GWAS alone has provided limited insights into the exact molecular mechanisms of disease development, mainly because the overwhelming majority of these polygenic determinants are located in non‐coding portions of the genome, and the functional sequences remain to be further confirmed. Thus, in the post‐GWAS era, functional annotation and mechanistic ascertainment of these loci are the next major task. In addition, some new analytical strategies in the post‐GWAS era may contribute to the elucidation of the missing heritability phenomenon. For example, previous studies mostly focused on the genome but ignored other types of data derived from the transcriptome or epigenome, which caused missing links between genetic variation and phenotype. Alternative splicing (AS), which allows a single gene to generate multiple RNA and protein isoforms, can influence gene expression via a post‐transcriptional regulatory mechanism. Transcriptome analysis indicated that AS changes might contribute to the development of T1D. 118 Integrative multiomics analysis may represent a novel approach to further understand disease pathogenesis. For instance, a recent study combined two approaches, large‐scale GWAS and single‐cell epigenomics, to translate T1D risk variants into mechanistic insights, and the results suggested that risk variants within multiple T1D signals overlapped with exocrine‐specific cis‐regulatory elements in the pancreas, supporting that the exocrine pancreas might play a role in the pathogenesis of T1D. 119
There is tremendous diversity in genetic architecture among different diseases or biological traits. For instance, infectious diseases are always associated with variants with large effects, 120 , 121 while some complex phenotypes, such as cell counts of red blood cells, height and levels of low‐density lipoproteins, often result from the joint action of multiple loci with small effects. 122 In the context of diabetes, different genetic architectures were also presented because T1D was largely determined by the HLA region, while T2D was dependent upon the combined effect of many susceptible variants with small effect sizes. Epistasis also plays an unequal role in different circumstances. For instance, pervasive epistatic effects have been reported in autoimmune conditions, 123 but the small addictive effects of genetic factors play a more important role in continuous traits. Therefore, different strategies should be considered when exploring missing heritability.
The relevant research concerning the missing heritability of T1D is summarized above. However, other factors might also contribute to the missing heritability of T1D. For instance, parent‐of‐origin effects, which refer to the phenotypic effect of an allele depending on which parent the allele is inherited from, have been documented in multiple diseases, including T1D. 124 Their contribution to heritability might be overlooked because they were difficult to discover. In addition, most GWASs have been performed based on additive allelic models. However, the potential candidate genes could be missed because of recessive effects. A recent GWAS meta‐analysis using a recessive model identified 51 loci associated with T2D, including five novel variants unreported by previous additive analysis. 125 Therefore, recessive modelling may provide another way to detect new genetic associations.
The known heritability of T1D is higher than that of other common complex diseases. Nevertheless, fully understanding the genetics of T1D can further elucidate its underlying pathogenesis and better predict or prevent the disease. It has been suggested that once individuals with T1D become symptomatic, the beta cell mass has already reached 20%‐30% of the normal amount, 126 representing the very late phase of the disease. Therefore, early recognition of individuals at high risk for T1D would offer an opportunity to prevent or even reverse T1D progression. Among the risk factors for T1D, genetics has been considered to be of importance for the time‐independent characteristic. Therefore, genetic screening of children could distinguish individuals at high risk of T1D to some extent and be beneficial for the development of primary prevention. In addition, there is an asymptomatic phase characterized by the presence of islet autoantibodies before the clinical manifestation of diabetes. Screening for autoantibodies also represents an effective way to predict autoimmune progression. Thus, the use of genetic screening in combination with autoantibody screening for children would improve the effectiveness of identifying populations at high risk of T1D. Furthermore, because T1D exhibits great heterogeneity among different patients, finding the causes of the missing heritability in T1D is beneficial for the development of individualized medicine.
AUTHORS CONTRIBUTIONS
H.P. searched references, wrote the first draft of the paper and revised the text. J.L., S.L., G.H. and X.L. critically revised the text and provided substantial scientific contributions. Z.X. and Z.Z. proposed the project and revised the manuscript. All the authors approved the final version of the manuscript.
CONFLICT OF INTEREST
The authors declare that they have no known competing financial interests or personal relationships that could have appeared to influence the work reported in this article.
PEER REVIEW
The peer review history for this article is available at https://publons.com/publon/10.1111/dom.14777.
Pang H, Lin J, Luo S, et al. The missing heritability in type 1 diabetes. Diabetes Obes Metab. 2022;24(10):1901‐1911. doi: 10.1111/dom.14777
Funding information This work was supported by the National Key R&D Program of China (grant number 2018YFE0114500), the National Natural Science Foundation of China (grant numbers 81873634 and 82070813), and Hunan Province Natural Science Foundation of China (Grant numbers 2018JJ2573 and 2020JJ2053).
DATA AVAILABILITY STATEMENT
Data sharing not applicable to this article as no datasets were generated or analysed during the current study
REFERENCES
- 1. Pang H, Luo S, Huang G, et al. Advances in knowledge of candidate genes acting at the Beta‐cell level in the pathogenesis of T1DM. Front Endocrinol. 2020;11:119. [DOI] [PMC free article] [PubMed] [Google Scholar]
- 2. Bakay M, Pandey R, Grant SFA, et al. The genetic contribution to type 1 diabetes. Curr Diab Rep. 2019;19:116. [DOI] [PubMed] [Google Scholar]
- 3. Zhu M, Xu K, Chen Y, et al. Identification of novel T1D risk loci and their association with age and islet function at diagnosis in autoantibody‐positive T1D individuals: based on a two‐stage genome‐wide association study. Diabetes Care. 2019;42:1414‐1421. [DOI] [PubMed] [Google Scholar]
- 4. Rich SS, Concannon P. Summary of the type 1 diabetes genetics consortium autoantibody workshop. Diabetes Care. 2015;38(Suppl 2):S45‐S48. [DOI] [PMC free article] [PubMed] [Google Scholar]
- 5. Cudworth AG, Woodrow JC. Evidence for HL‐A‐linked genes in “juvenile” diabetes mellitus. Br Med J. 1975;3:133‐135. [DOI] [PMC free article] [PubMed] [Google Scholar]
- 6. Ott J, Wang J, Leal SM. Genetic linkage analysis in the age of whole‐genome sequencing. Nat Rev Genet. 2015;16:275‐284. [DOI] [PMC free article] [PubMed] [Google Scholar]
- 7. Bell GI, Horita S, Karam JH. A polymorphic locus near the human insulin gene is associated with insulin‐dependent diabetes mellitus. Diabetes. 1984;33:176‐183. [DOI] [PubMed] [Google Scholar]
- 8. Nisticò L , Buzzetti R, Pritchard LE, et al. The CTLA‐4 gene region of chromosome 2q33 is linked to, and associated with, type 1 diabetes. Belgian Diabetes Registry. Hum Mol Genet. 1996;5:1075‐1080. [DOI] [PubMed] [Google Scholar]
- 9. Bottini N, Musumeci L, Alonso A, et al. A functional variant of lymphoid tyrosine phosphatase is associated with type I diabetes. Nat Genet. 2004;36:337‐338. [DOI] [PubMed] [Google Scholar]
- 10. Vella A, Cooper JD, Lowe CE, et al. Localization of a type 1 diabetes locus in the IL2RA/CD25 region by use of tag single‐nucleotide polymorphisms. Am J Hum Genet. 2005;76:773‐779. [DOI] [PMC free article] [PubMed] [Google Scholar]
- 11. Hakonarson H, Grant SF, Bradfield JP, et al. A genome‐wide association study identifies KIAA0350 as a type 1 diabetes gene. Nature. 2007;448:591‐594. [DOI] [PubMed] [Google Scholar]
- 12. Concannon P, Onengut‐Gumuscu S, Todd JA, et al. A human type 1 diabetes susceptibility locus maps to chromosome 21q22.3. Diabetes. 2008;57:2858‐2861. [DOI] [PMC free article] [PubMed] [Google Scholar]
- 13. Wainschtein P, Jain D, Zheng Z, et al. Assessing the contribution of rare variants to complex trait heritability from whole‐genome sequence data. Nat Genet. 2022;54:263‐273. [DOI] [PMC free article] [PubMed] [Google Scholar]
- 14. Vujkovic M, Keaton JM, Lynch JA, et al. Discovery of 318 new risk loci for type 2 diabetes and related vascular outcomes among 1.4 million participants in a multi‐ancestry meta‐analysis. Nat Genet. 2020;52:680‐691. [DOI] [PMC free article] [PubMed] [Google Scholar]
- 15. Storling J, Pociot F. Type 1 diabetes candidate genes linked to pancreatic islet cell inflammation and beta‐cell apoptosis. Genes. 2017;8:72. [DOI] [PMC free article] [PubMed] [Google Scholar]
- 16. Xie Z, Chang C, Zhou Z. Molecular mechanisms in autoimmune type 1 diabetes: a critical review. Clin Rev Allergy Immunol. 2014;47:174‐192. [DOI] [PubMed] [Google Scholar]
- 17. Tenesa A, Haley CS. The heritability of human disease: estimation, uses and abuses. Nat Rev Genet. 2013;14:139‐149. [DOI] [PubMed] [Google Scholar]
- 18. Hyttinen V, Kaprio J, Kinnunen L, et al. Genetic liability of type 1 diabetes and the onset age among 22,650 young Finnish twin pairs: a nationwide follow‐up study. Diabetes. 2003;52:1052‐1055. [DOI] [PubMed] [Google Scholar]
- 19. Kyvik KO, Green A, Beck‐Nielsen H. Concordance rates of insulin dependent diabetes mellitus: a population based study of young Danish twins. BMJ. 1995;311:913‐917. [DOI] [PMC free article] [PubMed] [Google Scholar]
- 20. Kuo CF, Chou IJ, Grainge MJ, et al. Familial aggregation and heritability of type 1 diabetes mellitus and coaggregation of chronic diseases in affected families. Clin Epidemiol. 2018;10:1447‐1455. [DOI] [PMC free article] [PubMed] [Google Scholar]
- 21. Redondo MJ, Yu L, Hawa M, et al. Heterogeneity of type I diabetes: analysis of monozygotic twins in Great Britain and the United States. Diabetologia. 2001;44:354‐362. [DOI] [PubMed] [Google Scholar]
- 22. Almgren P, Lehtovirta M, Isomaa B, et al. Heritability and familiality of type 2 diabetes and related quantitative traits in the Botnia study. Diabetologia. 2011;54:2811‐2819. [DOI] [PubMed] [Google Scholar]
- 23. Pang H, Xia Y, Luo S, et al. Emerging roles of rare and low‐frequency genetic variants in type 1 diabetes mellitus. J Med Genet. 2021;58:289‐296. [DOI] [PMC free article] [PubMed] [Google Scholar]
- 24. Manolio TA, Collins FS, Cox NJ, et al. Finding the missing heritability of complex diseases. Nature. 2009;461:747‐753. [DOI] [PMC free article] [PubMed] [Google Scholar]
- 25. Yang J, Benyamin B, McEvoy BP, et al. Common SNPs explain a large proportion of the heritability for human height. Nat Genet. 2010;42:565‐569. [DOI] [PMC free article] [PubMed] [Google Scholar]
- 26. Lee SH, Wray NR, Goddard ME, et al. Estimating missing heritability for disease from genome‐wide association studies. Am J Hum Genet. 2011;88:294‐305. [DOI] [PMC free article] [PubMed] [Google Scholar]
- 27. Yang J, Lee SH, Goddard ME, et al. GCTA: a tool for genome‐wide complex trait analysis. Am J Hum Genet. 2011;88:76‐82. [DOI] [PMC free article] [PubMed] [Google Scholar]
- 28. Golan D, Lander ES, Rosset S. Measuring missing heritability: inferring the contribution of common variants. Proc Natl Acad Sci U S A. 2014;111:E5272‐E5281. [DOI] [PMC free article] [PubMed] [Google Scholar]
- 29. Onengut‐Gumuscu S, Chen WM, Robertson CC, et al. Type 1 diabetes risk in African‐ancestry participants and utility of an ancestry‐specific genetic risk score. Diabetes Care. 2019;42:406‐415. [DOI] [PMC free article] [PubMed] [Google Scholar]
- 30. Qu J, Qu HQ, Bradfield JP, et al. Insights into non‐autoimmune type 1 diabetes with 13 novel loci in low polygenic risk score patients. Sci Rep. 2021;11:16013. [DOI] [PMC free article] [PubMed] [Google Scholar]
- 31. Lambert SA, Abraham G, Inouye M. Towards clinical utility of polygenic risk scores. Hum Mol Genet. 2019;28:R133‐R142. [DOI] [PubMed] [Google Scholar]
- 32. Perry DJ, Wasserfall CH, Oram RA, et al. Application of a genetic risk score to racially diverse type 1 diabetes populations demonstrates the need for diversity in risk‐modeling. Sci Rep. 2018;8:4529. [DOI] [PMC free article] [PubMed] [Google Scholar]
- 33. Redondo MJ, Geyer S, Steck AK, et al. A type 1 diabetes genetic risk score predicts progression of islet autoimmunity and development of type 1 diabetes in individuals at risk. Diabetes Care. 2018;41:1887‐1894. [DOI] [PMC free article] [PubMed] [Google Scholar]
- 34. Oram RA, Patel K, Hill A, et al. A type 1 diabetes genetic risk score can aid discrimination between type 1 and type 2 diabetes in young adults. Diabetes Care. 2016;39:337‐344. [DOI] [PMC free article] [PubMed] [Google Scholar]
- 35. Qu HQ, Qu J, Bradfield J, et al. Genetic architecture of type 1 diabetes with low genetic risk score informed by 41 unreported loci. Commun Biol. 2021;4:908. [DOI] [PMC free article] [PubMed] [Google Scholar]
- 36. Pierce BG, Eberwine R, Noble JA, et al. The missing heritability in T1D and potential new targets for prevention. J Diabetes Res. 2013;2013:737485. [DOI] [PMC free article] [PubMed] [Google Scholar]
- 37. Watson CT, Para AE, Lincoln MR, et al. Revisiting the T‐cell receptor alpha/delta locus and possible associations with multiple sclerosis. Genes Immun. 2011;12:59‐66. [DOI] [PubMed] [Google Scholar]
- 38. Liu Z, Cort L, Eberwine R, et al. Prevention of type 1 diabetes in the rat with an allele‐specific anti‐T‐cell receptor antibody: Vbeta13 as a therapeutic target and biomarker. Diabetes. 2012;61:1160‐1168. [DOI] [PMC free article] [PubMed] [Google Scholar]
- 39. Tirabassi RS, Guberski DL, Blankenhorn EP, et al. Infection with viruses from several families triggers autoimmune diabetes in LEW*1WR1 rats: prevention of diabetes by maternal immunization. Diabetes. 2010;59:110‐118. [DOI] [PMC free article] [PubMed] [Google Scholar]
- 40. Schork NJ, Murray SS, Frazer KA, et al. Common vs. rare allele hypotheses for complex diseases. Curr Opin Genet Dev. 2009;19:212‐219. [DOI] [PMC free article] [PubMed] [Google Scholar]
- 41. Quintana‐Murci L. Understanding rare and common diseases in the context of human evolution. Genome Biol. 2016;17:225. [DOI] [PMC free article] [PubMed] [Google Scholar]
- 42. Simcikova D, Heneberg P. Refinement of evolutionary medicine predictions based on clinical evidence for the manifestations of Mendelian diseases. Sci Rep. 2019;9:18577. [DOI] [PMC free article] [PubMed] [Google Scholar]
- 43. Marth GT, Yu F, Indap AR, et al. The functional spectrum of low‐frequency coding variation. Genome Biol. 2011;12:R84. [DOI] [PMC free article] [PubMed] [Google Scholar]
- 44. Peischl S, Dupanloup I, Kirkpatrick M, et al. On the accumulation of deleterious mutations during range expansions. Mol Ecol. 2013;22:5972‐5982. [DOI] [PubMed] [Google Scholar]
- 45. Coventry A, Bull‐Otterson LM, Liu X, et al. Deep resequencing reveals excess rare recent variants consistent with explosive population growth. Nat Commun. 2010;1:131. [DOI] [PMC free article] [PubMed] [Google Scholar]
- 46. Keinan A, Clark AG. Recent explosive human population growth has resulted in an excess of rare genetic variants. Science. 2012;336:740‐743. [DOI] [PMC free article] [PubMed] [Google Scholar]
- 47. Lek M, Karczewski KJ, Minikel EV, et al. Analysis of protein‐coding genetic variation in 60,706 humans. Nature. 2016;536:285‐291. [DOI] [PMC free article] [PubMed] [Google Scholar]
- 48. McCarthy MI, Hirschhorn JN. Genome‐wide association studies: potential next steps on a genetic journey. Hum Mol Genet. 2008;17:R156‐R165. [DOI] [PMC free article] [PubMed] [Google Scholar]
- 49. Sun BB, Kurki MI, Foley CN, et al. Genetic associations of protein‐coding variants in human disease. Nature. 2022;603:95‐102. [DOI] [PMC free article] [PubMed] [Google Scholar]
- 50. Graf S, Haimel M, Bleda M, et al. Identification of rare sequence variation underlying heritable pulmonary arterial hypertension. Nat Commun. 2018;9:1416. [DOI] [PMC free article] [PubMed] [Google Scholar]
- 51. Jun G, Manning A, Almeida M, et al. Evaluating the contribution of rare variants to type 2 diabetes and related traits using pedigrees. Proc Natl Acad Sci U S A. 2018;115:379‐384. [DOI] [PMC free article] [PubMed] [Google Scholar]
- 52. Fuchsberger C, Flannick J, Teslovich TM, et al. The genetic architecture of type 2 diabetes. Nature. 2016;536:41‐47. [DOI] [PMC free article] [PubMed] [Google Scholar]
- 53. Nejentsev S, Walker N, Riches D, et al. Rare variants of IFIH1, a gene implicated in antiviral responses, protect against type 1 diabetes. Science. 2009;324:387‐389. [DOI] [PMC free article] [PubMed] [Google Scholar]
- 54. Ge Y, Onengut‐Gumuscu S, Quinlan AR, et al. Targeted deep sequencing in multiple‐affected sibships of European ancestry identifies rare deleterious variants in PTPN22 that confer risk for type 1 diabetes. Diabetes. 2016;65:794‐802. [DOI] [PMC free article] [PubMed] [Google Scholar]
- 55. Forgetta V, Manousaki D, Istomine R, et al. Rare genetic variants of large effect influence risk of type 1 diabetes. Diabetes. 2020;69:784‐795. [DOI] [PMC free article] [PubMed] [Google Scholar]
- 56. Naito T, Suzuki K, Hirata J, et al. A deep learning method for HLA imputation and trans‐ethnic MHC fine‐mapping of type 1 diabetes. Nat Commun. 2021;12:1639. [DOI] [PMC free article] [PubMed] [Google Scholar]
- 57. Zhang F, Gu W, Hurles ME, et al. Copy number variation in human health, disease, and evolution. Annu Rev Genomics Hum Genet. 2009;10:451‐481. [DOI] [PMC free article] [PubMed] [Google Scholar]
- 58. Roses AD, Akkari PA, Chiba‐Falek O, et al. Structural variants can be more informative for disease diagnostics, prognostics and translation than current SNP mapping and exon sequencing. Expert Opin Drug Metab Toxicol. 2016;12:135‐147. [DOI] [PubMed] [Google Scholar]
- 59. Chiang C, Scott AJ, Davis JR, et al. The impact of structural variation on human gene expression. Nat Genet. 2017;49:692‐699. [DOI] [PMC free article] [PubMed] [Google Scholar]
- 60. Bennett ST, Lucassen AM, Gough SC, et al. Susceptibility to human type 1 diabetes at IDDM2 is determined by tandem repeat variation at the insulin gene minisatellite locus. Nat Genet. 1995;9:284‐292. [DOI] [PubMed] [Google Scholar]
- 61. McCarroll SA. Extending genome‐wide association studies to copy‐number variation. Hum Mol Genet. 2008;17:R135‐R142. [DOI] [PubMed] [Google Scholar]
- 62. Qiang W, Yau WM, Lu JX, et al. Structural variation in amyloid‐beta fibrils from Alzheimer's disease clinical subtypes. Nature. 2017;541:217‐221. [DOI] [PMC free article] [PubMed] [Google Scholar]
- 63. Zhang Y, Haraksingh R, Grubert F, et al. Child development and structural variation in the human genome. Child Dev. 2013;84:34‐48. [DOI] [PubMed] [Google Scholar]
- 64. Feuk L, Carson AR, Scherer SW. Structural variation in the human genome. Nat Rev Genet. 2006;7:85‐97. [DOI] [PubMed] [Google Scholar]
- 65. Scherer SW, Lee C, Birney E, et al. Challenges and standards in integrating surveys of structural variation. Nat Genet. 2007;39:S7‐S15. [DOI] [PMC free article] [PubMed] [Google Scholar]
- 66. Wellcome Trust Case Control Consortium , Craddock N, Hurles ME, et al. Genome‐wide association study of CNVs in 16,000 cases of eight common diseases and 3,000 shared controls. Nature. 2010;464:713‐720. [DOI] [PMC free article] [PubMed] [Google Scholar]
- 67. Gamazon ER, Cox NJ, Davis LK. Structural architecture of SNP effects on complex traits. Am J Hum Genet. 2014;95:477‐489. [DOI] [PMC free article] [PubMed] [Google Scholar]
- 68. Marenne G, Chanock SJ, Malats N, et al. Advantage of using allele‐specific copy numbers when testing for association in regions with common copy number variants. PLoS One. 2013;8:e75350. [DOI] [PMC free article] [PubMed] [Google Scholar]
- 69. Zanda M, Onengut‐Gumuscu S, Walker N, et al. A genome‐wide assessment of the role of untagged copy number variants in type 1 diabetes. PLoS Genet. 2014;10:e1004367. [DOI] [PMC free article] [PubMed] [Google Scholar]
- 70. Cooper NJ, Shtir CJ, Smyth DJ, et al. Detection and correction of artefacts in estimation of rare copy number variants and analysis of rare deletions in type 1 diabetes. Hum Mol Genet. 2015;24:1774‐1790. [DOI] [PMC free article] [PubMed] [Google Scholar]
- 71. Cameron DL, Di Stefano L, Papenfuss AT. Comprehensive evaluation and characterisation of short read general‐purpose structural variant calling software. Nat Commun. 2019;10:3240. [DOI] [PMC free article] [PubMed] [Google Scholar]
- 72. Ebbert MTW, Jensen TD, Jansen‐West K, et al. Systematic analysis of dark and camouflaged genes reveals disease‐relevant genes hiding in plain sight. Genome Biol. 2019;20:97. [DOI] [PMC free article] [PubMed] [Google Scholar]
- 73. Chaisson MJP, Sanders AD, Zhao X, et al. Multi‐platform discovery of haplotype‐resolved structural variation in human genomes. Nat Commun. 2019;10:1784. [DOI] [PMC free article] [PubMed] [Google Scholar]
- 74. Zuk O, Hechter E, Sunyaev SR, et al. The mystery of missing heritability: genetic interactions create phantom heritability. Proc Natl Acad Sci U S A. 2012;109:1193‐1198. [DOI] [PMC free article] [PubMed] [Google Scholar]
- 75. Lehner B. Molecular mechanisms of epistasis within and between genes. Trends Genet. 2011;27:323‐331. [DOI] [PubMed] [Google Scholar]
- 76. Cordell HJ. Epistasis: what it means, what it doesn't mean, and statistical methods to detect it in humans. Hum Mol Genet. 2002;11:2463‐2468. [DOI] [PubMed] [Google Scholar]
- 77. Genin E. Missing heritability of complex diseases: case solved? Hum Genet. 2020;139:103‐113. [DOI] [PubMed] [Google Scholar]
- 78. Cordell HJ, Todd JA, Bennett ST, et al. Two‐locus maximum lod score analysis of a multifactorial trait: joint consideration of IDDM2 and IDDM4 with IDDM1 in type 1 diabetes. Am J Hum Genet. 1995;57:920‐934. [PMC free article] [PubMed] [Google Scholar]
- 79. Cordell HJ, Wedig GC, Jacobs KB, et al. Multilocus linkage tests based on affected relative pairs. Am J Hum Genet. 2000;66:1273‐1286. [DOI] [PMC free article] [PubMed] [Google Scholar]
- 80. Chen JS, Hu F, Kugathasan S, et al. Targeted gene sequencing in children with Crohn's disease and their parents: implications for missing heritability. G3. 2018;8:2881‐2888. [DOI] [PMC free article] [PubMed] [Google Scholar]
- 81. Marian AJ. Elements of 'missing heritability'. Curr Opin Cardiol. 2012;27:197‐201. [DOI] [PubMed] [Google Scholar]
- 82. Hill WG, Goddard ME, Visscher PM. Data and theory point to mainly additive genetic variance for complex traits. PLoS Genet. 2008;4:e1000008. [DOI] [PMC free article] [PubMed] [Google Scholar]
- 83. Rose AM, Bell LC. Epistasis and immunity: the role of genetic interactions in autoimmune diseases. Immunology. 2012;137:131‐138. [DOI] [PMC free article] [PubMed] [Google Scholar]
- 84. Bergholdt R, Taxvig C, Eising S, et al. CBLB variants in type 1 diabetes and their genetic interaction with CTLA4. J Leukoc Biol. 2005;77:579‐585. [DOI] [PubMed] [Google Scholar]
- 85. Payne F, Cooper JD, Walker NM, et al. Interaction analysis of the CBLB and CTLA4 genes in type 1 diabetes. J Leukoc Biol. 2007;81:581‐583. [DOI] [PubMed] [Google Scholar]
- 86. Bugawan TL, Mirel DB, Valdes AM, et al. Association and interaction of the IL4R, IL4, and IL13 loci with type 1 diabetes among Filipinos. Am J Hum Genet. 2003;72:1505‐1514. [DOI] [PMC free article] [PubMed] [Google Scholar]
- 87. Maier LM, Chapman J, Howson JM, et al. No evidence of association or interaction between the IL4RA, IL4, and IL13 genes in type 1 diabetes. Am J Hum Genet. 2005;76:517‐521. [DOI] [PMC free article] [PubMed] [Google Scholar]
- 88. Koeleman BP, Lie BA, Undlien DE, et al. Genotype effects and epistasis in type 1 diabetes and HLA‐DQ trans dimer associations with disease. Genes Immun. 2004;5:381‐388. [DOI] [PubMed] [Google Scholar]
- 89. Hu X, Deutsch AJ, Lenz TL, et al. Additive and interaction effects at three amino acid positions in HLA‐DQ and HLA‐DR molecules drive type 1 diabetes risk. Nat Genet. 2015;47:898‐905. [DOI] [PMC free article] [PubMed] [Google Scholar]
- 90. Lenz TL, Deutsch AJ, Han B, et al. Widespread non‐additive and interaction effects within HLA loci modulate the risk of autoimmune diseases. Nat Genet. 2015;47:1085‐1090. [DOI] [PMC free article] [PubMed] [Google Scholar]
- 91. Bjornvold M, Undlien DE, Joner G, et al. Joint effects of HLA, INS, PTPN22 and CTLA4 genes on the risk of type 1 diabetes. Diabetologia. 2008;51:589‐596. [DOI] [PMC free article] [PubMed] [Google Scholar]
- 92. Howson JM, Cooper JD, Smyth DJ, et al. Evidence of gene‐gene interaction and age‐at‐diagnosis effects in type 1 diabetes. Diabetes. 2012;61:3012‐3017. [DOI] [PMC free article] [PubMed] [Google Scholar]
- 93. Smyth DJ, Cooper JD, Howson JM, et al. PTPN22 Trp620 explains the association of chromosome 1p13 with type 1 diabetes and shows a statistical interaction with HLA class II genotypes. Diabetes. 2008;57:1730‐1737. [DOI] [PubMed] [Google Scholar]
- 94. Ellis JA, Kemp AS, Ponsonby AL. Gene‐environment interaction in autoimmune disease. Expert Rev Mol Med. 2014;16:e4. [DOI] [PubMed] [Google Scholar]
- 95. Trerotola M, Relli V, Simeone P, et al. Epigenetic inheritance and the missing heritability. Hum Genomics. 2015;9:17. [DOI] [PMC free article] [PubMed] [Google Scholar]
- 96. Patterson CC, Dahlquist GG, Gyurus E, et al. Incidence trends for childhood type 1 diabetes in Europe during 1989‐2003 and predicted new cases 2005‐20: a multicentre prospective registration study. Lancet. 2009;373:2027‐2033. [DOI] [PubMed] [Google Scholar]
- 97. Fourlanos S, Varney MD, Tait BD, et al. The rising incidence of type 1 diabetes is accounted for by cases with lower‐risk human leukocyte antigen genotypes. Diabetes Care. 2008;31:1546‐1549. [DOI] [PMC free article] [PubMed] [Google Scholar]
- 98. Luo S, Li X, Huang G, et al. Distinct two different ages associated with clinical profiles of acute onset type 1 diabetes in Chinese patients. Diabetes Metab Res Rev. 2020;36:e3209. [DOI] [PubMed] [Google Scholar]
- 99. Hussen HI, Moradi T, Persson M. The risk of type 1 diabetes among offspring of immigrant mothers in relation to the duration of residency in Sweden. Diabetes Care. 2015;38:934‐936. [DOI] [PubMed] [Google Scholar]
- 100. Jerram ST, Leslie RD. The genetic architecture of type 1 diabetes. Genes. 2017;8:209. [DOI] [PMC free article] [PubMed] [Google Scholar]
- 101. Hancock DB, Soler Artigas M, Gharib SA, et al. Genome‐wide joint meta‐analysis of SNP and SNP‐by‐smoking interaction identifies novel loci for pulmonary function. PLoS Genet. 2012;8:e1003098. [DOI] [PMC free article] [PubMed] [Google Scholar]
- 102. Williamson E, Ponsonby AL, Carlin J, et al. Effect of including environmental data in investigations of gene‐disease associations in the presence of qualitative interactions. Genet Epidemiol. 2010;34:552‐560. [DOI] [PubMed] [Google Scholar]
- 103. Moore DS. Genex Environment interaction: What exactly are we talking about? Res Dev Disabil. 2018;82:3‐9. [DOI] [PubMed] [Google Scholar]
- 104. Helbig KL, Nothnagel M, Hampe J, et al. A case‐only study of gene‐environment interaction between genetic susceptibility variants in NOD2 and cigarette smoking in Crohn's disease aetiology. BMC Med Genet. 2012;13:14. [DOI] [PMC free article] [PubMed] [Google Scholar]
- 105. Allis CD, Jenuwein T. The molecular hallmarks of epigenetic control. Nat Rev Genet. 2016;17:487‐500. [DOI] [PubMed] [Google Scholar]
- 106. Kubota T, Miyake K, Hirasawa T. Epigenetic understanding of gene‐environment interactions in psychiatric disorders: a new concept of clinical genetics. Clin Epigenetics. 2012;4:1. [DOI] [PMC free article] [PubMed] [Google Scholar]
- 107. Wan ES, Qiu W, Baccarelli A, et al. Cigarette smoking behaviors and time since quitting are associated with differential DNA methylation across the human genome. Hum Mol Genet. 2012;21:3073‐3082. [DOI] [PMC free article] [PubMed] [Google Scholar]
- 108. Awany D, Chimusa ER. Heritability jointly explained by host genotype and microbiome: will improve traits prediction? Brief Bioinform. 2021;22:bbaa175. [DOI] [PubMed] [Google Scholar]
- 109. Douglas GM, Bielawski JP, Langille MGI. Re‐evaluating the relationship between missing heritability and the microbiome. Microbiome. 2020;8:87. [DOI] [PMC free article] [PubMed] [Google Scholar]
- 110. Heng HH. Missing heritability and stochastic genome alterations. Nat Rev Genet. 2010;11:813. [DOI] [PubMed] [Google Scholar]
- 111. Panzeri I, Pospisilik JA. Epigenetic control of variation and stochasticity in metabolic disease. Mol Metab. 2018;14:26‐38. [DOI] [PMC free article] [PubMed] [Google Scholar]
- 112. Badenhoop K, Kahles H, Seidl C, et al. MHC‐environment interactions leading to type 1 diabetes: feasibility of an analysis of HLA DR‐DQ alleles in relation to manifestation periods and dates of birth. Diabetes Obes Metab. 2009;11(Suppl 1):88‐91. [DOI] [PMC free article] [PubMed] [Google Scholar]
- 113. Wu P, Dupont WD, Griffin MR, et al. Evidence of a causal role of winter virus infection during infancy in early childhood asthma. Am J Respir Crit Care Med. 2008;178:1123‐1129. [DOI] [PMC free article] [PubMed] [Google Scholar]
- 114. Rakyan VK, Beyan H, Down TA, et al. Identification of type 1 diabetes‐associated DNA methylation variable positions that precede disease diagnosis. PLoS Genet. 2011;7:e1002300. [DOI] [PMC free article] [PubMed] [Google Scholar]
- 115. Paul DS, Teschendorff AE, Dang MA, et al. Increased DNA methylation variability in type 1 diabetes across three immune effector cell types. Nat Commun. 2016;7:13555. [DOI] [PMC free article] [PubMed] [Google Scholar]
- 116. Blanter M, Sork H, Tuomela S, et al. Genetic and environmental interaction in type 1 diabetes: a relationship between genetic risk alleles and molecular traits of enterovirus infection? Curr Diab Rep. 2019;19:82. [DOI] [PMC free article] [PubMed] [Google Scholar]
- 117. Bruserud O, Thorsby E. T lymphocyte responses to Coxsackie B4 and mumps virus. I. Influence of HLA‐DR restriction elements. Tissue Antigens. 1985;26:41‐50. [DOI] [PubMed] [Google Scholar]
- 118. Juan‐Mateu J, Villate O, Eizirik DL. Mechanisms in endocrinology: alternative splicing: the new frontier in diabetes research. Eur J Endocrinol. 2016;174:R225‐R238. [DOI] [PMC free article] [PubMed] [Google Scholar]
- 119. Chiou J, Geusz RJ, Okino ML, et al. Interpreting type 1 diabetes risk with genetics and single‐cell epigenomics. Nature. 2021;594:398‐402. [DOI] [PMC free article] [PubMed] [Google Scholar]
- 120. Diez E, Lee SH, Gauthier S, et al. Birc1e is the gene within the Lgn1 locus associated with resistance to Legionella pneumophila . Nat Genet. 2003;33:55‐60. [DOI] [PubMed] [Google Scholar]
- 121. Min‐Oo G, Fortin A, Tam MF, et al. Pyruvate kinase deficiency in mice protects against malaria. Nat Genet. 2003;35:357‐362. [DOI] [PubMed] [Google Scholar]
- 122. Valdar W, Solberg LC, Gauguier D, et al. Genome‐wide genetic association of complex traits in heterogeneous stock mice. Nat Genet. 2006;38:879‐887. [DOI] [PubMed] [Google Scholar]
- 123. Wandstrat A, Wakeland E. The genetics of complex autoimmune diseases: non‐MHC susceptibility genes. Nat Immunol. 2001;2:802‐809. [DOI] [PubMed] [Google Scholar]
- 124. Wallace C, Smyth DJ, Maisuria‐Armer M, et al. The imprinted DLK1‐MEG3 gene region on chromosome 14q32.2 alters susceptibility to type 1 diabetes. Nat Genet. 2010;42:68‐71. [DOI] [PMC free article] [PubMed] [Google Scholar]
- 125. O'Connor MJ, Schroeder P, Huerta‐Chagoya A, et al. Recessive genome‐wide meta‐analysis illuminates genetic architecture of type 2 diabetes. Diabetes. 2022;71:554‐565. [DOI] [PMC free article] [PubMed] [Google Scholar]
- 126. Primavera M, Giannini C, Chiarelli F. Prediction and prevention of type 1 diabetes. Front Endocrinol. 2020;11:248. [DOI] [PMC free article] [PubMed] [Google Scholar]
Associated Data
This section collects any data citations, data availability statements, or supplementary materials included in this article.
Data Availability Statement
Data sharing not applicable to this article as no datasets were generated or analysed during the current study