

Abstract
The present study investigated whether listeners can form abstract voice representations while ignoring constantly changing phonological information and if they can use the resulting information to facilitate voice change detection. Further, the study aimed at understanding whether the use of abstraction is restricted to the speech domain or can be deployed also in non‐speech contexts. We ran an electroencephalogram (EEG) experiment including one passive and one active oddball task, each featuring a speech and a rotated speech condition. In the speech condition, participants heard constantly changing vowels uttered by a male speaker (standard stimuli) which were infrequently replaced by vowels uttered by a female speaker with higher pitch (deviant stimuli). In the rotated speech condition, participants heard rotated vowels, in which the natural formant structure of speech was disrupted. In the passive task, the mismatch negativity was elicited after the presentation of the deviant voice in both conditions, indicating that listeners could successfully group together different stimuli into a formant‐invariant voice representation. In the active task, participants showed shorter reaction times (RTs), higher accuracy and a larger P3b in the speech condition with respect to the rotated speech condition. Results showed that whereas at a pre‐attentive level the cognitive system can track pitch regularities while presumably ignoring constantly changing formant information both in speech and in rotated speech, at an attentive level the use of such information is facilitated for speech. This facilitation was also testified by a stronger synchronisation in the theta band (4–7 Hz), potentially pointing towards differences in encoding/retrieval processes.
Keywords: MMN, P3b, speech perception, Theta, voice representation
Attentively detecting changes in the talker's voice driven by pitch variations is facilitated by the presence of phonological information in speech. The extensive familiarity with speech and voices might mitigate the demand of cognitive resources and promote more efficient encoding/retrieval processes as testified by the a stronger P3b and a larger power theta ERS for speech versus rotated speech.

Abbreviations
- EEG
Electroencephalogram
- ERD
Event‐related desynchronisation
- ERP
Event‐related potential
- ERS
Event‐related synchronisation
- ERSP
Event‐related spectral perturbation
- F0
Fundamental frequency (pitch)
- F1
First formant frequency
- F2
Second formant frequency
- GLMM
Generalised linear mixed model
- ISI
Interstimulus interval
- LDN
Late discriminative negativity
- LMM
Linear mixed model
- MMN
Mismatch negativity
- RON
Reorienting negativity
- RT
Reaction time
- WM
Working memory
1. INTRODUCTION
The speech signal encodes both linguistic and vocal information. These two types of information can be selectively extracted and used for different communicative and social goals. In fact, listeners can understand the message content irrespectively of who is speaking and can also identify the talker's voice regardless of what is being said. However, these operations are not undemanding as they may seem, and in order to perform them, speakers need to orient their attention accordingly.
In an ERP study, Kaganovich et al. (2006) asked participants to listen to different vowels uttered by different talkers. In one task, participants were asked to identify the talker notwithstanding changes in the unattended vowel dimension, whereas in another task they were asked to identify vowels while ignoring changes in the unattended talker dimension. The Garner paradigm (Garner, 2014) employed by the authors predicts that if two dimensions are processed together, sudden changes in the unattended dimension would hamper the processing of the attended one. Consistently, when compared with a baseline task (i.e., a task where no changes in the unattended dimension occurred), both tasks were characterised by a sustained negativity surfacing in the N100 time window and spreading until the P3 time window. These findings suggest the involvement of two attention‐based processes allowing for the dissociation of phonological versus vocal information. Specifically, a low‐level filtering process, occurring in the N100 time window, would isolate the physical dimension of interest. A second higher‐level process, occurring in the P3 time window, would instead be responsible for matching the output of the filtering process to the correct response representation in working memory (WM). This result suggests that when listeners are asked to extract information from a complex signal by orienting their attention towards a target information, they need to take care of physical variability both in the attended and in the unattended dimensions. Speech tokens embedding phonological and vocal information are produced in different ways by different talkers. Thus, regardless of the specific type of information to select or ignore, listeners need to use their cognitive resources to model and summarise variability within a stable percept.
One way by which listeners can facilitate the extraction of relevant information from speech and deal with physical variability is by forming abstract representations which are selectively invariant to changes along specific dimensions of the speech signal (Belin et al., 2004; Norris & McQueen, 2008). Concerning this issue, Bonte et al. (2009) ran an EEG experiment in which participants listened to different vowels uttered by different talkers which were randomly presented across different blocks. In separate blocks, they were asked to detect consecutive repetitions of either the same vowel or the same talker. In each task (i.e., detect vowel repetitions or talker repetitions), the alpha phase realignment surfacing ~250 ms after stimulus presentation was stronger for the target (phonemic or vocal) dimension. According to the authors' interpretation, alpha phase alignment is induced by selective attention driving the temporal binding of information contained in abstract representations previously formed in auditory cortices. The interpretation of this result provides a neural characterisation of the attentional processes described in Kaganovich et al. (2006), which require abstract representations to work correctly. Still, it is not clear how or when such abstract representations can inform and orient the attentional processes nor if their formation occurs pre‐attentively or needs the involvement of attentional processes.
There is evidence that abstract (i.e., talker‐invariant) representations of phonemes are automatically formed by the cognitive system. For example, Jacobsen, Schröger, and Alter (2004) ran an EEG experiment with a passive oddball paradigm, in which participants heard one vowel as standard stimulus with fixed first (F1) and second formant (F2) values—which are cues for vowel identification (Hewlett & Beck, 2013)—but with continuous variation in F0, which is a cue for voice identification (Baumann & Belin, 2010). The presentation of a deviant vowel featuring different F1/F2 values yielded a mismatch negativity (MMN), notwithstanding the constant variations in non‐linguistic information (i.e., F0 and intensity). The finding suggests that listeners automatically abstract away from non‐linguistic cues (i.e., F0) while focusing on phonological information (i.e., F1 and F2). The results were replicated using speech‐like stimuli (i.e., complex tones synthesised with the same F0, F1 and F2) but not with non‐speech stimuli (i.e., simple tones lacking formant structure, Jacobsen, Schröger, & Sussman, 2004). This suggests that abstraction mechanisms are speech‐specific and get activated only in presence of a formant structure.
Crucially, no evidence about the potential involvement of these abstraction mechanisms in the formation of phoneme‐invariant voice representations has been shown yet. However, such mechanisms can be reasonably hypothesised, as (i) talker‐related information is highly relevant during communication (Van Berkum et al., 2008), (ii) vocal information has been shown to be pre‐attentively processed (Scharinger et al., 2011; Titova & Näätänen, 2001) and (iii) the cognitive system shows a domain‐general ability to detect the violation of abstract regularities occurring across different physical features of acoustic stimuli. Consistently, many EEG studies used the “abstract‐feature” oddball paradigm (e.g., Saarinen et al., 1992), in which standard stimuli differ in several physical dimensions while being similar in at least one dimension. These experiments demonstrated a reliable elicitation of the MMN, indexing the ability to automatically group together different sounds on the basis of the similarity in one physical dimension, regardless of other constantly changing ones (for a review, see Paavilainen, 2013). The detection of abstract regularities in sound streams seems to be reliable even for newborns (Carral et al., 2005). These results may thus indicate that the cognitive system is able to extract invariant sound features in constantly varying acoustic contexts via a general‐purpose auditory abstraction process, which can be used to process different kinds of regularities in several domains such as speech (Eulitz & Lahiri, 2004) and music (Virtala et al., 2011).
Although listeners may be able to track different acoustic regularities in sounds and store them within abstract representations via general‐purpose mechanisms, they might be influenced by their prolonged experience with speech and voices. Consistently, the identification of the linguistic (i.e., words) or vocal component (i.e., talker identity) of speech is facilitated when one of the two information is familiar to the listener (Johnsrude et al., 2013; Zarate et al., 2015; Nygaard et al., 1994), suggesting that even if listeners are focusing on one specific dimension of the speech signal, being familiar with the ignored dimension(s) is still beneficial. The influence of linguistic and voice‐related experience surfaces early in time, as the MMN shows larger amplitude when native phonemes (Dehaene‐Lambertz, 1997; Näätänen et al., 1997) and words (Pulvermüller et al., 2001, 2004) or familiar voices (Beauchemin et al., 2006) are presented as deviant stimuli. This effect has commonly been considered as an index of a memory trace retrieval process (Näätänen et al., 2007) and occurs in a time window compatible with the one in which the cognitive system builds representations of abstract regularities. Thus, listeners may be facilitated in detecting regularities when they hear speech by retrieving representations of known linguistic/vocal information in which both the attended and the unattended information can be encoded.
1.1. The present study
This study has two main aims. The first aim is to establish whether the abstraction mechanism is information‐specific within the speech domain, that is whether listeners can spontaneously form abstract representations of the talker's voice irrespectively of phonological information, exactly as they do with phonemes irrespectively of physical variations in the talker's voice (Jacobsen, Schröger, & Alter, 2004; Jacobsen, Schröger, & Sussman, 2004; Shestakova et al., 2002). To achieve this goal, the “abstract‐feature” oddball paradigm was used. In the first condition, different vowels uttered by a male voice were presented as standard stimuli. While F1/F2 values were constantly changed, the F0 value was kept fixed. Standard stimuli were infrequently replaced by deviant stimuli, which were produced by a female voice, characterised by a higher F0. Note that F0 is only one of the parameters on which speaker identification and/or discrimination are based. Other parameters include the formant frequencies or jitter (Baumann & Belin, 2010), and the perceptual relevance of such cues varies between speakers (Van Lancker et al., 1985) and listeners (Lavner et al., 2001). Although voice identity is a complex construct which relates to multiple features mapped onto different acoustic cues (Sidtis & Zäske, 2021), a voice gender contrast (i.e., male vs. female voice) was implemented to index contrasts of voice identities in order to maximise the possibility that participants actually perceived a change in the talker's voice driven by pitch variations. Also in this case, F0 is one primary (but not the only) cue driving identification and discrimination (Hubbard & Assmann, 2013; Lass et al., 1976; Skuk & Schweinberger, 2014).
If listeners can automatically form an abstract representation of the talker's voice irrespectively of the constant variation in phonological information (i.e., F1/F2 values of different phonemes), an MMN is expected. This result would indicate that listeners can form phoneme‐invariant representations of the talker's voice similarly as they form talker‐invariant representations of the phonemes. The absence of any MMN, instead, would suggest that the cognitive system is preferentially tuned to detect variations along the phonological dimension, compared with the vocal one. If this is the case, the abstraction mechanism under investigation could then be considered as information‐specific, at least within the speech domain (as suggested by Jacobsen, Schröger, and Alter (2004) results). Since the MMN could also be due to an acoustic‐based abstraction mechanism, as suggested by the studies reviewed by Paavilainen (2013), the second aim of the present study was to understand whether the abstraction mechanism is speech‐specific or whether it represents a general‐purpose mechanism which is then employed across different domains, including speech perception. To investigate this issue, a second “abstract‐feature” oddball block was implemented, but this time the stimuli corresponded to the spectrally rotated version of the speech stimuli presented in the first task. Spectral rotation consists in manipulating the spectrum of a specific sound by selecting a mirroring frequency (e.g., 2000 Hz) and exchanging the power values of the high frequencies with those of the low frequencies and vice versa (Blesser, 1972). This procedure results in auditory stimuli with implausible formant values, disrupting any possible recognition of phonological information while keeping both the spectral complexity and the pitch contour intact (Marklund et al., 2018; Sjerps et al., 2011). If an MMN is successfully elicited in this condition, this would suggest that the abstraction mechanism under investigation is not speech‐specific. Additionally, in case the MMN is elicited in both conditions, phonological information might still be pre‐attentively extracted to facilitate the detection of vocal changes. In this case, the MMN should be stronger for the speech condition, indexing the automatic retrieval of native phoneme representations. (Dehaene‐Lambertz, 1997; Näätänen et al., 1997).
Additionally, an active version of the oddball task was conducted, in order to understand whether the output of the abstraction mechanisms facilitates the detection of changes within specific stimulus features (i.e., pitch) while other constantly varying dimensions (i.e., F1 and F2) are disregarded. If this is the case, for the conditions in which an MMN is elicited in the passive oddball task, a P3b is expected following the correct detection of deviant stimuli in the active oddball task. Moreover, since the amplitude of P3b is sensitive to the amount of cognitive and attentional resources deployed to stimulus processing independently of its physical features (Duncan et al., 2009), it represents a good index to assess whether the detection of variations in pitch requires different amounts of cognitive resources across speech and rotated speech contexts. Therefore, if a MMN is elicited both by speech and rotated speech conditions, we would expect a larger P3b for the speech condition as the extensive familiarity with speech and voices (as well as with the relationship between the two) might mitigate the demand of cognitive resources needed to detect variations in pitch.
Finally, we also explored the oscillatory activity in the theta (4–7 Hz), alpha (8–12 Hz) and beta (13–30 Hz) frequency bands considering their association with specific cognitive processes that could be involved in the extraction of regularities or with the processing of specific stimulus types (e.g., speech) and features (e.g., pitch).
Power modulations in the theta band are often found in correspondence to the presentation of deviant events in both passive (Jin et al., 2014; Ko et al., 2012; Koerner et al., 2016) and active oddball tasks with speech and non‐speech stimuli (Citherlet et al., 2020; Kolev et al., 1997; Spencer & Polich, 1999; Szalárdy et al., 2021). These modulations appear to be sensitive to pitch variations (Hsu et al., 2015; Li & Chen, 2018) and have been associated with processes of encoding (Klimesch, 1999), retrieval (Bastiaansen et al., 2005; Klimesch et al., 2001) and WM load (Fuentemilla et al., 2008; Jensen & Tesche, 2002; Kolev et al., 1997). Power modulations in the alpha and in the beta bands are also commonly found in passive and active oddball tasks (Hsu et al., 2015; Mazaheri & Picton, 2005; Öniz & Başar, 2009): Alpha activity is associated with attentional control (Wöstmann et al., 2017) and informational gating (Strauß et al., 2014), whereas beta modulations are informative about the temporal dynamics of maintenance and disruption of perceptual and cognitive sets (Engel & Fries, 2010), which in our experiment are induced by the presentation of deviant events. Therefore, the study of oscillatory activity within the theta, alpha, and beta bands may extend the functional characterisation of non‐phase‐locked activity underlying fundamental cognitive processes that subserve the extraction of regularities in the auditory and in the speech domain, while possibly providing complementary evidence with respect to the underlying mechanisms. Importantly, despite the focus on specific frequency bands, if we consider the broad range of cognitive processes that are potentially involved in the extraction of regularities, as well as the potential sensitivity of oscillatory activity to multiple features of the stimuli, the time‐frequency analyses in the present study should be considered explorative.
2. MATERIALS AND METHODS
2.1. Participants
Seventeen healthy Italian native speakers were recruited. Two participants were excluded from the final sample because of excessive noise in the EEG data. The final sample included 11 female and four male participants (M age = 22.60, SD age = 2.74), all right‐handed (Edinburgh Handedness Inventory: M = .78, SD = .13). The sample size was decided on the basis of previous studies that used the abstract oddball paradigm and reliably recorded both the MMN and/or the P3b responses (Bendixen & Schröger, 2008; Escera et al., 2014; Escera & Malmierca, 2014). Participants reported to be neurologically healthy and to have normal hearing. 1 Participation was compensated either with course credit or with 10€ per hour. The study was approved by the Ethical Committee of The University of Trento. Participants signed an informed consent document prior to the experiment.
2.2. Stimuli
One female and one male Italian native speaker, respectively, aged 38 and 36 were recruited to record the experimental stimuli. They were asked to read aloud five isolated Italian vowels (/a/, /e/, /ɛ/, /i/, /ɔ/) three times each. Their voice was recorded at 44100 Hz with a professional recorder in a silent room. The best tokens were selected based on quantitative and qualitative evaluation. Noisy tokens and tokens with abnormal pitch contours (e.g., list‐reading intonation) were discarded. After this, the tokens F1 and F2 values were extracted using Praat v. 6.0.49 (Boersma & Weenink, 2018). The tokens with the smallest difference of F1 and F2 between the two talkers were selected in order to minimise any possible attentional shift caused by large F1 − F2 differences between the talkers. The central 100 ms part of each vowel was extracted. Then, the pitch contour was manipulated using Praat v. 6.0.49 (Boersma & Weenink, 2018). The pitch contour in each token was adjusted to a flat line to prevent participants from confounding idiosyncratic pitch shifts as changes in the identity of the talker. Pitch was set to an average value that was calculated as the mean across all tokens within each speaker. Stimuli were low‐pass filtered at the cut‐off frequency of 4000 Hz using custom filtering MATLAB (MATLAB, 2020) functions (available at https://www.phon.ucl.ac.uk/downloads/matlab/Blesser.zip) in order to match the spectral dimensions of the rotated speech stimuli, which require to be low‐pass filtered before applying spectral rotation (Blesser, 1972). Intensity was put to an average value of 70 dB with linear slopes of 10 ms at the onset and the offset in each token to avoid any harsh transition between silence and sound in the EEG experiment.
Rotated speech stimuli were created by rotating the spectrum of speech stimuli using a spectral rotation function in MATLAB (MATLAB, 2020) with a cut‐off frequency of 4000 Hz (available at https://www.phon.ucl.ac.uk/downloads/matlab/Blesser.zip); the same function and other similar implementations of the spectral rotation algorithm were used in several studies to produce non‐speech control stimuli in the attempt to contrast acoustic and speech‐specific perceptual processes (Azadpour & Balaban, 2008; Marklund et al., 2020; Scott, 2000; Steinmetzger & Rosen, 2017). The result of this procedure is a sound with a mirrored spectrogram along a mirroring frequency (i.e., 2000 Hz corresponding to half of the cut‐off frequency) with respect to the input sound. This means that the point‐by‐point power of lower frequencies (e.g., 0, 500 and 1000 Hz) is transferred to higher frequencies (4000, 3500 and 3000 Hz) and vice versa. The physical characteristics of the experimental stimuli are summarised in Table 1. All stimuli are available online (https://osf.io/2pbmr/).
TABLE 1.
Pitch (F0), first and second formant (F1, F2) values of the experimental stimuli for each talker and each condition
| Condition | |||||||
|---|---|---|---|---|---|---|---|
| Speech | Rotated speech | ||||||
| Talkers sex | Vowel | F0 | F1 | F2 | F0 | F1 | F2 |
| Male | a | 121 Hz | 816 Hz | 1252 Hz | 121 Hz | 768 Hz | 1623 Hz |
| e | 121 Hz | 384 Hz | 2141 Hz | 121 Hz | 653 Hz | 1360 Hz | |
| i | 121 Hz | 360 Hz | 2039 Hz | 121 Hz | 795 Hz | 1402 Hz | |
| ɔ | 121 Hz | 561 Hz | 862 Hz | 121 Hz | 772 Hz | 1007 Hz | |
| ɛ | 121 Hz | 571 Hz | 1782 Hz | 121 Hz | 1049 Hz | 1717 Hz | |
| Female | a | 184 Hz | 981 Hz | 1469 Hz | 184 Hz | 1269 Hz | 2081 Hz |
| e | 184 Hz | 368 Hz | 1698 Hz | 184 Hz | 803 Hz | 1332 Hz | |
| i | 184 Hz | 329 Hz | 1209 Hz | 184 Hz | 780 Hz | 1113 Hz | |
| ɔ | 184 Hz | 733 Hz | 1169 Hz | 184 Hz | 964 Hz | 1976 Hz | |
| ɛ | 184 Hz | 695 Hz | 1599 Hz | 184 Hz | 934 Hz | 1675 Hz | |
2.3. Procedure
First, participants were asked to complete questionnaires collecting demographic information, handedness, and musical expertise. Then, they were prepared for the EEG recording in a dimly lit room. The experiment consisted of a passive and an active version of the oddball task. During the passive oddball task, participants were asked to watch a silent video depicting drone footage of different landscapes, while auditory stimuli were delivered via Etymotic ER‐1 headphones at fixed volume (70 dB) using E‐prime 2.0 Software (Schneider & Zuccoloto, 2007). Speech and rotated speech stimuli were presented across two different blocks. Each block included 680 standard events (136 trials per vowel) and 120 deviant events (24 trials per vowel). At the end of each block, the 120 deviant stimuli (24 trials per vowel) were presented in random order to serve as control events. These latter stimuli were included in the experiment to control for the effects induced by the physical properties of the stimuli. Normally, the MMN component is calculated by subtracting standard ERPs from deviant ERPs (Näätänen et al., 2007), but the result of this computation is also influenced by physical differences between standard and deviant events. By using control events, which are physically identical to deviant events but are presented with the standard events' distribution, the MMN calculated by subtracting control from deviant events is uncontaminated by differences in terms of physical features and thus better highlights the cognitive processes of interest (Tuninetti et al., 2017). Between the two blocks, each of which lasted approximately 11 minutes, participants could take a small break.
In the speech condition, all the vowels produced by the male speaker were equiprobably presented in random order as standard stimuli with a fixed interstimulus interval (ISI) of 700 ms. All the vowels produced by the female talker were equiprobably presented as deviant stimuli (probability of occurrence = .15) with the constraint that a minimum of two standard events occurred before the presentation of a deviant event. The same vowel was never repeated twice in a row, irrespectively of its standard/deviant status meaning that standard and deviant events were characterised both by a vowel change and by a voice change. This was done to adhere to the canonical implementation of the abstract‐feature oddball paradigm. In fact, had the vowel been repeated across consecutive standard and deviant stimuli, an additional rule violation would have been introduced (i.e., in addition to the voice change), thus complicating the interpretation of the effects.
In the rotated speech condition, the same presentation paradigm was applied. The rotated speech condition was always presented first as presenting the speech condition first could have made participants aware of the stimulation paradigm structure, possibly leading to unwanted attentional modulations in the subsequent block.
After the passive oddball task, the active oddball task took place. This order of presentation was fixed, with the goal to ensure that participants were constantly distracted during the passive task. Although this configuration may have prompted a familiarisation with the voices during the passive task with subsequent potential influences on the results of the active oddball, we believe this was still the best option. In fact, as the active variant of the task explicitly instructs the participants to pay attention to the stimuli, such task set—if presented as the first one—could have been carried over to the passive version thereby introducing attention‐dependent activity (Justen & Herbert, 2018; Wronka et al., 2008) and invalidating any chance to isolate pre‐attentive processes, which were the main target of the passive oddball task.
The active task was identical to the passive one, with the only exception that participants were asked to press a button with their right index finger on a joypad as fast as possible when they heard a deviant event and that the control block was not presented at the end of each block. Before the start of the active task, participants were debriefed on what they heard in the passive task to ensure that they understood which stimuli were the deviant ones. They were told that the speech stimuli were produced by human voices while rotated speech stimuli were produced by guessing what aliens' voices could have sounded like. Before each experimental block, a practice block was presented. For the first 10 practice trials, participants were helped in performing the task by a graphical representation of the stimulus list presented on the screen where the information about the standard/deviant status of each upcoming stimulus was specified. For the subsequent 20 practice trials, participants performed the task as in the experimental part, that is, with no graphical help and while watching the silent video that was presented in the passive task. At the end of the practice block, they received feedback on their performance. After this, the experimental blocks started and lasted approximately the same amount of time as in the passive task. The whole experiment lasted approximately 1.30 h.
2.4. EEG recording and pre‐processing
The EEG was recorded with an eego sports system (ANT Neuro) at a sampling frequency of 1000 Hz (filters: DC to 130 Hz, third‐order sinc filter), from 64 Ag/AgCl shielded electrodes referenced to CPz and placed in the standard 10–10 locations on an elastic cap. Electro‐oculograms were acquired with an additional electrode placed under the left eye. Impedance was kept < 20 kΩ. Data pre‐processing was performed with the MATLAB toolboxes EEGLAB v 14.1.1 (Delorme & Makeig, 2004), ERPLAB 7.0 (Lopez‐Calderon & Luck, 2014), and FieldTrip v. 20,190,207 (Oostenveld et al., 2011). The signal was re‐referenced offline to the average reference. Data were high‐pass filtered at 0.1 Hz using a second‐order Butterworth filter (12 dB/oct Roll‐off). A Notch filter at 50 Hz was then applied to attenuate line noise. Independent component analysis was run on the continuous signal using the Infomax algorithm (Bell & Sejnowski, 1995). Eye‐blink and eye‐movement components were identified with ICLabel algorithm (Pion‐Tonachini et al., 2019) and removed. Excessively noisy channels were interpolated via spherical interpolation. Mastoid and electro‐oculogram channels were excluded from the analyses.
2.5. ERP data pre‐processing
Data were low‐pass filtered at 30 Hz using a second‐order Butterworth filter (12 dB/oct Roll‐off). Epochs were extracted from −200 ms before stimulus onset until 800 ms after stimulus onset, and a baseline correction was applied by subtracting the mean voltage of the −200 to 0 pre‐stimulus period from the entire epoch. Epochs containing signals with an amplitude exceeding ± 100 μV in any of the 62 EEG channels were rejected. An average of 3380 ± 79 epochs was retained per participant, and the number was similar across conditions for the passive oddball task (Control Speech = 119 ± 2, Deviant Speech = 119 ± 1, Control Rotated = 117 ± 4, Deviant Rotated = 119 ± 1) and the active oddball task (Standard Speech = 551 ± 11, Deviant Speech = 117 ± 4, Standard Rotated = 544 ± 36, Deviant Rotated = 98 ± 20).
For the passive oddball task, separate ERPs were computed by averaging epochs within each participant and within all the combinations of the factors condition (speech, rotated speech) and probability (control, deviant). The differential waveforms of the MMN were calculated within each participant and within each condition, by subtracting the control ERP from the deviant ERP. For the active oddball task, separate ERPs were computed by averaging only the events with a correct response within each participant and within all the combinations of the factors condition (speech, rotated speech) and probability (standard, deviant). All the epochs corresponding to standard events presented immediately after deviant events were removed from the analysis, to avoid any contamination from late potentials triggered by deviant events.
2.6. Time‐frequency data pre‐processing
Data were low‐pass filtered at 80 Hz using a second‐order Butterworth filter (12 dB/oct Roll‐off). Epochs were extracted from −800 ms before stimulus onset until 1200 ms after stimulus onset, to allow the estimation of power values in the frequency range (4–30 Hz) and in the time window of interest (−300 to 800 ms). Epochs containing signals with an amplitude exceeding ± 100 μV in any of the 62 EEG channels were rejected. An average of 3232 ± 119 of the total number of epochs per participant was retained, and the number was similar across conditions for the passive task (Control Speech = 115 ± 11, Deviant Speech = 115 ± 6, Control Rotated = 113 ± 9, Deviant Rotated = 115 ± 5) and the active task (Standard Speech = 514 ± 48, Deviant Speech = 109 ± 11, Standard Rotated = 517 ± 43, Deviant Rotated = 94.3 ± 21). The time‐frequency representation was computed via Morlet wavelets sliding at 10 ms steps from −800 to 1200 ms with respect to stimulus onset in each epoch for the 4–30 Hz frequencies (1 Hz step) with a linearly increasing number of cycles (range 3–10) in order to balance spectral and temporal precision (Cohen, 2014). Power was expressed as the percentage of change with respect to the baseline period of −300 to −100 ms from stimulus onset. The event‐related spectral perturbations (ERSPs) for both active and passive oddball tasks were computed in the whole spectrum by averaging epochs within each participant and within all the combinations of the factors condition (speech, rotated speech) and probability (control/standard, deviant). All the epochs corresponding to standard events coming immediately after deviant events were removed from the analysis, to avoid any contamination from later potentials triggered by deviant events. For the active oddball task, only the events with a correct response were considered. In the statistical analyses, only the −300 to 800 ms time window of interest was considered.
2.7. Statistical analyses
2.7.1. Behavioural data
Accuracy and RTs were both analysed using the “lme4” package (Bates et al., 2015) in R Software (R Core Team, 2013). Participants' accuracy in the active task was analysed by means of a generalised linear mixed model (GLMM) with a logit link‐function. The best model was selected by sequentially including each predictor. Predictors were retained in the final model only when their exclusion determined a significant reduction in goodness‐of‐fit, as assessed by Chi‐square tests comparing the two models in which the predictor under examination was present versus absent. The final model included the fixed factors condition (speech, rotated speech) and probability (standard, deviant) as well as by‐participants and by‐items random intercepts. Reaction times (RTs) of correct deviant events were analysed by means of a linear mixed model (LMM). Model selection was performed with the same method used for accuracy data. The final model included condition (speech, rotated speech) as a fixed factor as well as by‐participants and by‐items random intercepts. All factors in all models were deviance coded (0.5 and −0.5). Thus, the model's coefficients represent the main effects, coded as the difference between the levels of each factor. Post‐hoc comparisons were implemented via “emmeans” R package.
2.7.2. EEG data
Non‐parametric cluster‐based permutation tests were used for both ERPs and time‐frequency analyses. In this approach, conditions are compared via multiple paired t‐tests performed at each time point within each channel. T‐values with a p‐value <.05 are selected and clustered on the basis of temporal and spatial adjacency. All the t‐values within each cluster are then summed and compared with the distribution of the t‐values under the null hypothesis which is obtained by calculating the test statistic several times (N = 2500) on the data points shuffled across conditions. The proportion of random permutations where the observed cluster's t‐value is larger than the t‐value drawn from the actual data represents the cluster p‐value. When analysing ERP components for which the literature provides robust temporal coordinates (e.g., MMN) and specific directions (i.e., positive or negative), one‐tailed tests were restricted to an a priori defined time window (see below). For every statistical test, 95% confidence intervals of the p‐value are reported. Cohen's d is also reported and was calculated by dividing the mean of the differences between conditions by the standard deviation of the differences between the conditions at test and obtained from the individual values of the dependent variable (i.e., voltage or power). Individual values were computed separately for each condition by averaging the dependent variable across channels and time samples of significant clusters within every individual participant following the indication of FieldTrip's authors (for additional information, see https://www.fieldtriptoolbox.org/example/effectsize/).
2.7.3. ERP analyses
In the passive oddball task, the presence of the MMN component within each condition was assessed by comparing deviant and control events via a one‐tailed test in the 110–225 ms time window as suggested in Kappenman et al. (2021). 2 Visual inspection of the ERPs also showed the presence of a sustained negative component surfacing ~350 ms after stimulus onset and lasting until the end of the epoch, mostly distributed across frontal and fronto‐central electrodes (see supporting information for the ERP waveforms on a large set of channels). This component was tentatively identified as the late discriminative negativity (LDN), which was also reported in another study encompassing the abstract‐feature paradigm as “Late MMN” (Zachau et al., 2005). Previous studies that used the canonical oddball paradigm reported the presence of this component over different time windows scattered across the 350–600 ms interval (Choudhury et al., 2015; David et al., 2020; Honbolygó et al., 2017). Given the absence of a priori hypotheses on its presence and/or modulation, the analysis of this component must be considered explorative. For this reason, and in order not to select an ad‐hoc time window based on visual inspection, we performed a one‐tailed test in a wider 350–800 m time window, which started well after the offset of the MMN and lasted throughout the whole epoch. Finally, to assess the presence of a P3b component in the active oddball task, a broad time window was considered, by comparing deviant and standard events via a one‐tailed test between 300 and 600 ms after stimulus onset. The time window was selected following the same logic used for the MMN (Kappenman et al., 2021). The difference between conditions (speech, rotated speech) was then tested by comparing the two differential waveforms calculated by subtracting the control ERP from the deviant ERP for the MMN and the LDN and the standard ERP from the deviant ERP for the P3b.
2.7.4. Time‐frequency analyses
Statistical analyses on time‐frequency data were conducted on theta (4–7 Hz), alpha (8–12 Hz) and, beta (13–30 Hz) frequency bands by averaging power values within each band and within the same combination of factors as in the ERP analyses. The whole 0–800 ms epoch was used in the analyses as we had no specific hypotheses about the temporal unfolding of power modulation following non‐phase‐locked activity. Differently from ERP analyses, due to the lack of specific predictions concerning differences in the ERSPs across standard/control and deviant events and/or across conditions, we started by testing for the interaction effect between probability (i.e., standard/control and deviant) and condition (i.e., speech, rotated speech). First, separately within each condition (i.e., speech and rotated speech), we computed the two differential ERSPs by subtracting the power of control/standard events from the one of deviant events. Second, we compared the two differential ERSPs across conditions via cluster‐based permutation test. Finally, when significant interaction effects pointed towards reliable differences, post‐hoc tests were performed by directly comparing the ERSPs of standard/control events with the ERSPs of deviant events separately within speech and non‐speech conditions.
3. RESULTS
3.1. Behavioural results
The mean proportion of accurate responses in the speech condition was .99 (SD = .002) for standard and .98 (SD = .01) for deviant events, whereas in the rotated speech condition, it was .97 (SD = .06) for standard and .83 (SD = 0.16) for deviant events. The analyses revealed a main effect of condition (β = 3.24, SE = 0.18, z = −17.67, p < .001), showing a higher accuracy in the speech condition (M = .99, SD = .004) with respect to the rotated speech condition (M = .95, SD = .06). The significant main effect of probability (β = 2.49, SE = 0.10, z = 24.89, p = < .001) revealed higher accuracy for standard events (M = .98, SD = .03) compared with deviant events (M = .90, SD = .09).
The mean RTs for correctly identified deviant events were 414 ms (SD = 86) in the speech condition and 457 ms (SD = 110) in the rotated speech condition. The statistical model revealed only the main effect of condition (β = −45.70, SE = 3.08, z = −14.82, p < .001): Participants responded faster in the speech than in the rotated speech condition. Behavioural results are summarised in Figure 1.
FIGURE 1.

Behavioural results of the active oddball task. (a) Proportion of correct responses broken down by condition (first column) and by probability (second column). (b) Reaction times of correct responses to deviant events only. Error bars represent the SE, and grey points represent individual observations. For illustrative purposes, only the relevant portion of the y‐axis is shown in both plots (dashed lines indicate the discontinuity of the axis).
3.2. ERP results
In the passive oddball task, the presence of the MMN in the 110–225 ms time window was revealed by a significant difference between control and deviant ERPs for both the speech (one negative cluster encompassing the whole window duration, p < .001, 95% CI [.000 .001], d = 1.646) and the rotated speech condition (one negative cluster surfacing between 138 and 225 ms, p < .001, 95% [.000 .001], d = 1.741). Both clusters showed a topographical distribution coherent with that of the MMN, being mostly pronounced over frontal, fronto‐central and central channels. The test of the interaction did not reveal any difference between conditions in the 110–225 ms time window. An a‐posteriori analysis performed to test for potential differences in MMN latency between the speech and the rotated speech condition did not reveal any significant difference (see supporting information for further details).
The significant difference in the 350–800 ms between control and deviant ERPs confirmed the presence of a LDN component, which showed a stronger negativity in the deviant than in the control ERPs for both the speech (p < .001, 95% [.000 .002], d = 1.371) and the rotated speech condition (p < .001, 95% CI [.000 .001], d = 1.701), respectively, captured by negative clusters surfacing in the 350–800 and in the 460–800 ms time window. The test of the interaction showed a stronger LDN response in the 350–800 ms time window for the speech condition compared with the rotated speech condition, mostly distributed over right frontal electrodes as highlighted by the presence of a negative cluster in the 631–733 ms time window (p = .021, 95% CI [.014 .027], d = 1.710). ERP results for the passive oddball task are summarised in Figure 2 (see supporting information Figure S1 for additional descriptive plots).
FIGURE 2.
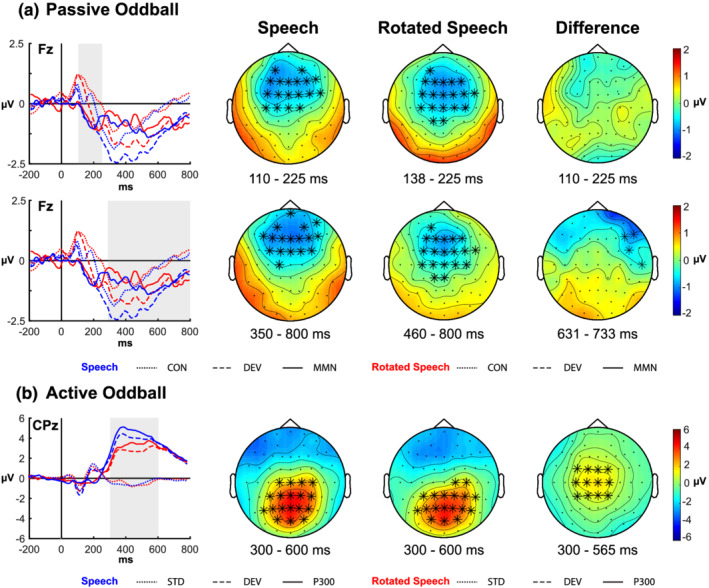
Event‐related potential (ERP) results. (a) Passive oddball task. The first column displays the ERPs for control (dotted lines), deviant (dashed lines) and differential waveforms (continuous lines) at a representative channel (Fz) for the speech (blue lines) and the rotated speech condition (red lines). The grey rectangles indicate the time window used in the analyses (mismatch negativity [MMN], first row; late discriminative negativity [LDN], second row). In the subsequent columns, topographies show the spatial distribution of the MMN (first row) and LDN (second row) in the time windows where significant differences emerged. The last column represents the voltage difference between conditions, calculated by subtracting the differential waveforms in the rotated speech condition from the ones calculated in the speech condition. Electrodes that were included in the clusters for more than 50% of the samples within the cluster time windows (reported below the topographies) are represented by black asterisk marks superimposed to the maps. (b) Active oddball task. The first column represents the ERPs for standard (dotted lines), deviant (dashed lines) and differential waveforms (continuous lines) at a representative channel (CPz) for the speech (blue lines) and the rotated speech condition (red lines). In the subsequent columns, topographies show the spatial distribution of the differential P300 waveforms, calculated by subtracting the standard ERP from the deviant ERP in the time windows where significant differences emerged for each condition. The last column represents the voltage difference between conditions, calculated by subtracting the differential waveforms in the rotated speech condition from the ones calculated in the speech condition. Electrodes are marked as in A.
In the active oddball task, a significant positive difference surfaced between standard and deviant ERPs in the P3b time window for the speech (p < .001, 95% CI [.000 .001], d = 2.070) and rotated speech condition (p < .001, 95% CI [.000 .001], d = 1.7891), captured by two positive clusters emerging in the 300–600 time window, broadly distributed over central, centro‐parietal, parietal and parieto‐occipital channels. The test of the interaction revealed a stronger P3b effect in the speech condition with respect to the rotated speech condition (p = .001, 95% [.000 .002], d = 1.490), highlighted by a positive cluster mostly distributed over central and centro‐parietal channels in the 300–565 ms time window. ERP results for the active oddball tasks are summarised in Figure 2 (see supporting information Figure S2 for additional descriptive plots).
3.3. Time‐frequency results
In the passive oddball task, the test on the interaction between the factors condition and probability within the beta band showed the presence of a negative cluster distributed on central, centro‐parietal and parietal electrode sites between 310 and 540 ms (p = .022, 95% CI [.015 .028], d = 1.748). As the upper limit of the p‐value 95% C.I. surpassed the critical alpha level of .025, the result of this test should not be considered statistically reliable. Therefore, the post‐hoc tests were conducted only for explorative purposes.
The source of this effect was attributed to a significant difference between deviant and control events surfaced in the rotated speech condition, as revealed by two spatiotemporally distinguishable clusters (see supporting information Figure S3). One positive cluster unfolded over left fronto‐central and central channels (p = .009, 95% CI [.005 .012], d = 1.559), ranging between 140 and 540 ms, apparently indexing both an early desynchronisation in control events and a later occurring synchronisation in deviant events (see Figure 3). A second positive cluster was detected (p = .017, 95% CI [.012 .022], d = 1.399) between 630 and 800 ms signalling another ERS in deviant events distributed over right parieto‐occipital and occipital channels. Instead, no significant differences between control and deviant events were found for the speech condition in the beta band.
FIGURE 3.

Time‐frequency results for the passive (first row) and the active (second row) oddball tasks. The time‐frequency power spectra show the power modulations (% change) characterising the differential event‐related spectral perturbations (ERSPs) for each condition (first and second columns) as well as the difference between them, corresponding to the interaction effect (third column). Spectra were obtained by averaging activity for the electrodes F5, F3, F1, Fz, F2, F4, F6, FC5, FC3, FC1, FCz, FC2, FC4, FC6, C5, C3, C1, Cz, C2, C4, C6, CP5, CP3, CP1, CPz, CP2, CP4, CP6, P5, P3, P1, Pz, P2, P4, P6, PO5, PO3, PO1, POz, PO2, PO4, PO6. In the plot for power spectra, black squares represent the temporal distribution of the significant clusters within theta (4–7 Hz) and beta (13–30 Hz) bands. The mean number of channels included in each cluster represented in the power spectra was calculated across all time samples, and only the time bins including at least half of the mean number of channels are enclosed in black squares. Topographies in the lower and higher row show the spatial distribution of theta and beta event‐related desynchronisations (ERDs)/event‐related synchronisations (ERSs) characterising the differential ERSPs for each condition (first and second columns) as well as the difference between them, corresponding to the interaction effect (third column). Electrodes that were included in the clusters for more than 50% of the samples within the cluster time windows (reported below each topography) are represented by black asterisk marks superimposed to the maps. Black squares on topographies represent the channels that were included in the averaged spectral plots.
No significant condition by probability interaction was found for the passive oddball task in the theta or in the alpha frequency bands.
For the active oddball task, the test of the interaction between condition and probability within the theta band revealed the presence of a positive cluster (p = .013, 95% CI [.009 .018], d = 1.160) surfacing between 320 and 800 ms on right central, centro‐parietal and parietal electrodes. Post‐hoc tests comparing standard and deviant events revealed that deviant events yielded a stronger theta synchronisation than control ones, as highlighted by reliable positive clusters both in the speech (p < .001, 95% CI[.000 .001], d = 1.274) and the rotated speech (p < .001, 95% CI [.000 .001], d = 1.2679) conditions, widely distributed from pre‐frontal to parietal electrodes in the 130–800 and in the 150–660 ms time windows, respectively (see supporting information Figure S4). Therefore, the interaction between condition and probability substantially reflected the stronger theta synchronisation occurring for deviant evets in the speech condition.
In the beta band, the same test revealed the presence of a positive cluster (p = .015, 95% CI [.010 .019], d = 1.247), between 590 and 800 ms across central, centro‐parietal and parietal electrodes. Post‐hoc tests comparing standard and deviant events within speech and rotated speech conditions revealed a stronger desynchronisation for deviant than for standard events, both in the speech (p = .010, 95% CI [.006 .014], d = 1.360) and the rotated speech condition (p = .004, 95% CI [.002 .007], d = 1.242), captured by negative clusters unfolding over central and centro‐parietal channels, in the 250–590 and in the 250–710 ms time windows, respectively. The speech condition was also characterised by a stronger beta synchronisation for deviant events with respect to standard ones, surfacing right after the earlier‐occurring desynchronisation and widely distributed over the scalp between 570 and 800 ms (p = .010, 95% CI [.006 .014], d = 1.154), which presumably induced the interaction effect (see supporting information Figure S5). No condition by probability interaction surfaced in the alpha frequency band. Results are summarised in Figure 3.
Finally, to isolate the contributions of phase‐ and non‐phase‐locked power to the significant theta and beta ERS found in the analysis of total power, an additional analysis showed that both theta and beta ERS effects reflected non‐phase‐locked oscillatory activity (see supporting information for further details). Therefore, the ERP and the time‐frequency results seem to reflect separate and possibly complementary facets of the cognitive phenomena under examination.
4. DISCUSSION
The aim of this EEG study was to understand whether listeners can pre‐attentively form phoneme‐invariant voice representations from constantly changing vowel stimuli. The same test was performed when using rotated speech stimuli, in order to clarify whether the phenomenon is restricted only to the speech domain. Secondly, through an active version of the task, we examined the influence of attentional focus on the stimuli with respect to the detection of changes in the talker's voice driven by pitch variations. On the basis of our results, we argue that listeners can form representations of abstract regularities in sounds via a domain‐general mechanism, as suggested by the comparable MMNs triggered by the speech and the rotated speech condition. Second, when the listener's attention is focused on sound features during the active oddball task, the extensive experience with speech and voices might lead to the activation of more efficient encoding strategies as suggested by stronger theta ERS for the speech condition. This in turn would mitigate the demand for cognitive resources needed to detect changes in the talker's voice indexed by pitch variations, as suggested by the larger amplitude P3b for the speech condition.
4.1. Passive oddball task
The ERP data showed that the MMN was clearly elicited with both speech and rotated speech stimuli, with no sizeable differences between these two conditions. Note that the experiment was designed so that the MMN could be triggered by the presentation of a deviant stimulus only if the preceding standard stimuli were grouped into an abstract representation of the invariant F0 despite the constant variations within F1 and F2. Compared with the studies in which pitch deviants are presented among identical standard stimuli (Aaltonen et al., 1994; Hsu et al., 2015; Lang, 1990), this study showed that listeners could track the changes within the pitch dimension while ignoring variations of formant frequencies, which hold a primary importance for phoneme categorisation and have been shown to reliably elicit an MMN (Dehaene‐Lambertz, 1997; Näätänen et al., 1997; Peltola et al., 2003).
In line with previous studies showing that listeners can track different regularities across multiple stimulus features at the same time (Huotilainen et al., 1993; Pakarinen et al., 2010), the elicitation of the MMN across both the speech and the rotated speech condition indicates that the cognitive system is able to represent abstract regularities via a domain‐general mechanism. By using this mechanism, the cognitive system can equally form talker‐invariant phoneme representations, as shown by previous studies (Eulitz & Lahiri, 2004; Jacobsen, Schröger, & Sussman, 2004, Jacobsen, Schröger, & Alter, 2004; Shestakova et al., 2002), and phoneme‐invariant voice representations, as suggested by our results.
It is reasonable to think that, during the extraction of pitch regularities, phonological information was not retained. In fact, the presence of phonological information should have yielded a stronger MMN for the speech condition. This was not the case, as the speech and the rotaed speech condition yielded comparable MMNs. However, the amplitude of MMN can reflect both acoustic and linguistic differences (Näätänen et al., 2007) between standard and deviant stimuli. To isolate the contribution of these two sources, previous studies (Christmann et al., 2014; Marklund et al., 2018) contrasted the MMNs generated by vowel contrasts in speech and rotated speech using the classic oddball paradigm. These studies showed a stronger MMN for speech than for rotated speech stimuli and suggested that such difference reflects the specific contribution of phonological information to the final amplitude. In our study, the comparable MMNs elicited in the speech and in the rotated speech condition might suggest that the mechanism driving the detection of deviant stimuli was able to separate phonological and vocal information to build representations of voices based on the regularity of F0.
Interestingly, the phonological/formant information presumably ignored by this early‐occurring mechanism may have been taken into account during later processes. In fact, within the passive oddball task, a sustained negativity surfaced right after the offset of the MMN, in a 350–800 ms time window and featuring a fronto‐central spatial distribution. We identified this sustained negativity as an instantiation of the LDN, an automatic response with an unsettled functional significance, which occasionally occurs after the MMN (Datta et al., 2010). The LDN has been consistently recorded in children (Cheour et al., 2001; Ervast et al., 2015; Shestakova et al., 2003) and less often in adults (Bishop et al., 2011; Mueller et al., 2008).
The interpretation of the sustained negativity as LDN may not be completely straightforward. The scarcity of studies conducted on adults, paired with sometimes inconsistent results, prevents the identification of clear‐cut spatiotemporal characteristics for this specific component (which has indeed been analysed in multiple time windows; e.g., 300–550 ms in Bishop et al., 2011; 350–600 ms in David et al., 2020; 425–475 in Honbolygó et al., 2017; 250–400 ms in Zachau et al., 2005). It is important to point out that the cluster‐based permutation approach we employed for statistical analyses warrants against strong conclusions on components onset and offset latencies (Sassenhagen & Draschkow, 2019), further complicating the comparison with previous studies. One alternative interpretation would be to consider this late component as a reorienting negativity (RON). However, the RON is usually recorded during active tasks following a P3a component (Horváth et al., 2009; Munka & Berti, 2006; Schröger & Wolff, 1998; Wetzel & Schröger, 2014). To understand if the P3a component was elicited in our experiments, we compared the amplitude of the ERP triggered by control events with the one elicited by deviant events in the passive oddball task via cluster‐based random permutations in the 250–350 ms time window (Comerchero & Polich, 1999; Friedman et al., 2001; Wronka et al., 2012), but we found no statistically significant differences in any of the conditions (all ps > .18). Thus, considering that the late component found in our experiments was highlighted with a passive oddball task and without a clear P3a component, the interpretation in term of a RON was discarded. While the interpretation of this late component as an LDN still warrants some caution, it seems the most plausible alternative.
In a study implementing the abstract‐feature oddball paradigm and simple tones as stimuli, Zachau et al. (2005) reported the presence of the LDN in adults following violations of abstract rules and suggested that the LDN is an index of a transfer mechanism supporting the formation of representations of sound regularities in memory. The authors suggest that this mechanism could provide the computational basis for the segmentation of speech signals, further clarifying the reasons for which the LDN is consistently found in children (Bishop et al., 2011), who are still developing linguistic abilities. This notion was further strengthened by similar results obtained by Liu et al. (2014) with consonant and lexical tone contrasts in pre‐school and school‐aged Mandarin speaking children. David et al. (2020) also reported a larger LDN in children with respect to adults, elicited by phonologically complex rather than simple multisyllabic non‐words. Although this transfer mechanism for regularities could be relevant for language learning, our findings together with previous studies (Zachau et al., 2005) suggest that it is not necessarily language‐specific.
Despite the activation of the transfer mechanism for regularities may not be restricted to the speech domain, it could still be modulated by the presence of meaningful phonological information. In fact, we found a stronger LDN for the speech condition, and the difference was mainly distributed over right frontal electrode sites. This effect does not stem from differences in terms of spectral complexity—speech and rotated speech are thought to be equally complex (Maier et al., 2011)—nor in terms of physical properties of speech and rotated speech stimuli, as the differential waveforms were calculated by subtracting the averaged ERPs of deviant events from the ERPs of physically identical control events. Therefore, this effect seems to be related to the presence of phonological information encoded in speech. If this effect is an actual index of a transfer mechanism for information subserving learning processes, we could speculate that, when hearing natural sounding voices from speech (i.e., containing meaningful phonological information), listeners may use the information about the voice to update their prototypical voice model. In fact, our cognitive system is thought to prototypically represent male and female voices and update those voice models throughout lifetime (Latinus et al., 2013; Petkov & Vuong, 2013; Yovel & Belin, 2013). This feature is critical for the interpretation of our results, in which there is a clear overlap between voice gender and voice identity. We implemented the contrast between voices as a contrast between voice gender in order to maximise the possibility that listeners perceived a change in the identity of the talker. While this issue might be of secondary relevance for the pre‐attentive abstraction processes, as it may rely on low‐level physical features in the signal, it may be of particular relevance for later stages in which the “content” (e.g., the talker's gender) of voice representations may influence the storage of information.
However, despite previous studies might provide sufficient information to interpret this result, considering the a‐posteriori nature of the analysis and the weak difference surfaced between speech and rotated speech conditions (upper limit of the p‐value 95% C.I. surpassed the critical alpha level of .025), the interpretation provided here only represents a tentative proposal.
4.2. Active oddball task
At a pre‐attentive level, abstract pitch/voice regularities seem to be easily extracted from sounds irrespectively of the presence of phonological information. In contrast, at an attentive level, it seems that information about regularities can be transferred to WM and matched to response categories more efficiently when phonological information is present. Consistently, in the active oddball task, participants performed better in the speech than in the rotated speech condition. Further, EEG data showed the elicitation of a clear P3b response, with a stronger amplitude for the speech condition. The P3b component is commonly thought to reflect a range of cognitive processes subserving the revision of a mental representation induced by incoming stimuli (Donchin, 1981): When new or target stimuli are detected, attentional processes are thought to update the stimulus representation held in WM (Polich, 2007). Additionally, previous studies have shown that the amplitude of the P3b component is also modulated by task difficulty, being lower in the context of higher demands, hence in the amount of cognitive and/or attentional resources required to revise mental representations (Kok, 2001; Polich, 1987, 2007). However, it is important to specify that, in our experiment, the amplitude of the P3b component could have been contaminated by motor‐related activity considering that the active oddball task involved a motor response from participants. In fact, Salisbury et al. (2001) showed that the amplitude of the P3b is smaller during a button press task with respect to silent‐count task, suggesting that in our active oddball experiment motor‐related activity contributed to an overall reduced P3b. Nonetheless, since the response modality was identical across conditions, both the speech and the rotated speech conditions were equally contaminated by motor‐related activity. Consequently, it is safe to assume that the source of the amplitude difference of the P3b between speech and rotated speech conditions does not stem from motor‐related activity.
Additionally, as shown in previous P300 studies (Başar‐Eroglu et al., 1992; Demiralp et al., 2001; Yordanova et al., 2000), an increased theta synchronisation emerged, both in the speech and in the rotated speech conditions, albeit enhanced in the former compared with the latter. Oscillatory activity within the theta band has a primary role in neurophysiological models of memory (Backus et al., 2016; Lisman & Buzsaki, 2008). Consequently, synchronisation within the theta band is commonly associated with WM capacity/load (Dong et al., 2015; Moran et al., 2010; Scharinger et al., 2017) and more specifically with the encoding (Klimesch, 1999) and retrieval processes (Bastiaansen et al., 2005; Klimesch et al., 2001). Thus, looking at behavioural and electrophysiological data together, it seems that detecting an interruption of the pitch/voice regularity required less cognitive resources when hearing speech.
One possibility is that listeners needed more cognitive resources for the acoustic analysis of the pitch dimension, given the smaller number of available cues to pitch changes in the rotated speech condition. In fact, despite spectral rotation preserves the pitch contour, it disrupts the relationship occurring between formant frequencies and pitch in natural speech (Assmann & Nearey, 2007). To this regard, enhanced theta ERS over frontal sites has also been linked to higher spectral quality, indicating that the quantity of available spectral information directly promotes speech intelligibility (Obleser & Weisz, 2012). Yet, in our experiment, the differences in theta ERS between speech and rotated speech condition begin to surface at ~300 ms over parietal and parieto‐occipital electrodes, suggesting that the source of the effect could be related to higher and later occurring levels of processing.
According to Paavilainen (2013), while at a pre‐attentive level, the auditory cortex automatically represents regularities about different acoustic features, at an attentive level high levels of accuracy in detecting deviant stimuli require an explicit awareness about the rules underlying standard versus deviant status of the stimulus. In our study, we made sure participants had explicit knowledge about the task structure and the stimuli by directly describing the active oddball paradigm and providing extensive practice. Despite this training, participants had life‐long experience with speech produced by male and female voices, but certainly not with rotated speech produced by “alien voices”. Relatedly, sound regularities appear to be extracted without a particular attentional focus (Batterink & Paller, 2019; Duncan & Theeuwes, 2020), but extensive experience with a specific auditory material may facilitate top‐down processing of the extracted regularities, especially with speech stimuli (Monte‐Ordoño & Toro, 2017; Sun et al., 2015). The specific functional role of experience in facilitating the deliberate processing of abstract regularities is not yet fully understood and has been linked with enhanced statistical learning abilities (Pesnot Lerousseau & Schön, 2021) or with the development of more efficient encoding strategies (Monte‐Ordoño & Toro, 2017). In our experiment, the enhanced theta ERS for the speech condition suggests that the presence of native phonemes and/or human‐like voices may have promoted a more efficient encoding strategy of the regularities. Relatedly, previous studies showed that enhanced theta ERS is associated with encoding efficiency and successful recall from memory (Khader et al., 2010; Klimesch et al., 1996; Mölle et al., 2002).
The consequences of this facilitation effect may also be tracked in the pattern of beta modulations found for the active task. Oscillatory activity in the beta band is thought to be tied to the status of a cognitive and/or perceptual set (Engel & Fries, 2010): When a task is being performed, and no sudden variation in the stimuli or in the task requests occurs, beta band activity is stable and signals the maintenance of the “status quo”. When an unexpected stimulus is presented, a beta ERD occurs and signals the disruption of cognitive/perceptual sets following exogenous bottom‐up sensory components. After an ERD, a subsequent beta ERS signals the re‐establishment of the previous cognitive sets.
In line with this interpretation, beta ERD associated with the presentation of deviant stimuli may index a disruption of the previous stable cognitive set in which several different instances of speech or rotated speech stimuli were being accumulated into one voice/pitch representation. While in the rotated speech condition beta ERD appeared to be longer‐lasting, in the speech condition, it was readily followed by a synchronisation. Qualitatively, a beta synchronisation with a similar spatial distribution seemed to emerge also for the rotated speech condition but later in time with respect to the speech condition (see supporting information Figure S3). This temporal dynamic might further suggest that the efficient encoding of regularities in speech also allowed for a faster re‐establishment of the cognitive set that characterised listeners' activity prior to the presentation of deviant events.
As previously mentioned with respect to the amplitude of the P3b, the power modulations recorded during the active oddball task are open to motor‐related contaminations, particularly with respect to beta band ERSPs. Self‐paced or triggered voluntary movements are in fact preceded by a beta ERD and readily followed by beta ERS (Bardouille & Bailey, 2019; Doyle et al., 2005; Pfurtscheller et al., 1998; Protzak & Gramann, 2021). Clearly, this pattern is similar to the one observed in our study, as both the speech and the rotated speech conditions of the active task were characterised by a beta ERD approximately starting before the mean RT. Notably, however, only the speech condition was also characterised by subsequent beta ERS. As for the ERP results, even if the modulations of beta power partially reflect motor‐related activity, it is safe to assume that the differences concerning beta ERS between conditions do not reflect motor‐related activity considering that the response modalities were equivalent across conditions.
Furthermore, it is worth mentioning that a previous study showed a stronger beta ERD for learned voices with respect to previously unheard voices emerging approximately between 300 and 400 ms after stimulus onset (Zäske et al., 2014). While it is difficult to compare this result with the one reported in the present study (as we did not implement any contrast between learned/familiar and unfamiliar voices), it would be interesting to understand whether the activity within the beta band reflects processes specifically related with voice familiarity or, more generally, with familiar stimuli beyond voices or speech tokens.
As a last note, it should be specified that in the present study only two voices were used as stimuli. Future studies may benefit from using a larger sample of voices to avoid possible speaker‐specific effects and to allow a broader generalisation of results.
5. CONCLUSION
In conclusion, we show that listeners pre‐attentively track pitch regularities by possibly using a domain‐general mechanism that encodes abstract representations in the context of constantly changing formant information and irrespectively of the presence of phonological information. Representations of regularities are then transferred to long‐term memory while encoding additional vocal information in the case of human‐like speech. At an attentive level, the presence of phonological information facilitates the use of the previously abstracted information, suggesting that the output of pre‐attentive abstraction mechanisms is not transferred to WM without effort. ERP and the time‐frequency results offer converging evidence that the source of the facilitation driven by the presence of phonological information may be provided by the extensive experience listeners have with speech and voices. This could provide listeners with more efficient encoding strategies which would need fewer cognitive resources to encode information.
Future studies could characterise in more detail the influence that the relationship between pitch and the formant structure may have on the formation of abstract voice representations, while also investigating the contribution that the use of meaning‐differing units (e.g., phonemes) might exert on the encoding strategies employed to parse the speech signal.
CONFLICT OF INTEREST
The authors declare that they have no known competing financial interests or personal relationships that could have appeared to influence the work reported in this paper.
1. PEER REVIEW
The peer review history for this article is available at https://publons.com/publon/10.1111/ejn.15730.
Supporting information
Figure S1. Differential waveforms of the ERPs for the passive oddball task for the speech (solid line) and the rotated speech (dashed line) calculated by subtracting deviant ERPs from control ERPs across all the electrode sites.
Figure S2. Standard and deviant ERPs for the active oddball task for the speech (solid line) and the rotated speech (dashed line) across all the electrode sites.
Figure S3. Topographies show the spatial distribution of beta ERDs/ERSs averaged in contiguous 100 ms time windows, characterising the ERSPs for Control and Deviant events (1st,2nd,4th,5th row) as well as the difference between them (3rd, 6th row) for the Rotated Speech (1st‐3rd row) and the Speech condition (4th–6th row) for the passive oddball task.
Figure S4. Topographies show the spatial distribution of theta ERDs/ERSs averaged in contiguous 100 ms time windows, characterising the ERSPs for Standard and Deviant events (1st,2nd,4th,5th row) as well as the difference between them (3rd, 6th row) for the Rotated Speech (1st‐3rd row) and the Speech condition (4th–6th row) for the active oddball task.
Figure S5. Topographies show the spatial distribution of beta ERDs/ERSs averaged in contiguous 100 ms time windows, characterising the ERSPs for Standard and Deviant events (1st,2nd,4th,5th row) as well as the difference between them (3rd, 6th row) for the Rotated Speech (1st‐3rd row) and the Speech condition (4th–6th row) for the active oddball task.
Table S1. F3, F4,HNR, Shimmer, Jitter values of the experimental stimuli for each talker and each condition.
Figure S6. Time‐Frequency results for the active oddball tasks of total power (1st row), non‐phase‐locked power (2nd row) and phase‐locked power. The time‐frequency power spectra show the power modulations (% change) characterising the differential ERSPs for each condition (1st and 2nd columns) as well as the difference between them, corresponding to the interaction effect (3rd column). Spectra were obtained by averaging activity for the electrodes F5, F3, F1, Fz, F2, F4, F6, FC5, FC3, FC1, FCz, FC2, FC4, FC6, C5, C3, C1, Cz, C2, C4, C6, CP5, CP3, CP1, CPz, CP2, CP4, CP6, P5, P3, P1, Pz, P2, P4, P6, PO5, PO3, PO1, POz, PO2, PO4, PO6. Black squares represent the temporal distribution of the significant clusters within theta (4–7 Hz) and beta (13–30 Hz) bands. The mean number of channels included in each cluster represented in the power spectra was calculated across all time samples and only the time bins including at least half of the mean number of channels are enclosed in black squares. Topographies in the lower and higher row show the spatial distribution of theta and beta ERDs/ERSs characterising the differential ERSPs for each condition (1st and 2nd columns) as well as the difference between them, corresponding to the interaction effect (3rd column). Electrodes that were included in the clusters for more than 50% of the samples within the cluster time windows (reported below each topography) are represented by black asterisk marks superimposed to the maps. Black squares on topographies represent the channels that were included in the averaged spectral plots.
ACKNOWLEDGEMENT
This study was conducted as part of the PhD project of the first author, funded by the University of Trento (Italy). Open Access Funding provided by Universita degli Studi di Trento within the CRUI‐CARE Agreement.
Di Dona, G. , Scaltritti, M. , & Sulpizio, S. (2022). Formant‐invariant voice and pitch representations are pre‐attentively formed from constantly varying speech and non‐speech stimuli. European Journal of Neuroscience, 56(3), 4086–4106. 10.1111/ejn.15730
Footnotes
Participants' musical experience was assessed with the Ollen Musical Sophistication Index (Ollen, 2006) in order to avoid confounds in the interpretation of possible amplitude modulation of the MMN component as pitch changes were shown to elicit stronger MMNs in musically trained listeners (Chandrasekaran et al., 2009). None of the participants was musically trained.
In the cited study (Kappenman et al., 2021), the measurement windows for the MMN and P300 were identified by cross‐validating the time windows generally reported in the literature with the results of a cluster‐based permutation analysis.
DATA AVAILABILITY STATEMENT
The experimental data of this study are publicly available online (https://osf.io/2pbmr/).
REFERENCES
- Aaltonen, O. , Eerola, O. , Lang, A. H. , Uusipaikka, E. , & Tuomainen, J. (1994). Automatic discrimination of phonetically relevant and irrelevant vowel parameters as reflected by mismatch negativity. The Journal of the Acoustical Society of America, 96(3), 1489–1493. 10.1121/1.410291 [DOI] [PubMed] [Google Scholar]
- Assmann, P. F. , & Nearey, T. M. (2007). Relationship between fundamental and formant frequencies in voice preference. The Journal of the Acoustical Society of America, 122(2), EL35–EL43. 10.1121/1.2719045 [DOI] [PubMed] [Google Scholar]
- Azadpour, M. , & Balaban, E. (2008). Phonological representations are unconsciously used when processing complex, non‐speech signals. PLoS ONE, 3(4), e1966. 10.1371/journal.pone.0001966 [DOI] [PMC free article] [PubMed] [Google Scholar]
- Backus, A. R. , Schoffelen, J.‐M. , Szebényi, S. , Hanslmayr, S. , & Doeller, C. F. (2016). Hippocampal‐prefrontal Theta oscillations support memory integration. Current Biology, 26(4), 450–457. 10.1016/j.cub.2015.12.048 [DOI] [PubMed] [Google Scholar]
- Bardouille, T. , & Bailey, L. (2019). Evidence for age‐related changes in sensorimotor neuromagnetic responses during cued button pressing in a large open‐access dataset. NeuroImage, 193, 25–34. 10.1016/j.neuroimage.2019.02.065 [DOI] [PubMed] [Google Scholar]
- Başar‐Eroglu, C. , Başar, E. , Demiralp, T. , & Schürmann, M. (1992). P300‐response: Possible psychophysiological correlates in delta and theta frequency channels. A review. International Journal of Psychophysiology, 13(2), 161–179. 10.1016/0167-8760(92)90055-G [DOI] [PubMed] [Google Scholar]
- Bastiaansen, M. C. M. , Van der Linden, M. , Keurs, M. t. , Dijkstra, T. , & Hagoort, P. (2005). Theta responses are involved in lexical—Semantic retrieval during language processing. Journal of Cognitive Neuroscience, 17(3), 530–541. 10.1162/0898929053279469 [DOI] [PubMed] [Google Scholar]
- Bates, D. , Maechler, M. , Bolker, B. , Walker, S. , Christensen, R. H. B. , Singmann, H. , Dai, B. , Grothendieck, G. , Green, P. , & Bolker, M. B. (2015). Package ‘lme4.’ Convergence, 12(1), 2. [Google Scholar]
- Batterink, L. J. , & Paller, K. A. (2019). Statistical learning of speech regularities can occur outside the focus of attention. Cortex, 115, 56–71. 10.1016/j.cortex.2019.01.013 [DOI] [PMC free article] [PubMed] [Google Scholar]
- Baumann, O. , & Belin, P. (2010). Perceptual scaling of voice identity: Common dimensions for different vowels and speakers. Psychological Research Psychologische Forschung, 74(1), 110–120. 10.1007/s00426-008-0185-z [DOI] [PubMed] [Google Scholar]
- Beauchemin, M. , De Beaumont, L. , Vannasing, P. , Turcotte, A. , Arcand, C. , Belin, P. , & Lassonde, M. (2006). Electrophysiological markers of voice familiarity. European Journal of Neuroscience, 23(11), 3081–3086. 10.1111/j.1460-9568.2006.04856.x [DOI] [PubMed] [Google Scholar]
- Belin, P. , Fecteau, S. , & Bédard, C. (2004). Thinking the voice: Neural correlates of voice perception. Trends in Cognitive Sciences, 8(3), 129–135. 10.1016/j.tics.2004.01.008 [DOI] [PubMed] [Google Scholar]
- Bell, A. J. , & Sejnowski, T. J. (1995). An Information‐Maximization Approach to Blind Separation and Blind Deconvolution. Neural Computation, 7(6), 1129–1159. 10.1162/neco.1995.7.6.1129 [DOI] [PubMed] [Google Scholar]
- Bendixen, A. , & Schröger, E. (2008). Memory trace formation for abstract auditory features and its consequences in different attentional contexts. Biological Psychology, 78(3), 231–241. 10.1016/j.biopsycho.2008.03.005 [DOI] [PubMed] [Google Scholar]
- Bishop, D. V. M. , Hardiman, M. J. , & Barry, J. G. (2011). Is auditory discrimination mature by middle childhood? A study using time‐frequency analysis of mismatch responses from 7 years to adulthood: Is auditory discrimination mature? Developmental Science, 14(2), 402–416. 10.1111/j.1467-7687.2010.00990.x [DOI] [PMC free article] [PubMed] [Google Scholar]
- Blesser, B. (1972). Speech perception under conditions of spectral transformation: I. Phonetic Characteristics. Journal of Speech and Hearing Research, 15(1), 5–41. 10.1044/jshr.1501.05 [DOI] [PubMed] [Google Scholar]
- Boersma, P. , & Weenink, D. (2018). Praat: Doing phonetics by computer (Version 6.0.49) [Computer software]. http://www.praat.org/
- Bonte, M. , Valente, G. , & Formisano, E. (2009). Dynamic and task‐dependent encoding of speech and voice by phase reorganization of cortical oscillations. Journal of Neuroscience, 29(6), 1699–1706. 10.1523/JNEUROSCI.3694-08.2009 [DOI] [PMC free article] [PubMed] [Google Scholar]
- Carral, V. , Huotilainen, M. , Ruusuvirta, T. , Fellman, V. , Näätänen, R. , & Escera, C. (2005). A kind of auditory ‘primitive intelligencealready present at birth. European Journal of Neuroscience, 21(11), 3201–3204. 10.1111/j.1460-9568.2005.04144.x [DOI] [PubMed] [Google Scholar]
- Chandrasekaran, B. , Krishnan, A. , & Gandour, J. (2009). Relative influence of musical and linguistic experience on early cortical processing of pitch contours. Brain and Language, 108(1), 1–9. 10.1016/j.bandl.2008.02.001 [DOI] [PMC free article] [PubMed] [Google Scholar]
- Cheour, M. , Korpilahti, P. , Martynova, O. , & Lang, A.‐H. (2001). Mismatch negativity and late discriminative negativity in investigating speech perception and learning in children and infants. Audiology and Neuro‐Otology, 6(1), 2–11. 10.1159/000046804 [DOI] [PubMed] [Google Scholar]
- Choudhury, N. A. , Parascando, J. A. , & Benasich, A. A. (2015). Effects of presentation rate and attention on auditory discrimination: A comparison of long‐latency auditory evoked potentials in school‐aged children and adults. PLoS ONE, 10(9), e0138160. 10.1371/journal.pone.0138160 [DOI] [PMC free article] [PubMed] [Google Scholar]
- Christmann, C. A. , Berti, S. , Steinbrink, C. , & Lachmann, T. (2014). Differences in sensory processing of German vowels and physically matched non‐speech sounds as revealed by the mismatch negativity (MMN) of the human event‐related brain potential (ERP). Brain and Language, 136, 8–18. 10.1016/j.bandl.2014.07.004 [DOI] [PubMed] [Google Scholar]
- Citherlet, D. , Boucher, O. , Tremblay, J. , Robert, M. , Gallagher, A. , Bouthillier, A. , Lepore, F. , & Nguyen, D. K. (2020). Spatiotemporal dynamics of auditory information processing in the insular cortex: An intracranial EEG study using an oddball paradigm. Brain Structure and Function, 225(5), 1537–1559. 10.1007/s00429-020-02072-z [DOI] [PubMed] [Google Scholar]
- Cohen, M. X. (2014). Analyzing Neural Time Series Data: Theory and Practice (p. 171). The MIT Press. 10.7551/mitpress/9609.001.0001 [DOI] [Google Scholar]
- Comerchero, M. D. , & Polich, J. (1999). P3a and P3b from typical auditory and visual stimuli. Clinical Neurophysiology, 110(1), 24–30. 10.1016/s0168-5597(98)00033-1 [DOI] [PubMed] [Google Scholar]
- Datta, H. , Shafer, V. L. , Morr, M. L. , Kurtzberg, D. , & Schwartz, R. G. (2010). Electrophysiological indices of discrimination of long‐duration, phonetically similar vowels in children with typical and atypical language development. Journal of Speech, Language, and Hearing Research, 53(3), 757–777. 10.1044/1092-4388(2009/08-0123) [DOI] [PubMed] [Google Scholar]
- David, C. , Roux, S. , Bonnet‐Brilhault, F. , Ferré, S. , & Gomot, M. (2020). Brain responses to change in phonological structures of varying complexity in children and adults. Psychophysiology, 57(9), e13621. 10.1111/psyp.13621 [DOI] [PubMed] [Google Scholar]
- Dehaene‐Lambertz, G. (1997). Electrophysiological correlates of categorical phoneme perception in adults. Neuroreport, 8(4), 919–924. 10.1097/00001756-199703030-00021 [DOI] [PubMed] [Google Scholar]
- Delorme, A. , & Makeig, S. (2004). EEGLAB: An open source toolbox for analysis of single‐trial EEG dynamics including independent component analysis. Journal of Neuroscience Methods, 134(1), 9–21. 10.1016/j.jneumeth.2003.10.009 [DOI] [PubMed] [Google Scholar]
- Demiralp, T. , Ademoglu, A. , Comerchero, M. , & Polich, J. (2001). Wavelet analysis of P3a and P3b. Brain Topography, 13(4), 251–267. 10.1023/A:1011102628306 [DOI] [PubMed] [Google Scholar]
- Donchin, E. (1981). Surprise! … surprise? Psychophysiology, 18(5), 493–513. 10.1111/j.1469-8986.1981.tb01815.x [DOI] [PubMed] [Google Scholar]
- Dong, S. , Reder, L. M. , Yao, Y. , Liu, Y. , & Chen, F. (2015). Individual differences in working memory capacity are reflected in different ERP and EEG patterns to task difficulty. Brain Research, 1616, 146–156. 10.1016/j.brainres.2015.05.003 [DOI] [PubMed] [Google Scholar]
- Doyle, L. M. F. , Yarrow, K. , & Brown, P. (2005). Lateralization of event‐related beta desynchronization in the EEG during pre‐cued reaction time tasks. Clinical Neurophysiology, 116(8), 1879–1888. 10.1016/j.clinph.2005.03.017 [DOI] [PubMed] [Google Scholar]
- Duncan, C. C. , Barry, R. J. , Connolly, J. F. , Fischer, C. , Michie, P. T. , Näätänen, R. , Polich, J. , Reinvang, I. , & Van Petten, C. (2009). Event‐related potentials in clinical research: Guidelines for eliciting, recording, and quantifying mismatch negativity, P300, and N400. Clinical Neurophysiology, 120(11), 1883–1908. 10.1016/j.clinph.2009.07.045 [DOI] [PubMed] [Google Scholar]
- Duncan, D. , & Theeuwes, J. (2020). Statistical learning in the absence of explicit top‐down attention. Cortex, 131, 54–65. 10.1016/j.cortex.2020.07.006 [DOI] [PubMed] [Google Scholar]
- Engel, A. K. , & Fries, P. (2010). Beta‐band oscillations—Signalling the status quo? Current Opinion in Neurobiology, 20(2), 156–165. 10.1016/j.conb.2010.02.015 [DOI] [PubMed] [Google Scholar]
- Ervast, L. , Hämäläinen, J. A. , Zachau, S. , Lohvansuu, K. , Heinänen, K. , Veijola, M. , Heikkinen, E. , Suominen, K. , Luotonen, M. , Lehtihalmes, M. , & Leppänen, P. H. T. (2015). Event‐related brain potentials to change in the frequency and temporal structure of sounds in typically developing 5–6‐year‐old children. International Journal of Psychophysiology, 98(3), 413–425. 10.1016/j.ijpsycho.2015.08.007 [DOI] [PubMed] [Google Scholar]
- Escera, C. , Leung, S. , & Grimm, S. (2014). Deviance detection based on regularity encoding along the auditory hierarchy: Electrophysiological evidence in humans. Brain Topography, 27(4), 527–538. 10.1007/s10548-013-0328-4 [DOI] [PubMed] [Google Scholar]
- Escera, C. , & Malmierca, M. S. (2014). The auditory novelty system: An attempt to integrate human and animal research: The auditory novelty system. Psychophysiology, 51(2), 111–123. 10.1111/psyp.12156 [DOI] [PubMed] [Google Scholar]
- Eulitz, C. , & Lahiri, A. (2004). Neurobiological evidence for abstract phonological representations in the mental lexicon during speech recognition. Journal of Cognitive Neuroscience, 16(4), 577–583. 10.1162/089892904323057308 [DOI] [PubMed] [Google Scholar]
- Friedman, D. , Cycowicz, Y. M. , & Gaeta, H. (2001). The novelty P3: an event‐related brain potential (ERP) sign of the brain’s evaluation of novelty. Neuroscience & Biobehavioral Reviews, 25(4), 355–373. 10.1016/s0149-7634(01)00019-7 [DOI] [PubMed] [Google Scholar]
- Fuentemilla, L. , Marco‐Pallarés, J. , Münte, T. F. , & Grau, C. (2008). Theta EEG Oscillatory Activity and Auditory Change Detection. Brain Research, 1220, 93–101. 10.1016/j.brainres.2007.07.079 [DOI] [PubMed] [Google Scholar]
- Garner, W. R. (2014). The processing of information and structure. Psychology Press. 10.4324/9781315802862 [DOI] [Google Scholar]
- Hewlett, N. , & Beck, J. M. (2013). An Introduction to the Science of Phonetics (pp. 145–164). Routledge. 10.4324/9780203053867 [DOI] [Google Scholar]
- Honbolygó, F. , Kolozsvári, O. , & Csépe, V. (2017). Processing of word stress related acoustic information: A multi‐feature MMN study. International Journal of Psychophysiology, 118, 9–17. 10.1016/j.ijpsycho.2017.05.009 [DOI] [PubMed] [Google Scholar]
- Horváth, J. , Roeber, U. , & Schröger, E. (2009). The utility of brief, spectrally rich, dynamic sounds in the passive oddball paradigm. Neuroscience Letters, 461(3), 262–265. 10.1016/j.neulet.2009.06.035 [DOI] [PubMed] [Google Scholar]
- Hsu, C.‐H. , Evans, J. P. , & Lee, C.‐Y. (2015). Brain responses to spoken F0 changes: Is H special? Journal of Phonetics, 51, 82–92. 10.1016/j.wocn.2015.02.003 [DOI] [Google Scholar]
- Hubbard, D. J. , & Assmann, P. F. (2013). Perceptual adaptation to gender and expressive properties in speech: The role of fundamental frequency. The Journal of the Acoustical Society of America, 133(4), 2367–2376. 10.1121/1.4792145 [DOI] [PubMed] [Google Scholar]
- Huotilainen, M. , llmoniemi, R. J. , Lavikainen, J. , Tiitinen, H. , Alho, K. , Sinkkonen, J. , Knuutila, J. , & Nä, R. aUtänen (1993). Interaction between representations of different features of auditory sensory memory. Neuroreport, 4(11), 1279–1281. 10.1097/00001756-199309000-00018 [DOI] [PubMed] [Google Scholar]
- Jacobsen, T. , Schröger, E. , & Alter, K. (2004). Pre‐attentive perception of vowel phonemes from variable speech stimuli. Psychophysiology, 41(4), 654–659. 10.1111/1469-8986.2004.00175.x [DOI] [PubMed] [Google Scholar]
- Jacobsen, T. , Schröger, E. , & Sussman, E. (2004). Pre‐attentive categorization of vowel formant structure in complex tones. Cognitive Brain Research, 20(3), 473–479. 10.1016/j.cogbrainres.2004.03.021 [DOI] [PubMed] [Google Scholar]
- Jensen, O. , & Tesche, C. D. (2002). Frontal theta activity in humans increases with memory load in a working memory task: Frontal theta increases with memory load. European Journal of Neuroscience, 15(8), 1395–1399. 10.1046/j.1460-9568.2002.01975.x [DOI] [PubMed] [Google Scholar]
- Jin, Y. , Díaz, B. , Colomer, M. , & Sebastián‐Gallés, N. (2014). Oscillation encoding of individual differences in speech perception. PLoS ONE, 9(7), e100901. 10.1371/journal.pone.0100901 [DOI] [PMC free article] [PubMed] [Google Scholar]
- Johnsrude, I. S. , Mackey, A. , Hakyemez, H. , Alexander, E. , Trang, H. P. , & Carlyon, R. P. (2013). Swinging at a Cocktail Party. Psychological Science, 24(10), 1995–2004. 10.1177/0956797613482467 [DOI] [PubMed] [Google Scholar]
- Justen, C. , & Herbert, C. (2018). The spatio‐temporal dynamics of deviance and target detection in the passive and active auditory oddball paradigm: A sLORETA study. BMC Neuroscience, 19(1), 25. 10.1186/s12868-018-0422-3 [DOI] [PMC free article] [PubMed] [Google Scholar]
- Kaganovich, N. , Francis, A. L. , & Melara, R. D. (2006). Electrophysiological evidence for early interaction between talker and linguistic information during speech perception. Brain Research, 1114(1), 161–172. 10.1016/j.brainres.2006.07.049 [DOI] [PubMed] [Google Scholar]
- Kappenman, E. S. , Farrens, J. L. , Zhang, W. , Stewart, A. X. , & Luck, S. J. (2021). ERP CORE: An open resource for human event‐related potential research. NeuroImage, 225, 117465. 10.1016/j.neuroimage.2020.117465 [DOI] [PMC free article] [PubMed] [Google Scholar]
- Khader, P. H. , Jost, K. , Ranganath, C. , & Rösler, F. (2010). Theta and alpha oscillations during working‐memory maintenance predict successful long‐term memory encoding. Neuroscience Letters, 468(3), 339–343. 10.1016/j.neulet.2009.11.028 [DOI] [PMC free article] [PubMed] [Google Scholar]
- Klimesch, W. , Doppelmayr, M. , Russegger, H. , & Pachinger, T. (1996). Theta band power in the human scalp EEG and the encoding of new information. Neuroreport, 7(7), 1235–1240. 10.1097/00001756-199605170-00002 [DOI] [PubMed] [Google Scholar]
- Klimesch, W. , Doppelmayr, M. , Stadler, W. , Pöllhuber, D. , Sauseng, P. , & Röhm, D. (2001). Episodic retrieval is reflected by a process specific increase in human electroencephalographic theta activity. Neuroscience Letters, 302(1), 49–52. 10.1016/S0304-3940(01)01656-1 [DOI] [PubMed] [Google Scholar]
- Klimesch, W. (1999). EEG alpha and theta oscillations reflect cognitive and memory performance: A review and analysis. Brain Research Reviews, 29(2–3), 169–195. 10.1016/S0165-0173(98)00056-3 [DOI] [PubMed] [Google Scholar]
- Ko, D. , Kwon, S. , Lee, G.‐T. , Im, C. H. , Kim, K. H. , & Jung, K.‐Y. (2012). Theta oscillation related to the auditory discrimination process in mismatch negativity: Oddball versus control paradigm. Journal of Clinical Neurology, 8(1), 35–42. 10.3988/jcn.2012.8.1.35 [DOI] [PMC free article] [PubMed] [Google Scholar]
- Koerner, T. K. , Zhang, Y. , Nelson, P. B. , Wang, B. , & Zou, H. (2016). Neural indices of phonemic discrimination and sentence‐level speech intelligibility in quiet and noise: A mismatch negativity study. Hearing Research, 339, 40–49. 10.1016/j.heares.2016.06.001 [DOI] [PubMed] [Google Scholar]
- Kok, A. (2001). On the utility of P3 amplitude as a measure of processing capacity. Psychophysiology, 38(3), 557–577. 10.1017/S0048577201990559 [DOI] [PubMed] [Google Scholar]
- Kolev, V. , Demiralp, T. , Yordanova, J. , Ademoglu, A. , & Isoglu‐Alkaç, Ü. (1997). Time–frequency analysis reveals multiple functional components during oddball P300. Neuroreport, 8(8), 2061–2065. 10.1097/00001756-199705260-00050 [DOI] [PubMed] [Google Scholar]
- Lang, H. , Nyrke, T. , Ek, M. , Aaltonen, O. K. , Raimo, I. , & Näätänen, R. (1990). Pitch discrimination performance and auditive event‐related potentials. In Psychophysiological Brain Research (Vol. 1, pp. 294–298). Tilburg University Press. [Google Scholar]
- Lass, N. J. , Hughes, K. R. , Bowyer, M. D. , Waters, L. T. , & Bourne, V. T. (1976). Speaker sex identification from voiced, whispered, and filtered isolated vowels. The Journal of the Acoustical Society of America, 59(3), 675–678. 10.1121/1.380917 [DOI] [PubMed] [Google Scholar]
- Latinus, M. , McAleer, P. , Bestelmeyer, P. E. G. , & Belin, P. (2013). Norm‐based coding of voice identity in human auditory cortex. Current Biology, 23(12), 1075–1080. 10.1016/j.cub.2013.04.055 [DOI] [PMC free article] [PubMed] [Google Scholar]
- Lavner, Y. , Rosenhouse, J. , & Gath, I. (2001). The prototype model in speaker identification by human listeners. International Journal of Speech Technology, 4(1), 63–74. 10.1023/A:1009656816383 [DOI] [Google Scholar]
- Li, X. , & Chen, Y. (2018). Unattended processing of hierarchical pitch variations in spoken sentences. Brain and Language, 183, 21–31. 10.1016/j.bandl.2018.05.004 [DOI] [PubMed] [Google Scholar]
- Lisman, J. , & Buzsaki, G. (2008). A neural coding scheme formed by the combined function of gamma and Theta oscillations. Schizophrenia Bulletin, 34(5), 974–980. 10.1093/schbul/sbn060 [DOI] [PMC free article] [PubMed] [Google Scholar]
- Liu, H.‐M. , Chen, Y. , & Tsao, F.‐M. (2014). Developmental changes in mismatch responses to mandarin consonants and lexical tones from early to middle childhood. PLoS ONE, 9(4), e95587. 10.1371/journal.pone.0095587 [DOI] [PMC free article] [PubMed] [Google Scholar]
- Lopez‐Calderon, J. , & Luck, S. J. (2014). ERPLAB: An open‐source toolbox for the analysis of event‐related potentials. Frontiers in Human Neuroscience, 8, 213. 10.3389/fnhum.2014.00213 [DOI] [PMC free article] [PubMed] [Google Scholar]
- Maier, J. X. , Di Luca, M. , & Noppeney, U. (2011). Audiovisual asynchrony detection in human speech. Journal of Experimental Psychology: Human Perception and Performance, 37(1), 245–256. 10.1037/a0019952 [DOI] [PubMed] [Google Scholar]
- Marklund, E. , Gustavsson, L. , Kallioinen, P. , & Schwarz, I.‐C. (2020). N1 repetition‐attenuation for acoustically variable speech and spectrally rotated speech. Frontiers in Human Neuroscience, 14, 534804. 10.3389/fnhum.2020.534804 [DOI] [PMC free article] [PubMed] [Google Scholar]
- Marklund, E. , Lacerda, F. , & Schwarz, I.‐C. (2018). Using rotated speech to approximate the acoustic mismatch negativity response to speech. Brain and Language, 176, 26–35. 10.1016/j.bandl.2017.10.006 [DOI] [PubMed] [Google Scholar]
- MATLAB . (2020). Version 9.9.0.1495850 (R2020b) Update 1. The MathWorks Inc. [Google Scholar]
- Mazaheri, A. , & Picton, T. W. (2005). EEG spectral dynamics during discrimination of auditory and visual targets. Cognitive Brain Research, 24(1), 81–96. 10.1016/j.cogbrainres.2004.12.013 [DOI] [PubMed] [Google Scholar]
- Mölle, M. , Marshall, L. , Fehm, H. L. , & Born, J. (2002). EEG theta synchronization conjoined with alpha desynchronization indicate intentional encoding: Intentional learning of words and faces. European Journal of Neuroscience, 15(5), 923–928. 10.1046/j.1460-9568.2002.01921.x [DOI] [PubMed] [Google Scholar]
- Monte‐Ordoño, J. , & Toro, J. M. (2017). Early positivity signals changes in an abstract linguistic pattern. PLoS ONE, 12(7), e0180727. 10.1371/journal.pone.0180727 [DOI] [PMC free article] [PubMed] [Google Scholar]
- Moran, R. J. , Campo, P. , Maestu, F. , Reilly, R. B. , Dolan, R. J. , & Strange, B. A. (2010). Peak frequency in the theta and alpha bands correlates with human working memory capacity. Frontiers in Human Neuroscience, 4, 200. 10.3389/fnhum.2010.00200 [DOI] [PMC free article] [PubMed] [Google Scholar]
- Mueller, V. , Brehmer, Y. , Von Oertzen, T. , Li, S.‐C. , & Lindenberger, U. (2008). Electrophysiological correlates of selective attention: A lifespan comparison. BMC Neuroscience, 9(1), 1–21. 10.1186/1471-2202-9-18 [DOI] [PMC free article] [PubMed] [Google Scholar]
- Munka, L. , & Berti, S. (2006). Examining task‐dependencies of different attentional processes as reflected in the P3a and reorienting negativity components of the human event‐related brain potential. Neuroscience Letters, 396(3), 177–181. 10.1016/j.neulet.2005.11.035 [DOI] [PubMed] [Google Scholar]
- Näätänen, R. , Paavilainen, P. , Rinne, T. , & Alho, K. (2007). The mismatch negativity (MMN) in basic research of central auditory processing: A review. Clinical Neurophysiology, 118(12), 2544–2590. 10.1016/j.clinph.2007.04.026 [DOI] [PubMed] [Google Scholar]
- Näätänen, R. , Lehtokoski, A. , Lennes, M. , Cheour, M. , Huotilainen, M. , Iivonen, A. , Vainio, M. , Alku, P. , Ilmoniemi, R. J. , Luuk, A. , Allik, J. , Sinkkonen, J. , & Alho, K. (1997). Language‐specific phoneme representations revealed by electric and magnetic brain responses. Nature, 385(6615), 432–434. 10.1038/385432a0 [DOI] [PubMed] [Google Scholar]
- Norris, D. , & McQueen, J. M. (2008). Shortlist B: A Bayesian model of continuous speech recognition. Psychological Review, 115(2), 357–395. 10.1037/0033-295X.115.2.357 [DOI] [PubMed] [Google Scholar]
- Nygaard, L. C. , Sommers, M. S. , & Pisoni, D. B. (1994). Speech Perception as a Talker‐Contingent Process. Psychological Science, 5(1), 42–46. 10.1111/j.1467-9280.1994.tb00612.x [DOI] [PMC free article] [PubMed] [Google Scholar]
- Obleser, J. , & Weisz, N. (2012). Suppressed alpha oscillations predict intelligibility of speech and its acoustic details. Cerebral Cortex, 22(11), 2466–2477. 10.1093/cercor/bhr325 [DOI] [PMC free article] [PubMed] [Google Scholar]
- Ollen, J. E. (2006). A Criterion‐Related Validity Test of Selected Indicators of Musical Sophistication Using Expert Ratings. The Ohio State University. [Google Scholar]
- Öniz, A. , & Başar, E. (2009). Prolongation of alpha oscillations in auditory oddball paradigm. International Journal of Psychophysiology, 71(3), 235–241. 10.1016/j.ijpsycho.2008.10.003 [DOI] [PubMed] [Google Scholar]
- Oostenveld, R. , Fries, P. , Maris, E. , & Schoffelen, J.‐M. (2011). FieldTrip: Open source software for advanced analysis of MEG, EEG, and invasive electrophysiological data. Computational Intelligence and Neuroscience, 2011, 1–9. 10.1155/2011/156869 [DOI] [PMC free article] [PubMed] [Google Scholar]
- Paavilainen, P. (2013). The mismatch‐negativity (MMN) component of the auditory event‐related potential to violations of abstract regularities: A review. International Journal of Psychophysiology, 88(2), 109–123. 10.1016/j.ijpsycho.2013.03.015 [DOI] [PubMed] [Google Scholar]
- Pakarinen, S. , Huotilainen, M. , & Näätänen, R. (2010). The mismatch negativity (MMN) with no standard stimulus. Clinical Neurophysiology, 121(7), 1043–1050. 10.1016/j.clinph.2010.02.009 [DOI] [PubMed] [Google Scholar]
- Peltola, M. S. , Kujala, T. , Tuomainen, J. , Ek, M. , Aaltonen, O. , & Näätänen, R. (2003). Native and foreign vowel discrimination as indexed by the mismatch negativity (MMN) response. Neuroscience Letters, 352(1), 25–28. 10.1016/j.neulet.2003.08.013 [DOI] [PubMed] [Google Scholar]
- Pesnot Lerousseau, J. , & Schön, D. (2021). Musical expertise is associated with improved neural statistical learning in the auditory domain. Cerebral Cortex, 31(11), 4877–4890. 10.1093/cercor/bhab128 [DOI] [PubMed] [Google Scholar]
- Petkov, C. I. , & Vuong, Q. C. (2013). Neuronal coding: The value in having an average voice. Current Biology, 23(12), R521–R523. 10.1016/j.cub.2013.04.077 [DOI] [PubMed] [Google Scholar]
- Pfurtscheller, G. , Zalaudek, K. , & Neuper, C. (1998). Event‐related beta synchronization after wrist, finger and thumb movement. Electroencephalography and Clinical Neurophysiology/Electromyography and Motor Control, 109(2), 154–160. 10.1016/S0924-980X(97)00070-2 [DOI] [PubMed] [Google Scholar]
- Pion‐Tonachini, L. , Kreutz‐Delgado, K. , & Makeig, S. (2019). ICLabel: An automated electroencephalographic independent component classifier, dataset, and website. NeuroImage, 198, 181–197. 10.1016/j.neuroimage.2019.05.026 [DOI] [PMC free article] [PubMed] [Google Scholar]
- Polich, J. (1987). Task difficulty, probability, and inter‐stimulus interval as determinants of P300 from auditory stimuli. Electroencephalography and Clinical Neurophysiology/Evoked Potentials Section, 68(4), 311–320. 10.1016/0168-5597(87)90052-9 [DOI] [PubMed] [Google Scholar]
- Polich, J. (2007). Updating P300: An integrative theory of P3a and P3b. Clinical Neurophysiology, 118(10), 2128–2148. 10.1016/j.clinph.2007.04.019 [DOI] [PMC free article] [PubMed] [Google Scholar]
- Protzak, J. , & Gramann, K. (2021). EEG beta‐modulations reflect age‐specific motor resource allocation during dual‐task walking. Scientific Reports, 11(1), 16110. 10.1038/s41598-021-94874-2 [DOI] [PMC free article] [PubMed] [Google Scholar]
- Pulvermüller, F. , Shtyrov, Y. , Kujala, T. , & Näätänen, R. (2004). Word‐specific cortical activity as revealed by the mismatch negativity. Psychophysiology, 41(1), 106–112. 10.1111/j.1469-8986.2003.00135.x [DOI] [PubMed] [Google Scholar]
- Pulvermüller, F. , Kujala, T. , Shtyrov, Y. , Simola, J. , Tiitinen, H. , Alku, P. , Alho, K. , Martinkauppi, S. , Ilmoniemi, R. J. , & Näätänen, R. (2001). Memory traces for words as revealed by the mismatch negativity. NeuroImage, 14(3), 607–616. 10.1006/nimg.2001.0864 [DOI] [PubMed] [Google Scholar]
- R Core Team . (2013). R: A language and environment for statistical computing.
- Saarinen, J. , Paavilainen, P. , Schöger, E. , Tervaniemi, M. , & Näätänen, R. (1992). Representation of abstract attributes of auditory stimuli in the human brain. Neuroreport, 3(12), 1149–1151. 10.1097/00001756-199212000-00030 [DOI] [PubMed] [Google Scholar]
- Salisbury, D. F. , Rutherford, B. , Shenton, M. E. , & McCarley, R. W. (2001). Button‐pressing affects P300 amplitude and scalp topography. Clinical Neurophysiology, 112(9), 1676–1684. 10.1016/S1388-2457(01)00607-1 [DOI] [PMC free article] [PubMed] [Google Scholar]
- Sassenhagen, J. , & Draschkow, D. (2019). Cluster‐based permutation tests of MEG/EEG data do not establish significance of effect latency or location. Psychophysiology, 56(6), e13335. Portico. 10.1111/psyp.13335 [DOI] [PubMed] [Google Scholar]
- Scharinger, C. , Soutschek, A. , Schubert, T. , & Gerjets, P. (2017). Comparison of the working memory load in N‐Back and working memory span tasks by means of EEG frequency band power and P300 amplitude. Frontiers in Human Neuroscience, 11, 6. 10.3389/fnhum.2017.00006 [DOI] [PMC free article] [PubMed] [Google Scholar]
- Scharinger, M. , Monahan, P. J. , & Idsardi, W. J. (2011). You had me at “hello”: Rapid extraction of dialect information from spoken words. NeuroImage, 56(4), 2329–2338. 10.1016/j.neuroimage.2011.04.007 [DOI] [PMC free article] [PubMed] [Google Scholar]
- Schneider, E. , & Zuccoloto, A. (2007). E‐prime 2.0 [Computer Software]. Psychological Software Tools. [Google Scholar]
- Schröger, E. , & Wolff, C. (1998). Behavioral and electrophysiological effects of task‐irrelevant sound change: a new distraction paradigm. Cognitive Brain Research, 7(1), 71–87. 10.1016/s0926-6410(98)00013-5 [DOI] [PubMed] [Google Scholar]
- Scott, S. K. (2000). Identification of a pathway for intelligible speech in the left temporal lobe. Brain, 123(12), 2400–2406. 10.1093/brain/123.12.2400 [DOI] [PMC free article] [PubMed] [Google Scholar]
- Shestakova, A. , Brattico, E. , Huotilainen, M. , Galunov, V. , Soloviev, A. , Sams, M. , Ilmoniemi, R. J. , & Näätänen, R. (2002). Abstract phoneme representations in the left temporal cortex: Magnetic mismatch negativity study. Neuroreport, 13(14), 1813–1816. 10.1097/00001756-200210070-00025 [DOI] [PubMed] [Google Scholar]
- Shestakova, A. , Huotilainen, M. , Čeponien, R. , & Cheour, M. (2003). Event‐related potentials associated with second language learning in children. Clinical Neurophysiology, 114(8), 1507–1512. 10.1016/S1388-2457(03)00134-2 [DOI] [PubMed] [Google Scholar]
- Sidtis, D. V. L. , & Zäske, R. (2021). Who We Are: Signaling Personal Identity in Speech. In Pardo J. S., Nygaard L. C., Remez R. E., & Pisoni D. B. (Eds.), The Handbook of Speech Perception (1st ed., pp. 365–397). Wiley. 10.1002/9781119184096.ch14 [DOI] [Google Scholar]
- Sjerps, M. J. , Mitterer, H. , & McQueen, J. M. (2011). Constraints on the processes responsible for the extrinsic normalization of vowels. Attention, Perception, & Psychophysics, 73(4), 1195–1215. 10.3758/s13414-011-0096-8 [DOI] [PMC free article] [PubMed] [Google Scholar]
- Skuk, V. G. , & Schweinberger, S. R. (2014). Influences of fundamental frequency, formant frequencies, aperiodicity, and Spectrum level on the perception of voice gender. Journal of Speech, Language, and Hearing Research, 57(1), 285–296. 10.1044/1092-4388(2013/12-0314 [DOI] [PubMed] [Google Scholar]
- Spencer, K. M. , & Polich, J. (1999). Poststimulus EEG spectral analysis and P300: Attention, task, and probability. Psychophysiology, 36(2), 220–232. 10.1111/1469-8986.3620220 [DOI] [PubMed] [Google Scholar]
- Steinmetzger, K. , & Rosen, S. (2017). Effects of acoustic periodicity and intelligibility on the neural oscillations in response to speech. Neuropsychologia, 95, 173–181. 10.1016/j.neuropsychologia.2016.12.003 [DOI] [PubMed] [Google Scholar]
- Strauß, A. , Kotz, S. A. , Scharinger, M. , & Obleser, J. (2014). Alpha and theta brain oscillations index dissociable processes in spoken word recognition. NeuroImage, 97, 387–395. 10.1016/j.neuroimage.2014.04.005 [DOI] [PubMed] [Google Scholar]
- Sun, Y. , Giavazzi, M. , Adda‐Decker, M. , Barbosa, L. S. , Kouider, S. , Bachoud‐Lévi, A.‐C. , Jacquemot, C. , & Peperkamp, S. (2015). Complex linguistic rules modulate early auditory brain responses. Brain and Language, 149, 55–65. 10.1016/j.bandl.2015.06.009 [DOI] [PubMed] [Google Scholar]
- Szalárdy, O. , Tóth, B. , Farkas, D. , Hajdu, B. , Orosz, G. , & Winkler, I. (2021). Who said what? The effects of speech tempo on target detection and information extraction in a multi‐talker situation: An ERP and functional connectivity study. Psychophysiology, 58(3), e13747. 10.1111/psyp.13747 [DOI] [PubMed] [Google Scholar]
- Titova, N. , & Näätänen, R. (2001). Preattentive voice discrimination by the human brain as indexed by the mismatch negativity. Neuroscience Letters, 308(1), 63–65. 10.1016/S0304-3940(01)01970-X [DOI] [PubMed] [Google Scholar]
- Tuninetti, A. , Chládková, K. , Peter, V. , Schiller, N. O. , & Escudero, P. (2017). When speaker identity is unavoidable: Neural processing of speaker identity cues in natural speech. Brain and Language, 174, 42–49. 10.1016/j.bandl.2017.07.001 [DOI] [PubMed] [Google Scholar]
- Van Berkum, J. J. A. , Van den Brink, D. , Tesink, C. M. J. Y. , Kos, M. , & Hagoort, P. (2008). The neural integration of speaker and message. Journal of Cognitive Neuroscience, 20(4), 580–591. 10.1162/jocn.2008.20054 [DOI] [PubMed] [Google Scholar]
- Van Lancker, D. , Kreiman, J. , & Emmorey, K. (1985). Familiar voice recognition: Patterns and parameters part I: Recognition of backward voices. Journal of Phonetics, 13(1), 19–38. 10.1016/S0095-4470(19)30723-5 [DOI] [Google Scholar]
- Virtala, P. , Berg, V. , Kivioja, M. , Purhonen, J. , Salmenkivi, M. , Paavilainen, P. , & Tervaniemi, M. (2011). The preattentive processing of major vs. minor chords in the human brain: An event‐related potential study. Neuroscience Letters, 487(3), 406–410. 10.1016/j.neulet.2010.10.066 [DOI] [PubMed] [Google Scholar]
- Wetzel, N. , & Schröger, E. (2014). On the development of auditory distraction: A review. PsyCh Journal, 3(1), 72–91. 10.1002/pchj.49 [DOI] [PubMed] [Google Scholar]
- Wöstmann, M. , Lim, S.‐J. , & Obleser, J. (2017). The human neural alpha response to speech is a proxy of attentional control. Cerebral Cortex, 27(6), 3307–3317. 10.1093/cercor/bhx074 [DOI] [PubMed] [Google Scholar]
- Wronka, E. A. , Kaiser, J. , & Coenen, A. M. (2008). The auditory P3 from passive and active three‐stimulus oddball paradigm. Acta Neurobiologiae Experimentalis, 68, 362–372. [DOI] [PubMed] [Google Scholar]
- Wronka, E. A. , Kaiser, J. , & Coenen, A. M. L. (2012). Neural generators of the auditory evoked potential components P3a and P3b. Acta Neurobiologiae Experimentalis, 72(1), 51–64. [DOI] [PubMed] [Google Scholar]
- Yordanova, J. , Devrim, M. , Kolev, V. , Ademoglu, A. , & Demiralp, T. (2000). Multiple time‐frequency components account for the complex functional reactivity of P300. Neuroreport, 11(5), 1097–1103. 10.1097/00001756-200004070-00038 [DOI] [PubMed] [Google Scholar]
- Yovel, G. , & Belin, P. (2013). A unified coding strategy for processing faces and voices. Trends in Cognitive Sciences, 17(6), 263–271. 10.1016/j.tics.2013.04.004 [DOI] [PMC free article] [PubMed] [Google Scholar]
- Zachau, S. , Rinker, T. , Körner, B. , Kohls, G. , Maas, V. , Hennighausen, K. , & Schecker, M. (2005). Extracting rules: Early and late mismatch negativity to tone patterns. Neuroreport, 16(18) Retrieved from, 2015–2019. https://journals.lww.com/neuroreport/Fulltext/2005/12190/Extracting_rules__early_and_late_mismatch.9.aspx, 10.1097/00001756-200512190-00009 [DOI] [PubMed] [Google Scholar]
- Zarate, J. M. , Tian, X. , Woods, K. J. P. , & Poeppel, D. (2015). Multiple levels of linguistic and paralinguistic features contribute to voice recognition. Scientific Reports, 5(1). 10.1038/srep11475 [DOI] [PMC free article] [PubMed] [Google Scholar]
- Zäske, R. , Volberg, G. , Kovacs, G. , & Schweinberger, S. R. (2014). Electrophysiological correlates of voice learning and recognition. Journal of Neuroscience, 34(33), 10821–10831. 10.1523/JNEUROSCI.0581-14.2014 [DOI] [PMC free article] [PubMed] [Google Scholar]
Associated Data
This section collects any data citations, data availability statements, or supplementary materials included in this article.
Supplementary Materials
Figure S1. Differential waveforms of the ERPs for the passive oddball task for the speech (solid line) and the rotated speech (dashed line) calculated by subtracting deviant ERPs from control ERPs across all the electrode sites.
Figure S2. Standard and deviant ERPs for the active oddball task for the speech (solid line) and the rotated speech (dashed line) across all the electrode sites.
Figure S3. Topographies show the spatial distribution of beta ERDs/ERSs averaged in contiguous 100 ms time windows, characterising the ERSPs for Control and Deviant events (1st,2nd,4th,5th row) as well as the difference between them (3rd, 6th row) for the Rotated Speech (1st‐3rd row) and the Speech condition (4th–6th row) for the passive oddball task.
Figure S4. Topographies show the spatial distribution of theta ERDs/ERSs averaged in contiguous 100 ms time windows, characterising the ERSPs for Standard and Deviant events (1st,2nd,4th,5th row) as well as the difference between them (3rd, 6th row) for the Rotated Speech (1st‐3rd row) and the Speech condition (4th–6th row) for the active oddball task.
Figure S5. Topographies show the spatial distribution of beta ERDs/ERSs averaged in contiguous 100 ms time windows, characterising the ERSPs for Standard and Deviant events (1st,2nd,4th,5th row) as well as the difference between them (3rd, 6th row) for the Rotated Speech (1st‐3rd row) and the Speech condition (4th–6th row) for the active oddball task.
Table S1. F3, F4,HNR, Shimmer, Jitter values of the experimental stimuli for each talker and each condition.
Figure S6. Time‐Frequency results for the active oddball tasks of total power (1st row), non‐phase‐locked power (2nd row) and phase‐locked power. The time‐frequency power spectra show the power modulations (% change) characterising the differential ERSPs for each condition (1st and 2nd columns) as well as the difference between them, corresponding to the interaction effect (3rd column). Spectra were obtained by averaging activity for the electrodes F5, F3, F1, Fz, F2, F4, F6, FC5, FC3, FC1, FCz, FC2, FC4, FC6, C5, C3, C1, Cz, C2, C4, C6, CP5, CP3, CP1, CPz, CP2, CP4, CP6, P5, P3, P1, Pz, P2, P4, P6, PO5, PO3, PO1, POz, PO2, PO4, PO6. Black squares represent the temporal distribution of the significant clusters within theta (4–7 Hz) and beta (13–30 Hz) bands. The mean number of channels included in each cluster represented in the power spectra was calculated across all time samples and only the time bins including at least half of the mean number of channels are enclosed in black squares. Topographies in the lower and higher row show the spatial distribution of theta and beta ERDs/ERSs characterising the differential ERSPs for each condition (1st and 2nd columns) as well as the difference between them, corresponding to the interaction effect (3rd column). Electrodes that were included in the clusters for more than 50% of the samples within the cluster time windows (reported below each topography) are represented by black asterisk marks superimposed to the maps. Black squares on topographies represent the channels that were included in the averaged spectral plots.
Data Availability Statement
The experimental data of this study are publicly available online (https://osf.io/2pbmr/).