

Abstract
Aims
Genotype and left ventricular scar on cardiac magnetic resonance (CMR) are increasingly recognized as risk markers for adverse outcomes in non‐ischaemic dilated cardiomyopathy (DCM). We investigated the combined influence of genotype and late gadolinium enhancement (LGE) in assessing prognosis in a large cohort of patients with DCM.
Methods and results
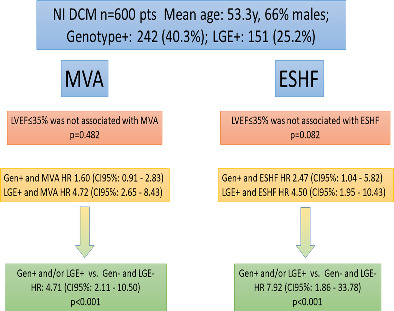
Outcomes of 600 patients with DCM (53.3 ± 14.1 years, 66% male) who underwent clinical CMR and genetic testing were retrospectively analysed. The primary endpoints were end‐stage heart failure (ESHF) and malignant ventricular arrhythmias (MVA). During a median follow‐up of 2.7 years (interquartile range 1.3–4.9), 24 (4.00%) and 48 (8.00%) patients had ESHF and MVA, respectively. In total, 242 (40.3%) patients had pathogenic/likely pathogenic variants (positive genotype) and 151 (25.2%) had LGE. In survival analysis, positive LGE was associated with MVA and ESHF (both, p < 0.001) while positive genotype was associated with ESHF (p = 0.034) but not with MVA (p = 0.102). Classification of patients according to genotype (G+/G−) and LGE presence (L+/L−) revealed progressively increasing events across L−/G−, L−/G+, L+/G− and L+/G+ groups and resulted in optimized MVA and ESHF prediction (p < 0.001 and p = 0.001, respectively). Hazard ratios for MVA and ESHF in patients with either L+ or G+ compared with those with L−/G− were 4.71 (95% confidence interval: 2.11–10.50, p < 0.001) and 7.92 (95% confidence interval: 1.86–33.78, p < 0.001), respectively.
Conclusion
Classification of patients with DCM according to genotype and LGE improves MVA and ESHF prediction. Scar assessment with CMR and genotyping should be considered to select patients for primary prevention implantable cardioverter‐defibrillator placement.
Keywords: Cardiac magnetic resonance, Dilated cardiomyopathy, End‐stage heart failure, Genotype, Late gadolinium enhancement, Sudden cardiac death
Non‐ischaemic dilated cardiomyopathy (NI DCM) patients with positive genotype and/or late gadolinium enhancement (LGE) show increased risk of ventricular arrhythmias and end‐stage heart failure (ESHF) during follow‐up. CI, confidence interval; HR, hazard ratio; LVEF, left ventricular ejection fraction; MVA, malignant ventricular arrhythmia.
Introduction
Non‐ischaemic dilated cardiomyopathy (DCM) is characterized by left ventricular (LV) enlargement and systolic dysfunction that cannot be attributed to abnormal loading conditions or coronary artery disease. It has an estimated prevalence of 1:250 to 1:2500 and is the most frequent cause of heart failure in the young and the leading cause of heart transplantation. Moreover, DCM constitutes a common substrate for ventricular arrhythmias and is associated with a higher risk of sudden cardiac death (SCD). 1 , 2
Recent studies suggest a genetic origin for DCM in ∼40% of patients, and several genotypes have been associated with increased arrhythmogenicity or progression to end‐stage heart failure (ESHF). 3 , 4 , 5 , 6 , 7 , 8
Myocardial scarring determined by late gadolinium enhancement (LGE) on cardiac magnetic resonance (CMR) imaging can be observed in 25%–40% of patients with DCM and its presence has emerged as a strong risk marker for all‐cause mortality and ventricular arrhythmias. 9 , 10 , 11
Despite advances in the identification of new risk markers, assessing prognosis in patients with DCM remains challenging, and clinical decisions about treatment options, for example, eligibility for implantable cardioverter‐defibrillator (ICD) therapy, are largely based on the presence of significant LV dysfunction. 12 , 13 LV ejection fraction (LVEF) has, however, limited sensitivity and specificity in predicting clinical events in DCM, and the majority of SCD events (in absolute numbers) in this setting occur in patients with LVEF ≥35%. 11 , 14 Furthermore, emerging data from a randomized controlled trial have questioned the clinical usefulness of ICD implantation in patients with non‐ischaemic DCM and LVEF ≤35%. 15 Thus, there is a need for more granularity and refinement in risk stratification in patients with DCM. With this background, the present study investigated the combined influence of genotype and myocardial scar on prognosis in a large cohort of patients with DCM.
Methods
Study design
This is a multicentre, retrospective, observational, and longitudinal study of consecutive genetically‐evaluated patients with DCM recruited from 20 Spanish hospitals. DCM was defined as the presence of LVEF <50% on echocardiogram at diagnosis in the absence of abnormal loading conditions, coronary artery disease (by coronary angiography or computed tomography), excessive alcohol consumption, or any other identifiable cause. 16 Only patients with age ≥15 years at the time of diagnosis were included. The study was approved by the Hospital Universitario Puerta de Hierro ethics committee and conformed to the principles of the Helsinki Declaration. The authors from each participating centre guarantee the integrity of data.
Subjects
Participating individuals were consecutive patients with DCM who had been genetically tested using targeted next‐generation sequencing (NGS) panels at participating institutions or at an accredited genetics laboratory between 2015 and 2021, and who had CMR performed at the participating institutions. Although gene panels could differ in the number of genes examined, all the genes classified as having definitive or strong evidence of implication in DCM according to the ClinGen DCM gene curation expert panel were evaluated in all cases except for FLNC that was evaluated in 88% of individuals. 17 Additionally, we included consecutive relatives with DCM who had CMR performed at participating institutions and who harboured a pathogenic or likely pathogenic genetic variant previously identified in a DCM proband in their family with a NGS panel including >50 cardiomyopathy‐associated genes.
Demographics, symptoms, 12‐lead electrocardiogram, and transthoracic echocardiogram data were collected from clinical records at each participating centre using uniform methodology. DCM was defined as familial if one or more relatives (in addition to the proband) had DCM during life or at postmortem examination; sporadic case was used to indicate that there was no family history of DCM, and no cases of DCM were detected during familial screening in case it was performed. Infiltrative cardiomyopathies were excluded if phenotype was suggestive.
Cardiac magnetic resonance
Patients underwent CMR imaging on a 1/1.5/3.0 T magnetic resonance scanner for assessment of LVEF and myocardial scar between 2003 and 2020. Steady‐state free precession cine images were acquired in multiple short‐axis and three long‐axis views. LGE was performed using a segmented inversion‐recovery gradient‐echo technique in identical views as cine‐CMR 10–15 min after 0.15 mmol/kg of gadolinium‐contrast administration. Inversion times were optimized to null normal myocardium.
Cine and LGE images from all centres were centrally evaluated in a core laboratory by two CMR experts blinded to genotype and outcomes using cvi42 CircleCVI software. When disagreement occurred, the most experienced expert opinion (JGM >10 years' experience) prevailed. An interobserver variability test was undertaken with 17 CMR studies and it showed interclass correlation of 0.88 (95% confidence interval [CI] 0.69–0.96). LV volume, mass, and LVEF were quantitatively measured from the stack of short‐axis cine images using standard techniques. 18 The presence and location of hyperenhanced tissue on LGE, which was interpreted as representing scarred myocardium, 19 was determined by visual inspection. Scar size (extent) as a percentage of LV myocardium was quantified with semi‐automated planimetry (manually corrected) using the full‐width half‐max thresholding method. 20 Patients were classified according to presence/absence of LGE as L+ or L−.
Late gadolinium enhancement patterns were classified into seven categories (linear midventricular, patchy midventricular, epicardial, subendocardial, transmural, right ventricular (RV) insertion points, multiple patterns or other distribution). Patients with LGE were grouped according to LGE extent in three groups: <2.5%, ≥2.5% but <5% and ≥5% of total LV mass.
Genotype
Genetic variants were centrally classified as pathogenic (P), likely pathogenic (LP), unknown significance (VUS), or likely benign/benign (LB/B) after a systematic review by a cardiologist expert in cardiovascular genetics (JPO) using modified criteria of the American College of Medical Genetics and Genomics, 21 as described in the data supplement. A variant was considered disease‐causing if it affected a DCM‐related gene and was classified P/LP. Patients harbouring P/LP variants were considered ‘genotype‐positive’ (G+), and patients harbouring VUS/LB/B variants were considered ‘genotype‐negative’ (G−). Furthermore, a more restrictive classification was also undertaken considering as G+ only those patients with variants in the genes with strong/definitive association with DCM as defined by ClinGen DCM gene curation expert panel, or in DMD (a gene robustly associated with DCM with or without concomitant skeletal myopathy and not curated by the ClinGen curation panel).
The frequencies of variants in the general population were extracted from the gnomAD database v2.1.1. 22 We also added the information of 5254 index cases with no evidence of structural cardiac disease (channelopathies and aortic diseases) sequenced by NGS at Health in Code Molecular Genetics Laboratory with a library that included all the genes with genotype‐positive variants detected in this study. This cohort was used to obtain an ancestry‐specific control set, minimizing the likelihood of incorrectly categorizing variants as disease‐causing if they were present in Spanish controls.
Outcomes
The primary endpoints were a composite of ESHF events, and a composite of major ventricular arrhythmias (MVA). ESHF endpoint included ventricular assist device implantation for refractory heart failure, heart transplant, and ESHF mortality. MVA included SCD or aborted SCD, sustained ventricular tachycardia, and appropriate ICD interventions. Only appropriate ICD shocks to terminate ventricular tachycardia or ventricular fibrillation episodes were considered for the purpose of this study (anti‐tachycardia pacing therapy was not considered). All patients had planned reviews at participating centres every 6–12 months or more frequently if clinically indicated. The follow‐up for each patient was calculated from the date of their CMR study to the occurrence of a study endpoint, death from another cause, or the date of their most recent evaluation.
Statistical analyses
Continuous variables are expressed as mean ± standard deviation (SD) or median (interquartile range, IQR), as appropriate. Groups were compared using Student's t‐test, or the Mann–Whitney, or the ANOVA test, or the Kruskal–Wallis test when comparing more than two groups. Non‐continuous categorical variables were expressed as counts (percentages) and compared using the Chi‐squared test or Fisher's exact test, as appropriate. The cumulative probability of an event on follow‐up was estimated using the Kaplan–Meier method, and the log‐rank test was used to compare survival between groups. Hazard ratios of the L+ or G+ category and other parameters commonly used to predict outcomes in DCM including LVEF ≥35%, male sex, and New York Heart Association (NYHA) class III–IV were estimated by Cox proportional hazards regression. Furthermore, Harrell's C‐statistic was used to assess predictive performance of those parameters with hazard ratios that were statistically significant. Analyses were performed using Stata Statistics version 15 (StataCorp LLC, College Station, TX, USA). A 2‐sided p‐value <0.05 defined statistical significance.
Results
Subjects
A total of 600 patients met the inclusion criteria, of whom 534 (89.0%) were unrelated index cases and 66 (11.0%) were relatives. Characteristics of the patients are presented in Table 1 . Male sex predominated (66.2%), mean age at CMR study was 53.3 ± 14.1 years, and the majority of patients were in NYHA class I or II (69.3%) at baseline. Atrial fibrillation prevalence was 7.8%, left bundle branch block (LBBB) was present in 31% of patients, and a third‐degree atrioventricular block was found in 1%. Clinical characteristics and outcomes according to gender and age (under or above median age) are provided in online supplementary Tables S1 and S2.
Table 1.
Clinical characteristics of patients according to presence of late gadolinium enhancement and genotype
| Total (n = 600) | L+/G+ (n = 67) | L+/G− (n = 84) | L−/G+ (n = 175) | L−/G− (n = 274) | p‐value | |
|---|---|---|---|---|---|---|
| Demographics | ||||||
| Male sex, n (%) | 397 (66.2) | 48 (71.6) | 68 (81.0) | 103 (58.9) | 178 (65.0) | 0.051 |
| Age at CMR study, years | 53.3 (14.1) | 50.8 ± 12.8 | 57.1 ± 13.9 | 50.3 ± 15.2 | 54.6 ± 13.4 | 0.304 |
| Duration of follow‐up, years | 2.70 (1.29–4.86) | 3.21 (1.55–5.34) | 2.64 (1.21–4.90) | 2.87 (1.36–5.43) | 2.38 (1.24–4.41) | 0.303 |
| Proband, n (%) | 534 (89.0) | 59 (88.1) | 84 (100.0) | 117 (66.9) | 274 (100.0) | 0.005 |
| FH of DCM, n (%) | 292 (48.7) | 38 (56.7) | 28 (33.3) | 123 (70.3) | 103 (37.6) | 0.023 |
| FH of SCD 1st degree relative, n (%) | 65 (10.8) | 8 (11.9) | 3 (3.6) | 28 (16.0) | 26 (9.5) | 0.905 |
| FH of SCD non‐1st degree relatives, n (%) | 111 (18.5) | 10 (14.9) | 15 (17.9) | 44 (25.1) | 42 (15.3) | 0.729 |
| FH of skeletal myopathy, n (%) | 7 (1.2) | 1 (1.5) | 1 (1.2) | 2 (1.1) | 3 (1.1) | 0.807 |
| Skeletal myopathy, n (%) | 17 (2.8) | 3 (4.5) | 2 (2.4) | 6 (3.4) | 6 (2.2) | 0.386 |
| Previous SCD, n (%) | 6 (1.0) | 1 (1.5) | 2 (2.4) | 0 (0.0) | 3 (1.1) | 0.530 |
| NYHA class III–IV at 1st evaluation, n (%) | 184 (30.7) | 24 (35.8) | 25 (29.8) | 45 (25.7) | 90 (32.8) | 0.988 |
| NYHA class at 1st evaluation, n (%) | 0.001 | |||||
| I | 230 (38.3) | 25 (37.3) | 21 (25.0) | 91 (51.7) | 93 (34.1) | |
| II | 186 (30.9) | 18 (26.9) | 38 (45.2) | 39 (22.2) | 91 (33.3) | |
| III | 158 (26.3) | 22 (32.8) | 19 (22.6) | 39 (22.2) | 78 (28.6) | |
| IV | 26 (4.3) | 2 (3.0) | 6 (7.1) | 6 (3.4) | 12 (4.4) | |
| Baseline ECG | ||||||
| Sinus rhythm, n (%) | 551 (91.8) | 62 (92.5) | 72 (85.7) | 167 (95.4) | 250 (91.2) | 0.706 |
| Atrial fibrillation, n (%) | 47 (7.8) | 5 (7.5) | 12 (14.3) | 8 (4.6) | 22 (8.0) | 0.513 |
| AV block (third degree), n (%) | 6 (1.0) | 1 (1.5) | 0 (0.0) | 1 (0.6) | 4 (1.5) | 0.562 |
| QRS duration, mm | 114.0 ± 29.5 | 100.7 ± 22.2 | 116.3 ± 29.0 | 103.0 ± 23.0 | 125.5 ± 31.2 | <0.001 |
| LBBB, n (%) | 186 (31.0) | 5 (7.5) | 30 (35.7) | 24 (13.7) | 127 (46.4) | <0.001 |
| Abnormal T‐wave inversion, n (%) | 229 (38.2) | 32 (47.8) | 39 (46.4) | 56 (32.0) | 102 (37.2) | 0.076 |
| Low QRS voltage limb leads, n (%) | 64 (10.7) | 18 (26.9) | 10 (11.9) | 28 (16.0) | 8 (2.9) | <0.001 |
| Low QRS voltage precordial leads, n (%) | 18 (3.0) | 4 (6.0) | 4 (4.8) | 8 (4.6) | 2 (0.7) | 0.006 |
| Baseline echocardiogram | ||||||
| LVEF, % | 33.6 ± 10.8 | 34.2 ± 10.0 | 33.3 ± 10.1 | 35.9 ± 11.5 | 32.1 ± 10.5 | 0.078 |
| LVEF ≤35%, n (%) | 335 (55.8) | 37 (55.2) | 50 (59.5) | 74 (42.3) | 174 (63.5) | 0.130 |
| LVEDD, mm | 60.1 ± 7.7 | 59.6 ± 8.0 | 60.7 ± 8.1 | 59.4 ± 7.3 | 60.4 ± 7.8 | 0.589 |
| MR moderate/severe, n (%) | 188 (32.4) | 23 (34.8) | 26 (31.7) | 51 (30.2) | 88 (33.3) | 0.988 |
| RVSD (any degree), n (%) | 109 (19.4) | 13 (20.3) | 20 (24.4) | 29 (18.0) | 47 (18.5) | 0.432 |
| Drug treatment at initial evaluation | ||||||
| Beta‐blockers, n (%) | 480 (80.0) | 55 (82.1) | 65 (77.4) | 136 (77.7) | 224 (81.8) | 0.674 |
| ACEIs/ARBs, n (%) | 511 (85.2) | 52 (77.6) | 67 (79.8) | 147 (84.0) | 245 (89.4) | 0.003 |
| Sacubitril/valsartan, n (%) | 27 (4.5) | 4 (6.0) | 7 (8.3) | 6 (3.4) | 10 (3.6) | 0.146 |
| MRA, n (%) | 236 (39.3) | 26 (38.8) | 32 (38.1) | 60 (34.3) | 118 (43.1) | 0.326 |
| Treatment at last evaluation | ||||||
| Beta‐blockers, n (%) | 555 (92.5) | 64 (95.5) | 78 (92.9) | 155 (88.6) | 258 (94.2) | 0.976 |
| ACEI/ARB, n (%) | 410 (68.3) | 42 (62.7) | 51 (60.7) | 122 (69.7) | 195 (71.2) | 0.061 |
| Sacubitril/valsartan, n (%) | 157 (26.2) | 18 (26.9) | 31 (36.9) | 40 (22.9) | 68 (24.8) | 0.213 |
| MRA, n (%) | 373 (62.2) | 49 (73.1) | 63 (75.0) | 91 (52.0) | 170 (62.0) | 0.033 |
| ICD, n (%) | 171 (28.5) | 33 (49.3) | 38 (45.2) | 49 (28.0) | 51 (18.6) | <0.001 |
| CRT, n (%) | 65 (10.8) | 5 (7.5) | 22 (26.2) | 9 (5.1) | 29 (10.6) | 0.242 |
| MRI baseline | ||||||
| LVEDV, ml | 241.1 ± 81.1 | 239.2 ± 70.7 | 256.0 ± 90.1 | 226.6 ± 7.3 | 246.2 ± 85.3 | 0.838 |
| LV mass, g | 145.3 ± 43.8 | 138.8 ± 41.1 | 158.4 ± 48.9 | 131.3 ± 35.7 | 151.8 ± 45.1 | 0.147 |
| LVEF, % | 37.0 ± 13.4 | 34.3 ± 12.8 | 34.3 ± 10.4 | 40.0 ± 13.0 | 36.6 ± 14.3 | 0.135 |
| RVEDV, ml | 151.4 ± 50.5 | 154.2 ± 48.9 | 155.4 ± 60.0 | 152.2 ± 49.1 | 149.0 ± 48.7 | 0.284 |
| RV mass, g | 40.1 ± 13.2 | 43.0 ± 15.5 | 43.9 ± 14.4 | 39.2 ± 12.7 | 38.9 ± 12.3 | 0.002 |
| RVEF, % | 45.9 ± 15.2 | 43.3 ± 16.0 | 44.8 ± 14.6 | 46.7 ± 15.0 | 46.3 ± 15.3 | 0.135 |
| LA max vol, ml | 94.4 ± 49.5 | 104.8 ± 47.9 | 108.6 ± 78.8 | 84.2 ± 38.2 | 94.0 ± 43.0 | 0.028 |
| LAEF, % | 40.1 ± 17.2 | 35.6 ± 18.6 | 35.6 ± 17.3 | 43.7 ± 15.8 | 40.3 ± 17.2 | 0.015 |
| RA max vol, ml | 69.3 ± 32.3 | 72.5 ± 34.8 | 81.0 ± 45.6 | 68.4 ± | 65.5 ± 28.2 | 0.002 |
| RAEF, % | 35.6 ± 14.7 | 36.4 ± 14.8 | 31.7 ± 16.5 | 38.2 ± 13.8 | 34.9 ± 14.4 | 0.913 |
| LVEDV index, ml/m2 | 127.5 ± 39.8 | 126.9 ± 37.0 | 131.6 ± 39.6 | 122.6 ± 35.0 | 129.6 ± 43.1 | 0.768 |
| LV mass index, g/m2 | 76.7 ± 20.5 | 73.1 ± 18.1 | 81.5 ± 20.8 | 71.0 ± 17.0 | 79.8 ± 22.0 | 0.069 |
| RVEDV index, ml/m2 | 79.6 ± 23.2 | 81.5 ± 23.3 | 79.9 ± 28.1 | 82.1 ± 23.1 | 77.7 ± 21.5 | 0.156 |
| RV mass index, g/m2 | 21.1 ± 6.0 | 22.6 ± 7.0 | 22.5 ± 6.1 | 21.1 ± 6.0 | 20.3 ± 5.5 | <0.001 |
| LA max vol index, ml/m2 | 49.6 ± 23.2 | 55.2 ± 23.6 | 55.1 ± 32.3 | 45.4 ± 19.1 | 49.3 ± 21.6 | 0.025 |
| RA max vol index, ml/m2 | 36.5 ± 16.0 | 38.3 ± 18.0 | 41.6 ± 22.5 | 36.9 ± 14.1 | 34.2 ± 13.8 | 0.001 |
| LGE, n (%) | 151 (25.2) | 67 (100) | 84 (100.0) | 0 (0.0) | 0 (0.0) | <0.001 |
| LGE mass, g | 3.0 ± 8.7 | 11.7 ± 14.2 | 12.1 ± 14.0 | 0.0 ± 0.0 | 0.0 ± 0.0 | <0.001 |
| Percentage of LGE of LV mass, % | 2.3 ± 6.8 | 9.7 ± 12.6 | 8.4 ± 10.0 | 0.0 ± 0.0 | 0.0 ± 0.0 | <0.001 |
Values are mean ± standard deviation or median (interquartile range), unless otherwise indicated.
ACEI, angiotensin‐converting enzyme inhibitor; ARB, angiotensin II receptor blocker; AV, atrioventricular; CMR, cardiac magnetic resonance; CRT, cardiac resynchronization therapy; DCM, dilated cardiomyopathy; ECG, electrocardiogram; FH, family history; ICD, implantable cardioverter‐defibrillator; LA, left atrial; LAEF, left atrial ejection fraction; LBBB, left bundle branch block; LGE, late gadolinium enhancement; LV, left ventricular; LVEDD, left ventricular end‐diastolic diameter; LVEDV, left ventricular end‐diastolic volume; LVEF, left ventricular ejection fraction; MR, mitral regurgitation; MRA, mineralocorticoid receptor antagonist; MRI, magnetic resonance imaging; NYHA, New York Heart Association; RA, right atrial; RAEF, right atrial ejection fraction; RV, right ventricular; RVEDV, right ventricular end‐diastolic volume; RVSD, right ventricular systolic dysfunction; SCD, sudden cardiac death.
Concerning medical treatment, 80% of the patients were receiving beta‐blockers and 85.2% angiotensin‐converting enzyme inhibitors (ACEI) or angiotensin receptor blockers (ARB) at initial evaluation. At last follow‐up, 92.5% of patients were receiving beta‐blockers, 68.3% ACEI/ARBs, 26.2% sacubitril/valsartan, and 62.2% mineralocorticoid receptor antagonists (MRA). At last evaluation, 171 patients had an ICD (28.5%) and 65 (10.8%) a cardiac resynchronization therapy (CRT) device.
Myocardial scar
Cardiac magnetic resonance was mainly performed on 1.5 T magnetic field scanners (587 patients; 97.8%), and a small number of patients had CMR performed on 3 T (12 patients; 2%) or 1 T (1 patient; 0.2%) scanners. Mean LVEF at CMR was 37.0 ± 13.4%, and 329 (54.8%) patients had a LVEF ≤35%. Indexed LV volume was 127.5 ± 39.8 ml/m2, with a mean LV mass of 76.7 ± 20.5 g/m2. The right ventricle showed average normal size (indexed RV volume 79.7 ± 23.2 ml/m2) and mild systolic dysfunction (RV ejection fraction 45.9 ± 15.2%). Left atrial indexed volumes were enlarged (49.6 ± 23.2 ml/m2).
Myocardial scar was present in 151 (25.2%) patients (L+), whereas 449 (74.8%) patients did not show LGE on CMR (L−). Clinical characteristics of patients with and without LGE are described in online supplementary Table S3 . Both groups exhibited similar baseline echocardiographic LVEF, a similar percentage of patients with LVEF ≤35% and similar NYHA class, but patients with LGE had lower LVEF by CMR (34.3% vs. 37.9%, p = 0.004) and were more frequently male (76.8% vs. 62.6%, p = 0.001) and probands (94.7% vs. 87.1%, p = 0.010). Moreover, patients with LGE had a higher rate of MRA at last evaluation (74.2% vs. 58.1%, p < 0.001) and received ICD and CRT more frequently (47.0% vs. 22.3%, p < 0.001; and 17.94% vs. 8.5%, p = 0.001, respectively) despite having LBBB less frequently (23.2% vs. 33.6%, p = 0.016) and similar pharmacological treatment at baseline.
Median scar extent in patients with LGE was 4.7% (IQR 1.4–12.5) of the LV mass. The distribution of scar patterns was as follows: linear midventricular: 29.8%, patchy midventricular: 7.3%, epicardial: 25.8%, subendocardial: 3.3%, transmural: 7.2%, RV insertion points: 19.9%, multiple patterns or other distribution: 7.3%.
Genotype
A DCM‐related P/LP disease‐causing variant was identified in 242 (40.3%) individuals (G+). Of the 534 index cases, genetic testing identified a P/LP disease‐causing variant in 176 (33.0%), no variant was identified in 229 (42.9%), and a VUS was detected in 129 cases (24.2%). Four index cases (0.8%) harbored two disease‐causing variants.
Among the 236 cases (from the complete cohort including index and family members) with a unique P/LP variant, the most frequently involved gene was TTN, identified in 81 individuals (34.3%), followed by motor sarcomeric genes (n = 48, 20.3%), cytoskeleton/Z‐disk genes (n = 28, 11.9%), desmosomal genes (n = 21, 8.9%), nuclear envelope genes (n = 14, 5.9%), and other genes (n = 44, 18.6%).
Eighteen individuals (3% of those included in the study) had P/LP variants in genes not considered as definitive or strongly linked with DCM by the ClinGen curation panel or in DMD. The distribution of affected genes in these 18 individuals classified as G− according to the more ‘restrictive’ genetic classification was as follows: MYBPC3 (n = 12), PKP2 (n = 2), DSG2 (n = 1), DSC2 (n = 1), NKX2.5 (n = 1) and PRDM16 (n = 1).
Distribution of P/LP per affected gene in G+ individuals and the complete list of P/LP variants can be found in online supplementary Tables S4 and S5.
Clinical characteristics of G+ and G− patients can be found in online supplementary Table S6 . G+ patients were younger (50.5 ± 14.6 vs. 55.2 ± 13.5 years, p < 0.001) but G− patients showed lower LVEF by CMR (36.1% vs. 38.4%, p = 0.039), wider QRS (123.4 vs. 102.3 ms, p < 0.001) and higher rate of LBBB (43.9% vs. 12.0%, p < 0.001). Treatment was similar in both groups, although more patients in the G+ group had an ICD implanted (33.9% vs. 24.9%, p = 0.016) and more G− patients received a CRT device (14.2% vs. 5.8% p = 0.001). Online supplementary Table S7 provides outcomes according to genotype classifying patients as G+, G− and VUS.
Outcomes
During a median follow‐up of 2.7 (IQR 1.3–4.9) years, 24 (4.00%) and 48 (8.00%) patients had ESHF and MVA events, respectively. Table 2 shows clinical outcomes in the entire cohort.
Table 2.
Outcomes and events according to presence of late gadolinium enhancement and genotype
| Clinical events | Total (n = 600) | L+/G+ (n = 67) | L+/G− (n = 84) | L−/G+ (n = 175) | L−/G− (n = 274) | p‐value |
|---|---|---|---|---|---|---|
| Heart failure on admission | 159 (26.5) | 21 (31.3) | 33 (39.3) | 26 (14.9) | 79 (28.8) | 0.325 |
| Atrial fibrillation | 127 (21.1) | 18 (26.9) | 26 (31.0) | 42 (24.0) | 41 (15.0) | 0.001 |
| Stroke | 15 (2.5) | 3 (4.5) | 4 (4.8) | 3 (1.7) | 5 (1.8) | 0.100 |
| Appropriate ICD therapy | 31 (5.2) | 8 (11.9) | 11 (13.1) | 6 (3.4) | 6 (2.2) | <0.001 |
| Aborted SCD | 13 (2.2) | 3 (4.5) | 4 (4.8) | 2 (1.1) | 4 (1.5) | 0.047 |
| Heart transplant | 15 (2.5) | 5 (7.5) | 2 (2.4) | 7 (4.0) | 1 (0.4) | 0.001 |
| LVAD implantation | 5 (0.8) | 3 (4.5) | 1 (1.2) | 0 (0.0) | 1 (0.4) | 0.004 |
| All‐cause mortality | 19 (3.2) | 4 (6.0) | 7 (8.3) | 3 (1.7) | 5 (1.8) | 0.007 |
| HF‐related mortality | 8 (1.3) | 2 (3.0) | 4 (4.8) | 1 (0.6) | 1 (0.4) | 0.007 |
| MVA‐related mortality | 5 (0.8) | 2 (3.0) | 1 (1.2) | 2 (1.1) | 0 (0.0) | 0.016 |
| ESHF | 24 (4.0) | 8 (11.9) | 6 (7.1) | 8 (4.6) | 2 (0.7) | <0.001 |
| MVA | 48 (8.0) | 14 (20.9) | 15 (17.9) | 12 (6.9) | 7 (2.6) | <0.001 |
Values are n (%).
ESHF, end‐stage heart failure; HF, heart failure; ICD, implantable cardioverter‐defibrillator; LVAD, left ventricular assist device; MVA, malignant ventricular arrhythmia; SCD, sudden cardiac death.
On survival analysis, positive LGE was associated with MVA and ESHF (both log‐rank test p < 0.001) and positive genotype was associated with ESHF (p = 0.034) but not with MVA (p = 0.102) (online supplementary Figures S1 and S2 ). By contrast, we did not observe a significant association between LVEF ≤35% and MVA (p = 0.482) or ESHF (p = 0.082) (online supplementary Figure S3 ).
Late gadolinium enhancement pattern and extent
Malignant ventricular arrhythmias and ESHF were highly different depending on the underlying LGE pattern. While linear midventricular, epicardial, transmural and ‘other patterns’ groups exhibited a MVA rate ranging from 20% to 27.3%, patients with patchy or endocardial patterns did not have any MVA event (p < 0.001 for comparison among LGE patterns). Of note, the LGE presence at RV insertion points, traditionally considered a more benign LGE pattern, was associated with an MVA event rate of 16.7%. Regarding ESHF events, although the number of events was limited to drive solid conclusions, again the rate of events diverged depending on the LGE pattern (p = 0.005 for comparison among LGE patterns). Of note again, the RV insertion points pattern was not benign, and this group exhibited an ESHF event rate of 13.3%. Clinical characteristics and outcomes according to the LGE pattern are presented in online supplementary Table S8 . Regarding LGE extent, as expected, a higher LGE extent was associated with increased MVA and ESHF (both p < 0.001 for comparison between LGE extent groups), but this relationship seemed not to be linear as the intermediate LGE extent group (LGE % of LV mass of 2.5%–5%) had a higher rate of events than the higher LGE extent group (>5% of LV mass). Clinical characteristics and outcomes according to LGE extern are presented in online supplementary Table S9 .
Combination of late gadolinium enhancement and genotype
Classification of patients according to genotype (G+/G−) and LGE presence (L+/L−) revealed progressively increasing events across L−/G−, L−/G+, L+/G− and L+/G+ groups (Table 2 ) and resulted in optimized prediction of MVA (p < 0.001) and ESHF (p = 0.001) (Figures 1 and 2 ). Clinical characteristics of patients included in each group can be found in Table 1 .
Figure 1.
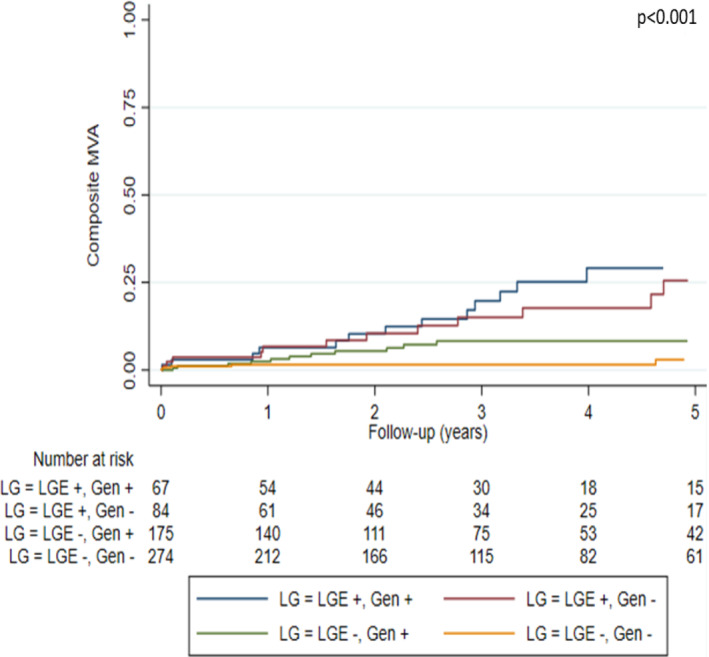
Kaplan–Meier curves of malignant ventricular arrhythmia (MVA) events according to presence of late gadolinium enhancement (LGE) and genotype.
Figure 2.
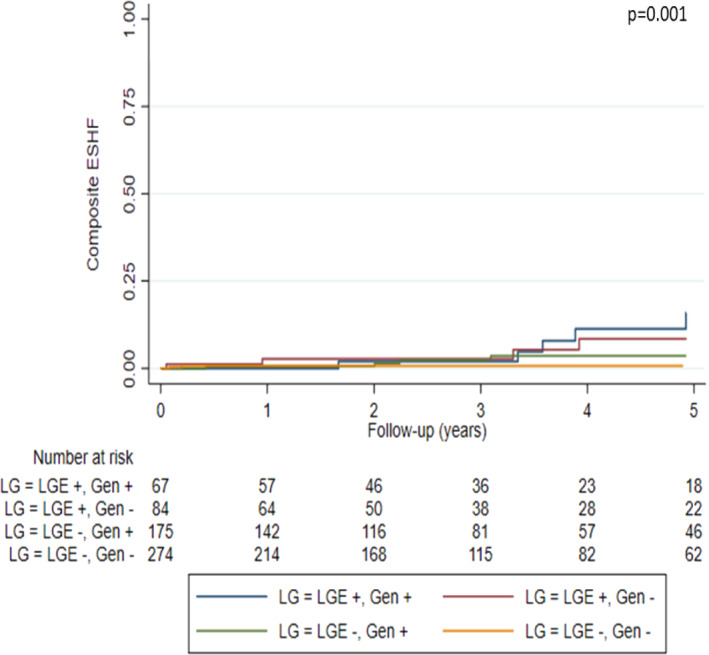
Kaplan–Meier curves of end‐stage heart failure (ESHF) events according to presence of late gadolinium enhancement (LGE) and genotype.
Malignant ventricular arrhythmia events per group were as follows: 20.9% in L+/G+, 17.9% in L+/G−, 6.9% in L−/G+, and 2.6% in L−/G−. ESHF events per group were: 11.9% in L+/G+, 7.1% in L+/G−, 4.6% in L−/G+, and 0.7% in L−/G−.
The hazard ratios for MVA according to L/G category and compared with L−/G− status were as follows: 7.82 (95% CI 3.16–19.39, p < 0.001) in L+/G+ patients, 7.29 (95% CI 2.97–17.89, p < 0.001) in L+/G−, and 2.45 (95% CI 0.96–6.24, p = 0.060) in L−/G+. The hazard ratios for ESHF events compared with L−/G− status were: 14.40 (95% CI 3.05–67.85, p = 0.001) in L+/G+, 9.37 (95% CI 1.89–46.45, p = 0.006) in L+/G−, and 4.80 (95% CI 1.00–23.14, p = 0.050) in L−/G+.
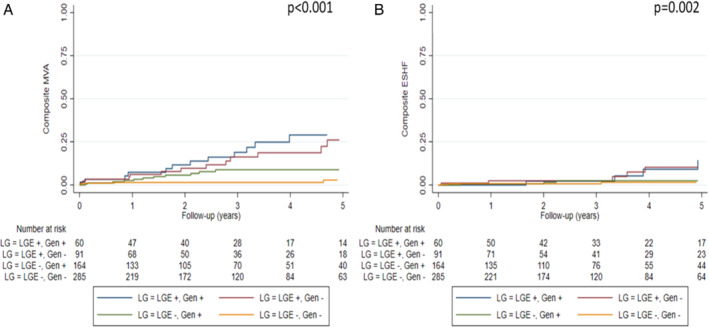
Genotype and LGE grouping in patients with DCM and LVEF >35% (n = 271, 45.2%) also resulted in improved MVA prediction (p = 0.002), with patients without LGE and with a negative genotype showing the lowest percentage of events during follow‐up (Figure 3 ). Specifically, MVA events per groups were: 25.7% in L+/G+, 12.8% in L+/G−, 4.6% in L−/G+, and 3.2% in L−/G−. By contrast, genotype and LGE grouping in patients with DCM and with LVEF >35% did not improve ESHF prediction (Figure 3 ). Clinical characteristics and outcomes of patients with DCM and with LVEF >35%, LVEF ≤35% and with NYHA class III–IV included in each group can be found in online supplementary Tables S10–S13.
Figure 3.
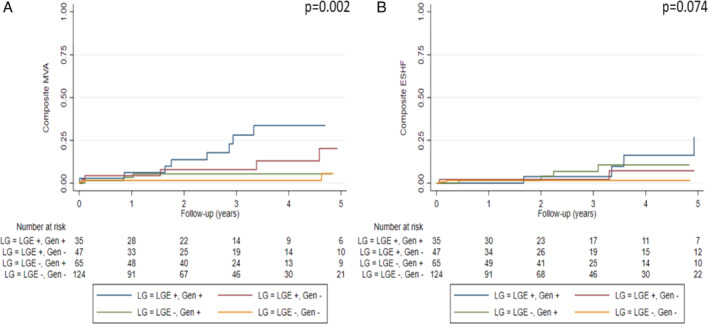
Kaplan–Meier curves of malignant ventricular arrhythmias (MVA) (A) and end‐stage heart failure (ESHF) (B) according to presence of late gadolinium enhancement (LGE) and genotype in dilated cardiomyopathy patients with left ventricular ejection fraction >35% included in the study (n = 271).
Lastly, patients with either L+ or G+ showed increased MVA and ESHF during follow‐up when compared with the L−/G− group (Figure 4 ). Hazard ratios for MVA and ESHF in patients with L+ or G+ compared with those with L−/G− were 4.71 (95% CI 2.11–10.50, p < 0.001) and 7.92 (95% CI 1.86–33.78, p < 0.001), respectively. Clinical characteristics of patients with DCM and with L+ and/or G+ versus L−/G− peers were very similar despite the finding that L−/G− patients had wider QRS interval, higher rate of LBBB, lower LVEF and higher rate of LVEF ≤35% on echocardiogram (Table 3 ).
Figure 4.
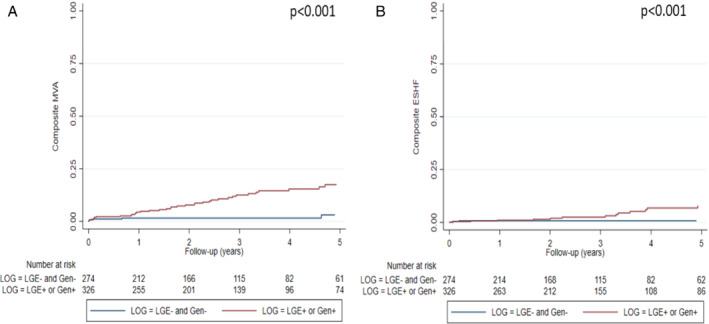
Kaplan–Meier curves of malignant ventricular arrhythmias (MVA) (A) and end‐stage heart failure (ESHF) (B) in patients with late gadolinium enhancement (LGE) or genotype‐positive versus patients without LGE and genotype‐negative (n = 600).
Table 3.
Characteristics and outcomes of patients with late gadolinium enhancement or positive genotype versus those without late gadolinium and negative genotype
| L+ or G+ (n = 326) | L−/G− (n = 274) | p‐value | |
|---|---|---|---|
| Demographics | |||
| Male sex, n (%) | 219 (67.2) | 178 (65.0) | 0.550 |
| Age at CMR, years | 52.2 ± 14.7 | 54.6 ± 13.4 | 0.040 |
| Duration of follow‐up, years | 2.70 (1.29–4.86) | 2.17 (0.82–4.30) | 0.127 |
| Proband, n (%) | 260 (79.8) | 274 (100.0) | <0.001 |
| FH of DCM, n (%) | 189 (58.0) | 103 (37.6) | <0.001 |
| FH of SCD 1st degree relative, n (%) | 39 (12.0) | 26 (9.5) | 0.331 |
| FH of SCD non‐1st degree relatives, n (%) | 69 (21.2) | 42 (15.3) | 0.067 |
| Previous SCD, n (%) | 4 (1.2) | 3 (1.1) | 0.881 |
| NYHA class III–IV at 1st evaluation, n (%) | 94 (28.8) | 90 (32.8) | 0.288 |
| NYHA class at first evaluation, n (%) | 0.240 | ||
| I | 137 (41.9) | 93 (33.9) | |
| II | 95 (29.1) | 91 (33.2) | |
| III | 80 (24.5) | 78 (28.5) | |
| IV | 14 (4.3) | 12 (4.4) | |
| Baseline ECG | |||
| Sinus rhythm, n (%) | 301 (92.3) | 250 (91.2) | 0.627 |
| Atrial fibrillation, n (%) | 25 (7.7) | 22 (8.0) | 0.870 |
| AV block (third degree), n (%) | 2 (0.6) | 4 (1.5) | 0.299 |
| QRS duration, mm | 105.4 ± 24.9 | 125.5 ± 31.2 | <0.001 |
| LBBB, n (%) | 59 (18.1) | 127 (46.4) | <0.001 |
| Abnormal T‐wave inversion, n (%) | 127 (39.0) | 102 (37.2) | 0.664 |
| Low QRS voltage limb leads, n (%) | 56 (17.2) | 8 (2.9) | <0.001 |
| Low QRS voltage precordial leads, n (%) | 16 (4.9) | 2 (0.7) | 0.003 |
| Baseline echocardiogram | |||
| LVEF, % | 34.9 ± 10.9 | 32.1 ± 10.5 | 0.001 |
| LVEF ≤35%, n (%) | 161 (49.4) | 174 (63.5) | 0.001 |
| LVEDD, mm | 59.8 ± 7.6 | 60.4 ± 7.8 | 0.319 |
| MR moderate/severe, n (%) | 100 (31.5) | 88 (33.3) | 0.647 |
| RVSD (any degree), n (%) | 62 (20.2) | 47 (18.5) | 0.614 |
| Drug treatment at initial evaluation | |||
| Beta‐blockers, n (%) | 256 (78.5) | 224 (81.8) | 0.325 |
| ACEI/ARB, n (%) | 266 (81.6) | 245 (89.4) | 0.007 |
| Sacubitril/valsartan, n (%) | 17 (5.2) | 10 (3.6) | 0.357 |
| MRA, n (%) | 118 (36.2) | 118 (43.1) | 0.086 |
| Treatment at last evaluation | |||
| Beta‐blockers, n (%) | 297 (91.1) | 258 (94.2) | 0.157 |
| ACEI/ARB, n (%) | 215 (66.0) | 195 (71.2) | 0.171 |
| Sacubitril/valsartan, n (%) | 89 (27.3) | 68 (24.8) | 0.491 |
| MRA, n (%) | 203 (62.3) | 170 (62.0) | 0.955 |
| ICD, n (%) | 120 (36.8) | 51 (18.6) | <0.001 |
| CRT, n (%) | 36 (11.0) | 29 (10.6) | 0.857 |
| MRI baseline | |||
| LVEDV, ml | 236.8 ± 77.2 | 246.2 ± 85.3 | 0.154 |
| LV mass, g | 139.8 ± 42.0 | 151.8 ± 45.1 | 0.001 |
| LVEF, % | 37.3 ± 12.6 | 36.6 ± 14.3 | 0.532 |
| RVEDV, ml | 153.4 ± 52.0 | 149.0 ± 48.7 | 0.292 |
| RV mass, g | 41.2 ± 13.9 | 38.9 ± 12.3 | 0.037 |
| RVEF, % | 45.5 ± 15.1 | 46.3 ± 15.3 | 0.494 |
| LA max vol, ml | 94.7 ± 54.4 | 94.0 ± 43.0 | 0.857 |
| LAEF, % | 39.9 ± 17.3 | 40.3 ± 17.2 | 0.818 |
| RA max vol, ml | 72.5 ± 35.2 | 65.5 ± 28.2 | 0.008 |
| RAEF, % | 36.2 ± 14.9 | 34.9 ± 14.4 | 0.251 |
| LVEDV index, ml/m2 | 125.8 ± 36.7 | 129.6 ± 43.1 | 0.250 |
| LV mass index, g/m2 | 74.1 ± 18.8 | 79.8 ± 22.0 | 0.001 |
| RVEDV index, ml/m2 | 81.4 ± 24.4 | 77.7 ± 21.5 | 0.050 |
| RV mass index, g/m2 | 21.8 ± 6.3 | 20.3 ± 5.5 | 0.003 |
| LA max vol index, ml/m2 | 49.9 ± 24.5 | 49.3 ± 21.6 | 0.749 |
| RA max vol index, ml/m2 | 38.4 ± 17.5 | 34.2 ± 13.8 | 0.001 |
| LGE, n (%) | 151 (46.3) | 0 (0) | <0.001 |
| LGE mass, g | 5.5 ± 11.2 | 0 ± 0 | <0.001 |
| Percentage of LGE in LV mass, % | 4.2 ± 8.9 | 0 ± 0 | <0.001 |
| Clinical events | |||
| Heart failure on admission, n (%) | 80 (24.5) | 79 (28.8) | 0.235 |
| Atrial fibrillation, n (%) | 86 (26.4) | 41 (15.0) | 0.001 |
| Stroke, n (%) | 10 (3.1) | 5 (1.8) | 0.331 |
| Appropriate ICD therapy, n (%) | 25 (7.7) | 6 (2.2) | 0.003 |
| Aborted SCD, n (%) | 9 (2.8) | 4 (1.5) | 0.276 |
| Heart transplant, n (%) | 14 (4.3) | 1 (0.4) | 0.002 |
| LVAD implantation, n (%) | 4 (1.2) | 1 (0.4) | 0.247 |
| All‐cause mortality, n (%) | 14 (4.3) | 4 (1.5) | 0.085 |
| HF‐related mortality, n (%) | 7 (2.1) | 1 (0.4) | 0.058 |
| MVA‐related mortality, n (%) | 5 (1.5) | 0 (0) | 0.040 |
| ESHF, n (%) | 22 (6.7) | 2 (0.7) | <0.001 |
| MVA, n (%) | 41 (12.6) | 7 (2.6) | <0.001 |
Values are mean ± standard deviation or median (interquartile range), unless otherwise indicated.
ACEI, angiotensin‐converting enzyme inhibitor; ARB, angiotensin II receptor blocker; CMR, cardiac magnetic resonance; CRT, cardiac resynchronization therapy; DCM, dilated cardiomyopathy; ECG, electrocardiogram; ESHF, end‐stage heart failure; FH, family history; HF, heart failure; ICD, implantable cardioverter‐defibrillator; LA, left atrial; LAEF, left atrial ejection fraction; LBBB, left bundle branch block; LGE, late gadolinium enhancement; LVAD, left ventricular assist device; LVEDD, left ventricular end‐diastolic diameter; LVEDV, left ventricular end‐diastolic volume; LVEF, left ventricular ejection fraction; MR, mitral regurgitation; MRA, mineralocorticoid receptor antagonist; MRI, magnetic resonance imaging; MVA, malignant ventricular arrhythmia; NYHA, New York Heart Association; RA, right atrial; RAEF, right atrial ejection fraction; RVEDV, right ventricular end‐diastolic volume; RVSD, right ventricular systolic dysfunction; SCD, sudden cardiac death.
Classification of patients according to genotype (G+/G−) and LGE presence (L+/L−) with the more restrictive genetic classification approach yielded similar results, with increasing events across L−/G−, L−/G+, L+/G− and L+/G+ groups (online supplementary Table S14 ) and optimized prediction of MVA (p < 0.001) and ESHF (p = 0.002) (Figure 5 ). The hazard ratios for MVA and ESHF according to L/G category and L+ or G+ compared with L−/G− status using the restrictive genetic classification are presented in online supplementary Table S15 . Lastly, Figure 6 shows MVA and ESHF during follow‐up of L+ or G+ patients compared with the L−/G− group, with similar findings to those from the more liberal genetic classification. Clinical characteristics and total number of events of patients included in each L/G group with the restrictive genetic classification approach can be found in online supplementary Tables S14 and S16 .
Figure 5.
Kaplan–Meier curves of malignant ventricular arrhythmia (MVA) (A) and end‐stage heart failure (ESHF) (B) events according to presence of late gadolinium enhancement (LGE) and genotype applying the more restrictive genetic classification (n = 600).
Figure 6.
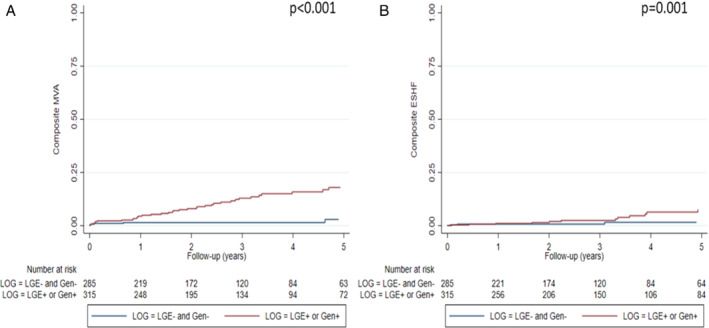
Kaplan–Meier curves of malignant ventricular arrhythmia (MVA) (A) and end‐stage heart failure (ESHF) (B) in patients with late gadolinium enhancement (LGE) or genotype‐positive versus patients without LGE and genotype‐negative applying the more restrictive genetic classification (n = 600).
Late gadolinium enhancement and genotype grouping versus other parameters
While MVA was higher in patients with L+ or G+ than in peers with L−/G−, we did not find LVEF ≤35%, male sex or NYHA class III–IV to be associated with MVA in our cohort (Table 4 ). Similar findings were found with ESHF events with L+ or G+ being the sole parameter that was significantly associated with ESHF in our cohort. Harrell's C‐statistics for predicting MVA and ESHF of L+ or G+ in our cohort were 0.653 and 0.628, respectively.
Table 4.
Hazard ratios and p‐values for malignant ventricular arrhythmias and end‐stage heart failure for selected parameters
| MVA | ESHF | |||||
|---|---|---|---|---|---|---|
| HR | 95% CI | p‐value | HR | 95% CI | p‐value | |
| L+ or G+ | 4.71 | 2.11–10.50 | <0.001 | 7.92 | 1.86–33.78 | <0.001 |
| Male sex | 1.39 | 0.73–2.62 | 0.303 | 0.73 | 0.32–1.65 | 0.457 |
| NYHA class III–IV | 0.76 | 0.39–1.49 | 0.410 | 1.43 | 0.61–3.35 | 0.420 |
| LVEF ≤35% | 0.82 | 0.46–1.44 | 0.482 | 0.48 | 0.21–1.10 | 0.082 |
CI, confidence interval; ESHF, end‐stage heart failure; G+, genotype‐positive; HR, hazard ratio; L+, presence of late gadolinium enhancement; LVEF, left ventricular ejection fraction; MVA, malignant ventricular arrhythmia; NYHA, New York Heart Association.
Discussion
This study constitutes the largest cohort reported to date of genotyped patients with DCM and with available CMR and clinical outcome data. It shows that both the presence of LGE and P/LP genetic variants are associated with worse clinical outcomes during follow‐up, and that classification of patients according to LGE and genotype improves the prediction of MVA and ESHF events. Moreover, our results suggest that patients with DCM who do not exhibit LGE and who are G– have a favourable prognosis with a very low number of arrhythmic and ESHF complications during follow‐up (Graphical Abstract).
Predicting prognosis in non‐ischaemic DCM is a challenging aspect in the clinical care of these patients and has important consequences for clinical decisions, including indicating ICD implantation and referral for heart transplantation evaluation. Current guidelines recommend LVEF for risk stratification of SCD and for guiding ICD implantation in heart failure patients, but while this recommendation is widely accepted in patients with coronary artery disease and LVEF ≤35%, it is still contentious in patients with severe LV dysfunction and non‐ischaemic DCM.
Although LVEF ≤35% has been reported as an independent risk marker of all‐cause and cardiac death in DCM, it has also shown only modest ability in identifying DCM patients with higher risk of SCD and who would benefit from ICD implantation. In fact, the majority of SCD events in this patient population occur among those with LVEF ≥35% and the only randomized controlled trial that has examined prophylactic ICD implantation in DCM patients with LVEF ≤35% did not find improved survival in patients who received an ICD. 15 In the present study, the overall MVA rate was 8%, which is in line with previous studies, 10 and 45.8% of MVA events occurred in patients with LVEF >35%. Furthermore, LVEF ≤35% was not associated with MVA events during follow‐up, confirming that using LVEF as the unique marker for predicting SCD is inadequate in DCM, and highlighting that other markers are needed to identify patients with DCM who would benefit from ICD implantation.
The presence of myocardial scar determined by LGE on CMR and the presence of positive genotype are two new markers proposed to identify DCM patients with increased susceptibility to SCD. A recent study from our group analysing outcomes in 1005 genotyped DCM probands showed that those with P/LP variants had a worse clinical outcome than their G– peers. 3 The present study expands previous findings by combining genetic results with CMR findings.
In our cohort, LGE was present in 25.2% of patients with DCM, in line with what has been reported in other DCM series, and the presence of LGE was strongly associated with both MVA and ESHF. 9 , 10 , 11 Our study adds to the available body of data from recent prospective longitudinal studies and meta‐analyses that support ICD implantation in patients with DCM and with LGE on CMR irrespective of LVEF. 11 , 23 , 24
The main finding of our study is that combining LGE and genotype improves the prediction of outcomes in patients with DCM: those with LGE and/or a positive genotype clearly exhibited worse outcomes as compared with the largest group of patients (45.7% of the total cohort) who did not have LGE on CMR and who were G–. Of note, only 2.6% and 0.7% of patients in the latter group had MVA and ESHF events, respectively, suggesting that the use of these markers could lead to a major improvement in the selection of patients who would benefit from ICD implantation and advanced heart failure care, although our findings would need to be replicated in additional cohorts.
The distribution of affected genes in our cohort was similar to that of previously reported genotyped cohorts, with 13.5% of patients showing variants in TTN, 3.3% in BAG3 and 2.3% in LMNA. 25 , 26 Classification of patients by LGE and genotype using a more restrictive genetic approach did not alter the results. Accordingly, our findings cannot be attributed to an overrepresentation of variants in certain genes or to the classification as G+ of DCM patients with P/LP variants in disputed genes.
The LGE/genotype classification was also shown to be useful in the more clinically challenging group of patients with DCM and with LVEF >35%, for whom current guidelines do not recommend ICD implantation. Among the 271 patients with LVEF >35% in the study (45.2%), those who had LGE or who were G+ had higher MVA occurrence than those who were L−/G−, with an absolute rate of MVA of 12.2% in patients either with LGE or G+ (n = 147) compared with 3.23% in those who were L− and G− (n = 124) (p < 0.001). Moreover, only 2 (1.6%) of the L−/G− patients with LVEF >35% had ESHF events as opposed to 7.5% of those with either LGE or who had a positive genotype, which is also important information when planning clinical care and when informing patients and families about prognosis.
Application of the recommended LVEF ≤35% threshold to guide ICD implantation in our cohort would have theoretically led to 329 ICD implants (54.8% of patients) with 26 MVA events prevented but would also have missed 22 MVA events (sensitivity: 54.2%; positive predictive value: 7.9%) (Figure 7 ). By contrast, if ICD implantation had been guided by our proposed LGE/genotype classification with any or both factors present irrespective of LVEF, it would have resulted in a similar number of ICDs implanted (326 patients, 54.3%) but would have prevented 41 MVA and missed only 7 MVA events (sensitivity: 85.4%; positive predictive value: 12.6%), improving substantially the performance of the recommended LVEF ≤35% threshold and also the performance of LGE and genotype when applied individually (Figure 7 ).
Figure 7.
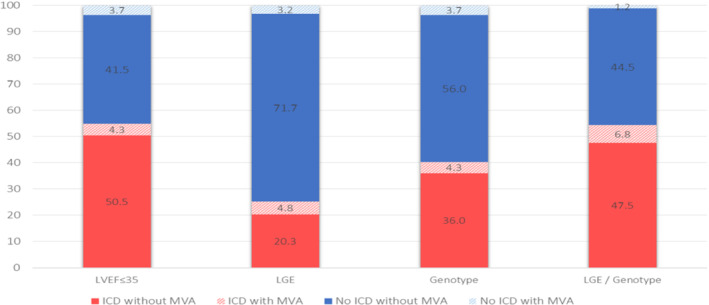
Outcomes of patients associated with model‐based implantable cardioverter‐defibrillator (ICD) implantation strategies. The implications of implanting an ICD according to presence of late gadolinium enhancement (LGE), positive genotype or LGE presence and/or positive genotype, as compared with the implications of treating all patients as per current guidelines using left ventricular ejection fraction (LVEF) ≤35% threshold. Each bar represents the complete cohort (n = 600) and colour‐coding represents the proportion of patients experiencing sustained ventricular arrhythmias (MVA) or absence of, as well as the placement versus the non‐placement of an ICD. LGE presence and/or positive genotype approach optimizes ICD placement strategy by minimizing proportion of subjects with MVA but without ICD and maximizing the proportion of subject with MVA with ICD.
Although our findings will need validation in additional cohorts, and ideally tested in prospective clinical trials, we believe that addressing prognosis in DCM with LGE/genotype has important clinical consequences and could improve patient selection and allocation of available resources.
Limitations
Significant limitations to this investigation are worth noting. This is an observational retrospective study that was conducted at 20 heart failure and inherited cardiac diseases units; as such, it is affected by an unavoidable degree of referral bias.
Although the current standard at the participating institutions is to consider CMR and genotyping evaluation for all patients with DCM, this registry includes data from consecutive patients with DCM genotyped during a 5‐year period who had a clinical CMR performed. As expected in the context of a registry study of this kind, the criteria to proceed with CMR evaluation and genotyping have evolved over time in the participating centres, and we cannot discard that CMR and genotype results have influenced ICD implantation in some patients, and subsequentially impacted on MVA events registered. As ICD shocks were a component of the MVA event in our study, higher ICD implantations could have led to higher MVA events, as potentially some ventricular arrythmias treated with ICD shocks could have terminated spontaneously. Also, although competitive events were rare (9 non‐ESHF deaths and 19 non‐MVA deaths/heart transplants), a competitive risk analysis was not performed.
Furthermore, although the main DCM genes were evaluated in all cases, not all patients underwent the same genetic analysis because the genes included in NGS panels varied between centres and over time. Nevertheless, all patients had the most important DCM‐associated genes analysed and 88% of probands had also FLNC analysed, reflecting a complete genetic analysis according to current standards in a large majority of patients.
Lastly, although this is the largest cohort of genotyped DCM patients with CMR and clinical outcomes information published so far, the number of patients included could still be considered limited and our findings would need to be replicated in validation cohorts.
Conclusions
In conclusion, we found that classification of patients according to genotype and LGE presence improves MVA and ESHF prediction in DCM. Combination of scar assessment with CMR and genotyping outperformed LVEF ≤35% in identifying DCM patients with MVA. Therefore, we believe that scar assessment and genotyping could improve patient selection criteria for primary prevention ICD placement.
Supporting information
Table S1. Characteristics and outcomes of DCM patients according to gender.
Table S2. Characteristics and outcomes of DCM patients older or younger than the median age in the cohort.
Table S3. Clinical characteristics and outcomes in DCM patients with and without late gadolinium enhancement (LGE) on cardiac magnetic resonance.
Table S4. Distribution of pathogenic/likely pathogenic variants per affected gene in genotype‐positive DCM patients with a unique P/LP variant (n = 236).
Table S5. Complete list of P/LP variants.
Table S6. Clinical characteristics and outcomes according to genotype in DCM patients.
Table S7. Clinical outcomes according to genotype.
Table S8. Characteristics and outcomes of DCM patients according to distribution of late gadolinium enhancement (LGE).
Table S9. Characteristics and outcomes of DCM patient according to late gadolinium enhancement (LGE) extent.
Table S10. Clinical characteristics and outcomes in DCM patients with LVEF ≤35% and those with LVEF >35%.
Table S11. Characteristics and outcomes of DCM patients with LVEF >35% according to presence of late gadolinium enhancement (LGE) and genotype (G).
Table S12. Clinical outcomes in patients with LEVF ≤35% according to presence of late gadolinium enhancement (LGE) and genotype (G).
Table S13. Clinical outcomes in patients with NYHA class III–IV according to presence of late gadolinium enhancement (LGE) and genotype (G).
Table S14. Characteristics and outcomes of patients with DCM according to presence of late gadolinium enhancement (LGE) and genotype (G) with restrictive genetic classification.
Table S15. Hazard ratios for malignant ventricular arrhythmias (MVA) and end‐stage heart failure (ESHF) according to L/G category and L+ or G+ compared with L−/G− status using the restrictive genetic classification.
Table S16. Characteristics and outcomes of patients with DCM and with/without late gadolinium enhancement or positive genotype vs without late gadolinium and negative genotype with restrictive genetic classification.
Figure S1. Kaplan–Meier curves of malignant ventricular arrhythmias (MVA) (A) and end‐stage heart failure (ESHF) (B) according to presence of late gadolinium enhancement (LGE).
Figure S2. Kaplan–Meier curves of malignant ventricular arrhythmias (MVA) (A) and end‐stage heart failure (ESHF) (B) in genotype‐positive and genotype‐negative individuals.
Figure S3. Kaplan–Meier curves of malignant ventricular arrhythmias (MVA) (A) and end‐stage heart failure (ESHF) (B) in DCM patients with LVEF ≤35% and those with LVEF >35%.
Acknowledgements
We gratefully acknowledge Ana Borrego Hernandez for her excellent technical assistance.
Funding
This work was supported by grants from the Instituto de Salud Carlos III (ISCIII) (PI18/0004, PI19/01283, PI20/0320). (Co‐funded by European Regional Development Fund/European Social Fund ‘A way to make Europe’/‘Investing in your future’). The Hospital Universitario Puerta de Hierro Majadahonda, the Hospital Clinic, the Hospital Vall d'Hebron, the Hospital General Universitario Gregorio Marañón and the Hospital Universitario Virgen de la Arrixaca are members of the European Reference Network for rare, low‐prevalence, and complex diseases of the heart (ERN GUARD‐Heart). The CNIC is supported by the ISCIII, MCIN, the Pro‐CNIC Foundation, and the Severo Ochoa Centers of Excellence program (CEX2020‐001041‐S).
Conflict of interest: none declared.
Contributor Information
Jesús G. Mirelis, Email: jesus.gmirelis@telefonica.net.
Pablo García‐Pavía, Email: pablo.garciap@uam.es.
References
- 1. McKenna WJ, Judge DP. Epidemiology of the inherited cardiomyopathies. Nat Rev Cardiol. 2021;18:22–36. [DOI] [PubMed] [Google Scholar]
- 2. Fatkin D, Huttner IG, Kovacic JC, Seidman JG, Seidman CE. Precision medicine in the management of dilated cardiomyopathy: JACC state‐of‐the‐art review. J Am Coll Cardiol. 2019;74:2921–38. [DOI] [PubMed] [Google Scholar]
- 3. Escobar‐Lopez L, Ochoa JP, Mirelis JG, Espinosa MÁ, Navarro M, Gallego‐Delgado M, et al. Association of genetic variants with outcomes in patients with nonischemic dilated cardiomyopathy. J Am Coll Cardiol. 2021;78:1682–99. [DOI] [PubMed] [Google Scholar]
- 4. Restrepo‐Cordoba MA, Wahbi K, Florian AR, Jiménez‐Jáimez J, Politano L, Arad M, et al. Prevalence and clinical outcomes of dystrophin‐associated dilated cardiomyopathy without severe skeletal myopathy. Eur J Heart Fail. 2021;23:1276–86. [DOI] [PubMed] [Google Scholar]
- 5. Barriales‐Villa R, Ochoa JP, Larrañaga‐Moreira JM, Salazar‐Mendiguchía J, Díez‐López C, Restrepo‐Córdoba MA, et al. Risk predictors in a Spanish cohort with cardiac laminopathies. The REDLAMINA registry. Rev Esp Cardiol (Engl Ed). 2021;74:216–24. [DOI] [PubMed] [Google Scholar]
- 6. Akhtar MM, Lorenzini M, Pavlou M, Ochoa JP, O'Mahony C, Restrepo‐Cordoba MA, et al.; European Genetic Cardiomyopathies Initiative Investigators. Association of left ventricular systolic dysfunction among carriers of truncating variants in filamin C with frequent ventricular arrhythmia and end‐stage heart failure. JAMA Cardiol. 2021;6:891–901. [DOI] [PMC free article] [PubMed] [Google Scholar]
- 7. van den Hoogenhof MMG, Beqqali A, Amin AS, van der Made I, Aufiero S, Khan MAF, et al. RBM20 mutations induce an arrhythmogenic dilated cardiomyopathy related to disturbed calcium handling. Circulation. 2018;138:1330–42. [DOI] [PubMed] [Google Scholar]
- 8. Domínguez F, Cuenca S, Bilińska Z, Toro R, Villard E, Barriales‐Villa R, et al. Dilated cardiomyopathy due to BLC2‐associated athanogene 3 (BAG3) mutations. J Am Coll Cardiol. 2018;72:2471–81. [DOI] [PMC free article] [PubMed] [Google Scholar]
- 9. Gulati A, Jabbour A, Ismail TF, Guha K, Khwaja J, Raza S, et al. Association of fibrosis with mortality and sudden cardiac death in patients with nonischemic dilated cardiomyopathy. JAMA. 2013;309:896–908. [DOI] [PubMed] [Google Scholar]
- 10. Halliday BP, Gulati A, Ali A, Guha K, Newsome S, Arzanauskaite M, et al. Association between midwall late gadolinium enhancement and sudden cardiac death in patients with dilated cardiomyopathy and mild and moderate left ventricular systolic dysfunction. Circulation. 2017;135:2106–15. [DOI] [PMC free article] [PubMed] [Google Scholar]
- 11. Klem I, Klein M, Khan M, Yang EY, Nabi F, Ivanov A, et al. Relationship of LVEF and myocardial scar to long‐term mortality risk and mode of death in patients with nonischemic cardiomyopathy. Circulation. 2021;143:1343–58. [DOI] [PubMed] [Google Scholar]
- 12. Al‐Khatib SM, Stevenson WG, Ackerman MJ, Bryant WJ, Callans DJ, Curtis AB, et al. 2017 AHA/ACC/HRS Guideline for management of patients with ventricular arrhythmias and the prevention of sudden cardiac death: a report of the American College of Cardiology/American Heart Association Task Force on Clinical Practice Guidelines and the Heart Rhythm Society. Circulation. 2018;138:e272–391. [DOI] [PubMed] [Google Scholar]
- 13. McDonagh TA, Metra M, Adamo M, Gardner RS, Baumbach A, Böhm M, et al. 2021 ESC Guidelines for the diagnosis and treatment of acute and chronic heart failure: developed by the Task Force for the diagnosis and treatment of acute and chronic heart failure of the European Society of Cardiology (ESC). With the special contribution of the Heart Failure Association (HFA) of the ESC. Eur J Heart Fail. 2022;14:4–131. [DOI] [PubMed] [Google Scholar]
- 14. Goldberger JJ, Subačius H, Patel T, Cunnane R, Kadish AH. Sudden cardiac death risk stratification in patients with nonischemic dilated cardiomyopathy. J Am Coll Cardiol. 2014;63:1879–89. [DOI] [PubMed] [Google Scholar]
- 15. Køber L, Thune JJ, Nielsen JC, Haarbo J, Videbæk L, Korup E, et al.; DANISH Investigators. Defibrillator implantation in patients with nonischemic systolic heart failure. N Engl J Med. 2016;375:1221–30. [DOI] [PubMed] [Google Scholar]
- 16. Pinto YM, Elliott PM, Arbustini E, Adler Y, Anastasakis A, Böhm M, et al. Proposal for a revised definition of dilated cardiomyopathy, hypokinetic non‐dilated cardiomyopathy, and its implications for clinical practice: a position statement of the ESC Working Group on Myocardial and Pericardial Diseases. Eur Heart J. 2016;37:1850–8. [DOI] [PubMed] [Google Scholar]
- 17. Jordan E, Peterson L, Ai T, Asatryan B, Bronicki L, Brown E, et al. Evidence‐based assessment of genes in dilated cardiomyopathy. Circulation. 2021;144:7–19. [DOI] [PMC free article] [PubMed] [Google Scholar]
- 18. Grothues F, Smith GC, Moon JC, Bellenger NG, Collins P, Klein HU, et al. Comparison of interstudy reproducibility of cardiovascular magnetic resonance with two‐dimensional echocardiography in normal subjects and in patients with heart failure or left ventricular hypertrophy. Am J Cardiol. 2002;90:29–34. [DOI] [PubMed] [Google Scholar]
- 19. Kim RJ, Wu E, Rafael A, Chen EL, Parker MA, Simonetti O, et al. The use of contrast‐enhanced magnetic resonance imaging to identify reversible myocardial dysfunction. N Engl J Med. 2000;343:1445–53. [DOI] [PubMed] [Google Scholar]
- 20. Gao P, Yee R, Gula L, Krahn AD, Skanes A, Leong‐Sit P, et al. Prediction of arrhythmic events in ischemic and dilated cardiomyopathy patients referred for implantable cardiac defibrillator evaluation of multiple scar quantification measures for late gadolinium enhancement magnetic resonance imaging. Circ Cardiovasc Imaging. 2012;5:448–56. [DOI] [PubMed] [Google Scholar]
- 21. Richards S, Aziz N, Bale S, Bick D, Das S, Gastier‐Foster J, et al. Standards and guidelines for the interpretation of sequence variants: a joint consensus recommendation of the American College of Medical Genetics and Genomics and the Association for Molecular Pathology. Genet Med. 2015;17:405–23. [DOI] [PMC free article] [PubMed] [Google Scholar]
- 22. Karczewski KJ, Francioli LC, Tiao G, Cummings BB, Alföldi J, Wang Q, et al. The mutational constraint spectrum quantified from variation in 141,456 humans. Nature. 2020;581:434–43. [DOI] [PMC free article] [PubMed] [Google Scholar]
- 23. di Marco A, Anguera I, Schmitt M, Klem I, Neilan T, White JA, et al. Late gadolinium enhancement and the risk for ventricular arrhythmias or sudden death in dilated cardiomyopathy: systematic review and meta‐analysis. JACC Heart Fail. 2017;5:28–38. [DOI] [PubMed] [Google Scholar]
- 24. Sammani A, Kayvanpour E, Bosman LP, Sedaghat‐Hamedani F, Proctor T, Gi WT, et al. Predicting sustained ventricular arrhythmias in dilated cardiomyopathy: a meta‐analysis and systematic review. ESC Heart Fail. 2020;7:1430–41. [DOI] [PMC free article] [PubMed] [Google Scholar]
- 25. Verdonschot J, Hazebroek M, Krapels I, Henkens M, Raafs A, Wang P, et al. Implications of genetic testing in dilated cardiomyopathy. Circ Genom Precis Med. 2020;13:476–87. [DOI] [PubMed] [Google Scholar]
- 26. Gigli M, Merlo M, Graw SL, Barbati G, Rowland TJ, Slavov DB, et al. Genetic risk of arrhythmic phenotypes in patients with dilated cardiomyopathy. J Am Coll Cardiol. 2019;74:1480–90. [DOI] [PMC free article] [PubMed] [Google Scholar]
Associated Data
This section collects any data citations, data availability statements, or supplementary materials included in this article.
Supplementary Materials
Table S1. Characteristics and outcomes of DCM patients according to gender.
Table S2. Characteristics and outcomes of DCM patients older or younger than the median age in the cohort.
Table S3. Clinical characteristics and outcomes in DCM patients with and without late gadolinium enhancement (LGE) on cardiac magnetic resonance.
Table S4. Distribution of pathogenic/likely pathogenic variants per affected gene in genotype‐positive DCM patients with a unique P/LP variant (n = 236).
Table S5. Complete list of P/LP variants.
Table S6. Clinical characteristics and outcomes according to genotype in DCM patients.
Table S7. Clinical outcomes according to genotype.
Table S8. Characteristics and outcomes of DCM patients according to distribution of late gadolinium enhancement (LGE).
Table S9. Characteristics and outcomes of DCM patient according to late gadolinium enhancement (LGE) extent.
Table S10. Clinical characteristics and outcomes in DCM patients with LVEF ≤35% and those with LVEF >35%.
Table S11. Characteristics and outcomes of DCM patients with LVEF >35% according to presence of late gadolinium enhancement (LGE) and genotype (G).
Table S12. Clinical outcomes in patients with LEVF ≤35% according to presence of late gadolinium enhancement (LGE) and genotype (G).
Table S13. Clinical outcomes in patients with NYHA class III–IV according to presence of late gadolinium enhancement (LGE) and genotype (G).
Table S14. Characteristics and outcomes of patients with DCM according to presence of late gadolinium enhancement (LGE) and genotype (G) with restrictive genetic classification.
Table S15. Hazard ratios for malignant ventricular arrhythmias (MVA) and end‐stage heart failure (ESHF) according to L/G category and L+ or G+ compared with L−/G− status using the restrictive genetic classification.
Table S16. Characteristics and outcomes of patients with DCM and with/without late gadolinium enhancement or positive genotype vs without late gadolinium and negative genotype with restrictive genetic classification.
Figure S1. Kaplan–Meier curves of malignant ventricular arrhythmias (MVA) (A) and end‐stage heart failure (ESHF) (B) according to presence of late gadolinium enhancement (LGE).
Figure S2. Kaplan–Meier curves of malignant ventricular arrhythmias (MVA) (A) and end‐stage heart failure (ESHF) (B) in genotype‐positive and genotype‐negative individuals.
Figure S3. Kaplan–Meier curves of malignant ventricular arrhythmias (MVA) (A) and end‐stage heart failure (ESHF) (B) in DCM patients with LVEF ≤35% and those with LVEF >35%.