

Abstract
Rapid impact assessment of cyclones on coastal ecosystems is critical for timely rescue and rehabilitation operations in highly human‐dominated landscapes. Such assessments should also include damage assessments of vegetation for restoration planning in impacted natural landscapes. Our objective is to develop a remote sensing‐based approach combining satellite data derived from optical (Sentinel‐2), radar (Sentinel‐1), and LiDAR (Global Ecosystem Dynamics Investigation) platforms for rapid assessment of post‐cyclone inundation in non‐forested areas and vegetation damage in a primarily forested ecosystem. We apply this multi‐scalar approach for assessing damages caused by the cyclone Amphan that hit coastal India and Bangladesh in May 2020, severely flooding several districts in the two countries, and causing destruction to the Sundarban mangrove forests. Our analysis shows that at least 6821 sq. km. land across the 39 study districts was inundated even after 10 days after the cyclone. We further calculated the change in forest greenness as the difference in normalized difference vegetation index (NDVI) pre‐ and post‐cyclone. Our findings indicate a <0.2 unit decline in NDVI in 3.45 sq. km. of the forest. Rapid assessment of post‐cyclone damage in mangroves is challenging due to limited navigability of waterways, but critical for planning of mitigation and recovery measures. We demonstrate the utility of Otsu method, an automated statistical approach of the Google Earth Engine platform to identify inundated areas within days after a cyclone. Our radar‐based inundation analysis advances current practices because it requires minimal user inputs, and is effective in the presence of high cloud cover. Such rapid assessment, when complemented with detailed information on species and vegetation composition, can inform appropriate restoration efforts in severely impacted regions and help decision makers efficiently manage resources for recovery and aid relief. We provide the datasets from this study on an open platform to aid in future research and planning endeavors.
Keywords: Amphan, cyclone, mangrove, rapid assessment, Sentinel, Sundarban
In this paper, we present a remote sensing based approach combining satellite data derived from optical (Sentinel‐2), radar (Sentinel‐1), and LiDAR (Global Ecosystem Dynamics Investigation) platforms for near real‐time assessment of post‐cyclone inundation and vegetation damage. We demonstrate the applicability of this multi‐scalar approach for cyclone Amphan that hit coastal India and Bangladesh in May 2020, severely flooding several districts in the two countries, and causing destruction to the Sundarban mangrove forests. We envision our open access high‐resolution data and methods to be of great interest to decision makers and conservation scientists.

Introduction
Tropical cyclones are high‐energy low‐pressure atmospheric phenomena that originate in warm tropical ocean surfaces and intensify due to complex interplay of sea surface temperature, ocean heat content, and vertical wind shear (Gray, 1968). They are a well‐known form of natural disasters that cause severe losses to ecosystems, society, economy, and lives. The frequency and intensity of tropical cyclones have increased markedly since the 1970s (Bhatia et al., 2019; Emanuel, 2005; Guzman & Jiang, 2021), and the trend is expected to continue in the future (Knutson et al., 2010). Climate change is predicted to facilitate this continuing trend of cyclone severity and economic damages are expected to double by 2100 (Mendelsohn et al., 2012).
Most of our ecological understanding of tropical cyclones come from the North Atlantic Basin. Between 1989 and 2018, only 14% of 1490 cyclones occurred in the North Atlantic, but a disproportionate number of studies (~67%) have focused on cyclones in this region (Lin et al., 2020). For the same time period, only 5% studies examined tropical cyclones in the Indian Ocean basin, where almost 22% cyclones originated (Lin et al., 2020). This skewed representation in the current literature might lead to a flawed understanding of cyclone impacts, as ecological impacts are known to vary spatially and among oceanic basins (Lin et al., 2011). As a known hotspot for tropical cyclones and due to its proximity to diverse ecosystems and dense human population in coastal regions, the North Indian Ocean, especially the Bay of Bengal region, deserves special attention. Compared to the Arabian Sea that is also part of the North Indian Ocean, twice as many cyclones form in the Bay of Bengal region (Sattar & Cheung, 2019). Singh et al. (2001) detected a twofold increase in cyclone frequency, 17% increase in the intensification rate, and 25% increase in severity of cyclones over the Bay of Bengal over 122 years (1877–1998). A recorded rise in sea level and sea surface temperature is likely to increase the frequency and intensity of tropical cyclones in the region (Khan et al., 2020; Paul & Rashid, 2016). A recent study simulated the effects of anthropogenic greenhouse warming, and predicted that future tropical cyclones will have increased rainfall with the potential to cause widespread coastal flooding (Chu et al., 2020). Cyclones originating in the Bay of Bengal are among the most destructive tropical cyclones ever documented in history, owing to their effects on the densely populated coastal areas of India and Bangladesh (Peduzzi et al., 2012).
Coastal vegetation such as mangrove forests can act as an effective shield to limit the loss of human life and economic damage due to tropical cyclones (Das & Vincent, 2009; Hochard et al., 2019; Menéndez et al., 2020). However, the shield effect of these forests predisposes them to biomass loss, structural, and compositional changes due to wind force, storm surge, and inundation associated with cyclones. Globally, extreme weather events contributed to 11% of total mangrove losses between 2000 and 2016 (Goldberg et al., 2020); tropical cyclones have been identified as the major non‐anthropogenic disturbance (45%) to mangroves (Sippo et al., 2018) that affect the extent and canopy structure of these estuarine forests (Simard et al., 2019). Tropical cyclones damage the vegetation in several ways including defoliation, tree uprooting, and mortality (Krauss & Osland, 2020). Massive mangrove collapses have been associated with storms such as Hurricane Mitch in Central America (Cahoon et al., 2003), Typhoon Haiyan (Long et al., 2016) in the Philippines, and Irma in southwest Florida (Lagomasino et al., 2021). However, tropical cyclones are also known to enhance mangrove productivity and resilience by increasing sediment and mineral nutrient deposition (Castañeda‐Moya et al., 2020).
Several studies have attempted to assess the impacts of specific tropical cyclones on the Sundarban mangrove forest, one of the largest mangrove forests in the world situated at the delta of the Ganga, Brahmaputra, and Meghna rivers on the Bay of Bengal. These studies document a wide range of impacts, even for the same cyclone, due to the differences in the type of satellite data and analytical techniques used by each study. For example, vegetation damage due to cyclone Sidr in 2007 was assessed to range between 22 and 45% in the Sundarban (Bhowmik & Cabral, 2013). Recent assessments of damage caused by 21 cyclones that occurred between 1988 and 2016 in this region reported that only the largest cyclones (H3 category or higher) with a sustained wind speed above 100 km per hour had damaging effects on the Sundarban (Mandal & Hosaka, 2020). More frequent and severe cyclones could decrease structural complexity (Lin et al., 2020) and thereby reduce the carbon storage capability of this mangrove forest (Rahman, Khan, et al., 2015). Therefore, it would be prudent to develop an accurate and reliable methodology that enables identification of damage hotspots so that appropriate long‐term mangrove monitoring can be planned. In addition to the vegetation damage assessments, a rapid methodology with a near real‐time evaluation of on‐the‐ground condition could considerably improve the efficacy of restoration and immediate relief work, and inform the impact response taskforce.
Rigorous evaluation of the ecological impacts of the tropical cyclones is challenging for many reasons, such as the unavailability of pre‐ and post‐cyclone data, along with the requirements for considerable time and high computational resources for preliminary impact analysis (Hogan et al., 2020; Pruitt et al., 2019). Despite its potential, remote sensing is grossly under‐utilized for rapid generation of geospatial information that can assist decision makers in expediting rescue and relief work, and assessing ecological damage. Traditionally, the lack of no‐cost, all‐weather radar images with global coverage hindered the use of remote sensing products in assessments of post‐cyclonic damage (Markert et al., 2018). Widely used satellite imagery, such as Landsat, Moderate Resolution Imaging Spectroradiometer (MODIS), or Advanced Very‐High‐Resolution Radiometer (AVHRR), are optical in nature, meaning these cannot penetrate the clouds present during or after cyclones. Synthetic aperture radar (SAR) data, such as Sentinel‐1 data available at no cost every 6–12 days since 2014, can overcome the challenge of cloud cover. With the availability of the pre‐processed SAR data on platforms such as Google Earth Engine (GEE), remote sensing technology can now provide an efficient means to assess impacts of cyclones in near real‐time (Gorelick et al., 2017). Moreover, the availability of several global‐scale satellite‐derived datasets on forest cover, forest height, and human population characteristics make this technology a preferred choice for rapid assessments appropriate for decision‐making. These technological and computational advancements have been effective in providing an early forecast of cyclogenic activities, real‐time tracking of cyclone evolution, their trajectory, and projections of impacted areas (Leroux et al., 2018). Such early warning systems have resulted in a drastic reduction in loss of human life (Morrow & Lazo, 2015).
Here, we propose a framework for rapid post‐cyclone assessments that would be of particular interest to decision makers. As a case study, we analyzed the areas impacted by the tropical cyclone Amphan, which made landfall in the coastal areas of India and Bangladesh on May 20, 2020. Our case study serves as a template for time‐sensitive demonstration of the use of remote sensing technology to achieve near real‐time geospatial data layers that can be useful for decision‐making for relief and recovery work by the relevant implementation agencies. Our overarching goal is to present a rapid and robust remote sensing‐based analysis of cyclone‐induced flooding and damages, which is otherwise challenging due to inaccessibility of remote regions and logistics. We address two specific objectives in our study:
-
1
Mapping the spatial extent of inundation in non‐mangrove regions as a direct impact of the cyclone.
-
2
Documenting the relative extent of vegetation damage within the Sundarban mangrove forest.
These two objectives address different aspects of the socio‐economic and ecological impacts of tropical cyclones. In addition to directly affecting millions of people, inundation might affect current agricultural practices by introducing saline water into the farmland (Farukh et al., 2019; Quadir & Iqbal, 2008; Rahaman & Esraz‐Ul‐Zannat, 2021). Vegetation damage might have negative consequences for forest structure and composition, therefore affecting the overall integrity and health of the coastal ecosystem (Goldberg et al., 2020; Simard et al., 2019). With the analysis presented here, we aspire to bring advanced remote sensing analysis at the forefront of decision‐making in highly human‐modified and ecologically dynamic landscapes.
Materials and Methods
Study event
In May 2020, Amphan began as a low‐pressure depression in the Southeastern Bay of Bengal, and eventually strengthened into a category 4 cyclonic storm. Moving northwards, Amphan made landfall on May 20, 2020 near Bakkhali, West Bengal, India with a wind speed of 155 km per hour (100 mph). Thereafter, it weakened rapidly while moving further inland and ultimately dissipated. The coastal areas impacted by the torrential rain and storm surge due to Amphan are densely populated and ecologically sensitive. The inhabitants in this region are primarily dependent on aquaculture and seasonal agriculture. Amphan killed over 100 people in India and Bangladesh, and was one of the most destructive cyclones, causing economic damage and losses estimated at US$13.2 billion (Sud & Rajaram, 2020).
Study area
For the first objective (i.e., inundation analysis), we focused on 39 districts across coastal India and Bangladesh (124 811 sq. km.) that were affected by Amphan (Fig. 1). This region has a high but heterogeneously distributed population, where livelihoods are mainly dependent on farming and fisheries. For our second objective (i.e., post‐cyclone vegetation change), we focus on the Sundarban mangrove forest. The Sundarban, covering an area of 10 029 sq. km. across India and Bangladesh, is a UNESCO world heritage site. These forests are a source of livelihood for 3.4 million people living around it (Gopal & Chauhan, 2006; Hussain, 2014; Sannigrahi et al., 2020; Uddin et al., 2013). Apart from this, an estimated population of about 12.2 million people (7.79 million in Bangladesh and 4.4 million in India) live within a 20 km periphery of the Sundarban forest (Hussain, 2014). This complex ecosystem is a network of numerous tidal waterways, evolving mudflats and islands of salt‐tolerant mangrove species, composed of 24 “true mangrove” species and 70 “mangrove associates” including dominant tree species such as Sundri (Heritiera fomes), Gewa (Excoecaria agallocha), Goran (Ceriops decandra), and Keora (Sonneratia apetala) (Rahman, Hossain, et al., 2015). This ecosystem also supports over 1000 documented faunal species including several endangered and threatened vertebrate species such as tiger (Panthera tigris tigris), South Asian river dolphin (Platanista gangetica), Irrawaddy dolphin (Orcaella brevirostris), masked finfoot (Heliopais personatus), Northern river terrapin (Batagur baska), and saltwater crocodile (Crocodylus porosus) (Aziz & Paul, 2015; Rahman et al., 2019).
Figure 1.

Top panel shows (A) 39 study districts distributed across Odisha, and West Bengal, India, and Bangladesh along with the track of cyclone Amphan in solid red line. Inset shows the entire study area in yellow. Odisha districts include Baleshwar, Bhadrak, Cuttack, Jagatsinghpur, Jajpur, Kendrapara, Keonjhar, Khordha, Mayurbhanj, and Puri. West Bengal districts include Barddhaman, East Midnapore, Haora, Hugli, Kolkata, Nadia, North 24 Parganas, South 24 Parganas, and West Midnapore. Bangladesh districts include Bagerhat, Barguna, Barisal, Bhola, Chuadanga, Jessore, Jhalokati, Jhenaidah, Khulna, Kushtia, Lakshmipur, Meherpur, Naogaon, Natore, Noakhali, Pabna, Patuakhali, Pirojpur, Rajshahi, and Satkhira. The district boundaries for India and Bangladesh were obtained from ArcGIS Hub. Bottom panel shows (B) the extent of the Sundarban mangrove forest across India and Bangladesh (Giri et al., 2005), and (C) differences in canopy height across Sundarban derived from Potapov et al. (2021).
Analysis 1: assessment of inundation using radar satellite data
Optical remote sensing images (such as Landsat 8, Sentinel‐2) have large data gaps in the presence of a high cloud cover. Hence, for post‐cyclone assessments, Sentinel‐1 would be a better choice since it provides all‐weather radar images (Malmgren‐Hansen et al., 2020). We used dual‐polarization C‐band SAR data from the Sentinel‐1 mission (European Space Agency, 2020) for the inundation analysis (Fig. 2).
Figure 2.

Schematic diagram for the methodology presented in this study.
We analyzed ready‐to‐use SAR data on a cloud computing platform, GEE. These SAR data are preprocessed using Ground Range Detected (GRD) border‐noise removal, thermal noise removal, radiometric calibration, and terrain correction, to derive backscatter coefficients (σ°) in decibels (dB) (European Space Agency, 2020). GEE has Sentinel‐1 data available since 2014 at multiple spatial resolutions (10, 25, and 40 m). While both VV (single co‐polarization, vertical transmit/vertical receive) and VH (dual‐band cross‐polarization, vertical transmit/horizontal receive) bands were available on GEE, we used VH polarization instead of VV, because the former is less affected by windy conditions (Twele et al., 2016). We used SAR data from May 5–18, 2020 (pre‐Amphan) and May 22–30, 2020 (post‐Amphan) with the native spatial resolution of 10 m.
In order to derive the level of inundation as a direct effect of the cyclone, we focus on a binary water/non‐water classification. Areas under water were identified in the pre‐ and post‐Amphan images. We used the automated Otsu thresholding approach (Otsu, 1979) that finds optimum threshold values based on clusters found in the histograms of pixel values. This method is particularly useful for detecting inundated areas, because water bodies have considerably lower backscatter values compared to other land cover classes in a SAR image (Borah et al., 2018; Donchyts et al., 2016; Moharrami et al., 2021; Tiwari et al., 2020). The Otsu method assumes that there is a clear distinction between the two classes of interest in a bimodal histogram of the radar backscattering values, which is a valid assumption in this study (Fig. S1). For our study area, the Otsu threshold value used to differentiate between backscatter values for water and non‐water is −16 dB (Fig. S2); pixels with values lower than the threshold were identified as “water.” As the method is fully automated, it avoids the human error or inconsistency in generating the inundation map using a supervised classification method. This automated method is highly recommended, especially during or immediately after the disaster events when collecting field data is a challenging task. It is worth noting that Sentinel‐1 provides C‐band radar data that has a shorter wavelength (~5.5 cm) compared to that of L‐band (~22.9 cm) available from other spaceborne platforms, such as Advanced Land Observation Satellite (ALOS). In general, L‐band radar is better suited for identifying flooded vegetation due to the higher capability of penetrating vegetation canopy. However, ALOS‐2 (launched in 2014) L‐SAR data are not freely available. Hence, we limited our inundation analysis to non‐mangrove extents within our study area.
We used the Otsu method on both pre‐ and post‐Amphan images on GEE, resulting in two classified images (Mondal et al., 2020). We then used a decision rule to identify areas that changed from “non‐water” to “water” after the cyclone. The decision rule generated the “inundation layer” with the permanent water bodies such as river, lakes, oceans, and aquaculture masked out. This layer (Fig. 3) does not highlight areas that were temporarily flooded in the pre‐Amphan image (e.g., rice/jute fields), even when affected by the cyclone. We further calculated the area inundated because of the cyclone by counting pixels for each of the 39 districts in our study area. We have distributed these data layers through an open access data platform (Mondal et al., 2020).
Figure 3.

The extent of post‐cycloneflood in the study districts across India and Bangladesh along with the track of cyclone Amphan in solid red line. Three smaller insets show sample landscapes with greater details. We define inundation as water in the post‐cyclone image that was not water in the pre‐cyclone image. Several crop fields had water in the pre‐cyclone image due to the pre‐monsoon farming activities, and were not identified as being inundated (darker blue color in the insets).
We used approximate locations of inundated regions in Bangladesh, as reported by Khan et al. (2020) based on local print media, for visual accuracy assessment of the inundation data layers (Fig. S3). Moreover, in order to check the performance of the Otsu method, we compared the pre‐Amphan inundation layer with Sentinel‐2 optical imagery for the same period (May 5–18, 2020). We used Sentinel‐2 Level 2 assets for surface reflectance data on GEE. We obtained the median composites of all the images during this period. Thereafter, we used a false color composite (FCC) of the Sentinel‐2 bands 8 (near infrared), 4 (red), and 3 (green), all with spatial resolution of 10 m, for visual identification of water pixels. In order to collect validation points with minimum human bias, we first generated random points using the “stratifiedSample” function in GEE. We then overlaid these points on the FCC image and labeled as either “water” or “non‐water,” and ultimately identified 50 “water” and 50 “non‐water” validation points. We then calculated user's and producer's accuracy estimates based on how these validation points were classified in the pre‐Amphan inundation layer. We did not perform the same accuracy assessment on the post‐Amphan inundation layer to avoid data gaps in the Sentinel‐2 images due to the presence of high cloud cover.
Analysis 2: assessment of mangrove damage using optical satellite data
We accessed Sentinel‐2 Level 2 assets for surface reflectance data on GEE to calculate the normalized difference vegetation index (NDVI) (Fig. 2). The use of NDVI as a proxy for vegetation health is well‐established across disciplines, especially in mangrove forest ecosystems (Almahasheer et al., 2016; LeMarie et al., 2006; Macamo et al., 2016). It might be challenging to find usable optical satellite data, such as Sentinel‐2, immediately after a cyclone due to the presence of high cloud cover. However, when available, these post‐cyclone images can provide a quick assessment of the extent of damage in the impacted forest ecosystems.
In this study, we were able to use the relatively cloud‐free time window between January and March for the years 2020 (pre‐Amphan) and 2021 (post‐Amphan) for investigating post‐Amphan vegetation damage in the entire Sundarban mangrove forest by utilizing the median values for the time window of interest (Fig. 2). The GEE image collection provides radiometrically calibrated and atmospherically corrected surface reflectance values and has a quality band QA60 to flag cloudy pixels (European Space Agency, 2015). We used this band to exclude all pixels with opaque or cirrus clouds. NDVI was calculated using an in‐built GEE function (normalizedDifference) along with bands 4 (red) and 8 (near infrared) at a spatial resolution of 10 m. The NDVI difference (∆NDVI) image represents the difference between post‐ and pre‐Amphan NDVI values at a pixel level. We used ArcGIS Pro for all analysis hereafter.
Previous studies have used ∆NDVI < −0.2 to represent mangrove damage (Taillie et al., 2020; Zhang et al., 2019). Such thresholding approaches, when applied at a regular temporal interval, can provide important visual clues about immediate damage, such as forced tip‐ups, prominent breakage of large trees, or prolonged damage including slower post‐storm recovery in mangrove forests with reduced growth potential (Krauss & Osland, 2020). Identifying and delineating damage hotspots would be particularly useful for post‐cyclone impact assessments. Therefore, we utilized the Getis‐Ord Gi* statistics (Getis & Ord, 1992; Ord & Getis, 1995) to identify statistically significant spatial clustering of high and low ∆NDVI values. This tool examines each feature (point or polygon) within the context of neighboring features. A feature must have high/low value and must be surrounded by similar values in order to be identified as statistically significant. Among the outputs from this tool are z‐scores, p‐values, and confidence level bin for each feature. We then used a marginal plot to demonstrate differences in the distribution of median ∆NDVI values along latitude and longitude axes of the ∆NDVI image.
Impact assessment on varying canopy heights using Lidar satellite data
We also used a recently developed global canopy height dataset (Potapov et al., 2021) to document selective vegetation damage as a direct result of Amphan. The canopy height dataset was developed by integrating the Global Ecosystem Dynamics Investigation (GEDI) lidar forest structure data and Landsat analysis‐ready time‐series data for 2019. The NASA GEDI is a spaceborne lidar instrument onboard the International Space Station and provides vegetation structure including forest canopy height. The GEDI RH95 (relative height at 95%) metric was used to calibrate a bagged regression tree ensemble model that used Landsat‐derived surface phenology metrics as independent variables for the forest height prediction. The resulting global canopy height data has a spatial resolution of 30 m and provides canopy height between 52°N and 52°S. The GEDI dataset has several known limitations, including forest height overestimation on temperate and subtropical mountain slopes, no discrimination between the heights of vegetation and manmade objects, and calibration uncertainties. The forest height model does not adequately represent the tallest trees of the world, as it saturates above 30 m. However, another independently derived mangrove height dataset confirms that the tallest trees in this region have a height <30 m (Simard et al., 2019). We extracted canopy height data for all NDVI grid cells within the Sundarban mangrove forest. This step resulted in 6 357 195 grid cells with canopy height values ranging between 3 and 30 m. We also assessed distribution of ∆NDVI values along the canopy height categories using violin plots.
Results
Findings from analysis 1 (inundation analysis) indicate that c. 6821 sq. km of land area (not considering inundated forest) across the 39 study districts was under water as a direct result of Amphan even 10 days after the event. From analysis 2 (vegetation damage analysis) we find out that c. 73.5% of the Sundarban witnessed a decline in the NDVI values after Amphan. Analysis 2 also reveals that about 3.45 sq. km. of the Sundarban mangrove forest (~0.05%) had a considerably lower NDVI value (∆NDVI < −0.2) almost a year after Amphan.
Analysis 1: post‐Amphan inundation
According to the accuracy assessment, the pre‐Amphan inundation layer has an 85% overall accuracy. The producer's accuracy for the water and non‐water classes are 88% and 82%, respectively. The user's accuracy for the water and non‐water classes are 83% and 87%, respectively. Inundation was most extensive in Odisha (Fig. 3), despite this Indian state not being in the direct path of Amphan (Fig. 1). As per our Sentinel‐1 derived inundation data layers (Mondal et al., 2020), Odisha had at least 2625 sq. km. area under water after 10 days as a direct result of Amphan. These inundated regions were more or less uniformly distributed across 10 districts (Fig. 4), with Baleshwar and Jagatsinghpur each with 9–10% of the total inundated land area. West Bengal state in India had at least 1987 sq. km. area under water post‐Amphan; however, East Midnapore district experienced the most flooding with over 18% of the total inundated area. Haora and North 24 Parganas districts covered 5–7% of the total inundated area, while the state capital Kolkata had <1% share of the total inundated area 10 days after Amphan. In Bangladesh, at least 2208 sq. km. was under water as seen in the processed and analyzed satellite images; however, only two of the 20 districts, Pirojpur and Jhalokati, had more than 10% of the total inundated area (Fig. 4), with Jhenaidah, Jessore, Natore, and Chuadanga districts, each with c. 7–9% of the total inundated area.
Figure 4.

Percentage of inundated regions in the study districts across India and Bangladesh.
Analysis 2: damage in the Sundarban mangrove forest
The ∆NDVI image derived from the pre‐ and post‐Amphan NDVI images, 1 year apart, shows a decline in NDVI values in most regions (Fig. 5). The difference values range between −0.67 and 0.95. Approximately 4588 sq. km. area (73.5%) has ∆NDVI values <0; however, c. 3637 sq. km. (58%) have a value range of −0.05 and 0. The other dominant value range is −0.2 to −0.05, covering c. 948 sq. km (15.2%). We find that c. 3.5 sq. km. of mangrove forests (0.05%) show ∆NDVI < −0.2 almost a year after Amphan, hence likely to experience severe damage.
Figure 5.

Top panel shows NDVI differences (∆NDVI) between pre‐ and post‐Amphan NDVI values. Bottom panel shows confidence levels of spatial clustering of negative ∆NDVI according to Getis‐Ord Gi* statistics.
The hotspot analysis utilizing Getis‐Ord Gi* statistics reveals that the pixels with low ∆NDVI values are located in statistically significant clusters or cold spots (Fig. 5). However, the cold spots shown in Figure 5 consider all NDVI decline, and not just ∆NDVI < −0.2. Almost all districts with mangrove forests have these “NDVI decline clusters” with a total area of 2933 sq. km., with larger patches in North 24 Parganas, Satkhira, and Bagerhat districts. More decline clusters are noticeable in the western side of the study area, which is closer to the cyclone track and landfall sites (Fig. 5; Fig. S4). However, there is no noticeable gradient in ∆NDVI values as we move from west to east and south to north; rather several cold spots of various sizes are scattered across the entire Sundarban.
A marginal plot of the median ∆NDVI values summarizing the location‐specific mangrove damage (Fig. S5) further supports the spatial clustering pattern. This plot reveals that the biggest changes in NDVI values are along the southern and western regions of Sundarban. Regions that exhibit little to no variability in ΔNDVI (northern and eastern regions) likely indicate a cumulative resilience and emergent property of this large non‐fragmented forest to frequent cyclones.
Furthermore, our results show that the damage is not uniform across canopy heights (Fig. 6). Shorter mangroves have a wider range of damage and more extreme values, whereas the range of extreme damage decreases for taller mangrove trees. This is likely because Amphan's eye and track were closer to the western Sundarban that also has shorter vegetation stands as compared to the eastern side that has relatively taller trees (Fig. 1). Nevertheless, this finding is noteworthy, given that the total forest area of the short‐statured mangroves (3 m tall canopy in this case) is close to 40%, c. 3154 sq. km., of the entire Sundarban.
Figure 6.
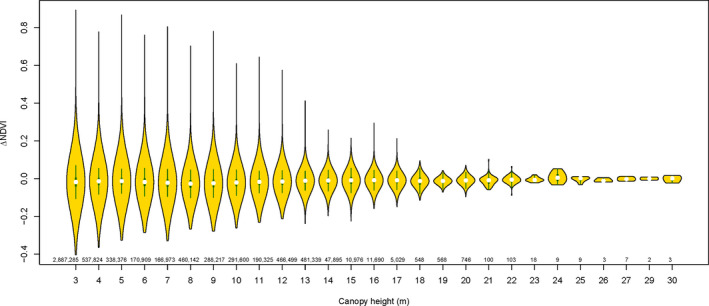
Violin plots showing ∆NDVI distribution across different canopy heights in the Sundarban mangrove forest. The sample sizes (i.e., number of pixels) for each height category are shown in smaller font.
Discussion
We use multiple sources of remotely sensed data available on a cloud‐computing platform (GEE) for assessing the impacts of Amphan on the coastal ecosystems. Specifically, we provide a near real‐time estimation of the post‐cyclone inundation of coastal lands. We also examine any potential vegetation damage in the Sundarban by utilizing pre‐ and post‐Amphan NDVI images. Our findings indicate that a land area of c. 6821 sq. km was inundated in the surrounding landscape. We also find that 0.05% (3.45 sq. km.) of the pixels recorded a decline of over 0.2 units in NDVI values, more likely showing damage from Amphan. While an additional 73.5% of the pixels (4584.39 sq. km.) recorded a decline in NDVI values, this likely represents annual variability and not cyclone‐related damage. Our findings demonstrate the potential of a rapid assessment method to identify post‐cyclone inundation using open‐access data and cloud computing platform that is helpful for recovery planning in affected areas. It is also possible to replicate our vegetation damage analysis for a rapid assessment if cloud‐free images are available after the event.
Coastal ecosystems and communities dependent on them are vulnerable to cyclones and storm surges (Marois & Mitsch, 2015). Coastal areas of the northern edge of the Bay of Bengal are specifically vulnerable to these natural calamities due to the dense human population and inadequate mitigation resources (Quader et al., 2017). Historically, cyclones have a marked devastating effect on human life, livelihood, and property in this region. Over 700 000 human lives were lost due to cyclones in Bangladesh over a period of 50 years (Haque et al., 2012). With the advent of early warning technologies, their adoption by the governments of Bangladesh and India, and proactive planning, cyclone‐related mortality have reduced by more than a 100 times during the last five decades (Haque et al., 2012). Despite this, post‐cyclone rescue and relief work are still a big challenge due to limited resources and logistics (Islam & Hasan, 2016; Mallick & Vogt, 2012).
Analyzing the extent and severity of inundation is important to enumerate the ecological and economic impacts of cyclones and flooding events (Emanuel, 2005; Woodruff et al., 2013). Open‐access high‐resolution images, acquired at a shorter time interval, and analysis on cloud computing platforms, have made it possible for near real‐time mapping of the effects of cyclones on human‐dominated and natural ecosystems. Use of remotely sensed data for flood monitoring or cyclone impact assessment is not new (Hassan et al., 2020; Tiwari et al., 2020); yet, most studies rely either on before/after image classification to draw conclusions on inundation extent or conduct decadal studies to document long‐term vegetation changes. Such classification schemes require accuracy assessments of the classified images, which in turn rely on reference data to train and test the classifiers. These reference data are collected either on the ground or by visual assessment of high‐resolution imagery. Completing ground validation or assessment could be particularly challenging for decision makers, especially for immediate impact assessment. While we conducted an accuracy assessment of our inundation datasets to show the robustness of the method, our methodology generated geospatial data layers that account for uncertainties without the requirement of ground data (Mondal et al., 2020). The input dataset, Sentinel‐1 radar data, is particularly useful for such applications, since the microwave section of the electromagnetic spectrum can penetrate through cloud cover. These data layers not only captured the extent of inundations for all the reported locations, but were also able to provide this information at a very high resolution owing to the input satellite data from Sentinel‐1. In the absence of any operational network for on‐the‐ground inundation monitoring, especially during a widespread pandemic such as COVID‐19, such high‐resolution and accurate inundation data layers could greatly benefit the decision‐making process. Depending on the event time and location, the methodology presented here (Fig. 2) can generate data layers in a few days (for inundation output) or a couple of weeks/months (for vegetation damage). This near real‐time and objective framework does not only minimize input‐related errors, but also provides an accurate baseline for future in‐depth studies. Utilization of freely available global datasets derived from state‐of‐the‐art remote sensing technology, such as LiDAR, could be particularly useful for informed ecological restoration in a fragile ecosystem.
It should be noted that our findings present conservative estimates of inundation, since we used a decision rule to identify pixels that changed from “no water” in pre‐cyclone image to “water” in post‐cyclone image. This rule led to identifying regions that were not under standing water in pre‐cyclone satellite images. Thus, our estimates do not include farmlands or other land uses such as aquaculture that require standing water as a farming strategy. While including these areas will result in greater numbers, it is not our intention to provide an estimation of the land area under water. Rather, we present a quick, automated, and effective method that requires minimal user input; hence can be used in near real‐time after a cyclone to identify regions needing immediate relief attention.
Mangroves are proven natural barriers that reduce the impact of cyclones, tsunamis, and storm surges (Del Valle et al., 2020; Hochard et al., 2019; Marois & Mitsch, 2015; Menéndez et al., 2020). The list of their ecosystem provisioning goes beyond reducing death rates and safeguarding livelihood options of coastal communities (Hochard et al., 2019; Sun & Carson, 2020). They are biodiversity rich dynamic ecosystems that perform essential ecosystem services such as carbon sequestration and nutrient recycling (Cummings & Shah, 2018). This unique and diverse community is arranged in a successional pattern and is governed by various abiotic factors, including salinity and tidal inundation. Furthermore, Sundarban is the only mangrove ecosystem in the world that has tigers as the apex predator of the ecosystem. With c. 200 wild tigers between India and Bangladesh (Aziz et al., 2019; Jhala et al., 2019), Sundarban is among one of the largest contiguous tiger habitats worldwide. Due to its remoteness, the lack of accessibility, and the highly dynamic nature of this ecosystem, it is extremely difficult to conduct wildlife surveys to assess the impact of cyclones immediately after such events. In this work, we presented a methodology that compares vegetation greenness before and after a cyclone event. Here, we compared images from the winter seasons (8–10 months after the event) in order to avoid high cloud cover. Such analysis might not capture immediate damage due to natural recovery in mangrove (Lagomasino et al., 2021). However, it is possible to compare images for similar analyses immediately before and after a cyclone event. Such analysis would inevitably result in a conservative estimate of damage owing to data gaps due to the presence of high cloud cover in the post‐cyclone optical images. Yet, simple but robust methodology as presented here can generate rapid and focused geospatial information for grassroots network of volunteers to direct relief work (Karan, 2015) and can provide a baseline for long‐term ecological assessments and monitoring. Sampling for vegetation disturbance is a critical part of monitoring habitat quality for wildlife (Jhala et al., 2017). Our suggested methodology can explicitly contribute toward wildlife and habitat surveys when it is feasible to do so, and provides a way to strategically plan monitoring efforts to be able to quantify the short‐ and long‐term impact of such disturbance events on vegetation and wildlife.
The severity of cyclone impacts on mangrove forests is not only dependent on cyclone‐induced storm surge and high velocity winds, but also on factors such as structural composition and heterogeneity of the vegetation, canopy cover, canopy height, species traits, and their spatial arrangement in the mangrove forest (Krauss & Osland, 2020; Peereman et al., 2021). The current status of mangrove forests is defined by a legacy of past tropical cyclones and recovery regime (Awty‐Carroll et al., 2019). More intense and frequent tropical cyclones can affect the overall canopy structure and may reduce the regeneration and recovery time of these forests, which will have a cascading effect on the faunal diversity dependent on this dynamic ecosystem (Sandilyan & Kathiresan, 2012; Simard et al., 2019). We recommend that post‐cyclone impact assessment on any mangrove ecosystems should include structural complexity, or at least forest height as a proxy for forest structure. A longer‐term impact analysis might then include individual species traits, hydro‐geologic and orographic data, wind‐speed and storm surge models, resulting in an accurate prediction of the species to community‐level impacts of tropical cyclones on Sundarban mangrove forest (e.g., Lagomasino et al., 2021; Radabaugh et al., 2020). Information generated from such models can also be used for predictive modeling of the impact of simulated cyclones on the mangrove forest and project future composition and structure of this forest in response to ongoing climate change.
We demonstrate the use of recent advances in remote sensing and cloud computing to assess the impact of cyclone Amphan on coastal ecosystems in India and Bangladesh. By harnessing these technical developments, we show that it can be effectively used to assess the impact, magnitude, and extent of natural disturbances over large geographic regions, in near real‐time, and in a relatively short time period. Automated algorithms produce results that are easy to interpret and reliable, thus ensuring that disaster management teams in these countries can use the technique with minimal knowledge of these techniques. The entire process can also be computationally programmed within a short period of the first information of cyclogenesis and estimated day of landfall for proactive strategic mitigation planning.
Supporting information
Data S1. High‐resolution inundation dataset for coastal India and Bangladesh.
Figure S1. Histogram of pixels showing the distribution of radar backscatter values from a sample landscape.
Figure S2. OTSU thresholding was used for automated identification of water in the landscape at a high resolution (10 m).
Figure S3. Visual accuracy assessment of inundation data layers generated in this study using ground data as reported by Khan et al. (2020).
Figure S4. Visual assessment of NDVI differences (∆NDVI) between pre‐ and post‐Amphan NDVI values.
Figure S5. Marginal plot showing distribution of median ∆NDVI values along latitude and longitude axes of the ∆NDVI image.
Acknowledgments
This work is made possible by the generous support of the University of Delaware Research Foundation. PM was partially supported by a NASA EPSCoR grant (DE‐80NSSC20M0220). We thank Dr. Manoj Kumer Ghosh (University of Rajshahi, Bangladesh) for sharing GIS data for the Sundarban. The manuscript has been greatly improved by constructive feedback from three anonymous reviewers. The authors have no conflict of interest to declare.
Funding Information
This work is made possible by the generous support of the University of Delaware Research Foundation. P. M. was partially supported by a NASA EPSCoR grant (DE‐80NSSC20M0220).
References
- Almahasheer, H. , Aljowair, A. , Duarte, C.M. & Irigoien, X. (2016) Decadal stability of Red Sea mangroves. Estuarine, Coastal and Shelf Science, 169, 164–172. [Google Scholar]
- Awty‐Carroll, K. , Bunting, P. , Hardy, A. & Bell, G. (2019) Using continuous change detection and classification of Landsat data to investigate long‐term mangrove dynamics in the Sundarbans region. Remote Sensing, 11, 2833. [Google Scholar]
- Aziz, A. & Paul, A.R. (2015) Bangladesh Sundarbans: present status of the environment and biota. Diversity, 7, 242–269. [Google Scholar]
- Aziz, M. , Kabir, M. , Shamsuddoha, M. , Ahsan, M. , Sharma, S. , Chakma, S. et al. (2019) Status of tiger in the Sundarban of Bangladesh 2018. Bangladesh: Department of Zoology, KJahangirnagar University, WildTeam Bangladesh & Forest Department. [Google Scholar]
- Bhatia, K.T. , Vecchi, G.A. , Knutson, T.R. , Murakami, H. , Kossin, J. , Dixon, K.W. et al. (2019) Recent increases in tropical cyclone intensification rates. Nature Communications, 10, 635. 10.1038/s41467-019-08471-z [DOI] [PMC free article] [PubMed] [Google Scholar]
- Bhowmik, A.K. & Cabral, P. (2013) Cyclone Sidr impacts on the Sundarbans floristic diversity. Earth Science Research, 2, p62. [Google Scholar]
- Borah, S.B. , Sivasankar, T. , Ramya, M.N.S. & Raju, P.L.N. (2018) Flood inundation mapping and monitoring in Kaziranga National Park, Assam using Sentinel‐1 SAR data. Environmental Monitoring and Assessment, 190(9). 10.1007/s10661-018-6893-y [DOI] [PubMed] [Google Scholar]
- Cahoon, D.R. , Hensel, P. , Rybczyk, J. , McKee, K.L. , Proffitt, C.E. & Perez, B.C. (2003) Mass tree mortality leads to mangrove peat collapse at Bay Islands, Honduras after hurricane Mitch. Journal of Ecology, 91, 1093–1105. 10.1046/j.1365-2745.2003.00841.x [DOI] [Google Scholar]
- Castañeda‐Moya, E. , Rivera‐Monroy, V.H. , Chambers, R.M. , Zhao, X. , Lamb‐Wotton, L. , Gorsky, A. et al. (2020) Hurricanes fertilize mangrove forests in the Gulf of Mexico (Florida Everglades, USA). Proceedings of the National Academy of Sciences, 117, 4831–4841. [DOI] [PMC free article] [PubMed] [Google Scholar]
- Chu, J.‐E. , Lee, S.‐S. , Timmermann, A. , Wengel, C. , Stuecker, M.F. & Yamaguchi, R. (2020) Reduced tropical cyclone densities and ocean effects due to anthropogenic greenhouse warming. Science Advances, 6, eabd5109. [DOI] [PMC free article] [PubMed] [Google Scholar]
- Cummings, A.R. & Shah, M. (2018) Mangroves in the global climate and environmental mix. Geography Compass, 12, e12353. [Google Scholar]
- Das, S. & Vincent, J.R. (2009) Mangroves protected villages and reduced death toll during Indian super cyclone. Proceedings of the National Academy of Sciences, 106, 7357–7360. [DOI] [PMC free article] [PubMed] [Google Scholar]
- Del Valle, A. , Eriksson, M. , Ishizawa, O.A. & Miranda, J.J. (2020) Mangroves protect coastal economic activity from hurricanes. Proceedings of the National Academy of Sciences, 117(1), 265–270. [DOI] [PMC free article] [PubMed] [Google Scholar]
- Donchyts, G. , Schellekens, J. , Winsemius, H. , Eisemann, E. & Van de Giesen, N. (2016) A 30 m resolution surface water mask including estimation of positional and thematic differences using landsat 8, srtm and openstreetmap: a case study in the Murray‐Darling basin, Australia. Remote Sensing, 8, 386. [Google Scholar]
- Emanuel, K. (2005) Increasing destructiveness of tropical cyclones over the past 30 years. Nature, 436, 686–688. [DOI] [PubMed] [Google Scholar]
- European Space Agency . (2015) Sentinel‐2 user handbook. Available from: https://sentinel.esa.int/documents/247904/685211/Sentinel‐2_User_Handbook [Accessed 15th June 2020].
- European Space Agency . (2020) Sentinel‐1 SAR user guide introduction. Available from: https://sentinel.esa.int/web/sentinel/user‐guides/sentinel‐1‐sar [Accessed 15th June 2020].
- Farukh, M. , Hossen, M. & Ahmed, S. (2019) Impact of extreme cyclone events on coastal agriculture in Bangladesh. Progressive Agriculture, 30, 33–41. 10.3329/pa.v30i0.41555 [DOI] [Google Scholar]
- Getis, A. & Ord, J.K. (1992) The analysis of spatial association by use of distance statistics. Geographical Analysis, 24, 189–206. [Google Scholar]
- Giri, C. , Ochieng, E. , Tieszen, L.L. , Zhu, Z. , Singh, A. , Loveland, T. et al. (2005) Global mangrove forests distribution, 2000. Palisades, NY: NASA Socioeconomic Data and Applications Center (SEDAC). Available from: 10.7927/H4J67DW8 [Accessed 24th May 2021]. [DOI] [Google Scholar]
- Goldberg, L. , Lagomasino, D. , Thomas, N. & Fatoyinbo, T. (2020) Global declines in human‐driven mangrove loss. Global Change Biology, 26, 5844–5855. [DOI] [PMC free article] [PubMed] [Google Scholar]
- Gopal, B. & Chauhan, M. (2006) Biodiversity and its conservation in the Sundarban mangrove ecosystem. Aquatic Sciences, 68, 338–354. [Google Scholar]
- Gorelick, N. , Hancher, M. , Dixon, M. , Ilyushchenko, S. , Thau, D. & Moore, R. (2017) Google Earth Engine: planetary‐scale geospatial analysis for everyone. Remote Sensing of Environment, 202, 18–27. [Google Scholar]
- Gray, W.M. (1968) Global view of the origin of tropical disturbances and storms. Monthly Weather Review, 96, 669–700. [Google Scholar]
- Guzman, O. & Jiang, H. (2021) Global increase in tropical cyclone rain rate. Nature Communications, 12, 5344. 10.1038/s41467-021-25685-2 [DOI] [PMC free article] [PubMed] [Google Scholar]
- Haque, U. , Hashizume, M. , Kolivras, K.N. , Overgaard, H.J. , Das, B. & Yamamoto, T. (2012) Reduced death rates from cyclones in Bangladesh: what more needs to be done? Bulletin of the World Health Organization, 90, 150–156. [DOI] [PMC free article] [PubMed] [Google Scholar]
- Hassan, M.M. , Ash, K. , Abedin, J. , Paul, B.K. & Southworth, J. (2020) A quantitative framework for analyzing spatial dynamics of flood events: a case study of super cyclone Amphan. Remote Sensing, 12, 3454. 10.3390/rs12203454 [DOI] [Google Scholar]
- Hochard, J.P. , Hamilton, S. & Barbier, E.B. (2019) Mangroves shelter coastal economic activity from cyclones. Proceedings of the National Academy of Sciences, 116, 12232–12237. [DOI] [PMC free article] [PubMed] [Google Scholar]
- Hogan, J.A. , Feagin, R.A. , Starr, G. , Ross, M. , Lin, T.‐C. , O'connell, C. et al. (2020) A research framework to integrate cross‐ecosystem responses to tropical cyclones. Bioscience, 70, 477–489. [Google Scholar]
- Hussain, M.Z. (2014) Bangladesh Sundarban Delta vision 2050: a first step in its formulation‐document 2: a compilation of background information. Dhaka, Bangladesh: IUCN, International Union for Conservation of Nature, Bangladesh Country Office, pp. 1–192. [Google Scholar]
- Islam, M.R. & Hasan, M. (2016) Climate‐induced human displacement: a case study of cyclone Aila in the south‐west coastal region of Bangladesh. Natural Hazards, 81, 1051–1071. 10.1007/s11069-015-2119-6 [DOI] [Google Scholar]
- Jhala, Y.V. , Qureshi, Q. , Gopal, R. , Kolipakam, V. , Kumar, U. & Saini, S. (2017) Protocols for monitoring habitat quality and wildlife populations in tiger landscapes. Tiger Cell, Wildlife Institute of India & Global Tiger Forum. Available from: https://globaltigerforum.org/wp‐content/uploads/2017/07/Tiger‐population‐monitoring.pdf. [Google Scholar]
- Jhala, Y.V. , Qureshi, Q. & Nayak, A.K. (2019) Status of tigers, co‐predators and prey in India 2018: summary report. Dehradun: National Tiger Conservation Authority, Government of India, New Delhi & Wildlife Institute of India. [Google Scholar]
- Karan, P.P. (2015) Climate change in Bangladesh: confronting impending disasters. The AAG Review of Books, 3(2), 63–65. 10.1080/2325548X.2015.1015913 [DOI] [Google Scholar]
- Khan, M.J.U. , Durand, F. , Bertin, X. , Testut, L. , Krien, Y. , Islam, A.K.M.S. et al. (2020) Towards an efficient storm surge and inundation forecasting system over the Bengal delta: chasing the super‐cyclone Amphan. Natural Hazards and Earth System Sciences. discussions:1–29. [Google Scholar]
- Knutson, T.R. , McBride, J.L. , Chan, J. , Emanuel, K. , Holland, G. , Landsea, C. et al. (2010) Tropical cyclones and climate change. Nature Geoscience, 3, 157–163. [Google Scholar]
- Krauss, K.W. & Osland, M.J. (2020) Tropical cyclones and the organization of mangrove forests: a review. Annals of Botany, 125, 213–234. [DOI] [PMC free article] [PubMed] [Google Scholar]
- Lagomasino, D. , Fatoyinbo, T. , Castañeda‐Moya, E. , Cook, B.D. , Montesano, P.M. , Neigh, C.S. et al. (2021) Storm surge and ponding explain mangrove dieback in Southwest Florida following hurricane Irma. Nature Communications, 12(1), 1–8. [DOI] [PMC free article] [PubMed] [Google Scholar]
- LeMarie, M. , van der Zaag, P. , Menting, G. , Baquete, E. & Schotanus, D. (2006) The use of remote sensing for monitoring environmental indicators: the case of the Incomati estuary, Mozambique. Physics and Chemistry of the Earth, Parts A/B/C, 31, 857–863. [Google Scholar]
- Leroux, M.‐D. , Wood, K. , Elsberry, R.L. , Cayanan, E.O. , Hendricks, E. , Kucas, M. et al. (2018) Recent advances in research and forecasting of tropical cyclone track, intensity, and structure at landfall. Tropical Cyclone Research and Review, 7, 85–105. [Google Scholar]
- Lin, T.‐C. , Hamburg, S.P. , Lin, K.‐C. , Wang, L.‐J. , Chang, C.‐T. , Hsia, Y.‐J. et al. (2011) Typhoon disturbance and forest dynamics: lessons from a Northwest Pacific subtropical forest. Ecosystems, 14, 127–143. [Google Scholar]
- Lin, T.‐C. , Hogan, J.A. & Chang, C.‐T. (2020) Tropical cyclone ecology: a scale‐link perspective. Trends in Ecology & Evolution, 35, 594–604. [DOI] [PubMed] [Google Scholar]
- Long, J. , Giri, C. , Primavera, J. & Trivedi, M. (2016) Damage and recovery assessment of the Philippines' mangroves following super typhoon Haiyan. Marine Pollution Bulletin, 109(2), 734–743. 10.1016/j.marpolbul.2016.06.080 [DOI] [PubMed] [Google Scholar]
- Macamo, C.C.F. , Massuanganhe, E. , Nicolau, D.K. , Bandeira, S.O. & Adams, J.B. (2016) Mangrove's response to cyclone Eline (2000): what is happening 14 years later. Aquatic Botany, 134, 10–17. [Google Scholar]
- Mallick, B. & Vogt, J. (2012) Cyclone, coastal society and migration: empirical evidence from Bangladesh. International Development Planning Review, 34(3), 217–240. 10.3828/idpr.2012.16 [DOI] [Google Scholar]
- Malmgren‐Hansen, D. , Sohnesen, T. , Fisker, P. & Baez, J. (2020) Sentinel‐1 change detection analysis for cyclone damage assessment in urban environments. Remote Sensing, 12, 2409. [Google Scholar]
- Mandal, M.S.H. & Hosaka, T. (2020) Assessing cyclone disturbances (1988–2016) in the Sundarbans mangrove forests using Landsat and Google Earth Engine. Natural Hazards, 102, 133–150. [Google Scholar]
- Markert, K.N. , Chishtie, F. , Anderson, E.R. , Saah, D. & Griffin, R.E. (2018) On the merging of optical and SAR satellite imagery for surface water mapping applications. Results in Physics, 9, 275–277. 10.1016/J.RINP.2018.02.054 [DOI] [Google Scholar]
- Marois, D.E. & Mitsch, W.J. (2015) Coastal protection from tsunamis and cyclones provided by mangrove wetlands – a review. International Journal of Biodiversity Science, Ecosystem Services & Management, 11(1), 71–83. 10.1080/21513732.2014.997292 [DOI] [Google Scholar]
- Mendelsohn, R. , Emanuel, K. , Chonabayashi, S. & Bakkensen, L. (2012) The impact of climate change on global tropical cyclone damage. Nature Climate Change, 2, 205–209. [Google Scholar]
- Menéndez, P. , Losada, I.J. , Torres‐Ortega, S. , Narayan, S. & Beck, M.W. (2020) The global flood protection benefits of mangroves. Scientific Reports, 10(1), 1–11. [DOI] [PMC free article] [PubMed] [Google Scholar]
- Moharrami, M. , Javanbakht, M. & Attarchi, S. (2021) Automatic flood detection using sentinel‐1 images on the Google Earth Engine. Environmental Monitoring and Assessment. 10.1007/s10661-021-09037-7 [DOI] [PubMed] [Google Scholar]
- Mondal, P. , Dutta, T. , Qadir, A. & Sharma, S. (2020) High‐resolution inundation dataset for coastal India and Bangladesh (version 1.0.0) [data set]. Zenodo. 10.5281/zenodo.4390084 [DOI]
- Morrow, B.H. & Lazo, J.K. (2015) Effective tropical cyclone forecast and warning communication: recent social science contributions. Tropical Cyclone Research and Review, 4, 38–48. [Google Scholar]
- Ord, J.K. & Getis, A. (1995) Local spatial autocorrelation statistics: distributional issues and an application. Geographical Analysis, 27, 286–306. [Google Scholar]
- Otsu, N. (1979) A threshold selection method from gray‐level histograms. IEEE Transactions on Systems, Man, and Cybernetics, 9, 62–66. [Google Scholar]
- Paul, B. & Rashid, H. (2016) Climatic hazards in coastal Bangladesh: non‐structural and structural solutions. Butterworth‐Heinemann. 10.1016/C2015-0-00129-0 [DOI] [Google Scholar]
- Peduzzi, P. , Chatenoux, B. , Dao, H. , De Bono, A. , Herold, C. , Kossin, J. et al. (2012) Global trends in tropical cyclone risk. Nature Climate Change, 2, 289–294. [Google Scholar]
- Peereman, J. , Hogan, J.A. & Lin, T.‐C. (2021) Disturbance frequency, intensity and forest structure modulate cyclone‐induced changes in mangrove forest canopy cover. Global Ecology and Biogeography, 31, 37–50. [Google Scholar]
- Potapov, P. , Li, X. , Hernandez‐Serna, A. , Tyukavina, A. , Hansen, M.C. , Kommareddy, A. et al. (2021) Mapping global forest canopy height through integration of GEDI and Landsat data. Remote Sensing of Environment, 253, 112165. 10.1016/j.rse.2020.112165 [DOI] [Google Scholar]
- Pruitt, J.N. , Little, A.G. , Majumdar, S.J. , Schoener, T.W. & Fisher, D.N. (2019) Call‐to‐action: a global consortium for tropical cyclone ecology. Trends in Ecology & Evolution, 34, 588–590. [DOI] [PubMed] [Google Scholar]
- Quader, M.A. , Khan, A.U. & Kervyn, M. (2017) Assessing risks from cyclones for human lives and livelihoods in the coastal region of Bangladesh. International Journal of Environmental Research and Public Health, 14(8), 831. 10.3390/ijerph14080831 [DOI] [PMC free article] [PubMed] [Google Scholar]
- Quadir, D.A. & Iqbal, A.M. (2008) Tropical cyclones: impacts on coastal livelihoods: investigation of the coastal inhabitants of Bangladesh. Dhaka, Bangladesh: IUCN Bangladesh Country Office. [Google Scholar]
- Radabaugh, K.R. , Moyer, R.P. , Chappel, A.R. , Dontis, E.E. , Russo, C.E. , Joyse, K.M. et al. (2020) Mangrove damage, delayed mortality, and early recovery following hurricane Irma at two landfall sites in southwest Florida, USA. Estuaries and Coasts, 43, 1104–1118. 10.1007/s12237-019-00564-8 [DOI] [Google Scholar]
- Rahaman, M. & Esraz‐Ul‐Zannat, M. (2021) Evaluating the impacts of major cyclonic catastrophes in coastal Bangladesh using geospatial techniques. SN Applied Sciences, 3, 727. 10.1007/s42452-021-04700-7 [DOI] [Google Scholar]
- Rahman, M.M. , Khan, M.N.I. , Hoque, A.K.F. & Ahmed, I. (2015) Carbon stock in the Sundarbans mangrove forest: spatial variations in vegetation types and salinity zones. Wetlands Ecology and Management, 23, 269–283. [Google Scholar]
- Rahman, M.M. , Lagomasino, D. , Lee, S. , Fatoyinbo, T. , Ahmed, I. & Kanzaki, M. (2019) Improved assessment of mangrove forests in Sundarbans east wildlife sanctuary using WorldView 2 and TanDEM‐X high resolution imagery. Remote Sensing in Ecology and Conservation, 5, 136–149. [Google Scholar]
- Rahman, M.S. , Hossain, G.M. , Khan, S.A. & Uddin, S.N. (2015) An annotated checklist of the vascular plants of Sundarban mangrove Forest of Bangladesh. Bangladesh Journal of Plant Taxonomy, 22, 17–41. [Google Scholar]
- Sandilyan, S. & Kathiresan, K. (2012) Mangrove conservation: a global perspective. Biodiversity and Conservation, 21, 3523–3542. 10.1007/s10531-012-0388-x [DOI] [Google Scholar]
- Sannigrahi, S. , Chakraborti, S. , Banerjee, A. , Rahmat, S. , Bhatt, S. , Jha, S. et al. (2020) Ecosystem service valuation of a natural reserve region for sustainable management of natural resources. Environmental and Sustainability Indicators, 5, 100014. [Google Scholar]
- Sattar, A.M. & Cheung, K.K.W. (2019) Comparison between the active tropical cyclone seasons over the Arabian Sea and Bay of Bengal. International Journal of Climatology, 39, 5486–5502. [Google Scholar]
- Simard, M. , Fatoyinbo, L. , Smetanka, C. , Rivera‐Monroy, V.H. , Castañeda‐Moya, E. , Thomas, N. et al. (2019) Mangrove canopy height globally related to precipitation, temperature and cyclone frequency. Nature Geoscience, 12, 40–45. [Google Scholar]
- Singh, O.P. , Khan, T.M.A. & Rahman, M.S. (2001) Has the frequency of intense tropical cyclones increased in the North Indian Ocean? Current Science, 80, 575–580. [Google Scholar]
- Sippo, J.Z. , Lovelock, C.E. , Santos, I.R. , Sanders, C.J. & Maher, D.T. (2018) Mangrove mortality in a changing climate: an overview. Estuarine, Coastal and Shelf Science, 215, 241–249. [Google Scholar]
- Sud, V. & Rajaram, P. (2020) Cyclone Amphan caused an estimated $13.2 billion in damage: government source. Kolkata, India: CNN. Available from: https://www.cnn.com/2020/05/22/weather/cyclone‐amphan‐damage‐intl‐hnk/index.html [Accessed 23rd December 2020]. [Google Scholar]
- Sun, F. & Carson, R.T. (2020) Coastal wetlands reduce property damage during tropical cyclones. Proceedings of the National Academy of Sciences, 117, 5719–5725. 10.1073/pnas.1915169117 [DOI] [PMC free article] [PubMed] [Google Scholar]
- Taillie, P.J. , Roman‐Cuesta, R. , Lagomasino, D. , Cifuentes‐Jara, M. , Fatoyinbo, T. , Ott, L.E. et al. (2020) Widespread mangrove damage resulting from the 2017 Atlantic mega hurricane season. Environmental Research Letters, 15, 064010. [Google Scholar]
- Tiwari, V. , Kumar, V. , Matin, M.A. , Thapa, A. , Ellenburg, W.L. , Gupta, N. et al. (2020) Flood inundation mapping‐ Kerala 2018; harnessing the power of SAR, automatic threshold detection method and Google Earth Engine. PLoS One, 15, e0237324. [DOI] [PMC free article] [PubMed] [Google Scholar]
- Twele, A. , Cao, W. , Plank, S. & Martinis, S. (2016) Sentinel‐1‐based flood mapping: a fully automated processing chain. International Journal of Remote Sensing, 37, 2990–3004. [Google Scholar]
- Uddin, M.S. , van Steveninck, E.R. , Stuip, M. & Shah, M.A.R. (2013) Economic valuation of provisioning and cultural services of a protected mangrove ecosystem: a case study on Sundarbans reserve Forest, Bangladesh. Ecosystem Services, 5, 88–93. [Google Scholar]
- Woodruff, J. , Irish, J. & Camargo, S. (2013) Coastal flooding by tropical cyclones and sea‐level rise. Nature, 504, 44–52. 10.1038/nature12855 [DOI] [PubMed] [Google Scholar]
- Zhang, C. , Durgan, S.D. & Lagomasino, D. (2019) Modeling risk of mangroves to tropical cyclones: a case study of hurricane Irma. Estuarine, Coastal and Shelf Science, 224, 108–116. [Google Scholar]
Associated Data
This section collects any data citations, data availability statements, or supplementary materials included in this article.
Supplementary Materials
Data S1. High‐resolution inundation dataset for coastal India and Bangladesh.
Figure S1. Histogram of pixels showing the distribution of radar backscatter values from a sample landscape.
Figure S2. OTSU thresholding was used for automated identification of water in the landscape at a high resolution (10 m).
Figure S3. Visual accuracy assessment of inundation data layers generated in this study using ground data as reported by Khan et al. (2020).
Figure S4. Visual assessment of NDVI differences (∆NDVI) between pre‐ and post‐Amphan NDVI values.
Figure S5. Marginal plot showing distribution of median ∆NDVI values along latitude and longitude axes of the ∆NDVI image.