

Abstract
Aim
To assess the strength of associations between interrelated perinatal risk factors and mortality in very preterm infants.
Methods
Information on all live‐born infants delivered in Sweden at 22–31 weeks of gestational age (GA) from 2011 to 2019 was gathered from the Swedish Neonatal Quality Register, excluding infants with major malformations or not resuscitated because of anticipated poor prognosis. Twenty‐seven perinatal risk factors available at birth were exposures and in‐hospital mortality outcome. Orthogonal partial least squares discriminant analysis was applied to assess proximity between individual risk factors and mortality, and receiver operating characteristic (ROC) curves were used to estimate discriminant ability.
Results
In total, 638 of 8,396 (7.6%) infants died. Thirteen risk factors discriminated reduced mortality; the most important were higher Apgar scores at 5 and 10 min, GA and birthweight. Restricting the analysis to preterm infants <28 weeks’ GA (n = 2939, 16.9% mortality) added antenatal corticosteroid therapy as significantly associated with lower mortality. The area under the ROC curve (the C‐statistic) using all risk factors was 0.86, as determined after both internal and external validation.
Conclusion
Apgar scores, gestational age and birthweight show stronger associations with mortality in very preterm infants than several other perinatal risk factors available at birth.
Keywords: infant mortality, orthogonal partial least squares discriminant analysis, preterm infant
Abbreviations
- AAP
American academy of pediatrics
- AUC
area under the curve
- BMI
body mass index
- BW
birthweight
- CRIB
clinical risk index for babies
- EXPRESS
extremely preterm infants in Sweden study
- GA
gestational age
- h
hour
- IQR
interquartile range
- IUGR
intrauterine growth retardation
- min
minute
- OPLS‐DA
orthogonal partial least squares discriminant analysis
- ROC curve
receiver operating characteristic curve
- SD
standard deviation
- SNAP‐II
score for neonatal acute physiology
- SNQ
Swedish neonatal quality register
Key Notes.
Large, population‐based assessments of multiple, co‐linear risk factors of mortality in preterm infants are lacking.
In this nationwide study of 8,396 infants <32 weeks of gestation and with 638 (7.6%) deaths, Apgar scores, gestational age and birthweight showed the strongest associations with mortality among 27 perinatal risk factors available at birth (C‐statistic =0.86, as validated internally and externally).
These findings can be used for educational purposes and in counseling.
1. INTRODUCTION
Preterm birth is the most common cause of perinatal and infant death, and the degree of prematurity is considered to be the most important risk factor for mortality. 1 , 2 , 3 Adding Apgar scores and clinical information from the first 12 postnatal hours have been shown to provide more precise risk assessments than those based on birthweight (BW) or gestational age (GA) alone. 4 , 5 , 6 , 7 , 8 However, risk scores such as the Clinical Risk Index for Babies (CRIB) 4 and the simplified Score for Neonatal Acute Physiology (SNAP‐II) 5 require detailed data collection after birth, which may be cumbersome to carry out on a routine basis and introduce detection bias, as well as problems with missing values. Maximum base excess, and minimum and maximum FiO2 in the first 12h are needed to calculate the CRIB score, and mean blood pressure, lowest body temperature, PO2/FiO2 ratio, lowest serum pH, multiple seizures and urine output at 12 h are needed for SNAP‐II. The CRIB score also demands information on congenital malformations, which may not be available at birth. In a recent evaluation, SNAP‐II did not predict hospital mortality better than GA, BW z‐score and infant sex. 9 A risk assessment tool based on variables available at birth may therefore be preferable.
The independent contributions of Apgar scores, GA and other risk factors to very preterm infant mortality remain unclear. 7 , 8 Because Apgar scores, GA and BW are correlated—not just to mortality but also to each other—it is difficult to assess the strengths of associations using multiple linear regression analysis. To account for this problem, other statistical methods may be better suited. Orthogonal partial least squares discriminant analysis (OPLS‐DA) was designed to take even strong collinearity between risk factors into account. 10 Using OPLS‐DA, the primary aim of this study was to assess the associations between multiple, interrelated perinatal risk factors and mortality in very preterm infants (GA <32 weeks) and to visualise the independent strengths of an association for each of these risk factors. The secondary aim was to determine the ability of the gathered information to assess the risk of mortality in very preterm infants born alive.
2. METHODS
The Swedish Ethical Review Authority approved this study on 21 February 2021 (Dnr 2020‐06984) and 15 February 2022 (amendment Dnr 2022‐00599‐02).
All data originated from the Swedish Neonatal Quality Register (SNQ). SNQ has had national coverage since 2011, and the patient and data completeness has been found to be excellent. 11 A nationwide cohort was created including all live‐born infants delivered at all levels of care in Sweden at 22–31 weeks of GA from 2011 to 2019 (N = 9418). Preterm infants with major malformations as defined by the European network of population‐based registries for the epidemiological surveillance of congenital anomalies (EUROCAT, n = 854) or not resuscitated because of anticipated poor prognosis (n = 106, median GA 23 [range 22–31] weeks) were excluded. Infants with >50% missing data for the risk factors listed below were also excluded (n = 62). Hence, 8396 infants were included.
Based on the literature 4 , 6 , 7 , 8 , 12 , 13 , 14 , 15 , 16 , 17 and on data availability in the SNQ, different maternal, pregnancy and birth characteristics, as well as selected perinatal interventions, were defined as risk factors or exposures (total n = 27: sixteen categorical and 11 ordinal/continuous). Maternal age was defined as age at delivery. Maternal prepregnancy conditions—such as asthma, diabetes and epilepsy—and pregnancy complications were reported to SNQ using checkboxes. Pre‐eclampsia was defined as gestational hypertension and proteinuria with first appearance after 20 weeks of GA; chorioamnionitis was diagnosed clinically; intrauterine growth retardation (IUGR) was defined as retarded foetal growth velocity based on 2 ultrasonographic measurements 2 weeks apart; and gestational diabetes was defined elsewhere. 18 GA was defined by early ultrasound in >96% of the pregnancies. Inborn was defined as born in hospital providing neonatal care for very or extremely preterm infants. Neonatal resuscitation was categorised as a) no resuscitation needed or active ventilation for <10 min, or b) active ventilation by mask or ventilator for ≥10 min.
The outcome for all analyses was in‐hospital mortality, defined as death occurring during neonatal care. Infant mortality in SNQ was validated against the Causes of Death Register kept by the National Board of Health and Welfare, and there were no missing data on outcome. Mortality among extremely preterm infants between 1 and 6½ years of age has previously been reported to be 1.6% in Sweden 19 ; thus, any potential right censoring of the data could be considered as very limited.
2.1. Statistical analyses
Data are described as numbers and proportions, or medians (with interquartile range, IQR). The risk factor distribution among survivors and infants who died was compared with the Mann–Whitney U test (using SPSS™, version 26) or the Fisher exact test (using JavaStat 2022, StatPages), and a p‐value < 0.05 was considered as statistically significant.
Missing data handling and subsequent multivariate data analysis were performed in the SIMCA 16 software (Sartorius Stedim Data Analytics), where missing data were handled using the principles given by Nelson et al. 20 To explore any selection and modelling biases, sensitivity analyses were performed using OPLS‐DA and including a) only infants with no missing values (n = 4131) and b) infants with ≤3 missing values on all risk factors (n = 8053).
Categorical risk factors (n = 16) were coded to dummy variables, comprising ones and zeros. Each categorical factor was coded to a dummy matrix where the number of binary variables corresponded to the number of levels of the factor. All data, the resulting dummy matrices and continuous variables (n = 11), were assembled into a matrix, X. The variables (columns) of matrix X were scaled to unit variance, where each variable was divided by its standard deviation. Prior to multivariate analysis, matrix X was centred by subtracting the mean vector of the columns.
The multivariate modelling technique OPLS‐DA 10 was applied to visualise cross‐validated score vectors for proximity to survival or mortality taking all risk factors into account. The internal cross‐validation procedure partitioned data into seven equally sized groups, which were then predicted one at a time. To assess the strength of the associations between risk factors and outcome, a receiver operating characteristic (ROC) curve was created and the area under the curve (AUC) was calculated. 21 A mortality score from 0 to 100 and based on the risk factor load was constructed from binning cross‐validated OPLS‐DA score values. A bin width corresponding to two per cent of the total score length was used. Construction and visualisation of ROC curves and mortality score were accomplished by in‐house scripts in MATLAB R2020b (the MathWorks).
Because it was known beforehand that the outcome mortality would be more common in extremely preterm infants with GA <28 weeks, a second sensitivity analysis including only extremely preterm infants was also performed. Finally, and using the same inclusion and exclusion criteria (not resuscitated because of anticipated poor prognosis, n = 8; major malformation, n = 150 and >50% missing data, n = 2), the model was externally validated using SNQ data (n = 1,683) collected from all neonatal units in Sweden in 2020–2021. A 95% confidence interval not overlapping 0 was considered as statistically significant in the OPLS‐DA analyses.
3. RESULTS
The median (IQR) BW was 1214 (878–1540) g, GA was 29.1 (26.9–30.9) weeks, and 427 (54%) were boys.
In total, 638 of 8,396 (7.6%) of the infants died. Mortality ranged from 68 of 140 (48.6%) at 22 weeks to 27 of 1,882 (1.4%) at 31 weeks of GA. The annual mortality varied between 7.1% and 8.4%, and it did not change significantly over the study period (7.6% in 2011 and 8.4% in 2019; p = 0.99). Among the infants who died, 78 (12%) died <12 h after birth, 35 (5%) died at 12‐<24h, 194 (30%) died at 1–<7 days, 202 (32%) died at 7–<28 days, and 129 infants (20%) died ≥28 days of postnatal age. The mortality among boys was 369/4,527 (8.1%), and in girls, it was 269/3,869 (7.0%, p = 0.04) (Table 1).
TABLE 1.
Risk factors (maternal, pregnancy and at birth) in very preterm survivors and infants who died. Data are no. (%) or median (IQR) if not stated otherwise
| Risk factor | No. (%) or median (IQR) in survivors, n = 7758 | No. (%) or median (IQR) in infants who died, n = 638 | p‐Value |
|---|---|---|---|
| Maternal risk factors | |||
| Maternal age, years | 30.9 (27.2–35.2) | 31.0 (27.1–35.4) | 0.73 |
| Missing | 57 | 7 | |
| Maternal type 1 diabetes | 123 (1.6%) | 8 (1.3%) | 0.60 |
| Missing | 82 | 1 | |
| Maternal asthma | 418 (5.5%) | 29 (4.6%) | 0.41 |
| Missing | 82 | 1 | |
| Maternal epilepsia | 53 (0.7%) | 3 (0.5%) | 0.80 |
| Missing | 82 | 1 | |
| No. of foetuses | |||
| 1 | 5693 (73%) | 473 (74%) | 0.71 |
| 2 | 1914 (25%) | 151 (24%) | 0.60 |
| 3 | 147 (1.9%) | 12 (1,9%) | 1.00 |
| 4 | 4 (0.05%) | 2 (0.3%) | 0.07 |
| Missing | 0 | 0 | |
| Pregnancy complications | |||
| Gestational diabetes | 141 (1.9%) | 9 (1.4%) | 0.54 |
| Missing | 117 | 1 | |
| Pre‐eclampsia | 1223 (16%) | 58 (9.1%) | 0.000 |
| Missing | 117 | 1 | |
| Placental abruption | 1005 (13%) | 115 (18%) | 0.001 |
| missing | 117 | 1 | |
| Chorioamnionitis | 314 (4.1%) | 46 (7,2%) | 0.000 |
| missing | 117 | 1 | |
| Intrauterine growth retardation | 906 (12%) | 82 (13%) | 0.45 |
| Missing | 117 | 1 | |
| Prelabour preterm rupture of membranes | 1248 (16%) | 122 (19%) | 0.07 |
| Missing | 117 | 1 | |
| Duration of ruptured membranes | |||
| 0–12 h | 4744 (72%) | 411 (72%) | 0.96 |
| >12–24 h | 207 (3.2%) | 30 (5.3%) | 0.01 |
| >24 h−1 week | 967 (15%) | 62 (11%) | 0.01 |
| >1 – 4 weeks | 427 (6.5%) | 42 (7.4%) | 0,43 |
| >4 weeks | 155 (2.4%) | 25 (4.4%) | 0.003 |
| Missing | 1188 | 68 | |
| At birth | |||
| Antenatal corticosteroids, any administered | 6266 (90%) | 520 (87%) | 0.02 |
| Missing | 775 | 37 | |
| Gestational age, days | 206 (191–216) | 175 (166–193) | 0.000 |
| Missing | 0 | 0 | |
| Mode of delivery | |||
| Vaginal delivery | 2593 (34%) | 266 (42%) | 0.000 |
| Abdominal delivery | 5126 (66%) | 371 (58%) | |
| Missing | 39 | 1 | |
| Time of birth 08.00–16:59 h | 3650 (47%) | 302 (47%) | 0.902 |
| Missing | 0 | 0 | |
| Inborn | 7219 (93%) | 544 (85%) | 0.000 |
| Missing | 0 | 0 | |
| Infant sex, boy | 4158 (54%) | 369 (58%) | 0.04 |
| Missing | 0 | 0 | |
| Apgar score at 5 min | 8 (7–9) | 5 (3–7) | 0.000 |
| Missing | 166 (2.1%) | 30 (4.7%) | |
| Apgar score at 10 min | 9 (8–10) | 7 (5–9) | 0.000 |
| Missing | 186 | 31 | |
| Birthweight, grams | 1250 (930–1563) | 685 (550–948) | 0.000 |
| Missing | 45 | 9 | |
| Birthweight z‐score | −0.93 (−1.87 ‐ −0.19) | −0.93 (−2.08 ‐ −0.07) | 0.37 |
| Missing | 45 | 9 | |
| Birthweight z‐score <−2SD | 1720 (22%) | 167 (27%) | 0.02 |
| Missing | 45 | 9 | |
| a Umbilical blood gas | |||
| Umb‐pH | 7.31 (7.26–7.36) | 7.32 (7.23–7.38) | 0.60 |
| Missing | 2028 | 323 | |
| Umb‐PCO2, kPa | 6.27 (5.35–7.28) | 5.90 (4.87–7.03) | 0.001 |
| Missing | 2311 | 334 | |
| Umb‐Base excess, mmol/L | −2.80 (−5.00 ‐ −0.83) | −3.70 (−6.53 ‐ −1.40) | 0.000 |
| Missing | 2017 | 322 | |
| Neonatal resuscitation | |||
| No need for resuscitation or resuscitation <10 min | 4188 (57%) | 244 (39%) | 0.000 |
| Resuscitation ≥10 min | 3190 (43%) | 376 (60%) | 0.000 |
| Missing | 380 | 18 | |
Abbreviation: IQR, interquartile range.
Umbilical arterial blood; if arterial values were missing, umbilical venous blood gases were used.
A 2D representation of the risk factor distribution in relation to outcome is presented in Figure 1. Thirteen risk factors (six dichotomous and seven continuous) were significantly associated with lower mortality. Four of these risk factors were more closely and equally strongly associated with reduced risk: higher Apgar scores at 5 and 10 min, GA and BW. Umbilical arterial blood gases (higher base excess or pH); resuscitation <10 min; inborn infant; BW z‐score (continuous or ≥−2SD); absence of chorioamnionitis; pre‐eclampsia; and caesarean section showed significant but weaker associations with decreased mortality. Resuscitation ≥10 min and outborn infant showed the strongest OPLS‐DA loadings for increased mortality. The remaining risk factors in the model (n = 14: maternal age, asthma, epilepsia, type 1 diabetes or gestational diabetes; number of foetuses; placental abruption; prelabour rupture of membranes or duration of ruptured membranes; IUGR; antenatal corticosteroids; time of birth; umbilical pCO2; or infant sex) did not show any significant association with outcome (Figure 2).
FIGURE 1.
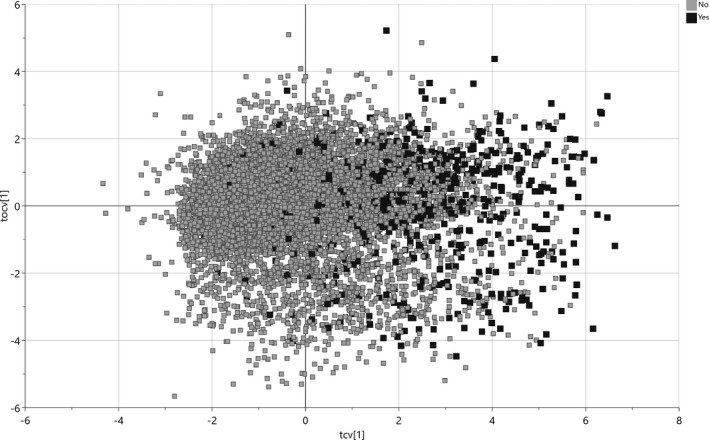
2D representation of risk factor distribution in live‐born very preterm infants (N = 8396) surviving (unfilled squares, no mortality) or dying in‐hospital (filled squares, yes for mortality). Cross‐validated score vectors (tcv) related to outcome are distributed along the x‐axis, and orthogonal vectors (tocv) unrelated to outcome are distributed along the y‐axis.
FIGURE 2.
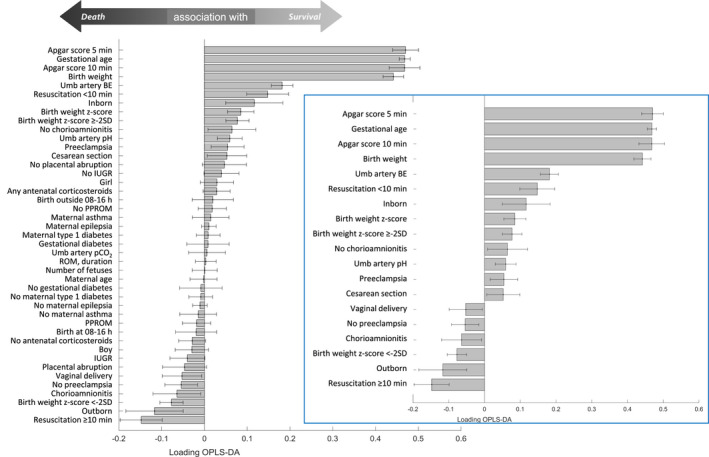
Bar chart depicting significant contributions (with 95% confidence intervals) of perinatal risk factors for survival (tcv significantly above 0) or death (tcv significantly below 0) in very preterm infants <32 weeks of GA (N = 8396). Infold: truncated bar chart excluding risk factors without any statistically significant contribution to outcome. BE, base excess; min, minutes; IUGR, intrauterine growth retardation; OPLS‐DA, orthogonal partial least squares discriminant analysis; PPROM, preterm, prelabour rupture of membranes; ROM, rupture of membranes; Umb, umbilical
Taking all risk factors into account, the area under the ROC curve (AUC or C‐statistic) was 0.86 (Figure 3A). Ranking the infants by frequency in every bin of cross‐validated score vectors (from left to right in Figure 1), a mortality score of <50 predicted <10% mortality, a score of 60 predicted 20% mortality, and a mortality score of 80 predicted 50% mortality (Figure 3B).
FIGURE 3.
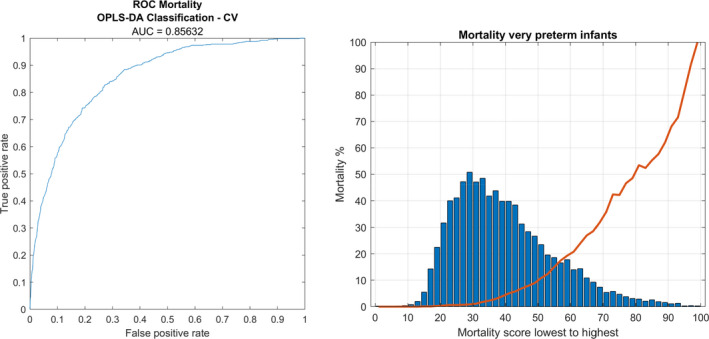
To the left (A): receiver operating characteristic (ROC) curve based on cross‐validated score values from orthogonal partial least squares discriminant analysis (OPLS‐DA) modelling of perinatal risk factors and mortality for very preterm infants. ROC area under the curve (AUC) is 0.86. To the right (B) mortality score (0 – 100) and the associated mortality for very preterm infants as given by OPLS‐DA cross‐validation
Handling of missing data did not introduce any bias. The sensitivity analyses using OPLS‐DA and including only infants with no missing values or infants with 0–3 missing values on all risk factors resulted in an AUC (C‐statistic) =0.86 for both models.
The second sensitivity analysis—restricting the data set to preterm infants <28 weeks GA, n = 2939—showed that higher Apgar scores at 5 and 10 min, higher GA and BW, umbilical arterial blood gases (higher base excess or pH) and caesarean section remained significantly associated with decreased risk for death. In addition, antenatal corticosteroid exposure was also found to be significantly associated with decreased risk, whereas the absence of chorioamnionitis and pre‐eclampsia, inborn infant, resuscitation <10 min and BW z‐score were no longer statistically significant risk factors for mortality (Figure 4).
FIGURE 4.
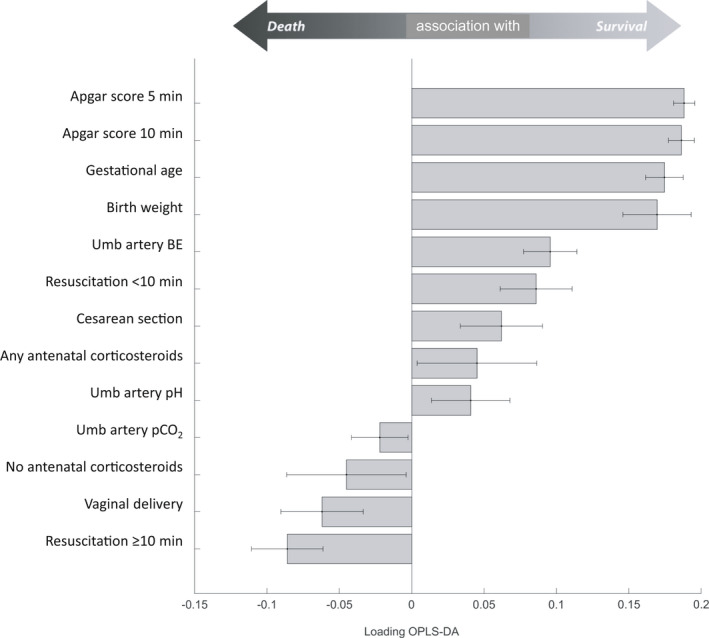
Truncated bar chart depicting significant contributions (with 95% confidence intervals) of perinatal risk factors for survival (tcv significantly above 0) or death (tcv significantly below 0) in extremely preterm infants <28 weeks of GA (n = 2939). Risk factors without any statistically significant contribution to outcome not shown (n = 17). BE, base excess; OPLS‐DA, orthogonal partial least squares discriminant analysis
The BW (1221 [875–1,550]) g, GA (29.3 [27.0–30.9]) weeks, sex distribution (920/1,683 [54%] boys) and mortality (133/1,683 [7.9%]) in the external validation cohort did not differ from those of the development model cohort (p = 0.67 for mortality). The AUC (C‐statistic) for the external validation cohort born in 2020–2021 was 0.88.
4. DISCUSSION
This study visualised the independent associations of a large set of perinatal risk factors with mortality in very preterm infants. Higher Apgar scores at 5 and 10 min together with higher GA and BW exhibited the strongest associations with lower mortality. Restricting the analysis to extremely preterm infants did not alter the main findings. The study also demonstrated ROC curve indicating excellent discriminant ability with an AUC/C‐statistic, which was in the same range or higher as those estimated in meta‐analyses of CRIB and SNAP‐II scores. 7 , 22 Given that all risk factors were available at birth, collection of more detailed clinical information in the first hours may not be necessary.
Recently, a comprehensive meta‐analysis of prognostic model development studies on mortality in very preterm infants was reported. 22 Three scores were evaluated: CRIB, CRIB‐II and SNAP‐II. Among the 35 studies included in the meta‐analysis, the number of participants (median = 828; range: 476–5,808) was smaller than the 8,396 infants studied in the present study, and the number of events (median = 171; range: 51–411) was lower than the 638 deaths included herein. 22 Internal validation of the models—in our study performed by cross‐validation—was lacking in 41% of the models. 22
External validation was also found to be lacking in a high proportion (96%) of the studies. 22 The authors suggested that the emphasis should be shifted from developing additional mortality prediction models towards external validation and consecutive adaption of existing ones. 22 However, this should not discourage from testing new modelling tools as they develop and validate them both internally and externally as performed in this study.
Logistic regression was used in most previous models predicting mortality in very preterm infants. 22 While multicollinearity in independent variables can cause problems in logistic regression, this can be tackled by adding dimensionality reduction 23 or by using a different regression technique. In the present study, we opted to use OPLS‐DA, as the data exhibited strong multicollinearity in the independent variables. In a single modelling step, OPLS‐DA combines classification with dimensionality reduction, completely mitigating the effect of redundancy in independent variables.
The American Academy of Pediatrics (AAP) has stated that preterm infants may receive a low Apgar score because of immaturity alone and that a low score cannot predict mortality. 24 In the cohort study forming the basis of the AAP statement, data were collected in three hospitals in 1984–1987, which may not accurately mirror contemporary conditions. 25 In addition, multiple regression analysis was used, which may be less suitable to account for the collinearity between Apgar scores, GA and BW. As a result, not only Apgar scores but also GA was disregarded as a risk factor for mortality. 25
Apgar scores at 5 and 10 min have recently been reported to provide prognostic information about mortality in preterm infants. 6 Since both our study and that by Cnattingius et al. 6 shared parts of the same Swedish cohort, it may not be surprising that the findings were in line with each other. Both studies demonstrated joint associations between GA and Apgar score on the risk of neonatal death using logistic regression 6 and OPLS‐DA, respectively.
The relevance of the association between Apgar score at 5 min and mortality was recently confirmed in an international neonatal network. 26 These and our findings align with reports on oxygen saturation values >80%, or heart rate >100 bpm at 5 min of postnatal age, as being significantly associated with reduced mortality in infants <32 weeks of GA. 27 , 28
Antenatal corticosteroid treatment has not been included in CRIB or SNAP‐II, or in some previous studies assessing risk factors for mortality. 6 , 22 , 26 In crude analysis, lack of antenatal corticosteroid treatment was significantly associated with mortality, but not in OPLS‐DA. This is in contrast to findings from systematic reviews of randomised controlled trials 29 and observational studies, from Sweden 30 and elsewhere. 16 , 17 Missing information for antenatal corticosteroids (10%) may have played a role, and although the sample size was large, a type II statistical error cannot be excluded. Another explanation could be that in modern neonatal care of infants born at 28–31 weeks of GA (the largest subgroup in this study with a mortality of 2.4%), antenatal corticosteroid treatment may not have the same impact on mortality as reported in older trials that form the basis of systematic reviews and meta‐analyses. 29 In the extremely preterm infants, uso of antenatal corticosteroids were significantly associated with lower mortality, confirming observational evidence that extremely preterm infants may benefit the most from antenatal corticosteroids. 13 , 17 , 30 , 31
Other perinatal risk factors not significantly associated with mortality were number of foetuses and infant sex. A large US cohort identified preterm boys to have significantly higher mortality than girls, and twins or triplets to have higher mortality than singletons. 12 A slightly higher mortality among boys than in girls was also found herein; however, in the OPLS‐DA model this difference did not reach statistical significance. In the Swedish Extremely Preterm Infants in Sweden Study (EXPRESS), there was no statistically significant difference in mortality between boys or girls, 13 suggesting that selections, population differences or differences in care may also contribute to differences in results between countries. 12 , 13 In both the US network and EXPRESS, the GA range was also significantly lower (22–26 weeks) than in the current study, suggesting that the inclusion of more mature preterm infants may have diluted some of the previously described associations between sex and mortality. However, the sensitivity analysis did not change the findings.
In an Australian survey study, perinatal staff overestimated mortality and major neurosensory disability rates in infants born at 24 – 28 weeks of GA. 32 To overcome such biases, an app for cell phones has been developed (NIC‐Predict™). In a similar fashion, the mortality score calculator created herein could be used for educational purposes and parental counselling and to simulate the effects of different loads of perinatal risk factors. However, the mortality score should not be used for decision‐making for individual patients. The discrimination between survival and mortality using a risk factor‐based tool can never be perfect or without exceptions, and it cannot replace a full clinical evaluation.
The data used for this model development covered 9 years. During this time, maternal age (data not shown) and very preterm birth rate (mean 1.0%; range: 0.9%–1.1%) 33 did not change significantly. In the general obstetric population in Sweden, smoking in early pregnancy declined from 6.3% to 3.9%, whereas the proportion of obese (BMI ≥30 kg/m2) pregnant women increased from 12.7% in 2011 to 15.7% in 2019. 33 The Neonatal Quality Register does not contain information on maternal obesity or BMI, ethnicity or smoking habits in pregnancy, which in addition to maternal age 34 are known risk factors for preterm delivery in a Swedish setting. 35 , 36 , 37 However, while these factors seem to affect the risk of preterm delivery, we have not found support for a direct effect on in‐hospital mortality in live‐born preterm infants.
The strengths of this study include the large, population‐based and contemporary cohort, large numbers of validated register data, GA determined by ultrasound reducing definition bias and all live‐born infants as defined by strict criteria in Swedish law—that is, there was no denominator bias. In contrast to some previous studies, the modelling was not restricted to mortality in the first 7–<28 days, the study population exclusively represents the post‐surfactant era, and the model was validated both internally and externally. 22 The use of OPLS‐DA provided a suitable tool to assess the independent associations between interrelated perinatal risk factors and infant mortality. The strengths of this data analysis technique included collapsing and visualising of multidimensional information into one relevant dimension.
One limitation may be that among infants admitted for neonatal care, we could not discriminate those admitted for palliative care with no intention to treat actively. In a Swedish setting, this is rare and infants reported as not receiving resuscitation because of anticipated poor prognosis or dying in the delivery room were excluded. However, although Sweden has one of the most active approaches to neonatal resuscitation and admission, the proportion of not resuscitated infants was not negligible among the most immature infants, especially in the beginning of the study period. 38 The total number of infants born at 22–23 weeks of GA was also moderate (n = 472), which may question the model's predictive abilities and its generalisability for live births at the lowest gestational ages. Other limitations included that unmeasured or unknown confounding could not be excluded, and causality could not be proven. The external validity outside Sweden also remains to be established.
In conclusion, multiple perinatal risk factors were found to contain prognostic information about the mortality risk in very preterm infants of which Apgar scores, gestational age and birthweight were the strongest.
CONFLICT OF INTEREST
The authors have no conflict of interest to disclose.
AUTHOR CONTRIBUTIONS
Dr Nilsson had full access to all data in the study and took responsibility for the integrity of the data and the accuracy of the data analysis. Håkansson, Nilsson and Norman acquired and analysed the data. Nilsson performed statistical analysis. Norman and Håkansson drafted the manuscript. Norman obtained funding. All authors conceived and designed the study, interpreted the data, critically revised the manuscript for important intellectual content, approved the final version of the manuscript and agreed to be accountable for all aspects of the work in ensuring that questions related to the accuracy or integrity of any part of the work are appropriately investigated and resolved.
ACKNOWLEDGEMENT
We thank all neonatal departments in Sweden for contributing and sharing data to our Neonatal Quality Register (SNQ).
Norman M, Nilsson D, Trygg J, Håkansson S. Perinatal risk factors for mortality in very preterm infants—A nationwide, population‐based discriminant analysis. Acta Paediatr. 2022;111:1526–1535. doi: 10.1111/apa.16356
Funding information
MN was supported by grants from a regional agreement on clinical research (ALF) between Region Stockholm and Karolinska Institutet (2020‐0443), and from the Childhood Foundation of the Swedish Order of Freemasons. The Swedish Neonatal Quality Register was funded by the Swedish Government (Ministry of Health and Social Affairs) and the body of Regional Health Care Providers. The funding bodies played no role in the design and conduct of the study; collection, management, analysis and interpretation of the data; preparation, review or approval of the manuscript; and decision to submit the manuscript for publication
REFERENCES
- 1. Ananth CV, Goldenberg RL, Friedman AM, Vintzileos AM. Association of temporal changes in gestational age with perinatal mortality in the United States, 2007–2015. JAMA Pediatr. 2018;172(7):627‐634. [DOI] [PMC free article] [PubMed] [Google Scholar]
- 2. Liu L, Oza S, Hogan D, et al. Global, regional, and national causes of child mortality in 2000–13, with projections to inform post‐2015 priorities: an updated systematic analysis. Lancet. 2015;385(9966):430‐440. [DOI] [PubMed] [Google Scholar]
- 3. Harrison MS, Goldenberg RL. Global burden of prematurity. Semin Fetal Neonatal Med. 2016;21(2):74‐79. [DOI] [PubMed] [Google Scholar]
- 4. The International Neonatal Network . The CRIB. (Clinical Risk Index for Babies) score: a tool for assessing initial neonatal risk and comparing performance of neonatal intensive care units. Lancet. 1993;342(8865):193‐198. [PubMed] [Google Scholar]
- 5. Richardson DK, Corcoran JD, Escobar GJ, Lee SK. SNAP‐II and SNAPPE‐II: simplified newborn illness severity and mortality risk scores. J Pediatr. 2001;138(1):92‐100. [DOI] [PubMed] [Google Scholar]
- 6. Cnattingius S, Johansson S, Razaz N. Apgar score and risk of neonatal death among preterm infants. N Engl J Med. 2020;383(1):49‐57. [DOI] [PubMed] [Google Scholar]
- 7. McLeod JS, Menon A, Matusko N, et al. Comparing mortality risk models in VLBW and preterm infants: systematic review and meta‐analysis. J Perinatol. 2020;40(5):695‐703. [DOI] [PubMed] [Google Scholar]
- 8. Medlock S, Ravelli AC, Tamminga P, Mol BW, Abu‐Hanna A. Prediction of mortality in very premature infants: a systematic review of prediction models. PLoS One. 2011;6(9):e23441. [DOI] [PMC free article] [PubMed] [Google Scholar]
- 9. Beltempo M, Shah PS, Ye XY, Afifi J, Lee S, McMillan DD. SNAP‐II for prediction of mortality and morbidity in extremely preterm infants. J Matern Fetal Neonatal Med. 2019;32(16):2694‐2701. [DOI] [PubMed] [Google Scholar]
- 10. Bylesjö M, Rantalainen M, Cloarec O, Nicholson JK, Holmes E, Trygg J. OPLS discriminant analysis: combining the strengths of PLS‐DA and SIMCA classification. J Chemometrics. 2006;20(8–10):341‐351. [Google Scholar]
- 11. Norman M, Kallen K, Wahlstrom E, Hakansson S, Collaboration SNQ . The Swedish neonatal quality register ‐ Contents, completeness and validity. Acta Paediatr. 2019;108(8):1411‐1418. [DOI] [PubMed] [Google Scholar]
- 12. Tyson JE, Parikh NA, Langer J, Green C, Higgins RD. Intensive care for extreme prematurity–Moving beyond gestational age. N Engl J Med. 2008;358(16):1672‐1681. [DOI] [PMC free article] [PubMed] [Google Scholar]
- 13. Group E , Fellman V, Hellstrom‐Westas L, et al. One‐year survival of extremely preterm infants after active perinatal care in Sweden. JAMA. 2009;301(21):2225‐2233. [DOI] [PubMed] [Google Scholar]
- 14. Bader D, Kugelman A, Boyko V, et al. Risk factors and estimation tool for death among extremely premature infants: a national study. Pediatrics. 2010;125(4):696‐703. [DOI] [PubMed] [Google Scholar]
- 15. Manktelow BN, Draper ES, Field DJ. Predicting neonatal mortality among very preterm infants: a comparison of three versions of the CRIB score. Arch Dis Child Fetal Neonatal Ed. 2010;95(1):F9‐F13. [DOI] [PubMed] [Google Scholar]
- 16. Norman M, Piedvache A, Børch K, et al. Association of short antenatal corticosteroid administration‐to‐birth intervals with survival and morbidity among very preterm infants: results from the EPICE Cohort. JAMA Pediatr. 2017;171(7):678‐686. [DOI] [PMC free article] [PubMed] [Google Scholar]
- 17. Ehret DEY, Edwards EM, Greenberg LT, et al. Association of antenatal steroid exposure with survival among infants receiving postnatal life support at 22 to 25 weeks’ gestation. JAMA Netw Open. 2018;1(6):e183235. [DOI] [PMC free article] [PubMed] [Google Scholar]
- 18. Persson M, Shah PS, Rusconi F, et al. Association of maternal diabetes with neonatal outcomes of very preterm and very low‐birth‐weight infants: an international cohort study. JAMA Pediatr. 2018;172(9):867‐875. [DOI] [PMC free article] [PubMed] [Google Scholar]
- 19. Serenius F, Källén K, Blennow M, et al. Neurodevelopmental outcome in extremely preterm infants at 2.5 years after active perinatal care in Sweden. JAMA. 2013;309(17):1810‐1820. [DOI] [PubMed] [Google Scholar]
- 20. Nelson P, Taylor PA, MacGregor JF. Missing data methods in PCA and PLS: Score calculations with incomplete observations. Chemom Intell Lab Syst. 1996;35(1):45‐65. [Google Scholar]
- 21. Mandrekar JN. Receiver operating characteristic curve in diagnostic test assessment. J Thorac Oncol. 2010;5(9):1315‐1316. [DOI] [PubMed] [Google Scholar]
- 22. van Beek PE, Andriessen P, Onland W, Schuit E. Prognostic models predicting mortality in preterm infants: systematic review and meta‐analysis. Pediatrics. 2021;147(5):e2020020461. [DOI] [PubMed] [Google Scholar]
- 23. Musa AB. A comparison of ℓ1‐regularizion, PCA, KPCA and ICA for dimensionality reduction in logistic regression. Int J Mach Learn Cybern. 2014;5(6):861‐873. [Google Scholar]
- 24. Pediatrics. American academy of pediatrics committee on f, newborn, American college of o, gynecologists committee on obstetric p. The Apgar score. 2015;136(4):819‐822. [DOI] [PubMed] [Google Scholar]
- 25. Hegyi T, Carbone T, Anwar M, et al. The apgar score and its components in the preterm infant. Pediatrics. 1998;101(1 Pt 1):77‐81. [DOI] [PubMed] [Google Scholar]
- 26. Shah PS, Norman M, Rusconi F, et al. Five‐minute Apgar score and outcomes in neonates of 24–28 weeks’ gestation. Arch Dis Child Fetal Neonatal Ed. 2021. doi: 10.1136/archdischild-2021-322230. Online ahead of print. [DOI] [PubMed] [Google Scholar]
- 27. Oei JL, Finer NN, Saugstad OD, et al. Outcomes of oxygen saturation targeting during delivery room stabilisation of preterm infants. Arch Dis Child Fetal Neonatal Ed. 2018;103(5):F446‐F454. [DOI] [PMC free article] [PubMed] [Google Scholar]
- 28. Kapadia V, Oei JL, Finer N, et al. Outcomes of delivery room resuscitation of bradycardic preterm infants: a retrospective cohort study of randomised trials of high vs low initial oxygen concentration and an individual patient data analysis. Resuscitation. 2021;167:209‐217. [DOI] [PMC free article] [PubMed] [Google Scholar]
- 29. Roberts D, Dalziel S. Antenatal corticosteroids for accelerating fetal lung maturation for women at risk of preterm birth. Cochrane Database Syst Rev. 2017;3(3):CD004454. doi: 10.1002/14651858.CD004454 [DOI] [PMC free article] [PubMed] [Google Scholar]
- 30. Norberg H, Kowalski J, Maršál K, Norman M. Timing of antenatal corticosteroid administration and survival in extremely preterm infants: a national population‐based cohort study. BJOG. 2017;124(10):1567‐1574. [DOI] [PubMed] [Google Scholar]
- 31. Cahill AGKA, Kuller JA, Turrentine MA. Use of Antenatal Corticosteroids at 22 Weeks of Gestation. American college of Obstetricians and Gynecologists and the Society for Maternal‐Fetal Medicine; 2021. [Google Scholar]
- 32. Boland RA, Davis PG, Dawson JA, Doyle LW. What are we telling the parents of extremely preterm babies? Aust N Z J Obstet Gynaecol. 2016;56(3):274‐281. [DOI] [PubMed] [Google Scholar]
- 33. Statistics from The National Board of Health and Welfare. (In Swedish: Socialstyrelsens statistikdatabas för graviditeter, förlossningar och nyfödda). 2022. https://sdb.socialstyrelsen.se/if_mfr_004/val.aspx. Accessed January 30, 2022.
- 34. Waldenström U, Cnattingius S, Vixner L, Norman M. Advanced maternal age increases the risk of very preterm birth, irrespective of parity: a population‐based register study. BJOG. 2017;124(8):1235‐1244. [DOI] [PubMed] [Google Scholar]
- 35. Cnattingius S, Villamor E, Johansson S, et al. Maternal obesity and risk of preterm delivery. JAMA. 2013;309(22):2362‐2370. [DOI] [PubMed] [Google Scholar]
- 36. Khanolkar AR, Wedrén S, Essén B, Sparén P, Koupil I. Preterm and postterm birth in immigrant‐ and Swedish‐born parents: a population register‐based study. Eur J Epidemiol. 2015;30(5):435‐447. [DOI] [PubMed] [Google Scholar]
- 37. Baba S, Wikström A‐K, Stephansson O, Cnattingius S. Influence of smoking and snuff cessation on risk of preterm birth. Eur J Epidemiol. 2012;27(4):297‐304. [DOI] [PubMed] [Google Scholar]
- 38. Norman M, Hallberg B, Abrahamsson T, et al. Association between year of birth and 1‐year survival among extremely preterm infants in Sweden during 2004–2007 and 2014–2016. JAMA. 2019;321(12):1188‐1199. [DOI] [PMC free article] [PubMed] [Google Scholar]