

Abstract
The synthesis of acetic acid by formal isomerization of methyl formate (MF) was investigated using molecular catalysts. The base‐catalyzed decarbonylation of MF, yielding CO and methanol in situ, was integrated with their palladium‐catalyzed recombination for the synthesis of acetic acid and methyl acetate in a one pot reaction. The complex [Pd(Cl)2(dppe)] [dppe=1,2‐bis(diphenylphosphino)‐ethane] in combination with NaI as iodide source and NaOMe as base were identified as promising molecular components to enable the overall conversion. Sequential application of the statistical methods design of experiments and simplex optimization was used in combination with thermodynamic analysis of the competing reaction pathways for experimental planning and data analysis. Starting from a proof‐of‐principle with a turnover number (TON) of 11, the catalytic system could thus be optimized to allow quantitative conversion of MF with a TON of 43000, whereby a yield of 83 % of acetate groups and a yield of 74 % for free acetic acid was obtained.
Keywords: acetic acid, carbonylation, design of experiment, isomerization, palladium
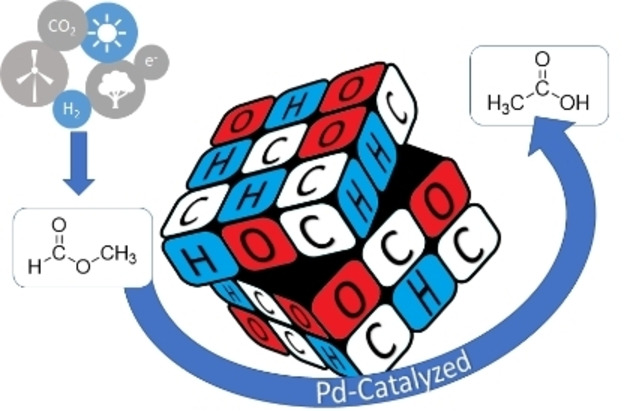
Power play: The Power‐to‐X synthesis of acetic acid by formal isomerization of the renewable carbon source methyl formate (MF) is realized applying a homogeneous molecular system. The base‐catalyzed decarbonylation of MF, yielding CO and methanol in situ, is combined with the synthesis of acetic acid and methyl acetate with Pd catalysts (turnover number up to 43000, acetate selectivity up to 83 %).
Introduction
Carbonylation reactions are a pillar of today‘s chemical industry for the production of bulk and fine chemicals. [1] Of extraordinary importance is the carbonylation of methanol with carbon monoxide (CO) for the production of acetic acid by the Monsanto and Cativa processes. In 2016, 80 % of the annually produced 13 million metric tons of acetic acid were obtained through these homogeneously catalyzed processes. [2] Today, the required feedstocks methanol and carbon monoxide are produced from fossil resources like coal, oil, or natural gas. [3] As part of the urgently required defossilization of the chemical value‐chain, carbon dioxide (CO2) is considered as a potential alternative C1 feedstock in line with the principles of green chemistry. [4] In addition to its direct conversion into CO by electrolysis or reverse water gas shift reaction (rWGS), indirect routes via methyl formate (MF), formic acid (FA), or MeOH are also discussed as CO surrogates or reservoirs. [5]
Scheme 1 depicts the retrosynthetic pathway for the production of acetic acid from carbon dioxide and renewable hydrogen via MF as intermediate. [6] This opportunity for a “power‐to‐X” approach to an important base chemical motivated our present study on the formal isomerization of MF to acetic acid.
Scheme 1.

Retrosynthetic planning of a “power‐to‐X” pathway for the production of acetic acid from carbon dioxide and hydrogen via MF and focus of the present report.
The use of methyl formate as feedstock for acetic acid or acetates was investigated in the 1980s in parallel to the establishment of methanol carbonylation processes as documented in the patent literature. [7] If additional CO pressure was applied, transition metal complexes based on rhodium, [8] iridium, [9] cobalt, [10] nickel, [11] and ruthenium, [12] together with an iodide source as promoter showed high productivities. [13] The Hüls AG patented a bimetallic RhCl3/Cr(CO)6 system able to achieve an outstanding turnover number (TON) of 5294 under such conditions (Table 1).
Table 1.
Homogeneous transformation of methyl formate to acetates and state‐of‐the‐art catalytic systems.
|
| ||||||||
|---|---|---|---|---|---|---|---|---|
|
| ||||||||
|
Ref. |
Catalyst |
Iodide source |
Promoter |
P(CO) [bar] |
T [°C] |
Solvent |
TON[a] |
Sel. acetates [%] |
|
[7e] |
RhCl3 ⋅ 3H2O |
MeI |
Cr(CO)6 |
50 |
200 |
– |
5294 |
87–99 |
|
[9c] |
IrCl4 ⋅ H2O |
MeI |
P2O5 |
1 |
190 |
– |
6720 |
78 |
|
[10a] |
Pd(OAc)2 |
LiI |
– |
50 |
175 |
NMP |
143 |
92 |
|
this work |
[Pd(Cl)2(dppe)] |
NaI |
NaOMe |
– |
173 |
– |
43130 |
83 |

[a] Calculated from reported experimental data.
In academic research, Petit and co‐workers investigated in detail the Rh/I−‐catalyzed carbonylation of methyl formate, concluding that different reaction mechanisms are operating, which are controlled by I−/Rh ratio, CO pressure, and solvent. The multimodal reactivity was found to lead to acetic acid, acetaldehyde, or methyl acetate as preferred products. [8a] Similar to methanol carbonylation, iridium‐based catalysts rival or even surpass the activity of rhodium catalysts also with MF as substrate. Pruett and Kacmarcik described the Ir‐catalyzed synthesis of acetic acid from MF in propionic acid as solvent, allowing the reaction to proceed without the need of high external CO pressure (≤1 bar). [9a] Cheong et al. optimized Ir‐based systems so that TONs up to 6720 within 2 h were achieved with IrCl4 ⋅ H2O/MeI as catalyst system in neat MF in the presence of P2O5 with an AcOH/AcOMe selectivity of 78 %.[ 9b , 9c ] Palladium catalysts were also investigated, showing in general significantly lower activities than rhodium and iridium. Röper et al. demonstrated that acetates can be produced with a TON of 193 at 230 °C and 70 bar CO when Pd(acac)2 (acac=acetylacetonate) was applied, leading to 29 % yield after 24 h. [13] Jenner reported a TON of 143 within 2 h and 92 % selectivity towards acetic acid applying Pd(OAc)2 at 175 °C. [10a]
In this work, we present an alternative strategy to exploit methyl formate for the synthesis of acetic acid via formal isomerization without the need for any external CO source. In an integrated transformation, the rapid and selective base‐catalyzed decarbonylation of methyl formate yielding CO and methanol in situ is combined with their recombination to produce acetic acid and methyl acetate using palladium complexes as catalysts (Scheme 2). The desired conjoint reactions, methyl formate decomposition and methanol carbonylation, are realized as a one‐pot process under neat conditions. Tailoring of the catalyst components together with the application of software‐supported design of experiments (DoE) and thermodynamic analysis of the underlying reaction network resulted in a catalytic system with a productivity for acetate formation surpassing those derived from previous reports by an order of magnitude.
Scheme 2.

Strategy for the combination of selective CO and methanol generation from methyl formate with methanol carbonylation in a one‐pot approach. (I) NaOMe‐catalyzed decarbonylation of MF. (II) Formation of methyl iodide from MeOH and NaI. (III) Pd‐catalyzed MeI carbonylation. Hydrolysis (IV) or methanolysis (V) to yield acetic acid or acetic acid methyl ester, respectively. The condensation of methanol to dimethyl ether is included as possible side reaction (VI).
Results and Discussion
Although the decarboxylation of MF yielding CO2 and CH4 is thermodynamically more favorable (ΔG° 400 K=−158.3 kJ mol−1) than the decarbonylation to CO and methanol (ΔG°400 K=−16.3 kJ mol−1), the latter transformations can be selectively accomplished using suitable catalysts including strong bases such as alkoxides.[ 9a , 14 ] Consequently, the decarbonylation of methyl formate to methanol and CO was investigated applying catalytic amounts of NaOMe (50–400 μmol) and methyl formate (2–4 mL) in a high‐pressure reactor at 160 °C. Within minutes, pressures of up to 180 bar at reaction temperature were achieved. Gas chromatographic (GC) analysis of the head space in the cooled reactor confirmed the high selectivity of this reaction. In all cases, the CO/CO2 ratio was above 99 % (Table S1, Supporting Information). Next, the decomposition was carried out in presence of a palladium complex together with an iodide source as possible carbonylation catalyst. To maintain the excellent CO‐formation selectivity, palladium was chosen over rhodium or iridium because of their high tendency to catalyze decarboxylation or WGS pathways.[ 9a , 15 ] The iodide source was envisaged to facilitate the transition metal‐catalyzed carbonylation step via oxidative addition of the in‐situ formed methyl iodide. [16] For the initial tests, the high‐pressure reactor was charged with Pd(OAc)2 (10 μmol), NaI (0.5 mmol), and equimolar amount of NaOMe dissolved in MF (2 mL) and heated to 160 °C (Table 2, entry 1). During the first minutes, a significant autogenous pressure increase was observable as before. After 15 h, the reactor was cooled down and the generated gas phase carefully released. In the remaining liquid phase, small amounts of 0.11 mmol of methyl acetate (TON=11) together with methanol and unconverted methyl formate were found. This proof‐of‐principle result was corroborated by analysis of the gas phase showing CO as the predominant compound (>99 %) whereas methane (<0.02 mmol, <0.1 %) and carbon dioxide (<0.1 mmol, <0.3 %) were present only in traces. However, a black precipitate in the yellow liquid reaction mixture indicated decomposition of the metal species to palladium black. Nevertheless, the formation of acetate under these conditions motivated us to systematically screen the various reaction parameters starting with the molecular components of the catalytic system.
Table 2.
MF isomerization to acetates: variation of catalyst components.[a]
|
Entry |
Precursor |
Additional PPh3 [b] [equiv.] |
NaOMe [mmol] |
NaI [mmol] |
TON[c] |
|
|---|---|---|---|---|---|---|
|
AcOMe |
AcOH |
|||||
|
1 |
Pd(OAc)2 |
– |
0.5 |
0.5 |
11 |
0 |
|
2 |
Pd(OAc)2 |
2.0 |
0.5 |
0.5 |
17 |
0 |
|
3 |
[Pd(Cl)2(PPh3)2] |
2.0 |
0.5 |
0.5 |
18 |
0 |
|
4 |
[Pd(Cl)2(PPh3)2] |
2.0 |
0.05 |
0.5 |
56 |
4 |
|
5 |
[Pd(Cl)2(PPh3)2] |
2.0 |
0.05 |
1.0 |
90 |
8 |
|
6 |
[Pd(Cl)2(PPh3)2] |
2.0 |
0.05 |
2.0 |
100 |
16 |
[a] Reaction conditions: [Pd]=10 μmol, MF=2.0 mL, T=160 °C, t=15 h. Products were quantified using 1H NMR spectroscopy with mesitylene as internal standard. [b] Additional ligand equiv. to precursor. [c] TON=mmolproduct mmolcatalyst −1.
The addition of 2 equiv. of PPh3 (TON=17) or starting directly with a preformed phosphine modified catalyst [Pd(Cl)2(PPh3)2] increased the productivity slightly (TON=17 and 18, respectively), but precipitation of palladium was still discovered at the end of the reaction (Table 2, entries 2 and 3). While no improvement was observed with other iodide salts (Table S2, Supporting Information), a significant increase in productivity was attained by varying the concentrations of NaOMe and NaI (Table 2, entries 4–6) reaching a TON of 116 with [Pd(Cl)2(PPh3)2]/PPh3 in the presence of only 0.05 mmol NaOMe and 2.0 mmol of NaI (Table 2, entry 6).
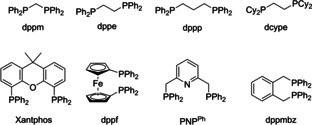
The effect of multidentate phosphine ligands with different bite angles and distinct steric demand was investigated as attempt to stabilize the molecular Pd species (Table 3). The use of the chelating phosphine 1,2‐bis(diphenylphosphino)ethane (dppe) led to an increased TON of 285 (Table 3, entry 1). Applying an additional equivalent of dppe resulted in a breakthrough. For the first time, a homogeneous solution without any precipitate was observed at the end of the reaction and a significantly increased catalyst productivity was achieved with a TON of 631 (Table 3, entry 2). With 2 equiv. of additional dppe, the TON increased to 915 defining the optimum ratio dppe/Pd of 3 : 1 (Table 3, entries 3 and 4). All other tested bidentate ligands (Table 3, entries 5–10) resulted in lower TONs as well as catalyst precipitation. Only the potentially tridentate PNPPh ligand also led to a homogeneous solution with a comparably high catalyst productivity, reaching a TON of 690 (Table 3, entry 11).
Table 3.
MF isomerization to acetates: ligand and P/Pd ratio variation.[a]
|
Entry |
Precursor |
Additional ligand [equiv.] |
Precipitate[b] |
TON[c] |
|
|---|---|---|---|---|---|
|
AcOMe |
AcOH |
||||
|
1 |
[Pd(Cl)2(dppe)] |
– |
yes |
285 |
32 |
|
2 |
[Pd(Cl)2(dppe)] |
1 |
no |
516 |
115 |
|
3 |
Pd(Cl)2(dppe) |
2 |
no |
756 |
159 |
|
4 |
[Pd(Cl)2(dppe)] |
4 |
no |
710 |
151 |
|
5 |
[Pd(Cl)2(dppm)] |
1 |
yes |
348 |
30 |
|
6 |
[Pd(Cl)2(dppp)] |
1 |
yes |
320 |
23 |
|
7 |
[Pd(Cl)2(Xantphos)] |
2 |
yes |
333 |
21 |
|
8 |
[Pd(Cl)2(dppf)] |
2 |
yes |
278 |
21 |
|
9 |
[Pd(Cl)2(dcype)] |
2 |
yes |
82 |
9 |
|
10 |
[Pd(Cl)2(dppmbz)] |
2 |
yes |
239 |
18 |
|
11 |
[Pd(Cl)2(PNPPh)] |
2 |
no |
544 |
146 |
|
|
|
|
|
|
|
|
| |||||
[a] [Pd]=10 μmol, NaOMe=0.05 mmol, NaI=1.0 mmol, MF=4.0 mL, T=160 °C, t=15 h. Products were quantified using GC‐FID with mesitylene as internal standard. [b] Precipitate formed at the end of the reaction. [c] TON=mmolproduct mmolcatalyst −1.
Under the conditions described in Table 3, entry 3, in addition to acetic acid and methyl acetate (9.15 mmol), significant amounts of side products were found in the liquid phase: dimethyl ether (3 mmol), ethyl acetate (0.2 mmol) as homologation product, formic acid (4.4 mmol), and traces of acetaldehyde and methane. In order to identify the main control factors to optimize the productivity of the Pd/dppe systems towards the desired acetate products in the complex reaction network (Scheme 2), we decided to move from a one factor at a time (OFAT) variation to a software‐supported experimental optimization strategy based on a DoE approach. [17] The parameters temperature, reaction time, amount of NaI, and amount of NaOMe were chosen as variables (Table 4), while the volume of methyl formate (4.0 mL), the catalyst loading {[Pd(Cl)2(dppe)]=0.015 mol %}, and the 2 equiv. of additional dppe were held constant. The experiment matrix of the response surface methodology (RSM) was calculated following the method of Box and Behnken using the Design Expert software. [18] A matrix of 29 experiments including 5 center points (level 0) was obtained, and the results are summarized in Table S6.
Table 4.
Applied variables and limits for the Box–Behnken design.
|
Independent variable |
Level |
||
|---|---|---|---|
|
−1 |
0 |
+1 |
|
|
T [°C] |
140 |
155 |
170 |
|
reaction time [h] |
1 |
8.5 |
16 |
|
NaI [mmol] |
0.50 |
1.25 |
2.0 |
|
NaOMe [μmol] |
50 |
125 |
200 |
The upper and lower boundaries (−1/+1 levels) were estimated from the previous screening results (Table 3). As response, the catalyst productivity TON for the desired products acetic acid and methyl acetate was chosen, as well as the CO/CO2 ratio in the gas phase. The analysis of variance (ANOVA) and fit statistics for the obtained data implied a quadratic model (Supporting Information, chapter 1.3) for correlation with a determination coefficient (R 2) of 0.96 for the response TON. The obtained mathematical function reflecting the interactions of the parameters is visualized in the three‐dimensional response surface graphs (Figure 1). The results show a positive trend for an increasing temperature, NaI amount, and reaction time. In contrast, augmenting the amounts of NaOMe is counterproductive. This substantiates and quantifies the trends observed in the initial screening experiments. For the second response, the CO/CO2 ratio, the fit statistics describe a weaker correlation of the data points to the fitted model with a calculated R 2 value of 0.79. A perturbation plot reveals a negative correlation with increasing reaction time, whereas raising the amount of NaOMe leads to a higher CO content in the gas phase after the reaction (Figure S3). In all conducted experiments the CO percentage of the gas phase composition was found to be above 90 %. From the mathematical result of the DoE a TON of 1353 was predicted if the reaction parameters were to be set at the factors 165 °C, 16 h, 1.76 mmol NaI, and 100 μmol of NaOMe. The validity of the model was verified experimentally achieving a TON of 1446±131, which corresponds to an improvement of nearly 50 % as compared to the starting conditions (Table 2, entry 3).
Figure 1.

Response surface plot for the Box–Behnken design. Interactions are shown for the parameters temperature and (a) NaI amount as well as (b) NaOMe amount on the response TON for acetates.
To investigate the potential of the reaction beyond the fixed boundaries of the DoE, a simplex optimization was chosen as suitable complement to the performed RSM. [17] Based on the DoE results, the parameters temperature, amount of NaOMe and NaI were chosen for the optimization resulting in a three‐dimensional design space. The remaining parameters were kept constant as before (16 h, [Pd(Cl)2(dppe)] 0.015 mol %, dppe 0.03 mol %, MF 4 mL). For the first simplex the best results from the Box–Behnken experimental plan were used as parameter set to start the algorithm. Again, the optimization target was set to maximize the catalyst productivity (TON) for the products acetic acid and methyl acetate. Satisfyingly, the first iteration (simplex 2) already resulted in a significantly improved amount of acetates with a remarkable catalyst productivity of TON 1,908 at a low standard deviation of ±51 (Figure 2). The simplex iteration converged around a TON value of around 2000 already within approximately 8 steps. The parameters of simplex 6 (173 °C; NaI: 2.92 mmol; NaOMe: 215 μmol) resulted in a TON of 2223±89 providing yet another improvement of 50 % as compared to the DoE optimization (Table 5).
Figure 2.

Results for the simplex search applied to the Pd‐catalyzed isomerization of methyl formate to acetates using the result of the DoE as starting point.
Table 5.
TON values and standard deviations for the simplex search applied to the Pd‐catalyzed isomerization of methyl formate to acetates using the result of the DoE as starting point.[a]
|
Simplex No. |
TON acetates[b] |
Standard deviation [%] |
|---|---|---|
|
1 |
1446 |
±9.0 |
|
2 |
1908 |
±2.6 |
|
3 |
585 |
±16.2 |
|
4[c] |
1811 |
±4.4 |
|
5 |
1382 |
±14.0 |
|
6[c] |
2223 |
±4.0 |
|
7 |
1018 |
±8.1 |
|
8[c] |
1993 |
±4.2 |
[a] Reaction conditions: [Pd(Cl)2(dppe)]=10.0 μmol, dppe=20.0 μmol, MF=4.0 mL, t=16 h. Products are quantified using GC‐FID with mesitylene as internal standard. [b] TON=mmolproduct mmolcatalyst −1. [c] Simplex rotated.
With the optimized reaction parameters at hand, the catalyst loading was reduced to explore the productivity limits. Remarkably, the TON scaled effectively linearly with the amount of catalyst until a loading of 1.87×10⁻³ mol % was reached (Table 6). This corresponds to only 1.25 μmol of Pd‐complex setting a practical limit to further reduction in our experimental setup. An extremely high TON of nearly 20000 was achieved within 16 h reaction time underlining the excellent stability of the catalyst under these reaction conditions.
Table 6.
Variation of catalyst loading on the formation of acetates applying the reaction conditions for the simplex optimization.[a]
|
Entry |
Catalyst loading [mol %] (μmol) |
Conv. MF [%] |
Product distribution [mmol] |
TON acetates[c] |
Sel. acetates [%] |
Mass balance [%] |
||||||||
|---|---|---|---|---|---|---|---|---|---|---|---|---|---|---|
|
AcOH |
AcOMe |
AcOEt |
MeOH |
FA |
DME |
CO |
CO2 |
Other[b] |
||||||
|
1 |
15×10−3 (10) |
89.1 |
9.4 |
13.2 |
0.5 |
3.8 |
3.6 |
3.2 |
14.6 |
2.3 |
1.5 |
2223±88 |
39.9 |
85.6 |
|
2 |
7.5×10⁻³ (5) |
92.9 |
17.7 |
11.9 |
0.5 |
2.1 |
3.8 |
3.2 |
19.2 |
2.2 |
0.8 |
5509±506 |
49.9 |
92.8 |
|
3 |
3.75×10⁻³ (2.5) |
88.6 |
14.8 |
11.4 |
0.3 |
2.9 |
5.1 |
3.2 |
19.5 |
1.5 |
0.8 |
11204±580 |
46.1 |
94.0 |
|
4 |
1.87×10⁻³ (1.25) |
91.0 |
14.3 |
10.4 |
0.2 |
2.0 |
4.0 |
4.9 |
20.5 |
1.0 |
0.5 |
19749±187 |
42.2 |
87.8 |
|
5[d] |
1.87×10⁻³ (1.25) |
99.9 |
48.2 |
5.1 |
0.6 |
0.1 |
n.d.[e] |
<0.1 |
2.2 |
1.3 |
0.2 |
43130 |
83.1 |
93.7 |
[a] Reaction conditions: P/Pd=6 : 1, NaOMe=215 μmol, NaI=2.92 mmol, MF=4.0 mL (65.0 mmol), T=173 °C, t=16 h. Quantification of the liquid phase using GC‐FID with mesitylene as internal standard. Quantification of the gas phase using ethylene as internal standard. [b] Acetaldehyde, ethanol, methane. [c] TON=mmolproduct mmolPd‐catalyst −1 as determined in at least two independent runs. [d] t=168 h. [e] n.d.=not determinable.
The ratio of acetic acid to methyl acetate (AcOH/AcOMe) reached up to 50 % under the hitherto optimized conditions. Dimethyl ether (DME) was present as the only significant further side product in 8.6 %. The methyl groups in the ester and ether product limit the stoichiometrically feasible quantitative conversion of MF towards acetic acid leaving significant parts of the liberated CO unreacted. The Gibbs free energies of the major reaction pathways leading to the three main products were analyzed in order to evaluate their relative thermodynamic driving forces. Density functional theory (DFT) calculations were performed at 446.15 K in the gas phase at def2‐TZVP/B3LYP‐D3(BJ) level (Table S8, Supporting Information) as a first approximation. Interestingly, the reaction of methyl formate to acetic acid with a ΔG of −131.8 kJ mol−1 is thermodynamically more favorable than the transformation to methyl acetate having a ΔG of −63.4 kJ mol−1. The formation of dimethyl ether from methyl formate is the least favorable pathway with ΔG=−13.0 kJ mol−1. With the formation of CO2 and CH4 being cut off kinetically, higher production of acetic acid from methyl formate should be possible if the formation of the side products was reversible to approach the thermodynamic equilibrium. To prove this hypothesis, an experiment with a prolonged reaction time of 1 week was performed under the conditions of Table 6, entry 5, and the result confirmed the analysis. The pressure/time curve (Figure 3b) shows the rapid autogenous pressure increase to approximately 150 bar within the first 10 min associated with the very fast decarbonylation step catalyzed by NaOMe. The MF conversion at this point reaches already around 70 % (Table S8, entry 6). The following pressure drop indicates the consumption of CO via the Pd‐catalyzed methanol carbonylation. Most notably, the pressure continuously decreases asymptotically towards the vapor pressure of the liquid products at the given reaction temperature confirming that the Pd‐catalyst remained active over the entire reaction time. Once a stable pressure was reached, the composition of the reaction mixture and gas phase of the autoclave revealed a practically quantitative conversion for MF (>99 %) as well as for the in‐situ formed methanol (>99 %) and CO (96 %). The amount of undesired DME was found to be below 0.1 mmol (<0.2 %, Table 6, entry 5). The molar amount of acetate groups accounted for 83.1 % of the initially charged as MF at a recovery rate of 93.7 % translating into an outstanding TON of 43130 for the conversion of the C1 groups into the C2 unit. Acetic acid was formed as the major product with a ratio AcOH/AcOMe/AcOEt of 90 : 9 : 1 corresponding to a yield of 74 % for the free acid (Table 6, entry 5).
Figure 3.

TON vs. catalyst loading. Reaction conditions: [Pd(Cl)2(dppe)]=var., P/Pd=6 : 1, NaI=2.92 mmol, NaOMe=215 μmol, MF=4.0 mL, T=173 °C, t=16 h. [b] Pressure/time curve under the same conditions over t=168 h.
Conclusion
We presented here a new catalytic system for the formal isomerization of methyl formate to acetic acid and methyl acetate opening a possible route for a “defossilized” production of acetic acid based ultimately on CO2 and H2 as primary feedstocks. While NaOMe catalyzes the selective decarbonylation of methyl formate to carbon monoxide and methanol with great efficiency, the catalyst [Pd(Cl)2(dppe)]/NaI enables the subsequent methanol carbonylation to acetic acid and methyl acetate very selectively under optimized conditions. The molecular components of the catalytic system are compatible with each other and act synergistically to enable the overall transformation in a single reactor unit without the need for an additional source for CO. An impressive increase in the productivity from an initial turnover number (TON) of 11 to a final TON of more than 43000 was achieved applying a combination of molecular engineering, statistical optimization methods, and thermodynamic analysis of the reaction network. This demonstrates the enormous potential for the systematic integration of software‐based experimental planning and data analysis with molecular concepts in chemistry and catalysis.
Experimental Section
General materials and methods
All applied chemicals were purchased from Sigma Aldrich (MERCK KGaA), Acros Organics, TCI Chemicals, or Alpha Aesar. They were used as received or, if necessary, purified by common methods. Solvents were distilled, degassed, and dried over molecular sieves (4 Å). Unless otherwise stated, all syntheses were carried out in an inert argon atmosphere using Schlenk techniques or in a glovebox using heat‐gun‐dried glassware. Methyl formate (97 %, Acros Organics) was stirred over Na2CO3 and freshly distilled on activated molecular sieves, degassed, and dried until the residual water content was below 10 ppm.
All nuclear magnetic resonance (NMR) experiments were carried out on a Bruker Ascend 400 MHz spectrometer at room temperature. 1H NMR and 13C NMR spectra were referenced to the residual solvent resonance and chemical shifts are given relative to tetramethylsilane. Proton broadband decoupled spectra are indicated as {1H}. Spin multiplicities were assigned as s (singlet), doublet (d), doublet of doublet (dd), triplet (t), quadruplet (q), and multiplet (m).
GC‐FID analysis of the liquid samples and quantification were carried out on a Trace 1310 (Thermo Fischer Scientific) equipped with an SSL injector (250 °C, split: 80 mL min−1, ratio 53), a VF‐WAXms column (60 m, 0.25 mm inner diameter, 0.25 μm film thickness, Agilent Technologies) and flame ionization detector (FID; 250 °C) with nitrogen as carrier gas. The separation was carried out by means of the temperature program: 50 °C isothermal for 10 min, 8 °C min−1 to 250 °C, 25 min at 250 °C.
The GC analysis and quantification of the permanent gases was performed on an HP 6890 Series (Hewlett Packard now Agilent Technologies) with manual injection (1000 μL) on a ShinCarbon ST (2 m, 1.0 mm inner diameter, 100/120 mesh) and a thermal conductivity detector (TCD) with helium as carrier gas. Separation was performed using a temperature program: 35 °C isothermal for 5 min, 3 °C min−1 to 150 °C, 5 min at 150 °C.
The GC analysis and quantification of the organic volatile compounds in the headspace of the autoclave were performed on a Trace 1310 (Thermo Fischer Scientific) with manual injection (1000 μL) on a TG‐624SilMS column (30 m, 1.8 μm) and FID detection with helium as carrier gas under isothermal conditions: 50 °C for 45 min. Detection using mass spectrometry (MS) was performed using an ISQ QD Single Quadrupole (Thermo Fischer Scientific). Ionization was performed at 250 °C. 70 eV (EI+).
The experimental design was calculated and analyzed using Design‐Expert Version 12.0.1 (StateEase, Inc.). The study type was set as Response Surface applying the Box–Behnken design type without blocks.
Experimental procedure
Safety advice: The selective decomposition of methyl formate at elevated temperatures leads to high autogenous pressures of carbon monoxide. This poses a significant safety risk and must solely be conducted using suitable high‐pressure equipment and following appropriate safety procedures.
In a typical experiment, a 10 mL Hastelloy autoclave equipped with glass inset and oven dried magnetic stirring bar was charged with the palladium complex [Pd(Cl)2(dppe)] (5.7 mg, 10.0 μmol, 1.0 equiv.), dppe (8.0 mg, 20.0 μmol, 2.0 equiv.), NaOMe (11.6 mg, 215 μmol, 21.5 equiv.), and NaI (437 mg, 2.92 mmol, 100 equiv.) under an argon atmosphere. Methyl formate (4.0 mL) was added using a syringe, and the autoclave was heated to the respective reaction temperature in a preheated aluminum cone. After the given reaction time, the autoclave was cooled in an ice bath and carefully vented. The entire gas phase was collected in a gas sampling bag and analyzed via GC using ethylene as internal standard. The liquid phase of the reaction was collected, and the autoclave was carefully rinsed with acetone. The entire liquid phase was analyzed with GC and/or NMR spectroscopy using mesitylene as internal standard.
Conflict of interest
The authors declare no conflict of interest.
1.
Supporting information
As a service to our authors and readers, this journal provides supporting information supplied by the authors. Such materials are peer reviewed and may be re‐organized for online delivery, but are not copy‐edited or typeset. Technical support issues arising from supporting information (other than missing files) should be addressed to the authors.
Supporting Information
Acknowledgements
The authors thank D. A. Kuß for performing the DFT calculations. Further they thank H. Eschmann, E. Biener and H. Fickers‐Boltz for excellent analytical support. This study was part of our activity in the “Fuel Science Center” under Germany's Excellence Strategy – Cluster of Excellence 2186, ID: 390919832 – and the project “Digitalization in Catalysis” NFDI4Cat – ID: 441926934 – both funded by the Deutsche Forschungsgemeinschaft (DFG, German Research Foundation) as well as the project Carbon2Chem (Verbundvorhaben Carbon2Chem‐L4: SynAlk‐Teilprojekt) – ID: 03EK3041D – funded by the Federal Ministry of Education and Research (BMBF). Open Access funding enabled and organized by Projekt DEAL.
P. Jürling-Will, T. Botz, G. Franciò, W. Leitner, ChemSusChem 2022, 15, e202201006.
Data Availability Statement
The data that support the findings of this study are available in the supplementary material of this article.
References
- 1. Beller M., Steinhoff B. A., Zoeller J. R., Cole-Hamilton D. J., Drent E., Wu X.-F., Neumann H., Ito S., Nozaki K., in Applied Homogeneous Catalysis with Organometallic Compounds, Wiley-VCH, Weinheim, 2017, pp. 91–190. [Google Scholar]
- 2. Budiman A. W., Nam J. S., Park J. H., Mukti R. I., Chang T. S., Bae J. W., Choi M. J., Catal. Surv. Asia 2016, 20, 173–193. [Google Scholar]
- 3. Weissermel K., Arpe H.-J., in Industrial Organic Chemistry, Wiley-VCH, Weinheim, 2003, pp. 15–57. [Google Scholar]
- 4. Zimmerman J. B., Anastas P. T., Erythropel H. C., Leitner W., Science 2020, 367, 397–400. [DOI] [PubMed] [Google Scholar]
- 5.
- 5a. Klankermayer J., Wesselbaum S., Beydoun K., Leitner W., Angew. Chem. Int. Ed. 2016, 55, 7296–7343; [DOI] [PubMed] [Google Scholar]; Angew. Chem. 2016, 128, 7416–7467; [Google Scholar]
- 5b. Wu L., Liu Q., Jackstell R., Beller M., Angew. Chem. Int. Ed. 2014, 53, 6310–6320; [DOI] [PubMed] [Google Scholar]; Angew. Chem. 2014, 126, 6426–6436; [Google Scholar]
- 5c. Jens C. M., Nowakowski K., Scheffczyk J., Leonhard K., Bardow A., Green Chem. 2016, 18, 5621–5629; [Google Scholar]
- 5d. Sang R., Kucmierczyk P., Dong K., Franke R., Neumann H., Jackstell R., Beller M., J. Am. Chem. Soc. 2018, 140, 5217–5223; [DOI] [PubMed] [Google Scholar]
- 5e. Yalfani M. S., Lolli G., Müller T. E., Wolf A., Mleczko L., ChemSusChem 2015, 8, 443–447; [DOI] [PubMed] [Google Scholar]
- 5f. Yalfani M. S., Lolli G., Wolf A., Mleczko L., Müller T. E., Leitner W., Green Chem. 2013, 15, 1146–1149; [Google Scholar]
- 5g. Hussong C., Langanke J., Leitner W., Green Chem. 2020, 22, 8260–8270. [Google Scholar]
- 6.
- 6a. Scott M., Westhues C. G., Kaiser T., Baums J. C., Jupke A., Franciò G., Leitner W., Green Chem. 2019, 21, 6307–6317; [Google Scholar]
- 6b. Westhues N., Belleflamme M., Klankermayer J., ChemCatChem 2019, 11, 5269–5274. [Google Scholar]
- 7.
- 7a.H. Dreyfus US1697109, 1929;
- 7b.N. Isogai (Japan Gas-Chemical Company, Inc.), US3839428 A, 1974;
- 7c.P. E. Antoniades (Chevron Research Co.), US4194056, 1980;
- 7d.T. Isshiki, Y. Kijima, T. Watanabe (Mitsubishi Gas Chemical Company, Inc.), DE3046899 A1, 1981;
- 7e.H.-U. Hög, G. Bub (Chemische Werke Hüls AG), DE3236351 A1, 1984;
- 7f.N. Rizkalla (The Halcon SD Group, Inc.), US4631348, 1985;
- 7g.D. J. Schreck (Union Carbide Corp.), EP0158720 A1, 1985.
- 8.
- 8a. Fontaine M., Castanet Y., Mortreux A., Petit F., J. Catal. 1997, 167, 324–336; [Google Scholar]
- 8b. Melloul S., Seuillet B., Castanet Y., Mortreux A., Petit F., J. Mol. Catal. 1990, 60, L15-L22; [Google Scholar]
- 8c. Schreck D. J., Busby D. C., Wegman R. W., J. Mol. Catal. 1988, 47, 117–121; [Google Scholar]
- 8d. Cheong M., Kang H.-J., Korean J. Chem. Eng. 1995, 12, 396–398. [Google Scholar]
- 9.
- 9a. Pruett R. L., Kacmarcik R. T., Organometallics 1982, 1, 1693–1699; [Google Scholar]
- 9b. Cheong M., Bae S.-H., Lee K. B., J. Chem. Soc. Chem. Commun. 1995, 1557–1558; [Google Scholar]
- 9c. Cheong M., Bae S.-h., Lee K. B., J. Mol. Catal. A 1996, 112, 389–393. [Google Scholar]
- 10.
- 10a. Jenner G., Tetrahedron Lett. 1990, 31, 3887–3890; [Google Scholar]
- 10b. Jenner G., Nahmed E. M., J. Organomet. Chem. 1991, 407, 135–142. [Google Scholar]
- 11.
- 11a. Cheong M., Lee S. H., Kim J. C., Lee J. S., Kim Y. G., J. Chem. Soc. Chem. Commun. 1990, 661–662; [Google Scholar]
- 11b. Cheong M., Lee S. H., Sa Y. S., Lee J. S., Kim Y. G., J. Mol. Catal. 1991, 68, 277–288. [Google Scholar]
- 12. Lütgendorf M., Elvevoll E. O., Röper M., J. Organomet. Chem. 1985, 289, 97–106. [Google Scholar]
- 13. Röper M., Elvevoll E. O., Lütgendorf M., Erdöl Kohle, Erdgas, Petrochem. 1985, 38, 38–38. [Google Scholar]
- 14.
- 14a. Imberdis A., Lefèvre G., Cantat T., Angew. Chem. Int. Ed. 2019, 58, 17215–17219; [DOI] [PubMed] [Google Scholar]; Angew. Chem. 2019, 131, 17375–17379; [Google Scholar]
- 14b.K.-D. Mohl, M. Schäfer, J. Paschold, J. H. Teles, S. Rittinger (BASF), EP2922815B1, 2017.
- 15. Baker E. C., Hendriksen D. E., Eisenberg R., J. Am. Chem. Soc. 1980, 102, 1020–1027. [Google Scholar]
- 16. Howard M. J., Jones M. D., Roberts M. S., Taylor S. A., Catal. Today 1993, 18, 325–354. [Google Scholar]
- 17. Brereton R. G., in Applied Chemometrics for Scientists (Ed.: Brereton R. G.), John Wiley & Sons, Ltd, Chichester, 2007, pp. 9–62. [Google Scholar]
- 18. Klein B., in Versuchsplanung - DoE, Oldenbourg Verlag, München, Wien, 2004, pp. 153–154. [Google Scholar]
Associated Data
This section collects any data citations, data availability statements, or supplementary materials included in this article.
Supplementary Materials
As a service to our authors and readers, this journal provides supporting information supplied by the authors. Such materials are peer reviewed and may be re‐organized for online delivery, but are not copy‐edited or typeset. Technical support issues arising from supporting information (other than missing files) should be addressed to the authors.
Supporting Information
Data Availability Statement
The data that support the findings of this study are available in the supplementary material of this article.