



ABSTRACT
In a much‐cited 1964 paper entitled “Reproductive efficiency in relation to colony size in hymenopterous societies,” Charles Michener investigated the correlation between a colony's size and its reproductive efficiency – the ability of its adult females to produce reproductives, measured as per‐capita output. Based on his analysis of published data from destructively sampled colonies in 18 species, he reported that in most of these species efficiency decreased with increasing colony size. His conclusion that efficiency is higher in smaller groups has since gained widespread acceptance. But it created a seeming paradox: how can natural selection maintain social behaviour when a female apparently enjoys her highest per‐capita output by working alone? Here we treat Michener's pattern as a hypothesis and perform the first large‐scale test of its prediction across the eusocial Hymenoptera. Because data on actual output of reproductives were not available for most species, Michener used various proxies, such as nest size, numbers of brood, or amounts of stored food. We show that for each of Michener's data sets the reported decline in per‐capita productivity can be explained by factors other than decreasing efficiency, calling into question his conclusion that declining efficiency is the cause of the pattern. The most prominent cause of bias is the failure of the proxy to capture all forms of output in which the colony invests during the course of its ontogeny. Other biasing factors include seasonal effects and a variety of methodological flaws in the data sets he used. We then summarize the results of 215 data sets drawn from post‐1964 studies of 80 species in 33 genera that better control for these factors. Of these, 163 data sets are included in two meta‐analyses that statistically synthesize the available data on the relationship between colony size and efficiency, accounting for variable sample sizes and non‐independence among the data sets. The overall effect, and those for most taxonomic subgroups, indicates no loss of efficiency with increasing colony size. Two exceptional taxa, the halictid bees and independent‐founding paper wasps, show negative trends consistent with the Michener hypothesis in some species. We conclude that in most species, particularly those with large colony sizes, the hypothesis of decreasing efficiency with increasing colony size is not supported. Finally, we explore potential mechanisms through which the level of efficiency can decrease, be maintained, or even increase, as colonies increase in size.
Keywords: Hymenoptera, ergonomic efficiency, division of labour, colony size, colony development, social evolution
I. INTRODUCTION
In an influential paper entitled “Reproductive efficiency in relation to colony size in hymenopterous societies”, Charles D. Michener (1964) examined the relationship between a colony's size and its per‐capita output. His stated aims were “(i) to show that behavioural mechanisms exist which cause efficiency to vary in relation to colony size and (ii) to explain certain aspects of the origin and evolution of colonies and of the non‐reproductive worker caste” (Michener, 1964, p. 317). Although Michael V. Brian, working with ants, was among the first to investigate the relationship between colony size and efficiency (Brian, 1953, 1956a,b), Michener was the first to review the Hymenoptera literature on how efficiency scales with colony size within species. Using published data on several groups of social and semisocial Hymenoptera, Michener plotted colony output – typically some measure of the amount of brood in the nest upon collection – as a function of colony size – usually measured as the number of adult females in the nest. Not surprisingly, in all 18 species of ants, bees, and wasps he examined, total colony output rose with colony size (Fig. 1A). But when colony output was divided by the number of females in the colony to yield output per capita, which Michener referred to as reproductive efficiency, the resulting measure decreased with increasing colony size (Fig. 1B) in all but two species. Michener concluded that this indicated “the existance (sic) of social patterns causing higher efficiency per female the smaller the group” (Michener, 1964, p. 334). This created a seeming paradox: how can natural selection favour and maintain social behaviour when a female apparently enjoys her highest per‐capita output by working alone?
Fig. 1.

Colony productivity and the Michener pattern. Outputs (y‐axis) reported by Michener were various measures of brood in the nest. While total colony output increases with colony size (A), per‐capita output decreases with colony size (B). This is the crux of Michener's paradox: it suggests that an individual would do better to reproduce on her own or in a small group than to join a large group.
Over the more than five decades since its publication, Michener's paper has been cited hundreds of times, for the most part uncritically, as evidence that efficiency decreases with increasing colony size (e.g. Brian, 1965; Tschinkel, 1988, 1993; Hölldobler & Wilson, 1990; Wenzel & Pickering, 1991; Foster, 2004; Powers & Lehmann, 2016; Stroeymeyt, Joye & Keller, 2017). This relationship has been referred to variously as the reproductivity effect of colony size (Wilson, 1971), a rule (Michener, 1974), an anti‐social factor (Wilson, 1975), a general feature of social insect colonies (Bourke & Franks, 1995, p. 332), a general pattern (Karsai & Wenzel, 1998), a key, recurring trend (Reeve & Hölldobler, 2007), and as Michener's paradox (Wenzel & Pickering, 1991). Thus, Michener's conclusion has gained widespread acceptance and has taken on the status of conventional wisdom (Starr, 2006). Although some authors have noted that the pattern is not universal and have cited exceptions in taxa they work with (e.g. Schwarz, Bull & Hogendoorn, 1998; Shreeves & Field, 2002; Smith, Wcislo & O'Donnell, 2007; Modlmeier & Foitzik, 2011), there has been no thorough review of the matter. Our goal is to provide that here.
There is no disputing the general pattern Michener reported: per‐capita productivity, as measured in the studies he cited, does indeed decrease in larger colonies in most of the published data sets he analysed. What is open to question is whether the measures he used actually evaluated efficiency, the focus of his paper, in any meaningful sense of the term. Michener used efficiency and reproductive efficiency interchangeably, defining them as the ability of the adult females of the colony to produce reproductives of the next generation. Because most of the studies he reviewed did not measure output directly in terms of numbers of sexuals produced, he used the number of immature individuals in a colony as an index of that ability (Michener, 1964). Although Michener's aim was to evaluate the effect of a colony's size on its efficiency, for most of the data sets he analysed, the indices, or proxies, he used for measures of output and/or input were influenced by a variety of factors other than colony size alone. These include the stage of colony development (ontogeny), seasonal effects, and the use of experimental procedures not designed to measure efficiency. Michener openly acknowledged these shortcomings but did not take them fully into account to temper the conclusions he drew from his analyses. For these reasons, the appropriate response to his proposition that efficiency decreases as colony size increases would have been to treat the pattern as a hypothesis to be tested, but the social‐insect research community has largely failed to recognize this and take up the challenge.
For several reasons, the question Michener raised is an important one. First, because of its pivotal effect on the evolution and maintenance of eusociality itself, colony efficiency plays an essential role in efforts to model the process (Fu, Kocher & Nowak, 2015; Field & Toyoizumi, 2020). Second, it is a key component of life‐history strategies (Poitrineau, Mitesser & Poethke, 2009). Third, efficiency is a colony‐level phenotype through which natural selection acts not only on colony size, but on such traits as division of labour, task partitioning, and mechanisms of colony integration via cues and signals (Goldsby et al., 2012). Finally, it is central to the fascinating but little‐addressed question of how selective forces interact to determine species‐typical colony size among the social insects (Michener, 1964; Wenzel & Pickering, 1991; Queller, 1996; Clouse, 2001; Kramer, Scharf & Foitzik, 2014).
Our objective in this review is to treat Michener's pattern as a hypothesis and to take preliminary steps towards testing it by disentangling the assortment of causes behind the declines in per‐capita output he reported. We state the hypothesis as follows: an ontogenetic increase in colony size has a negative effect on colony efficiency. We view a significant negative effect as supporting the hypothesis and a significant positive effect as evidence against it. A neutral effect may indicate no negative effect and thus constitute evidence against the hypothesis, provided the study has sufficient power to detect a significant effect.
Partly as a result of its lack of clarity in interpreting Michener's paper, the scientific community has barely begun to investigate the cause–effect relationships between colony size and efficiency, the question Michener originally sought to answer. Does larger colony size within a species enable greater efficiency through worker specialization and enhanced integration? Or, conversely, is efficiency reduced because workers in larger groups are more likely to get in one another's way, or work at cross purposes, as Michener contemplated? Theoretical arguments can be made for both sides (Clark & Fewell, 2014).
We begin in Section II with a close look at the meaning of the term efficiency, arguing that for a social insect colony it must be defined as some measure of total output (e.g. sexuals produced) in relation to some measure of total input (e.g. workers), measured over some unit of time. Ideally, measures of both output and input should be in terms of biomass or energy.
Section III provides a closer examination of how to measure efficiency and the pitfalls of using proxies.
In Section IV we scrutinize the data sets Michener used, teasing apart the various causes of the reduced per‐capita output he reported. Specifically, we ask whether each of the studies he cited provides evidence that efficiency decreases with increasing colony size. We show that while Michener's intent was to investigate the effect of colony size on efficiency, the data sets he analysed used proxies for input and output that did not fully measure colony efficiency. We conclude that most of his examples do not support his conclusion, and that virtually all can be explained by the effects of colony ontogeny, season, or experimental procedures that were not designed to measure efficiency. Despite these shortcomings, Michener performed a valuable service by calling attention to the issue of efficiency and by providing an initial analysis.
Section V is a review of evidence accumulated from the 1960s to the present, focusing on studies that control for the several factors that confounded Michener's analyses. We carry out a systematized review of the literature on colony size versus efficiency relationships across the bees, wasps, and ants. We conclude that across most taxa, a majority of data sets show a neutral or even a positive effect of colony size on efficiency, although the independent‐founding paper wasps and halictid bees have substantially more negative than positive effects, suggesting possible Michener effects in some of these species.
Section VI presents a meta‐analysis of colony size and efficiency relationships across the studies reviewed in Section V. This lends statistical support to the conclusion that, with the exception of select families, social insect species do not systematically exhibit declining efficiency with increasing colony size. Clarifying the issues in this way calls into question whether the so‐called paradox exists for those species and points to the need for further exploration of the notable variation among species.
Finally, in Section VII we consider potential mechanisms behind changes in efficiency across colony size.
II. THE MEANING OF EFFICIENCY
Michener's aim was to examine the relationship between colony size and the “ability of adult females (queens and workers) of the colony to produce reproductives of the next generation” (Michener, 1964, p. 337), or what he called reproductive efficiency. Efficiency is generally understood in terms of ergonomics, the ability of workers, human or otherwise, to execute tasks with a minimum expenditure of time and effort. It is clear that what Michener wanted to examine was efficiency in this commonly understood sense. We maintain that the concept of efficiency is useful only in this sense of relating to time and energy budgets of colony members and of the colony as a whole (Oster & Wilson, 1978; Anderson & Ratnieks, 1999). At the colony level, it is the ratio of some measure of total output produced to some measure of total input, per unit time. Defining efficiency in this way recognizes that how efficiently workers organize and execute tasks is a discrete social trait, a component of fitness that is subject to natural selection (Modlmeier & Foitzik, 2011; Scharf et al., 2012b), and therefore is worthy of study in its own right. The ultimate question Michener was interested in, and the one we address in this review, is how the efficiency with which colonies of a given species organize and carry out social tasks is affected by colony size.
Ideally, input and output should be measured in units of energy, but this is rarely achievable, especially over the entire colony cycle. Another close approximator of colony efficiency is total biomass of sexuals produced (output) divided by the biomass of workers produced over the entire cycle (input), but this is also rarely practicable. Instead, various proxies have been used as more accessible surrogates for input and/or output. Most of the data sets Michener analysed used more easily measured stand‐ins for input and output. These will be discussed in Sections III and IV. For now, the important point to make is that if the proxies that are used do not accurately represent a colony's total input and total output, they will not yield accurate measures of its efficiency, and must be interpreted carefully.
We define the terms we use in this review as follows:
Productivity (= reproductivity) (P). The products (output) of colony effort, including immatures being reared, sexuals produced, food stored, nest structure built, etc., measured as number, biomass, or energy content. Michener used the two terms interchangeably (Michener, 1964, 1974). We prefer ‘productivity’ because it is shorter, more general, and because reproductivity carries the connotation of production of offspring only (Tierney, Schwarz & Adams, 1997). In Michener's analyses various measures of colony growth were used as proxies for the output of sexuals. Often this was measured as the standing crop of brood in the nest when it was collected.
Colony size (S). The size of the colony, typically measured as the number or biomass of females in the colony at the time of collection.
Per‐capita productivity (PCP). Productivity divided by some measure of input, such as the number of colony members (females), that produced the output. Thus, in many studies PCP = P/S.
Efficiency (E). All forms of colony output divided by all forms of colony input, measured over a standardized time period. It is ideally measured in units of energy, in which case it is a unitless ratio. In practice, the number of females in the colony is often used both as a proxy for input and as a measure of colony size, S. If PCP includes all forms of input and output it is a valid measure of colony efficiency, E (Fig. 2).
Fig. 2.

Changing allocation of per‐capita investment among major forms of output during the colony cycle. Total investment (100%) is shown by the solid line at the top; it captures all forms of colony output (productivity) and represents the colony's efficiency (E). The three components of output – growth, survival and maintenance, and reproduction – sum to this total 100% at every stage. Michener's commonly used proxy for per‐capita output is represented by the growth line (dashed). Early in development, growth in worker numbers is the major form of output, but as the colony develops it invests increasingly in survival/maintenance (dot‐dashed line), and finally in reproduction (dotted line). These redirections of effort come at the expense of growth. Therefore, growth, the proxy metric for efficiency in most of Michener's analyses (typically measured in terms of numbers of cells or immatures in the nest at collection) gives a good approximation of efficiency early in the colony cycle but becomes increasingly inaccurate as the colony develops. A plot of per‐capita productivity (PCP) based on this proxy will decline with increasing colony size during development, just as in Michener's plots, but that plot will not accurately depict the colony's efficiency across all developmental stages or its ability to produce reproductives.
We maintain that only if declining per‐capita productivity can be attributed to decreasing efficiency as defined above can there be a paradox. If we are careful to take account of all forms of a colony's output – its investment in the nest, production of workers, collection and storage of food, defence against enemies, homeostatic maintenance of conditions conducive to survival and growth, in addition to its production of sexuals – then we have accurately measured the colony's efficiency (Fig. 2). If we then find that total per‐capita output decreases with colony size, we encounter the paradox.
Finally, it is important to recognize the role of colony survivorship and to distinguish it from colony efficiency. If the purpose is to calculate overall fitness – or mean expected output of newly initiated colonies in a population – then the risk of failure must be factored in. It is often the case that smaller colonies survive at lower rates than do larger ones (Gibo & Metcalf, 1978; Litte, 1981; Bull & Schwarz, 1996; Tschinkel, 2017). This differential success has been invoked to resolve the ‘paradox’ (Michener, 1964; Hölldobler & Wilson, 1990; Karsai & Wenzel, 1998) by recognizing that larger colonies may be maintained in a species’ population because they have a higher expectation of producing reproductives, even if their colony efficiency may be lower (Fig. 3, circles). By contrast, because efficiency is an intrinsic property of a colony it can be measured only in successful (i.e. living) colonies (Fig. 3, × symbols). We return to this issue in the next section.
Fig. 3.

The effect of including (O) versus excluding (×) failed colonies on calculations of per‐capita productivity (PCP) as a function of colony size. Sample size = 100 for each colony size. Rate of colony failure decreases with increasing colony size. Numbers indicate number of colonies included in each calculation of PCP; for each colony size the difference between colony numbers included gives the number of failed colonies. The upper plot is a measure of colony efficiency, while the lower plot is a measure of overall relative fitness.
Assessing the interaction of colony size and fitness was not Michener's purpose (all his data sets comprised successful colonies only) and is not our purpose here. The aim of this review is to focus on the intrinsic trait of ergonomic efficiency and to investigate its response to colony size by stripping away confounding factors that can bias measures of efficiency.
III. MEASURING ERGONOMIC EFFICIENCY
Ergonomic efficiency can be measured at two levels, the colony and the individual. The vast majority of studies, and all of Michener's analyses, deal with colony‐level efficiency, so we consider it first.
(1). Measuring ergonomic efficiency at the colony level: sampling methods, proxies, and pitfalls
A reliable measure of the efficiency of a colony can be calculated as total sexuals produced (output) divided by total workers required to produce them (input). A study that comes close to this is Morgan Webb's analysis of productivity in bumble bees (Bombus spp.) (Webb, 1961). In what can be called a full‐cycle longitudinal study (FCLS), Webb monitored housed field colonies continuously, starting with the early post‐emergence stage, and individually marked all emerging worker and reproductive offspring. Thus, his data provided a direct measure of near‐total input (total numbers of workers across the lifetime of the colony) and total output (numbers of sexuals produced) over the major part of the post‐emergence stage of the colony cycle. Because all of the colony's output (including food collected, stored, and utilized during the season) was captured in the final product, the gynes and drones, the ratio of sexuals produced per worker can be taken as a close approximation of the colony's ergonomic efficiency. Webb's results for Bombus pensylvanicus (De Geer) (= americanorum) showed a significant positive effect of worker number on per‐capita output of sexuals (Fig. 4), and his data for B. griseocollis (De Geer) and B. auricomus (Robertson) showed the same pattern (see Section V.2c below). (Sample sizes for two additional species were too small to analyse.) The only explanation for this pattern is that colony efficiency increases with colony size. A refinement would be to measure input in terms of worker‐days instead of just worker numbers. A second improvement would be to measure output in terms of biomass or energy rather than numbers, to account for the fact that Bombus gynes and drones differ in biomass and are substantially larger and more costly to produce than are workers (Del Castillo & Fairbairn, 2012) (see Section III.2).
Fig. 4.

Per‐capita productivity of Bombus pensylvanicus (= americanorum) colonies, based on total numbers of workers (W) and sexuals produced over the entire season. Seven colonies parasitized by B. (Psithyrus) variabilis (Cresson) are omitted because output of the host species was compromised. The four colonies shown with values of y = 0 did not die, but simply failed to produce males (M) or gynes (Q). Regression equation: (M + Q)/W = −0.092 + 0.0113 W, r 2 = 0.52, N = 24. Slope is significantly different from 0 at P < 0.001. Both slope and y‐intercept are significantly affected by year. Data from Webb (1961, table 26).
Such a direct approach is not only labour‐intensive but is feasible only for species whose adults and brood can be accessed, marked, and censused daily (e.g. independent‐founding wasps) or can be artificially housed for observation (e.g. twig‐nesting bees, bumble bees, honey bees, some wasps and ants). Data in this form were rare in the literature in 1964 and remain rare to this day.
Most of the data sets Michener analysed came from single‐point‐in‐time censuses of destructively sampled (DS) colonies, so direct measures of total sexual output were not possible. Instead, Michener made a compelling argument for the use of proxies for the production of sexuals: “…there are excellent reasons to believe that the ability of a colony to produce workers is positively correlated with its ability to produce sexual forms” (Michener, 1964, p. 320). He cited Webb's results in support of the correlation. Thus, Michener's analyses typically used numbers of immatures or provisioned cells in the collected nests as proxies for output and the number of females (queens and workers) collected with the nests as proxies for input.
Michener recognized that using proxies for the efficiency of production of reproductives requires that certain assumptions be met. Foremost among these is that colony stage be held constant across the samples: “[o]ntogenetic studies of colony populations confuse results due primarily to colony size itself with those due to the seasonal and age factors” (Michener, 1964, p. 320). By “colony size itself” he meant variation in the sizes of colonies at the same stage of development, not to size increases during development. Even if colony stage (and other biasing factors – see Section IV) are strictly controlled, colony size within a local population of a species can still vary. For example, the sizes of founding swarms of honey bees and epiponine wasps vary widely. Colonies of haplometrotically founding species (e.g. bumble bees, independent‐founding wasps) at identical post‐founding ages or stages may also vary widely in size, reflecting differential success in converting resources into offspring and in avoiding attrition of workers due to predation (Bourke & Franks, 1995).
Although the data sets Michener analysed contain a number of shortcomings (see Section IV), the issue of lack of control for ontogenetic changes in a colony's output is the most common, so we give it special attention here. To illustrate the bias imposed by the use of proxies in this context, consider the following scenario. Imagine a eusocial species living in an aseasonal tropical environment. Assume for simplicity that it lacks morphological castes and does not store food. Emulating the methods behind many of the data sets Michener analysed in his review, we destructively sample a large number of colonies of all sizes over the course of several days. As Michener did for many of his analyses, we measure colony size as the number of females, our proxy for input, and measure productivity as the number of brood in the nest, the proxy for output of reproductives. We calculate per‐capita productivity (PCP) by dividing the number of brood (output) by the number of females (input). Regressing PCP on colony size for our collected samples, we see that the regression slope is negative; that is, larger colonies have lower values of PCP than smaller ones. Can we conclude that the decline means that workers in larger colonies are somehow less ergonomically efficient than in smaller ones? Clearly not, because our sample may include colonies at all stages of development. Suppose that the average worker brings in enough food either to rear two immatures or to maintain two adults. For a small colony in the founding or early ergonomic stage (no adult reproductives yet produced), virtually all of the workers’ effort is going into colony growth, so our proxy for output – number or biomass of brood – provides a reasonable accounting of all productivity (see Fig. 2). Suppose that when this colony is collected it has 50 workers and 100 brood; according to our proxy, PCP is 100/50 = 2.0 brood/worker. Now suppose another colony in our sample is in the reproductive stage and is larger. Our census reveals 200 workers, 350 brood, and 50 adult gynes and males. These adult sexuals must be fed but contribute no work (input). Our calculation of PCP for this colony is 350/200 = 1.75, less than that of the smaller colony. Recognizing that maintaining each sexual means that one less brood can be reared, we have an explanation for the reduced number of immatures. In terms of the rate at which they bring in food, the workers in the large colony are just as efficient as in the smaller one, but our proxy has not captured the new form of output – the maintenance of the adult sexuals – and for this reason our measure of PCP does not accurately measure colony efficiency. The ontogenetic shift from rearing workers to rearing sexuals is an essential, adaptive part of the colony's life‐history strategy. It will not in and of itself lead to selection for smaller colonies, and therefore the decline in PCP recorded for the larger colony is hardly paradoxical.
A further potential biasing factor in this scenario is that the gynes may not be distinguishable from workers (e.g. in some sweat bees and wasps), and thus get counted on the input side of the equation. If, in the above example, there are 25 gynes in the larger colony but they get counted as workers, our calculation of PCP becomes 350/225 = 1.55. Therefore, because our results are based only on output of immatures – our proxy for productivity – they tell us nothing useful about either ergonomic efficiency or per‐capita production of sexuals in relation to colony size. The decline in PCP is an artifact of our choice of a proxy.
As an alternative scenario, suppose instead that we meet all the assumptions behind using proxies for input and output. Let us say we limit our sample to colonies that are just at the end of the founding stage and are about to produce their first adult (worker) offspring. Thus, we know that all the adults in each sample count as input, and everything else – the nest and the brood – counts as output. Now we have a measure of colony efficiency, a valid estimate of how efficient each colony will be at producing sexuals. Suppose our plot of PCP on colony size for this sample shows a decline. Now we have a paradox. If unopposed, natural selection should shift colony size downward, to sizes where per‐capita output is greater. Why this does not happen is a valid question, and the answer will often be that larger colonies have a greater probability of surviving to reproduce (see Section II). Even without investing relatively more in defensive structures (e.g. a hardened nest) or specialized workers (e.g. soldiers), having more workers is alone enough to elevate the colony's effectiveness in defending against predators, in buffering the effect of abiotic challenges, and in avoiding colony extinction by random attrition of adults. That is, if the greater expectation of survival of larger colonies exceeds the cost of their reduced efficiency, larger colonies will be maintained by natural selection because they enjoy greater fitness than do smaller colonies.
In addition to FCLS and DS, two additional sampling methods have been used in the literature. One is non‐destructive sampling (NDS) at one or more points in time. This technique is sometimes used for ants, where collection of entire colonies can be difficult. Proxies are used for input and output, but these are measured non‐destructively. For example, the size of nest mounds or mark‐and‐recapture techniques may be used to estimate colony size (see for example Cole & Wiernasz, 2000).
The second method is two‐point longitudinal sampling (TPLS). The colony is non‐destructively sampled at stage A of development and again (often destructively) at point B after the elapse of a fixed amount of time, and the production gains are calculated. The proxy for input is usually the number of workers at point A or B, or some calculated middle value; proxy for output is typically the net gain in standing crop of brood over the interval. This approach is feasible for species whose colony members are accessible to observation or can be non‐destructively censused at point A, for example at founding.
With both FCLS and TPLS it is often the case that some of the colonies included in the cohort at point A do not survive to point B. Rather than assigning a value of 0 to the productivity of non‐surviving colonies, they must be removed from the cohort. As argued in the previous section, the reason is that ergonomic efficiency is a trait intrinsic to the colony and therefore cannot be measured in colonies that fail. (As an analogy, suppose that in a study of the rate of mass gain in older humans we follow a cohort of 50‐year‐olds for 25 years. The calculation of the cohort's mean mass at age 75 clearly should not include values of 0 for individuals who did not survive to that age.) Excluding failed colonies assumes that their failure is not related to the unobserved rate of per‐capita productivity. Whether this assumption is met for any species is not known (Gibo, 1978; Strassmann, Queller & Hughes, 1988; Shakarad & Gadagkar, 1995), but is unlikely to be the case. If failure is more common among less‐efficient colonies, or among small colonies, excluding them will raise the left‐hand end of the regression of per‐capita output on colony size (Fig. 3), moving the curve in the direction of support for the hypothesis, thus raising the bar for rejecting it. By contrast, if colonies fail for reasons unrelated to level of ergonomic efficiency and colony size – for example, loss of the nest to a large predator – excluding failed colonies will have no effect on the shape of the regression curve of per‐capita output on colony size.
Two additional biasing factors should be mentioned. One has to do with the widespread use of counts of brood or provisioned cells as proxies for output. The data sets Michener analysed used counts, as do the majority of the more recent studies we analyse below. The most accurate measure of output would be in the form of energy invested by the colony to produce it. A reasonable approximation of this, at least for brood, would be the total biomass of the standing crop in the nest, although energy stored in brood may not correlate closely with biomass. In monomorphic species, for example, the biomass of workers and gynes may be identical, but if gynes contain a higher proportion of lipid, their energy content may be greater (Boomsma & Isaaks, 1985). Counts can be misleading representations of energy/biomass in three ways. First, as pointed out above, for species with size differences among castes – either workers versus sexuals (e.g. vespines, Bombus, Apis) or among workers (some ant species) – counts will not capture variation among colonies in the proportions of the castes among the brood. Second, there is evidence for some species that the size of offspring varies with the number of founding females (Goodisman & Ross, 1996; Clouse, 2001). Third, even for monomorphic species, if two colonies have the same total number of immatures, but differ in the proportions of eggs, larvae, and pupae, only biomass will accurately capture the difference in productivity between the two, given the large differences in biomass among brood stages. A good example of misleading brood‐count data comes from Spradbery's (1971) study of the wasp Vespula vulgaris. Plotting total brood number versus worker number suggests declining efficiency in larger colonies (figure 10 in Spradbery, 1971). In our reanalysis using pupal biomass data (calculated from pupal counts and corrected for mean caste biomasses reported in Archer, 2012), efficiency shows no decrease and is essentially linear with colony size (Fig. 5A; see Section V.3a and online Supporting Information, Table S1, for details). In conducting our meta‐analysis (see below), we found 28 data sets from 18 species reporting both measures of brood production output – counts and biomass. We compared these 28 pairs of efficiency estimates by regressing log(total output) on log(colony size) (see Section V.1b for more on this statistical approach for estimating efficiency), and plotting the difference in slope between each pair of measures (Fig. 5B). In most cases (26 of 28), the use of brood mass yields a higher slope, closer to 1.0 (no effect of size on efficiency). This bias in effect size – the difference between slopes – is significant (paired t‐test: t 27 = 3.99, P < 0.001). Clearly, using brood counts generates a bias in favour of the Michener paradox pattern.
Fig. 5.

The use of brood counts instead of brood masses creates a Michener pattern bias. (A) In one example, brood count data from Spradbery (1971) show the initial conclusion of a negative effect of colony size on efficiency in Vespula vulgaris (filled circles), with a slope (dashed line) significantly less than 1.0 (black line: neutral effect). However, when plotting pupal biomass data [pupal count data from the same study and biomass data from Archer (2012)], no negative effect is observed (open circles; dotted line). (B) A comparison of brood or cell counts versus brood masses as alternative proxies for measuring productivity. The symbols represent the slopes of the regressions of log(colony output) on log(colony size); lines connect the plot of count with the plot of mass for each of the 28 data sets. A slope of 1.0 indicates no effect of colony size on ergonomic efficiency. A + indicates a slope significantly greater than 1.0, while an × indicates a slope significantly less than 1.0. Filled squares are mean values for the groups. Data sets: a, Exoneura nigrescens (Nov) (Stevens et al., 2007); b, E. nigrescens (Dec) (Stevens et al., 2007); c, Parachartergus fraternus (Bouwma et al., 2006); d, Bombus lucorum (Müller & Schmid‐Hempel, 1992); e, Polybia occidentalis (1982) (Jeanne & Nordheim, 1996); f, Temnothorax crassispinus (Regensburg) (Kramer et al., 2014); g, T. crassispinus (Abensberg) (Kramer et al., 2014); h, Vespula vulgaris (Spradbery, 1971); i, Lasius sakagamii (winter larvae) (Yamauchi et al., 1982); j, Polybia occidentalis (1998) (Bouwma et al., 2005); k, Apis mellifera (brood) (Lee & Winston, 1985); l, T. nylanderi (Sommerhausen West) (Kramer et al., 2014); m, P. occidentalis (1983) (Jeanne & Nordheim, 1996); n, T. nylanderi (Sommerhausen South) (Kramer et al., 2014); o, P. occidentalis (1999) (Bouwma et al., 2005); p, T. americanus (NY) (Kramer et al., 2014); q, T. longispinosus (NY) (Kramer et al., 2014); r, Leptothorax acervorum (Abensberg) (Kramer et al., 2014); s, T. americanus (WV) (Kramer et al., 2014); t, V. germanica (Spradbery, 1971); u, T. longispinosus (WV) (Kramer et al., 2014); v, Myrmica punctiventris (NY) (Kramer et al., 2014); w, Polistes dominula (May) (Turillazzi et al., 1982); x, Leptothorax muscorum (Kramer et al., 2014); y, T. nylanderi (Scharf et al., 2012a); z, Bombus terricola (Owen et al., 1980); aa, E. nigrescens (Sept) (Stevens et al., 2007); bb, Polistes dominula (April) (Turillazzi et al., 1982).
The second biasing factor is time. Ideally, efficiency should be measured as a rate, for example as biomass/per worker/day (Clouse, 2001). There is evidence for some social wasps that broods develop faster in larger founding groups (Litte, 1977b; Clouse, 2001; Howard & Jeanne, 2004; Ito & Itioka, 2008). If, as is common in studies of social wasps, the point at which output is measured is just prior to the eclosion of the first offspring, larger colonies will reach that point in fewer days than smaller colonies. Thus, efficiency measured as biomass or numbers of brood when the chosen stage of development is reached will underestimate the efficiency of larger colonies, whereas calculating per‐capita productivity as a rate will more accurately reflect their greater investment. The conversion to a rate can readily be made in studies that measure output over a fixed period of time rather than to a stage of development (e.g. Jeanne & Nordheim, 1996; Bouwma, Nordheim & Jeanne, 2006). An associated potential bias introduced by using colony stage as a target point comes on the input side. Again, using swarm‐founding wasps as an example, the size of the founding swarm decreases during the pre‐emergence stage, largely due to mortality during foraging, at daily rates independent of swarm size (Bouwma et al., 2003a,b). Thus, because small colonies take longer to reach a particular stage of development, the adults collected with the nest at that point represent a smaller proportion of the founding swarm than for larger colonies. This reduces the denominator in the calculation of PCP, thus artificially raising the estimate of colony efficiency relative to large colonies.
In conclusion, the metric that best avoids most of the above pitfalls is biomass of brood produced per worker per day. Only a minority of studies we review use such a metric.
(2). Measuring ergonomic efficiency at the individual level
While a proper colony‐level analysis reveals the effect of colony size on the colony's overall ergonomic efficiency, it tells us nothing about the causes behind the colony‐level pattern. An increase or decrease in colony‐level efficiency begs the question of the mechanisms behind the effect. Efficiency at the sub‐colony level can be broken down into two components:
Task‐performance efficiency is the efficiency with which individual workers carry out social tasks, measured, for example, in worker‐minutes. Efficiency can increase when workers learn to perform a task faster and/or at lower cost by specializing on that task. A foraging bee that has discovered a nearby patch of flowers will collect more resource per hour by specializing on one species and learning how to handle its flowers than will a generalist forager that visits several species or that switches between collecting nectar and pollen (Heinrich, 1976; Oster & Wilson, 1978; Jeanne, 1986a; Raine & Chittka, 2007; Chittka & Muller, 2009).
Task‐integration efficiency is the efficiency with which a group of interacting individuals carries out a set of related tasks requiring cooperation among members of the group. Cooperation can be enhanced through the use of local information transmitted via cues and signals. Examples include efficiency gains achieved through recruitment of nestmates to resources (Oster & Wilson, 1978) and the partitioning of materials‐handling tasks among differently specialized individuals (Jeanne, 1986a; Ratnieks & Anderson, 1999; Anderson, Franks & McShea, 2001).
Studies at the individual level require an approach not unlike that used to analyse human productivity in terms of person‐hours required to complete a task. The colony's workers are marked for individual recognition, then timed as they engage in social tasks. One example of this method is a study of nest construction in the swarm‐founding wasp Polybia occidentalis (Olivier) (Jeanne, 1986b).
Potential mechanisms enabling increases or decreases in colony efficiency will be explored in more detail in Section VII.
While Michener openly acknowledged the requirements that the use of proxies imposed, despite his best intentions most of the data sets he analysed failed to meet them. The proxies used in the studies he analysed typically captured only a subset of each colony's total output (Fig. 2). As we show in the next section, because uncaptured forms of output were often neither controlled for nor accounted for by his surrogate measures for output of sexuals, the measures of per‐capita productivity he reported are not reliable indicators of the effects of colony size on colony efficiency, and in fact reveal little of value.
IV. SOURCES OF ERROR IN MICHENER'S ESTIMATES OF ERGONOMIC EFFICIENCY
Our intent here is to assess whether the declines in per‐capita productivity that Michener reported actually provided valid evidence of reduced ergonomic efficiency in larger groups. We do so by exploring the possible causes of the decline in each of his case studies. As explained above, because most of the studies Michener analysed used proxies for input and/or output, there is the potential for factors other than efficiency to bias the results. If the declines can be attributed to investment by larger colonies in forms of output not measured by his proxies, we can be sceptical that they are due to declining efficiency. In virtually all the data sets Michener analysed, this and/or other potential biasing factors were not controlled for. To illustrate the effects of each type of bias, we give one or more examples from his data sets. The examples given do not exhaust the issues attending each of Michener's data sets. Full results are summarized in Table 1.
Table 1.
Summary of data analysed by Michener (1964)
| Genus species N = sample size | Biasing factor not controlled for | Effect of colony size on per‐capita output | ||||||||||||
|---|---|---|---|---|---|---|---|---|---|---|---|---|---|---|
| Fig. | Data source | Output variable(s) | Input variable | Sampling type | Spp | Ont | Sea | Out | Tem | Col | Exp | Michener analysis | Our analysis | |
| Ruizantheda divaricata (Vachal) (=Pseudagapostemon divaricatus) N = 9 | NP | Michener & Lange (1958) | No. cells containing eggs, small larvae, or pollen masses | No. females in nest | DS | ✗ | ? | NA | (No effect) | |||||
| Augochloropsis sparsilis (Vachal) N = 38–77 | 1 | Michener (1964) | No. cells with eggs, small larvae, or pollen masses, per female | No. females in nest | DS | ✗ | ✗ | ✗ | ✗ | ? | NA | (Negative) | ||
| Lasioglossum imitatum (Smith) N = 109 | 2 | Michener (1964) | No. cells with eggs, small larvae, or pollen masses | No. females in nest | DS | ✗ | ✗ | ✗ | ✗ | ? | NA | Negative | ||
| L. rhytidophorum (Moure) N = 69 | 3 | Michener (1964) | No. cells with eggs, small larvae, or pollen masses | No. females in nest | DS | ✗ | ✗ | ✗ | ✗ | ? | NA | (Negative) | ||
| Bombus pensylvanicus (De Geer) (= americanorum) N = 24 | NP | Webb (1961) | Count of all workers, males, and gynes produced | No. workers produced | FCLS | NA | (Positive) | Positive | ||||||
| Apis mellifera (Linnaeus) N = ~66 | 10 | Farrar (1931) | Sealed brood cells, first week of May | No. females in nest | NDS | ✗ | ✗ | NA | Negative | |||||
| Apis mellifera N = 51 | 11 | Farrar (1931) | Sealed brood cells, June 23–Sept. 24 | No. females in nest | NDS | ✗ | ✗ | ✗ | NA | Negative | ||||
| Polybia bistriata (Fabricius) + P. bicyttarella Richards N = 20 | 4 | Richards & Richards (1951) | No. cells with eggs | No. females in nest | DS | ✗ | ✗ | ✗ | ✗ | ✗ | NA | (Negative) | Negative | |
| 11 species in 5 genera N = 49 | 5 | Richards & Richards (1951) | No. cells with eggs | No. females in nest | DS | ✗ | ✗ | ✗ | ✗ | ✗ | NA | (Negative) | No effect | |
| Myrmica rubra (Linnaeus) N = 12 | 6 | Brian (1950) | No. larvae/worker in overwintered colonies | No. workers in nest | DS | NA | No effect | |||||||
| Myrmica rubra N = 12 | NP | Brian (1950) | Grams larvae/worker in overwintered colonies | No. workers in nest | DS | NA | No effect | |||||||
| Myrmica rubra N = 7 | 7 | Brian (1953) | No. larvae metamorphosing after 17 days | No. workers in nest | Laboratory groups of varying ratios of workers and brood | NA | ✗ | No effect | ||||||
| Myrmica rubra N = 7 | 8 | Brian (1953) | Increase in mean larval mass after 11 days | No. workers in nest | Laboratory groups of varying ratios of workers and brood | NA | ✗ | Negative | Negative | |||||
| Myrmica rubra N = 9 | 9 | Brian (1953) | No. larvae surviving after 25 days | No. workers in nest | Laboratory groups of varying ratios of workers and brood | NA | ✗ | Negative | Negative | |||||
Note: Each species is scored for the types of errors that Michener's analysis is likely subject to. Genus species = species analysed. Fig. = figure number in Michener (1964) (NP = not plotted by Michener). Data source = original source of the data; Output variable(s) = measured product. Input variable = measure of colony size. Sampling type: DS = destructive sampling; NDS = non‐destructive sampling; FCLS = full‐cycle longitudinal sampling. Biasing factor not controlled for = factors (other than ergonomic efficiency) that can lead to the Michener pattern of declining per‐capita output: Spp = inclusion of more than one species; Ont = ontogenetic effects; Sea = season; Out = failure to include all forms of output; Tem = lack of temporal congruence of input and output; Col = collection error; Exp = inappropriate experimental design. Cell entries: ✗ = commits the error;? = not enough information to determine; NA = not applicable. Effect of colony size on per‐capita output = slope of regression of per‐capita output on colony size [at P = 0.05: positive, negative, no effect (not different from zero)]: Michener analysis = Michener's conclusion about slope; parentheses = not based on a statistical test; Our analysis = result of our statistical test in absence of Michener's and where data were available to us.
(1). Intrinsic effects: colony ontogeny
As noted above, as a colony develops it progresses through programmed changes in its allocation of resources among various forms of output (Fig. 2) (Oster & Wilson, 1978; Fewell & Harrison, 2016). Per‐capita productivity, typically measured via proxies such as numbers or biomass of brood reared per female, will be high during the founding and early ergonomic stages of rapid colony growth, when the colony is small. In later stages, when the colony is larger, the same metric will typically yield lower values because it fails to capture the increasingly important additional forms of output, such as investment in defence, homeostasis, food storage, and the production and maintenance of adult reproductives. The resulting apparent decline in per‐capita productivity therefore cannot be attributed to declining colony efficiency. If a limited proxy for output is to be used, then the stage of colony development must be held constant.
Michener's analysis of productivity in swarm‐founding wasps (Epiponini) is one of several of his data sets that have this problem. His figure 4, for example, plots data for 20 colonies of Polybia bistriata (Fabricius) and P. bicyttarella Richards collected over 2 months in Guyana (latitude 6° N) by Richards & Richards (1951). Because Guyana's climate is relatively aseasonal, their samples included colonies at all stages of development. Several of the larger colonies contained adult males, which must be fed, diverting resources away from growth. In addition, larger colonies may have been preparing to send out swarms and therefore may not have been producing brood at full capacity. These effects could well have led to the lower values of per‐capita productivity seen among the larger colonies in Michener's analysis, but for reasons having nothing to do with declining efficiency.
Another example is Michener's analysis of the honey bee (Apis mellifera Linnaeus) (his figure 10). The data came from overwintered, managed colonies sampled in Massachusetts in May by Farrar (1931). Honey bee colonies are perennial, and in the spring their size, developmental stage, and condition will vary (Fig. 6). Colonies with more workers begin to invest in reproduction in spring, whereas smaller colonies will refrain from reproduction until later in the season (Smith et al., 2014; Smith, Ostwald & Seeley, 2016). Michener's measure for colony output was the number of sealed brood cells, but Farrar reported that he decapitated drone brood at each census, so we know that some of the colonies were already investing in reproductives, which Michener's measure of colony output would not have included. Therefore, the most populous colonies would already have diverted resources to reproduction at the expense of producing more workers, whereas the smaller colonies would still be investing heavily in growth of the worker population (see Fig. 2). These differences could well be the main cause behind the declining per‐capita productivity curve that Michener reported for these bees.
Fig. 6.

Patterns of colony growth. Annual (A) and perennial (B) species show different patterns of growth depending on the time of year. In an annual species, the time of year correlates with the colony's stage of development, because all colonies are roughly on the same developmental trajectory (see also Fig. 2). In a perennial species, however, the age of the colony is as important as the time of year. A sample of colonies collected in early summer may include some that had recently been founded (Yr1), some that were investing heavily in growth/maintenance (Yr2) and some that were reproducing (Yr3+). Shading of lines denotes colony developmental stage: light grey = founding; medium grey = ergonomic; dark grey = reproduction; black = winter mortality. Black dotted lines connect surviving colonies from 1 year to the next.
Michener's analysis of Augochloropsis sparsilis (Vachal), a semisocial halictid bee, used his own data from Curitiba, Paraná, Brazil (latitude 25° S), where colony cycles are seasonally synchronized. Nests were sampled over a period of more than 4 months, thereby spanning much of the growing season. It is likely that there was attrition in the numbers of founding females, the measure of colony size (input) (Michener & Lange, 1959; Packer, 1993), while the number of cells containing pollen or young brood (output) increased. These trends would yield higher values of per‐capita productivity later in the season, when colonies were smaller. Any effects of colony size on efficiency were likely obscured by these ontogenetic effects. Michener's analysis of Ruizantheda divaricata (Vachal) [=Pseudagapostemon divaricatus (Vachal)] from the same locality, based on nests excavated during a narrower time frame (1 month), showed no effect of colony size on per‐capita output (Michener, 1964).
(2). Extrinsic effects: season
In temperate climates, season entrains ontogeny for species with annual colony cycles, but in many tropical regions this constraint is relaxed, so that colonies at all stages of development occur throughout the year. Yet even modest seasonality may affect colony growth. Colonies founded in a less‐benign period – the tropical dry season, for example – may experience less‐abundant food resources and therefore grow more slowly than those initiated in the wet season. Thus, even if care is taken to control for colony ontogeny, season may influence measures of the effect of colony size on efficiency in these habitats. Michener's data on Lasioglossum rhytidophorum (Moure), also from subtropical Curitiba, were collected over a period of 6 months and may have been differentially affected by seasonal differences in rainfall and temperature.
(3). Methodological flaws
(a). Combining several species for analysis
Because species differ in their ontogenetic schedules and degrees of allocation of effort to growth, maintenance, and reproduction, combining species for an analysis of the effect of colony size per se on ergonomic efficiency is not a valid procedure. Although Michener acknowledged this, for his analysis of the Neotropical swarm‐founding social wasps he combined species in order to obtain sample sizes large enough to analyse. Using data on swarm‐founding wasp colonies collected in Guyana (Richards & Richards, 1951), the first of his two analyses (his figure 4) combined data for two similar species of Polybia, and his second (his figure 5) lumped data for 11 species in five genera. In both cases, per‐capita productivity based on his proxy (number of eggs in the nest per female) decreased with increasing colony size. But because a species effect cannot be ruled out, the result cannot be accepted as supporting the hypothesis that efficiency decreases with colony size. Interspecific variation in colony efficiency is a topic worthy of investigation but is outside the scope of this review.
(b). Failure to include all input and/or output
Calculating colony efficiency based only on immatures, as Michener did, overlooks other potential forms of the colony's output, such as stored food and the nest structure itself (Bourke & Franks, 1995; Ostwald et al., 2021). These can account for large fractions of a colony's effort and may vary significantly with season and colony size. If not considered or controlled for, these factors can confound efforts to estimate efficiency. We cite three examples: stored food, collection error, and lack of temporal congruence of input and output.
(i). Stored food
Basing colony efficiency on brood only, without accounting for energy devoted to collecting and storing food, underestimates efficiency. Indeed, larger colonies of Apis mellifera store more honey per capita than smaller ones. Colonies of 60000 bees stockpiled 1.54 times more honey per bee than did colonies of 15000 bees (Farrar, 1937; Moeller, 1961), the opposite of the Michener pattern. Unfortunately, converting all forms of colony output into a single common currency is not feasible for honey bees, as it would require too many assumptions to generate an accurate estimate of total per‐capita output as a function of colony size.
(ii). Collection error
If colonies are collected during the day, as is often the case, foraging adults will be missed. The same is not true of measures of productivity, typically the numbers of brood or provisioned cells in the nest. This kind of error will reduce the denominator (input) in per‐capita productivity calculations, causing an artificial increase in the ratio of output to input. Because the failure to collect even one adult from a small founding group can have a large effect, this kind of error may be greater for small colonies, and thus could contribute to the Michener pattern. Michener's analysis of the data of Richards & Richards (1951) on swarm‐founding wasps may be subject to this kind of error. Richards and Richards did not place a great deal of importance on capturing all the adults in a colony. Nests were often taken during the day, and in numerous cases at least some wasps, sometimes many, escaped as the nest was being taken.
(iii). Lack of temporal congruence of input and output
Destructive sampling (DS) provides data on the state of the colony at a single point in its development. This can lead to serious distortions in the calculation of PCP. Common measures of productivity such as numbers of brood or brood cells represent the investment by the adults over several weeks prior to collection, but the number of workers collected with the nest may be quite different from the number that produced those forms of output. During the ergonomic stage, because the worker population (measure of input) is growing, its size at collection may be higher than it was when the measured output was produced, yielding an artificially low estimate of PCP. During the founding stage of swarm‐founding bees and wasps, the distortion becomes especially acute. In the wasps, for example, the number of brood – the measure of output – increases steadily, while the number of adult females – the measure of input – decreases by 50% in Polybia (Bouwma et al., 2003a) or even up to 90% in Apis (Smith et al., 2016), due to attrition without replacement. These changes will yield very low values of per‐capita productivity early in the founding stage, when the colony is large, and high values towards the end of the founding stage, when the colony is smaller (Fig. 7). Thus, because the time periods represented by input and output are not congruent, the resulting values of per‐capita productivity do not yield valid measures of ergonomic efficiency.
Fig. 7.
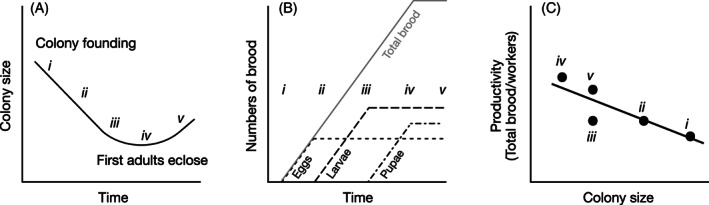
Lack of congruence of input and output. Growth is depicted of a hypothetical swarm‐founding colony that has established a new nest and begun to produce workers. (A) Colony size decreases due to worker mortality (points i–iii) until workers begin to eclose (iv), and colony size begins to increase (v). (B) The corresponding numbers of eggs, larvae, and pupae, assuming for simplicity constant rates of oviposition and constant development times. Each plateau represents the standing crop due to equal rates of brood entering and leaving that stage. Total brood (in grey), the sum of all forms of output (eggs + larvae + pupae) rises steadily until production plateaus. (C) This hypothetical colony is non‐destructively sampled at times i to v to determine its per‐capita productivity, that is, the number of brood the colony has reared divided by the number of workers in the colony at each point. This shows a negative relationship, like Michener's pattern, but the decline is simply due to the lack of congruence of input and output, and not to a difference in the efficiency of colonies of different sizes.
Michener's analysis of the swarm‐founding wasps is a clear example (Michener, 1964, his figures 4 & 5). He used the number of eggs in the nest as a proxy for colony productivity, on the grounds that they represent recent output, i.e. the effort of females still present when the nest was collected. However, not only do eggs represent only a minuscule fraction of the output of workers, but the number of eggs varies widely during colony ontogeny, even during the founding stage. As modelled in Fig. 8, the ratio of eggs in the nest to females in the founding swarm skews strongly upward in founding‐stage colonies, reaching its maximum when the worker population is at its minimum due to attrition. It then drops steeply during the subsequent ergonomic stage, when the number of workers is increasing. This is yet another reason why the results of Michener's swarm‐founding wasp analysis cannot be taken as supporting the hypothesis.
Fig. 8.
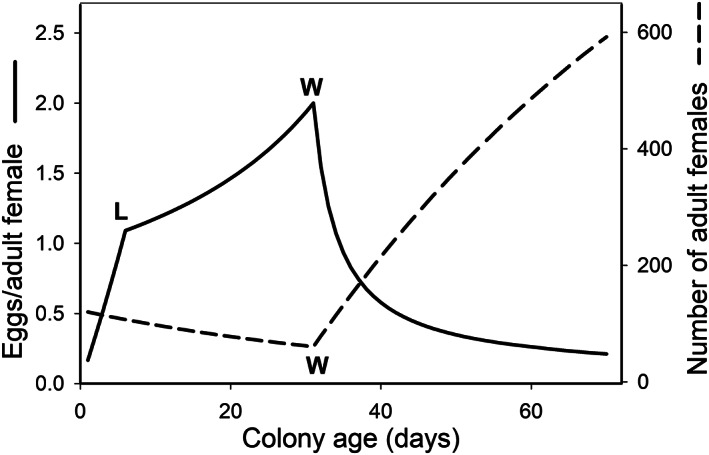
Early‐stage growth of a colony of swarm‐founding wasps, with per‐capita output based on eggs, per Michener (1964). Assumptions as in Fig. 6. Mortality of adults during the founding stage is 50% in the ~30 days it takes the colony to produce its first adult offspring (Bouwma et al., 2003a). The number of eggs per adult female (solid line) starts low (few eggs, many females), then rises rapidly as oviposition continues and workers in the founding group (dashed line) die without replacement. As the oldest eggs begin to hatch into larvae (point L), the number of eggs in the nest becomes constant (rate of hatching equals rate of oviposition), but because adult mortality is ongoing (Bouwma et al., 2003a) the number of eggs per‐capita continues to rise, albeit more slowly than before, and reaches a peak when the adult population is at its lowest, just as new workers begin to eclose (point W). After that point the eggs‐per‐adult ratio decreases, because the adult population is now increasing while the number of eggs in the nest remains constant. Thus, the highest value of eggs/adult occurs at the end of the pre‐emergence period, when the colony is smallest (point W). Relaxing the assumption of a constant colony‐wide rate of oviposition by the queens to, say, a sigmoidal or declining function, has no qualitative effect on this ontogenetic pattern.
Attaining full congruence requires certain conditions. Webb's (1961) Bombus study achieved it by including input (number of workers) and output (number of sexuals) over the entire colony cycle. TPLS that starts with founding is another viable option (e.g. Jeanne & Nordheim, 1996). If collected colonies are to provide reliable estimates of PCP, valid proxies for output must be chosen and the stage of colony development, season, and other biasing factors must be tightly controlled for across samples.
(c). Inappropriate experimental design
In his figures 7–9, Michener plotted the results of laboratory experiments on Myrmica rubra (Linnaeus) carried out by Brian (1953) to determine optimal ratios of larvae to workers. Variable numbers of workers (5–320) were provided with ad libitum food and a fixed number (50) of brood for them to rear. Productivity of the workers was measured in three ways: the number of larvae metamorphosing after 17 days, the increase in mean larval mass after 11 days, and the number of larvae surviving after 25 days. In each case, values of per‐capita productivity were smallest for the largest numbers of workers. However, the conclusion that these results support the hypothesis would be incorrect. The per‐capita output at higher worker numbers was very likely constrained by the fixed number of brood provided, and not by a decline in ergonomic efficiency, a point that Michener acknowledged (Michener, 1964, p. 336).
A better way experimentally to test the effect of group size on work‐group efficiency is to vary group size while keeping the worker/larva ratio constant. Brian used this approach in a later study, in which he set up groups of 3, 6, 9, 12, 20, 40, 80, and 160 workers, each with an equivalent number of larvae (worker: larva ratio = 1), and maintained them on ad‐libitum food (Brian, 1956a). At the end of 10 days there was no significant effect of group size on mean larval mass gain. In a second experiment, a single group of 190 larvae and 30 workers produced a mean larval mass gain of 0.74 mg over a week, whereas 10 groups of 19 larvae and three workers each produced a mean mass gain of 1.23 mg in the same time period. At first glance this appears to support the hypothesis, but Brian pointed out that the apparent inefficiency of the larger group may have been due to the tendency of the workers to pile larvae, which limited workers’ access to many of the larvae. He suggested that the artificial nests he used may have encouraged this, while the low ceiling height in natural brood chambers would prevent the piling of brood. Again, one cannot conclude from this study that ergonomic efficiency declines with increasing group size. Laboratory experiments to measure ergonomic efficiency must be designed carefully.
We conclude that none of the 14 data sets analysed by Michener provide compelling evidence that colony efficiency decreases with increasing group size. As summarized in Table 1, in most of his analyses one or more factors unrelated to efficiency were not controlled for and could have caused the decrease. In cases where all factors apparently were controlled for, the slope of the regression of per‐capita productivity on colony size did not differ significantly from zero. In fact, of all the data sets Michener included in his study, the Bombus results were the most compelling because total output of sexuals was measured directly over the entire reproductive stage of the colony cycle (Webb, 1961). Thus, it could be argued that Michener should have reached the opposite conclusion, that is, that workers in larger groups are more efficient, not less, compared to those in smaller groups.
While this analysis throws serious doubt on the hypothesis by identifying several factors other than ergonomic efficiency that could have caused the pattern, because there is no way to control for those factors ex post facto, the above analysis cannot disprove the hypothesis, but it does call it into question.
V. SYSTEMATIZED REVIEW OF POST‐MICHENER STUDIES
Here we turn to studies published since Michener's analysis, plus some earlier work he did not include. Our primary aim in this section is to summarize the available data sets relating colony size to ergonomic efficiency that control for the biasing factors reviewed above, and to gather data sets for a formal meta‐analysis (Section VI). As Michener convincingly argued, if biasing variables such as season and stage of colony development are held constant, the values of PCP measured can reveal the effects of colony size on efficiency within the sample.
Our second purpose is to draw attention to the fact that the proxies used for input and output in these studies do matter. As we reasoned in Section II, proxies often incompletely and/or inaccurately sample input and/or output, and therefore cannot provide reliable measures of ergonomic efficiency. Some proxies for input and output can be valid metrics for assessing the effect of colony size on ergonomic efficiency, but they must be interpreted carefully. We illustrate this point by including in the tables below some studies that measure productivity using two or more proxies. Multiple metrics from the same study often show contradictory effects of colony size on per‐capita output. Examples include Rangel & Seeley (2012) on Apis mellifera, and Tschinkel (1999) and Kaspari & Byrne (1995) on ants. These reinforce the assertion made above that, even if biasing factors are controlled for, the choice of proxies used for input and output must be made and interpreted with caution. These cases also help to make our point that if all forms of input and output could be captured in a single, all‐inclusive metric, the contradictory effects of different proxies for output would disappear.
(1). Methods
(a). Review of the literature
We conducted a systematized review (Grant & Booth, 2009; Oliveira et al., 2021), using several approaches to locate studies that include data on colony productivity in a form that can be used to calculate ergonomic efficiency as a function of colony size.
We began by searching our personal digital reference libraries for relevant papers. Those in turn cited older studies. We supplemented those results with the following online searches. We used Scopus to find papers that cite Michener (1964). This search, completed on 15 April 2021, turned up 177 references. The same search conducted in Google Scholar, completed on 10 July 2021, found 277 references. Eighteen Scopus references were not duplicated in the Google Scholar search results; thus, the two searches yielded 295 references. We also performed Web of Science searches via the University of Wisconsin Libraries and selecting All Databases from the UW's collection (Web of Science Core Collection, Biological Abstracts, BIOSIS Citation Index, CABI: CAB Abstracts, Current Contents Connect, Data Citation Index, Inspec, KCI‐Korean Journal Databases, MEDLINE, Russian Science Citation Index, SciELO Citation Index, Zoological Record). We used the search terms (bee OR ant OR wasp) AND social (entered in search box 1), AND “colony size*” OR “worker number*” (search box 2), AND (efficien* OR productiv*) OR per capita (search box 3). This was completed on 5 April, 2021 and returned 274 records, of which 46 were also included in the Google Scholar search results. Finally, Web of Science searches were performed for papers on selected major genera, using the search terms “(genus name) AND (productiv* OR efficien*).” These searches were completed May–July 2021.
The results of each online search were screened for data on per‐capita productivity in two steps: first, working with the search results online, we eliminated from further consideration those judged from the title and abstract not to contain data on colony productivity as a function of size. Second, we downloaded PDFs of the remaining papers and examined the full text, again excluding those lacking relevant data. Both of these screening steps were carried out by one person (either R.L.J. or K.J.L.). The full text of each of the remaining papers was carefully examined by both of us, with a decision reached jointly on whether it met our criteria for inclusion in our tables (see below). In a few cases, additional references were located by screening potential candidates cited by the papers located and screened from the online searches.
We applied the following criteria for inclusion in our tabulations of studies on colony efficiency.
Data sets must exclude failed colonies. As explained above (Section III.1), we are focused strictly on the intrinsic ergonomic efficiency of a colony's production of reproductive offspring (or some correlated proxy thereof), independent of its probability of surviving to produce them. If it was not clear that results of a study did not include failed colonies, we excluded it. We make the plausible assumption that ergonomic efficiency plays little or no role in a colony's probability of failure. For allodapine bees, numerous studies reported PCP statistics that included colonies containing zero brood. We interpreted broodless colonies as failed, as ant predation is frequent and likely a major cause of broodlessness (Schwarz et al., 1998; Zammit, Hogendoorn & Schwarz, 2008). We thus removed broodless colonies from data sets when possible and re‐calculated summary statistics (see Section VI), and omitted studies for which we could not do so. As single‐female colonies are much more likely to be broodless (Schwarz et al., 1998), omitting them differentially boosts PCP in these smallest colonies and thus, if anything, biases results in favour of the Michener pattern. In the meta‐analysis (see Section VI), we performed two versions, with and without broodless nests, to allow for the possibility that such nests are not purely the result of nest failure.
Data sets must control for the ontogenetic stage of colony development. In environments where colony initiations are limited to a few days at the beginning of the favourable season, we made this judgement based on the range of dates over which data were collected. If, in our judgement, the range of collection dates was too great, we excluded the data set. For studies of species in aseasonal environments, we judged whether adequate steps were taken to control for variation in stage of colony development. This meant, for example, that all relevant studies of stenogastrine wasps were excluded, as the observed colonies were likely in various stages of development (Field et al., 2000; Shreeves & Field, 2002). Also, we restricted our analysis to studies that compared colonies that varied in size, rather than comparing between life stages of individual colonies that were monitored through time (e.g. Thomas, 2003; Clark & Fewell, 2014; Kramer et al., 2015).
We excluded ant studies based on mound size, unless these measures were shown to be highly correlated with worker population (e.g. Cole & Wiernasz, 2000).
Sample size must be sufficient to enable statistical tests of the effect of colony size on output (minimum N = 7). While this cut‐off is arbitrary, the vast majority of data sets had sample sizes greater than 10, and thus we view the choice of threshold as unlikely to affect our results. We included studies in which the authors either reported statistical tests on the effect of colony size on output or provided raw data enabling us to do so. We also included a few cases where the authors did not conduct statistical tests of the effect, but in which the sample size was adequate. We indicate these cases with a question mark in the Effect column in Tables 2, 3, 4, 5, 6, 7, 8.
We excluded studies involving experimental manipulations or laboratory settings that we deemed too invasive or unnatural to describe productivity effectively. We note that methods varied widely among the cited studies. In some cases, proxies for productivity were marginally valid. We took a somewhat liberal view, and included any study that, in our opinion, represented a reasonable representation of colony efficiency.
Table 2.
Effect of colony size on per‐capita productivity in Apoidea: Colletidae and Halictidae (sweat bees)
| Genus species | N | Output | Input | Effect of input on output | Location | Sampling type | Notes | Reference |
|---|---|---|---|---|---|---|---|---|
| A. Colletidae | ||||||||
| Amphylaeus morosus (Smith) | 17 | No. brood cells | No. females | No effect | Victoria, Australia | DS | Reused nests. 1 vs. 2 mated females per nest. Nov. 6, 1992 sampling. | Spessa et al. (2000) |
| A. morosus | 11 | No. brood cells | No. females | No effect | Victoria, Australia | DS | Reused nests. 1 vs. 2 mated females per nest. Nov. 25, 1992 sampling. | Spessa et al. (2000) |
| A. morosus | 11 | No. brood cells | No. females | No effect | Victoria, Australia | DS | Reused nests. 1 vs. 2 mated females per nest. Dec 20, 1992 sampling. | Spessa et al. (2000) |
| A. morosus | 12 | No. brood cells | No. females | No effect | Victoria, Australia | DS | Reused nests. 1 vs. 2 mated females per nest. Jan 8, 1992 sampling. | Spessa et al. (2000) |
| A. morosus | 39 | No. brood cells | No. females | No effect | Victoria, Australia | DS | Reused nests. 1 vs. 2 mated females per nest. Nov 20, 1993 sampling. | Spessa et al. (2000) |
| A. morosus | 134 | No. brood cells | No. females | No effect | Victoria, Australia | DS | Reused nests. 1 vs. 2 mated females per nest. End of brood production (Series 3). | Spessa et al. (2000) |
| A. morosus | 134 | No. surviving brood | No. females | No effect | Victoria, Australia | DS | Reused nests. 1 vs. 2 mated females per nest. End of brood production (Series 3). | Spessa et al. (2000) |
| B. Halictidae | ||||||||
| Halictus ligatus Say | 20 (1974) | No. offspring of all stages | No. founding females | Negative? | New York, USA | DS | Spring nests. 1–3 foundresses. No statistics performed. | Litte (1977a) |
| H. ligatus | 11 (1975) | No. offspring of all stages | No. founding females | Negative? | New York, USA | DS | Spring nests. 1–3 foundresses. No statistics performed. | Litte (1977a) |
| H. ligatus | 20 (1974) | No. cells | No. founding females | Negative? | New York, USA | DS | Spring nests. 1–3 foundresses. No statistics performed. | Litte (1977a) |
| H. ligatus | 11 (1975) | No. cells | No. founding females | Negativee? | New York, USA | DS | Spring nests. 1–3 foundresses. No statistics performed. | Litte (1977a) |
| H. ligatus | 25 (1973) | No. offspring of all stages | No. females | Positive? | New York, USA | DS | Summer nests. 1–10 females per nest. No statistics performed. | Litte (1977a) |
| H. ligatus | 28 (1974) | No. offspring of all stages | No. females | Negative? | New York, USA | DS | Summer nests. 1–10 females per nest. No statistics performed. | Litte (1977a) |
| H. ligatus | 25 (1973) | No. cells | No. females | No effect? | New York, USA | DS | Summer nests. 1–10 females per nest. No statistics performed. | Litte (1977a) |
| H. ligatus | 28 (1974) | No. cells | No. females | Negative? | New York, USA | DS | Summer nests. 1–10 females per nest. No statistics performed. | Litte (1977a) |
| H. ligatus | 27 | No. first brood offspring | No. founding females | No effect | Ontario, Canada | DS | Spring nests. 1–4 foundresses. | Packer (1986) |
| H. scabiosae (Rossi) | 101 | No. gynes + males produced | No. ‘helpers’ in B1 generation | No effect for 1–3 helpers, negative for >3 | Switzerland | TPLS | Removal experiment estimated no. additional reproductives produced in generation B2 by each additional helper in generation B1. | Brand & Chapuisat (2014) |
| Lasioglossum aeneiventre (Friese) | 99 | No. brood cells | No. females | Positive | Costa Rica | DS | 1–14 females per nest. | Wcislo et al. (1993) |
| L. baleicum (Cockerell) | 33 | No. brood cells | No. females | No effect | Japan | TPLS | 1–4 females per nest. Mean cells/female peaks at 2 females. | Yagi & Hasegawa (2012) |
| L. comagenense (Knerer & Atwood) | 26 | No. brood cells | No. founding females | No effect | Nova Scotia, Canada | DS | 1–4 females per nest. | Packer et al. (1989; Packer (1993) |
| L. figueresi Wcislo | 30 | No. brood cells | No. females | No effect | Costa Rica | DS | 1–3 foundresses. | Wcislo et al. (1993) |
| L. hemichalceum (Cockerell) | 25 | No. immatures | No. females | No effect | Victoria, Australia | DS | 1–18 females per nest. | Kukuk & Sage (1994) |
| L. imitatum (Smith) | 28 | No. brood cells | No. founding females | No effect* | Kansas, USA | DS | 1–6 females per nest. | Michener & Wille (1961); Packer (1993) |
| L. laevissimum (Smith) | 56 | No. brood cells | No. founding females | Positive | Calgary, Alberta, Canada | DS | 1–5 females per nest. | Packer (1993) |
| L. lineare (Schenck) | 23 | Final no. brood cells | No. founding females | No effect | Paris, France | DS | Spring nests. 1–6 females per nest. | Knerer (1983); Packer (1993) |
| L. lineare | 24 | Final no. brood cells | No. founding females | Negative | Dordogne, France | DS | Spring nests. 1–2 females per nest. | Knerer (1983); Packer (1993) |
| L. malachurum (Kirby) | 40 | Wet mass of sexuals produced by first‐generation workers (WB1) | No. WB1 workers | Negative | Germany | FCLS | Mean no. WB1 workers = 4.25 ± 2.3. | Strohm & Bordon‐Hauser (2003) |
| L. malachurum | 15 | Wet mass of sexuals produced by second‐generation workers (WB2) | No. WB2 workers | No effect | Germany | FCLS | Mean no. WB2 workers = 7.5 ± 8.3. | Strohm & Bordon‐Hauser (2003) |
| L. zephyrum (Smith) | 78 | Brood cells completed | No. founding females | Negative | Kansas, USA | DS | Laboratory‐reared colonies. | Michener et al. (1971) |
| Megalopta genalis Meade–Waldo | 23 | No. new cells provisioned during 5 weeks | Mean no. females | No effect | Panama | Female no. censused daily in observation nests; cell no. determined by DS | Natural observation nests in field; post‐emergence colonies. | Smith et al. (2007) |
| M. genalis | 8 | No. new brood cells per week | Mean no. females | No effect | Panama | Female no. censused daily in observation nests; cell no. determined by DS | Glass‐topped observation nests in field; post‐emergence nests. | Smith et al. (2007) |
| M. genalis | 53 | No. provisioned brood cells | No. females | Negative | Panama, 2003 | DS | 1–4 females per nest. | Smith et al. (2007) |
| M. genalis | 25 | No. provisioned brood cells | No. females | Negative | Panama, 2004 | DS | 1–4 females per nest. | Smith et al. (2007) |
| M. genalis | 49 | No. provisioned brood cells | No. females | Positive | Costa Rica, 2003 | DS | 1–4 females per nest. | Smith et al. (2007) |
| M. genalis | 218 | No. brood cells | No. females | Negative* | Jan 2007–2009 | DS | Compared solitary vs. social. Broodless nests removed. | Smith et al. (2019) |
| M. genalis | 156 | No. brood cells | No. females | Negative* | Feb 2007–2009 | DS | Compared solitary vs. social. Broodless nests removed. | Smith et al. (2019) |
| M. genalis | 207 | No. brood cells | No. females | Negative* | Mar 2007–2009 | DS | Compared solitary vs. social. Broodless nests removed. | Smith et al. (2019) |
| M. genalis | 119 | No. brood cells | No. females | No effect* | Apr 2007–2009 | DS | Compared solitary vs. social. Broodless nests removed. | Smith et al. (2019)) |
| M. genalis | 62 | No. brood cells | No. females | Negative* | May 2007–2009 | DS | Compared solitary vs. social. Broodless nests removed. | Smith et al. (2019)) |
| M. genalis | 29 | No. brood cells | No. females | Negative* | July 2007–2009 | DS | Compared solitary vs. social. Broodless nests removed. | Smith et al. (2019) |
| Totals | Genera = 4; species = 14 | Negative = 16; No effect = 20; Positive = 4 | Data sets = 40 | |||||
Note: for ease of reading, each of multiple data sets within a study is entered in its own row. N = sample size (number of colonies). Output = measure of colony output. Input = measure of colony input. Effect of input on output = slope of regression of output/input versus colony size. Location = where study was done. Sampling type: DS = destructive sampling; NDS = non‐destructive sampling; FCLS = full‐cycle longitudinal sampling; TPLS = two‐point longitudinal sampling. Notes = relevant additional information. References = published source of data. An asterisk (*) indicates that we performed the statistical tests (see Section VI). A question mark (?) indicates a data set without a statistical basis for the effect; instead we used our best judgement in assessing the relationship based on the available data.
Table 3.
Effect of colony size on per‐capita productivity in Apidae: Xylocopinae
| Genus species | N | Output | Input | Effect of input on output | Location | Sampling type | Notes | Reference |
|---|---|---|---|---|---|---|---|---|
| A. Ceratinini | ||||||||
| Ceratina australensis (Perkins) | 307 | No. brood cells | No. females | Negative | Queensland, Australia | DS | 1–2 females per nest. | Rehan et al. (2014) |
| B. Allodapini | ||||||||
| Allodapula dichroa Strand | 85 | No. immatures | No. females | No effect | Western Cape Province, South Africa | DS | 1–2 females per nest. | Tierney & Schwarz (2009) |
| Braunsapis protuberans Reyes | ? | No. immatures | No. females | No effect | Queensland, Australia | DS | August 2000. | Joyce & Schwarz (2007) |
| B. protuberans | ? | No. immatures | No. females | No effect | Queensland, Australia | DS | October 2000. | Joyce & Schwarz (2007) |
| B. protuberans | ? | No. immatures | No. females | No effect | Queensland, Australia | DS | November 2000. | Joyce & Schwarz (2007) |
| B. protuberans | ? | No. immatures | No. females | No effect | Queensland, Australia | DS | January 2001. | Joyce & Schwarz (2007) |
| B. protuberans | ? | No. immatures | No. females | No effect | Queensland, Australia | DS | February 2001. | Joyce & Schwarz (2007) |
| B. puangensis (Cockerell) | 96 | No. immatures | No. females | No effect | Fiji | DS | 1–5 females per nest. May sampling. | Silva et al. (2016) |
| B. puangensis | 22 | No. immatures | No. females | No effect | Fiji | DS | 1–5 females per nest. July sampling. | Silva et al. (2016) |
| B. puangensis | 30 | No. immatures | No. females | No effect | Fiji | DS | 1–5 females per nest. Oct. sampling. | Silva et al. (2016) |
| Brevineura elongata (Rayment) | 13 | No. immatures | No. females | No effect* | Queensland, Australia | DS | 1–8 females. Broodless nests removed. Aug. sampling. | Joyce & Schwarz (2006) |
| B. elongata | 15 | No. immatures | No. females | No effect* | Queensland, Australia | DS | 1–8 females. Broodless nests removed. Oct. sampling. | Joyce & Schwarz (2006) |
| B. elongata | 14 | No. immatures | No. females | No effect* | Queensland, Australia | DS | 1–8 females. Broodless nests removed. Nov. sampling. | Joyce & Schwarz (2006) |
| B. elongata | 9 | No. immatures | No. females | No effect* | Queensland, Australia | DS | 1–8 females. Broodless nests removed. Feb. sampling. | Joyce & Schwarz (2006) |
| Exoneura angophorae (= E. richardsoni) Cockerell | 44 | No. immatures | No. females | Positive | Victoria, Australia | DS | Nests collected in Aug. 1–8 females per nest. Positive effect peaks at 3 females. | Schwarz et al. (1996) |
| E. angophorae | 80 | No. immatures | No. females | Positive | Victoria, Australia | DS | Nests collected in Dec. Positive effect peaks at 3 females. | Schwarz et al. (1996) |
| E. angophorae | 45 | No. immatures | No. females | No effect | Victoria, Australia | DS | Nests collected on 3 Jan. | Schwarz et al. (1996) |
| E. angophorae | 42 | No. immatures | No. females | No effect | Victoria, Australia | DS | Nests collected 16–22 Jan. | Schwarz et al. (1996) |
| E. angophorae | 68 | No. immatures | No. females | Positive* | New South Wales, Australia | DS | September nests. Broodless nests removed. | Bernauer et al. (2021) |
| E. angophorae | 73 | No. immatures | No. females | No effect* | New South Wales, Australia | DS | October nests. Broodless nests removed. | Bernauer et al. (2021) |
| E. angophorae | 46 | No. immatures | No. females | No effect* | New South Wales, Australia | DS | November nests. Broodless nests removed. | Bernauer et al. (2021) |
| E. nigrescens Friese | 119 | No. immatures | No. females | No effect | Victoria, Australia | DS | New nests with brood. 1–3 females per nest. | Schwarz (1994); Schwarz et al. (1998) |
| E. nigrescens | 151 | No. immatures | No. females | No effect | Victoria, Australia | DS | Reused nests with brood. 1–4 females per nest. | Schwarz (1994) |
| E. nigrescens | 163 | No. immatures | No. females | No effect | Victoria & South Australia, Australia | DS | Trap nests. 1–6 females. | Bull & Schwarz (1996) |
| E. nigrescens | 500 | No. immatures | No. females | Positive | Victoria, Australia | DS | Re‐used nests only. 1–7 females. Positive effect peaks at 4 females. | Bull & Schwarz (1996) |
| E. nigrescens | 89 | No. immatures | No. females | No effect | Victoria, Australia | TPLS | Positive effect peaks at 3 females then declines. | Hogendoorn & Zammit (2001) |
| E. nigrescens | 25 | No. immatures | No. females | Positive | Victoria, Australia | TPLS | Nests protected from ant predation. | Zammit et al. (2008) |
| E. nigrescens | 46 | No. immatures | No. females | Positive | Victoria, Australia | DS | Positive effect rises from 1‐ to 3‐female nests, then plateaus. | Silberbauer & Schwarz (1995) |
| E. nigrescens | 122 | No. immatures | No. females | Negative | Victoria, Australia | DS | Spring nests. | Stevens et al. (2007) |
| E. nigrescens | 86 | No. immatures | No. females | No effect | Victoria, Australia | DS | Summer nests. | Stevens et al. (2007) |
| E. nigrescens | 131 | Biomass of immatures | No. females | Negative* | Victoria, Australia | DS | Sept. sampling. | Stevens et al. (2007) |
| E. nigrescens | 158 | Biomass of immatures | No. females | Positive* | Victoria, Australia | DS | Nov. sampling. | Stevens et al. (2007) |
| E. nigrescens | 87 | Biomass of immatures | No. females | Positive* | Victoria, Australia | DS | Dec. sampling. | Stevens et al. (2007) |
| E. robusta Cockerell | 250 | No. immatures | No. females | No effect | Victoria, Australia | DS | New nests. 1–6 females per nest. | Schwarz (1994); Schwarz et al. (1998) |
| E. robusta | 121 | No. immatures | No. females | Positive | Victoria, Australia | DS | Reused nests. 1–8 females per nest. Positive effect peaks at 4 females. | Schwarz (1994); Schwarz et al. (1998) |
| Exoneurella eremophila | 27 | No. immatures | No. females | Negative* | Victoria, Australia | DS | Summer nests. 1–2 females. Broodless nests removed. | Dew et al. (2018a) |
| E. eremophila | 141 | No. immatures | No. females | Negative* | Victoria, Australia | DS | Autumn nests. 1–2 females. Broodless nests removed. | Dew et al. (2018a) |
| E. setosa | 35 | No. immatures | No. females | No effect* | Victoria, Australia | DS | Autumn nests. Broodless nests removed. | Dew et al. (2018b) |
| E. setosa | 50 | No. immatures | No. females | Negative* | Victoria, Australia | DS | Spring nests. Broodless nests removed. | Dew et al. (2018b) |
| E. setosa | 102 | No. immatures | No. females | Negative* | Victoria, Australia | DS | Summer nests. Broodless nests removed. | Dew et al. (2018b) |
| Hasinamelissa minuta (Brooks & Pauly) | 23 | No. brood | No. females | No effect | Madagascar | DS | 1–6 females. | Schwarz et al. (2005) |
| Macrogalea antanosy Brooks & Pauly | 17 | No. immatures | No. females | No effect | Madagascar | DS | 1–6 females. Unparasitized colonies only. | Smith & Schwarz (2006) |
| M. ellioti (Saussure) | 46 | No. immatures | No. females | No effect* | Madagascar | DS | 1–7 females. Broodless nests removed. | Smith et al. (2006) |
| M. Ramena sp. (undescribed species collected near Ramena, Madagascar) | 45 | No. immatures | No. females | No effect* | Madagascar | DS | 1–9 females. Positive effect peaks at 3 females. Broodless nests removed. | Smith et al. (2006) |
| M. zanzibarica Michener | 69 | No. immatures | No. females | Positive | Zanzibar Island, Tanzania | DS | 1–10 females. Positive effect peaks at 2 females. | Tierney et al. (2002) |
| M. sp. | 166 | No. immatures | No. females | Positive | Malawi | DS | 1–13 females. Positive effect increases to 5 females, then declines. | Thompson & Schwarz (2006) |
| Totals: | Genera = 8; species = 16 | Negative = 7; No effect = 28; Positive = 11 | Data sets = 46 | |||||
Note: see Table 2 for explanation of entries.
Table 4.
Effect of colony size on per‐capita productivity in Apidae: Apinae
| Genus species | N | Output | Input | Effect of input on output | Location | Sampling type | Notes | Reference |
|---|---|---|---|---|---|---|---|---|
| A. Bombus | ||||||||
| Bombus auricomus (Robertson) | 14 | No. sexuals produced | No. workers produced | No effect* | Nebraska, USA | FCLS | Colonies reared in observation boxes; allowed to free‐forage. | Webb (1961) Data from table 75 |
| B. griseocollis (De Geer) | 21 | No. sexuals produced | No. workers produced | Positive* | Nebraska, USA | FCLS | Most colonies reared in observation boxes; allowed to free‐forage. | Webb (1961) Data from table 49 |
| B. pensylvanicus (De Geer) | 20 | No. sexuals produced | No. workers produced | Positive* | Nebraska, USA | FCLS | Most colonies reared in observation boxes; allowed to free‐forage. | Webb (1961) Data from table 26 |
| B. lucorum (Linnaeus) | 20 | No. of sexuals produced | Maximum no. workers in colony | No effect* | Switzerland | FCLS | Colonies housed in concrete cylinders placed underground, censused every 2–3 days. Allowed to free‐forage. | Müller & Schmid‐Hempel (1992) |
| B. lucorum | 20 | Biomass of sexuals produced | Maximum no. workers in colony | No effect* | Switzerland | FCLS | Colonies housed in concrete cylinders placed underground, censused every 2–3 days. Allowed to free‐forage. | Müller & Schmid‐Hempel (1992) |
| B. terricola Kirby | 32 | No. of sexuals produced | Total no. workers | Negative* | New Brunswick, Canada | FCLS | Colonies started in laboratory from spring queens, then moved to field. New workers marked every other day | Owen et al. (1980) |
| B. terricola | 32 | Biomass of sexuals produced | Total no. workers | Negative* | New Brunswick, Canada | FCLS | Colonies started in laboratory from spring queens, then moved to field. New workers marked every other day. | Owen et al. (1980) |
| Totals: | Genera = 1; species = 5 | Negative = 2; No effect = 3; Positive = 2 | Data sets = 7 | |||||
| B. Apis mellifera | ||||||||
| Apis mellifera Linnaeus | 25 | Sealed brood area | No. workers | No effect* | British Columbia, Canada | TPLS | Founding swarms. | Lee & Winston (1985) |
| A. mellifera | 15 | Biomass of sealed brood | No. workers | No effect* | British Columbia, Canada | TPLS | Founding swarms. | Lee & Winston (1985) |
| A. mellifera | 50 | No. brood cells per day | No. workers | Negative | Louisiana, USA | TPLS | Experimentally constituted founding swarms of 2,300, 4,500, 9,000, 17,000 and 35,000 bees. Colonies of 4500 workers produced most brood cells/worker. | Harbo (1986) |
| A. mellifera | 50 | Mass of brood + honey per day | No. workers | Positive | Louisiana, USA | TPLS | Founding swarms. Colonies of 17,000 and 35,000 produced the most honey/worker. | Harbo (1986) |
| A. mellifera | 12 | Worker comb built (cm2) | No. workers | Negative* | New York, USA | TPLS | Artificially sized founding swarms. | Rangel & Seeley (2012) |
| A. mellifera | 12 | Drone comb built (cm2) | No. workers | Positive* | New York, USA | TPLS | Artificially sized founding swarms. | Rangel & Seeley (2012) |
| A. mellifera | 12 | Sealed worker brood (cm2) | No. workers | No effect* | New York, USA | TPLS | Artificially sized founding swarms. | Rangel & Seeley (2012) |
| A. mellifera | 12 | Sealed drone brood (cm2) | No. workers | No effect* | New York, USA | TPLS | Artificially sized founding swarms. | Rangel & Seeley (2012) |
| A. mellifera | 12 | Honey stored | No. workers | No effect* | New York, USA | TPLS | Artificially sized founding swarms. | Rangel & Seeley (2012) |
| A. mellifera | 12 | No. workers lost | No. workers | No effect* | New York, USA | TPLS | Artificially sized founding swarms. | Rangel & Seeley (2012) |
| Totals: | Genera = 1; species = 1 | Negative = 2; No effect = 6; Positive = 2 | Data sets = 10 | |||||
Note: see Table 2 for explanation of entries.
Table 5.
Effect of colony size on per‐capita productivity in Vespidae: Vespinae (yellowjackets)
| Genus species | N | Output | Input | Effect of input on output | Location | Sampling type | Notes | Reference |
|---|---|---|---|---|---|---|---|---|
| Vespula germanica (Fabricius) | 14 | Dry mass of pupae | No. workers | No effect* | England | DS | Colonies sampled August 10–31, 1961. Masses estimated using data in Blackith (1958). | Spradbery (1971) Data from table 3 |
| V. vulgaris (Linnaeus) | 27 | Dry mass of pupae | No. workers | No effect* | England | DS | Colonies sampled August 11–31, 1961. Queen pupae appear in mid‐August. Masses estimated using data in Archer (2012, p. 140–141). | Spradbery (1971) Data from table 2 |
| Totals | Genera = 1; species = 2 | Negative = 0; No effect = 2; Positive = 0 | Data sets = 2 | |||||
Note: see Table 2 for explanation of entries.
Table 6.
Effect of colony size on per‐capita productivity in Vespidae: Polistinae (independent‐founding polistine wasps)
| Genus species | N | Output | Input | Effect of input on output | Location | Sampling type | Notes | Reference |
|---|---|---|---|---|---|---|---|---|
| A. Polistes | ||||||||
| Polistes annularis (Linnaeus) | 40 | No. cells | No. founding females | Negative* | Georgia, USA | TPLS | Nests collected at end of pre‐emergence stage. | Krispyn (1979) Data from tables 8–10 |
| P. annularis | 40 | No. cells at autumn census (end of season) | No. founding females at spring census | No effect* | Georgia, USA | TPLS | End of season census. | Krispyn (1979) Data from tables 8–10 |
| P. annularis | 40 | No. cells | No. founding females | Negative* | Georgia, USA | DS | Nests collected at first cell capping. | Chao (1984) Data from tables 1 & 2 |
| P. aurifer de Saussure | 14 | No. offspring produced | No. founding females | Negative | California, USA | FCLS | Total offspring produced at end of season. | Liebert et al. (2005) |
| P. carolina (Linnaeus) | 17 | No. cells | No. founding females | Negative* | Texas, USA | DS | All nests collected 26 April, close to end of larval phase of pre‐emergence stage. | Seppa et al. (2002) |
| P. chinensis Pérez | 12 | Dry mass of reproductives produced | No. workers produced | Negative* | Japan | DS | Colonies collected at end of season, 1–5 September 1976. | Suzuki (1981) |
| P. dominula | 29 | No. cells | No. founding females | Negative* | Italy | TPLS | Nests censused one week after foundation. | Turillazzi et al. (1982) |
| P. dominula | 29 | Mass of nest + brood | No. founding females | Negative* | Italy | TPLS | Nests censused one week after foundation. | Turillazzi et al. (1982) |
| P. dominula | 21 | No. cells | No. founding females | Negative* | Italy | TPLS | Nests censused one month after foundation. | Turillazzi et al. (1982) |
| P. dominula | 21 | Mass of nest + brood | No. founding females | No effect* | Italy | TPLS | Nests censused one month after foundation. | Turillazzi et al. (1982) |
| P. dominula | 65 | No. cells added per day | No. founding females | Negative | Spain | FCLS | Nests censused every 2–4 days. | Grinsted & Field (2018) |
| P. dominula | 41 | No. cells | No. founding females | Negative | Germany | TPLS | Nests censused at end of pre‐emergence stage. | Hocherl & Tautz (2015) |
| P. dominula | 41 | No. pupae | No. founding females | Negative | Germany | TPLS | Nests censused at end of pre‐emergence stage. | Hocherl & Tautz (2015) |
| P. dominula | 41 | No. cells | No. founding females | Negative | Germany | TPLS | Nests censused at end of season. | Hocherl & Tautz (2015) |
| P. dominula | 30 | No. cells | No. founding females | Negative | Massachusetts, USA | DS | Nests censused at end of pre‐emergence stage. | Liebert & Starks (2006) |
| P. dominula | 66 | No. brood | No. founding females | Negative* | Spain | NDS | Pre‐experimental census April 1. Each time point contains different colonies. | Shreeves et al. (2003) |
| P. dominula | 53 | No. brood | No. founding females | Negative* | Spain | NDS | Pre‐experimental census April 21. | Shreeves et al. (2003) |
| P. dominula | 26 | No. brood | No. founding females | No effect* | Spain | NDS | Pre‐experimental census April 28. | Shreeves et al. (2003) |
| P. fuscatus | 30 | No. cells | No. founding females | No effect for one‐ vs. two‐foundress colonies, then negative? | Michigan, USA | DS | Nests censused at end of pre‐emergence stage. No statistics performed. | West‐Eberhard (1969) Data from table 5 |
| P. fuscatus | 97 | No. pupae | No. founding females | No effect | Ontario, Canada | FCLS | Nests in protected and unprotected field shelters. Censused at end of pre‐emergence stage. | Gibo (1978) |
| P. fuscatus | 46 | No. reproductives | No. founding females | Negative | Ontario, Canada | FCLS | Protected sites. No. reproductives estimated from end‐of‐season counts of cells that produced adults. | Gibo (1978) |
| P. fuscatus | 14 | No. reproductives | No. founding females | Negative | Ontario, Canada | FCLS | Exposed sites. No. reproductives estimated from end‐of‐season counts of cells that produced adults. Includes colonies re‐established after predation. | Gibo (1978) |
| P. infuscatus | 34 | No. cells | No. founding females | Negative? | Colombia | DS | Nests censused at end of pre‐emergence stage. No statistics performed. | West‐Eberhard (1969) Data from table 12 |
| P. metricus Say | 49 | No. workers eclosing | No. founding females | No effect | Illinois, USA | DS | Output measured as no. females emerging during days 1–24 after collection. | Metcalf & Whitt (1977) |
| P. snelleni de Saussure | 31 | No. males produced | No. workers produced | Negative* | Hokkaido, Japan | DS | Nests collected end of season; sex and caste produced by each cell based on cell size. | Inagawa et al. (2001) |
| P. snelleni | 30 | No. gynes produced | No. workers produced | Negative* | Hokkaido, Japan | DS | As above. | Inagawa et al. (2001) |
| P. snelleni | 19 | No. males produced | No. workers produced | No effect* | Kanto, Japan | DS | As above. | Inagawa et al. (2001) |
| P. snelleni | 19 | No. gynes produced | No. workers produced | No effect* | Kanto, Japan | DS | As above. | Inagawa et al. (2001) |
| P. snelleni | 32 | No. males produced | No. workers produced | No effect* | Nagano, Japan | DS | As above. | Inagawa et al. (2001) |
| P. snelleni | 32 | No. gynes produced | No. workers produced | No effect* | Nagano, Japan | DS | As above. | Inagawa et al. (2001) |
| B. Mischocyttarus | ||||||||
| Mischocyttarus cassununga (von Ihering) | 51 | No. cells | No. founding females | Negative* | Minas Gerais, Brazil | FCLS | Censused at end of pre‐emergence stage. | Castro et al. (2014) |
| M. drewseni (de Saussure) | 14 | No. cells | No. founding females | Negative* | Pará, Brazil | FCLS | Censused at hatch of first larva. | Jeanne (1972) Data from table 19 |
| M. drewseni | 7 | No. cells | No. founding females | Negative* | Pará, Brazil | FCLS | Censused at eclosion of first worker. | Jeanne (1972) Data from table 19 |
| M. labiatus (Fabricius) | 25 | No. cells | No. founding females | Negative? | Colombia | FCLS | Censused at nest age 5 days. 1–5 founding females. No statistics performed. | Litte (1981) Data from table 2 |
| M. labiatus | 25 | No. cells | No. founding females | Negative? | Colombia | FCLS | Censused at first egg hatch. 1–9 founding females No statistics performed. | Litte (1981) Data from table 2 |
| M. labiatus | 17 | No. cells | No. founding females | Negative? | Colombia | FCLS | Censused at first pupation. 1–8 founding females No statistics performed. | Litte (1981) Data from table 2 |
| M. labiatus | 12 | No. cells | No. founding females | Negative? | Colombia | FCLS | Censused at end of pre‐emergence stage. 1–5 founding females. No statistics performed. | Litte (1981) Data from table 2 |
| M. labiatus | 12 | No. pupae | No. founding females | No effect? | Colombia | FCLS | Censused at end of pre‐emergence stage. 1–5 founding females. No statistics performed. | Litte (1981) Data from table 2 |
| M. labiatus | 12 | New pupae/day | No. founding females | No effect? | Colombia | FCLS | Censused at end of pre‐emergence stage. 1–4 founding females No statistics performed. | Litte (1981) Data from table 2 |
| M. mexicanus (de Saussure) | 75 | Mean no. cells built during first 3 weeks | No. founding females | No effect? | Florida, USA | FCLS | 1 and 2 founding females only. No statistics performed. | Litte (1976) Data from table 11 |
| M. mexicanus | 88 | Mean no. cells built between first pupation and first adult emergence | No. founding females | No effect? | Florida, USA | FCLS | 1–6 founding females. No statistics performed. | Litte (1976) Data from table 11 |
| M. mexicanus | 88 | Mean no. cells built up to first adult emergence | No. founding females | Negative? | Florida, USA | FCLS | 1–6 founding females. No statistics performed. | Litte (1976) Data from table 11 |
| M. mexicanus | 88 | Mean no. pupae at first adult emergence | No. founding females | No effect? | Florida, USA | FCLS | 1–6 founding females. No statistics performed. | Litte (1976) Data from table 11 |
| M. mexicanus | 39 | Mean no. cells built during first 3 weeks after adult emergence | No. working adults | No effect? | Florida, USA | FCLS | Data in table 14 are based on no. working adults, including queen. No statistics performed. | Litte (1976) |
| M. mexicanus | 10 | No. cells added/female/day | Mean no. founding females | No effect | Florida, USA | FCLS | Manipulated founding‐group size; pleometrotic groups only. Censused on day of first cell capping. | Clouse (2001) |
| M. mexicanus | 10 | No. offspring added/female/day | Mean no. founding females | Positive | Florida, USA | FCLS | Manipulated founding‐group size; pleometrotic groups only. Censused on day of first cell capping. | Clouse (2001) |
| M. mexicanus | 11 | Mass of nest material added/female/day to day of first capped cell | Mean no. founding females | Negative | Florida, USA | FCLS | Manipulated founding‐group size; pleometrotic groups only. | Clouse (2001) |
| M. mexicanus | 11 | Mg. offspring added/female/day to day of first capped cell | Mean no. founding females | Negative | Florida, USA | FCLS | Manipulated founding‐group size; pleometrotic groups only. | Clouse (2001) |
| C. Ropalidia | ||||||||
| Ropalidia fasciata (F.) | 25 | No. cells on April 25–26, 1982 | No. founding females | No effect* | Okinawa, Japan | TPLS | Itô (1983) | |
| R. fasciata | 48 | No. cells on April 13–14, 1983 | No. founding females | Negative* | Okinawa, Japan | TPLS | Dominance interactions among cofoundresses are milder than among Polistes spp. | Ito (1985) |
| R. fasciata | 156 | No. potential foundresses produced | No. founding females | No effect | Okinawa, Japan | FCLS | Data from table 9 (excludes failed colonies). | Ito & Itioka (2008) |
| R. fasciata | 16 | No. cells/day/female to end of egg stage | No. founding females | No effect | Okinawa, Japan | FCLS | Kojima (1989) | |
| R. fasciata | 16 | No. cells/day/female to end of larval stage | No. foundresses | Positive | Okinawa, Japan | FCLS | Kojima (1989) | |
| R. fasciata | 12 | No. cells/day/female to end of pupal stage | No. founding females | No effect | Okinawa, Japan | FCLS | Kojima (1989) | |
| Ropalidia marginata (Lepeletier) | 48 | Weighted no. brood at eclosion of first worker | No. founding females | Negative | India | FCLS | Colonies reared in laboratory, but with access to outside. | Brahma et al. (2018) |
| D. Belonogaster | ||||||||
| Belonogaster petiolata (DeGeer) | 37 | No. cells in the nest at eclosion of first worker | No. founding females | No effect | South Africa | FCLS | 2–10 foundresses of surviving colonies. | Keeping (1989) |
| B. petiolata | 37 | No. eggs in the nest at eclosion of first worker | No. founding females | Negative | South Africa | FCLS | 2–10 foundresses of surviving colonies. | Keeping (1989) |
| B. petiolata | 37 | No. larvae in the nest at eclosion of first worker | No. founding females | No effect | South Africa | FCLS | 2–10 foundresses of surviving colonies. | Keeping (1989) |
| B. petiolata | 67 | No. pupae in the nest at eclosion of first worker | No. founding females | Positive | South Africa | FCLS | 2–10 foundresses of surviving colonies. | Keeping (1989) Data from fig. 9.6B |
| Totals: | Genera = 4; species = 16 | Negative = 33; No effect = 23; Positive = 3 | Data sets = 59 | |||||
Note: see Table 2 for explanation of entries.
Table 7.
Effect of colony size on per‐capita productivity in Vespidae: Polistinae: Epiponini (swarm‐founding wasps)
| Genus species | N | Output | Input | Effect of input on output | Location | Sampling type | Notes | Reference |
|---|---|---|---|---|---|---|---|---|
| Parachartergus fraternus (Gribodo) | 35 | No. cells in nest | No. founding females | No effect | Costa Rica | DS | Nests collected 25 days after founding. | Bouwma et al. (2006) |
| P. fraternus | 33 | Brood dry mass | No. founding females | No effect | Costa Rica | DS | Nests collected 25 days after founding. | Bouwma et al. (2006) |
| Polybia occidentalis (Olivier) | 19 | No. cells in nest | No. founding females | Positive | Costa Rica | DS | Nests collected 25 days after founding. | Jeanne & Nordheim (1996) |
| P. occidentalis | 19 | Brood dry mass | No. founding females | Positive | Costa Rica | DS | Nests collected 25 days after founding. | Jeanne & Nordheim (1996) |
| P. occidentalis | 66 | No. cells in nest | No. founding females | No effect | Costa Rica | DS | Nests collected 25 days after founding. | Bouwma et al. (2005) |
| P. occidentalis | 53 | Brood dry mass | No. founding females | No effect | Costa Rica | DS | Nests collected 25 days after founding. | Bouwma et al. (2005) |
| Totals: | Genera = 2; species = 2 | Negative = 0; No effect = 4; Positive = 2 | Data sets = 6 | |||||
Note: see Table 2 for explanation of entries.
Table 8.
Effect of colony size on per‐capita productivity in Formicidae (ants)
| Genus species | N | Output | Input | Effect of input on output | Location | Sampling type | Notes | Reference |
|---|---|---|---|---|---|---|---|---|
| Diacamma sp. | 11 | No. workers eclosing over 21 days centred on maximum no. eclosing | No. workers | No effect | Japan | FCLS | Nakata (2000) | |
| Leptothorax acervorum (Fabricius) | 246 | Dry biomass new workers + gynes + males produced | Original number of workers | No effect* | England | TPLS | Monogynous and polygynous colonies. | Chan & Bourke (1994); Chan et al. (1999) |
| L. acervorum | 162 | Dry mass workers + sexuals produced | No. workers | No effect* | Abensberg, Germany | DS | Queenless colonies removed. | Kramer et al. (2014) |
| L. muscorum | 151 | Dry mass workers + sexuals produced | No. workers | Negative* | Abensberg, Germany | DS | Queenless colonies removed. | Kramer et al. (2014) |
| Myrmica punctiventris | Dry mass workers + sexuals produced | No. workers | No effect* | New York, USA | DS | Queenless colonies removed. | Kramer et al. (2014) | |
| Pheidole multispina Wilson | 31 | No. pupae | No. adults | Negative* | Costa Rica | DS | Nests collected in Feb, Mar, May, Aug. | Kaspari & Byrne (1995) |
| P. multispina | 10 | Biomass of alates | No. adults | No effect* | Costa Rica | DS | Nests collected in Feb, Mar, May, Aug. | Kaspari & Byrne (1995) |
| P. nigricula Wilson | 121 | No. pupae | No. adults | No effect * | Costa Rica | DS | Nests collected in Feb, Mar, May, Aug. | Kaspari & Byrne (1995) |
| P. nigricula | 29 | Biomass of alates | No. adults | Negative* | Costa Rica | DS | Nests collected in Feb, Mar, May, Aug. | Kaspari & Byrne (1995) |
| P. rugiceps Wilson | 33 | No. pupae | No. adults | No effect* | Panama | DS | Nests collected Jun, Jul, Sep–Nov. | Kaspari & Byrne (1995) |
| P. rugiceps | 8 | Biomass of alates | No. adults | No effect* | Panama | DS | Nests collected Jun, Jul, Sep–Nov. | Kaspari & Byrne (1995) |
| P. rugiceps | 15 | No. pupae | No. adults | No effect* | Costa Rica | DS | Nests collected in Feb, Mar, May, Aug. | Kaspari & Byrne (1995) |
| P. rugiceps | 10 | Biomass of alates | No. adults | No effect* | Costa Rica | DS | Nests collected in Feb, Mar, May, Aug. | Kaspari & Byrne (1995) |
| P. specularis Wilson | 41 | No. pupae | No. adults | No effect* | Costa Rica | DS | Nests collected in Feb, Mar, May, Aug. | Kaspari & Byrne (1995) |
| P. specularis | 12 | Biomass of alates | No. adults | Negative* | Costa Rica | DS | Nests collected in Feb, Mar, May, Aug. | Kaspari & Byrne (1995) |
| Pogonomyrmex badius (Latreille) | 22 | Total no. brood | No. workers | Negative | Florida, USA | DS | Nests excavated May, Jul, Oct, Jan | Tschinkel (1999) |
| P. badius | 30 | Total mass seeds | Colony mass | No effect | Florida, USA | DS | Nests excavated May, Jul, Oct, Jan. | Tschinkel (1999) |
| P. badius | 30 | Total mass seeds | No. dark (older) workers | Positive | Florida, USA | DS | Nests excavated May, Jul, Oct, Jan. | Tschinkel (1999) |
| P. badius | 29 | Total mass fat | Colony mass | Positive | Florida, USA | DS | Nests excavated May, Jul, Oct, Jan. | Tschinkel (1999) |
| P. occidentalis (Cresson) | 31–60 | Dry mass of reproductives | Colony size (mound volume) | Negative | Colorado, USA | NDS | Field colonies sampled in each of 4 years. Alates captured after mating flights induced by watering. | Cole & Wiernasz (2000) |
| Solenopsis invicta Buren | 89 | Total energy content (J) per day | Colony size (total worker biomass) | No effect | Florida, USA | DS | Colonies excavated throughout one annual cycle. | Tschinkel (1993) |
| (Temnothorax albipennis | 116 | No. brood | No. adults | Negative | England | DS | Colonies collected on one day. If reproductive brood was present in some colonies, output could be underestimated. | Franks et al. (2006) |
| T. allardycei (Mann) | 28 | No. brood | No. workers | No effect | Florida, USA | DS | Field colonies brought to laboratory for censusing. | Cole (1984) |
| T. americanus | 31 | Dry mass workers + sexuals produced | No. workers + slaves | No effect | New York, USA | DS | Queenless colonies removed. | Kramer et al. (2014) |
| T. americanus | 18 | Dry mass workers + sexuals produced | No. workers + slaves | No effect* | West Virginia, USA | DS | Queenless colonies removed. | Kramer et al. (2014) |
| T. crassispinus | 45 | Dry mass workers + sexuals produced | No. workers | No effect* | Abensberg, Germany | DS | Queenless colonies removed. | Kramer et al. (2014) |
| T. crassispinus | 93 | Dry wt. workers + sexuals produced | No. workers | Positive* | Regensburg, Germany | DS | Queenless colonies removed. | Kramer et al. (2014) |
| T. longispinosus | 275 | Dry mass workers + sexuals produced | No. workers | Negative* | New York, USA | DS | Queenless colonies removed. | Kramer et al. (2014) |
| T. longispinosus | 182 | Dry mass workers + sexuals produced | No. workers | Negative* | West Virginia, USA | DS | Queenless colonies removed. | Kramer et al. (2014) |
| T. nylanderi | 453 | Dry mass workers + sexuals produced | No. workers | No effect* | Sommerhausen (South), Germany | DS | Queenless colonies removed. | Kramer et al. (2014) |
| T. nylanderi | 187 | Dry mass workers + sexuals produced | No. workers | No effect* | Sommerhausen (North), Germany | DS | Queenless colonies removed. | Kramer et al. (2014) |
| T. nylanderi (Foerster) | 40 | No. brood | No. workers | No effect* | Germany | DS | Colonies reared in laboratory. Queenless colonies removed. | Scharf et al. (2012b) |
| T. nylanderi | 60 | Biomass of pupae | No. workers | Negative* | Germany | DS | Colonies collected in July–Aug. Queenless colonies removed. | Scharf et al. (2012b) |
| Tetramorium. caespitum (Linnaeus) | 27 | Live mass of sexuals | Live mass of workers | Positive* | England | NDS | Analysis based on mean data for 27 colonies each sampled over 3–6 years. Worker numbers estimated by mark and recapture; total sexual production estimated by repeated collection. | Brian & Elmes (1974) |
| Trachymyrmex septentrionalis (McCook) | 28 | Biomass (wet) of reproductives | No. workers | No effect* | Florida, USA | DS | Colonies collected 1–3 weeks prior to the mating flight. | Beshers & Traniello (1994) |
| T. septentrionalis | 27 | Biomass (wet) of reproductives | No. workers | Negative* | New York, USA | DS | Colonies collected 1–3 weeks prior to the mating flight. | Beshers & Traniello (1994) |
| Linepithema. humile (Mayr) | 24 | No. brood produced after 25 days | 1 queen with 10, 30, and 300 workers |
No effect |
Spain (colonies moved to laboratory) | TPLS | Experimentally constituted, laboratory‐reared colonies of 10, 30, or 300 workers with 1, 3, and 6 queens and no brood. | Luque et al. (2013) |
| L. humile | 48 | No. brood produced after 25 days | 3 and 6 queens with 10, 30, and 300 workers | Negative | Spain (colonies moved to laboratory | TPLS | Experimentally constituted, laboratory‐reared colonies of 10, 30, or 300 workers with 1, 3, and 6 queens and no brood. | Luque et al. (2013) |
| L. humile | 12 | No. brood produced after 2 months | Final no. workers | No effect | California, USA | TPLS | Experimentally constituted laboratory‐reared colonies of 1,000–10,000 workers with 1 queen/1,000 workers. | Hee et al. (2000) |
| Formica neorufibarbis Emery | 211 | No. cocoons | No. workers | No effect | Colorado, USA | NDS | Non‐reproductive‐stage field colonies. Worker numbers and cocoon production estimated by mark and recapture. 6 years of data. | Billick (2001) |
| Lasius flavus (Fabricius) | 8 | Alate queens | No. workers | Positive* | England | NDS | Field colonies. Worker number estimated by mark (P32) and recapture. | Odum & Pontin (1961) |
| L. niger (Linnaeus) | 8 | Dry mass of reproductives | No. workers | No effect* | The Netherlands | NDS | Strandvlakte habitat (early‐stage succession of primary coastal dune valleys). Worker numbers estimated by mark and recapture; all reproductives were aspirated from mound. | Boomsma et al. (1982) |
| L. niger | 9 | Dry mass of reproductives | No. workers | No effect* | The Netherlands | NDS | Kobbeduinen habitat (sheltered coastal dune valley). Worker numbers estimated by mark and recapture; all reproductives were aspirated from mound. | Boomsma et al. (1982) |
| L. sakagamii (Yamauchi and Hayashida) | 11 | No. larvae | No. workers | Positive* | Japan | DS | Summer sampling. | Yamauchi et al. (1982) |
| L. sakagamii | 20 | Biomass of larvae | No. workers | No effect* | Japan | DS | Winter 1977 sampling. | Yamauchi et al. (1982) |
| Totals: | Genera = 12; species = 24 | Negative = 12; No effect = 27; Positive = 6 | Data sets = 45 | |||||
Note: see Table 2 for explanation of entries.
We retained 90 studies with a total of 215 data sets that met the above criteria (Tables 2, 3, 4, 5, 6, 7, 8).
Some studies report multiple output metrics for a given species. For example, multiple data sets may represent data for different years [e.g. Halictus ligatus Say (Litte, 1977a)], locations [e.g. Lasioglossum lineare (Schenck) (Knerer, 1983)], seasons [e.g. Exoneura nigrescens Friese (Stevens, Hogendoorn & Schwarz, 2007)], or stages of colony development [e.g. Polistes dominula (Christ) (Turillazzi et al., 1982)]. We analysed these separately whenever possible, so colonies are compared to other colonies in the same location, season, and stage as far as possible. Other studies used two or more proxies for output for the same colonies. For such studies, we include results for two or more proxies to illustrate our point that some metrics are better proxies for colony efficiency than others. [e.g. Apis mellifera (Rangel & Seeley, 2012), Pogonomyrmex badius (Latreille) (Tschinkel, 1999)].
(b). Statistical analysis
The studies cited in this section use several methods of statistical analysis to assess the effect of colony size, S, on total colony productivity, P. The most common is to calculate productivity per‐capita, P/S, and regress it on colony size, S, the independent variable. In the resulting regression equation (P/S = mS + b) if the slope, m, is not significantly different from 0, we conclude that colony size has no effect on per‐capita productivity. If the slope is negative or positive and significantly different from 0, the effect of S is negative or positive, respectively.
A second method is directly to fit a regression of P on S. This approach can have the benefit of reducing non‐homogeneity of variance that can occur in per‐capita data. The shape of the curve, whether linear or curved, reflects the effect of colony size on productivity. One approach is to fit a model such as P = b + m 1 S + m 2 S 2 (e.g. see Kaspari & Byrne, 1995; Jeanne & Nordheim, 1996). If m 2 is not significantly different from 0, the last (non‐linear) term drops out, leaving a linear relationship; i.e. colony size has no effect on per‐capita productivity. If the non‐linear coefficient m 2 is negative or positive and differs significantly from 0, we conclude that ergonomic efficiency decreases or increases (respectively) with increasing colony size.
A third approach is to fit a power model written as P = aS c . The exponent, c, determines the concavity of the resulting curve. Taking logarithmic transformations of both sides of the equation has the benefit of straightening curvilinear data, allowing the application of linear regression (e.g. see Tschinkel, 1999). The equation becomes log P = loga + clogS. A value of the slope c = 1 indicates a linear relationship between colony size and productivity, i.e. no effect of colony size on efficiency. If the slope is significantly less than or greater than 1, we conclude that efficiency decreases or increases, respectively, with increasing colony size (Tschinkel, 1999).
Since all three methods rely on regression analysis, it is necessary that the assumptions underlying the regression are met, or the tests for significance may not be reliable. For example, there can be problems with non‐homogeneity of variance (heteroscedasticity) when using per‐capita productivity as the response variable [e.g. see Karsai & Wenzel (1998) and Jeanne & Nordheim (1996)]. In such cases, the second or third methods described above are preferable and avoid this issue. A second issue raised by Michener (1964) that has received some discussion (Cole, 1984) revolves around the y‐intercept when total colony productivity is plotted against colony size. If the estimated y‐intercept is different from 0 (even if not significantly so) this will have an impact on the plot of the per‐capita values that are calculated from this model and regressed on colony size. Since in most studies where the y‐intercept is reported it is positive, this alone will tend to make the slope in regressions using per‐capita productivity, m, more negative (often only very slightly so) than perhaps it should be. The second method avoids this issue, although there is an analogous effect when analysing data using the log‐transformed regression approach described above. Despite this, we interpret studies using all three analysis approaches.
In Tables 2, 3, 4, 5, 6, 7, 8 the effect of colony size on ergonomic efficiency is scored as ‘negative,’ ‘positive,’ or ‘no effect,’ based on statistical analyses reported in the cited references. Although most of the papers we cite reported per‐capita productivity, a handful provided results in the form of total productivity as a function of colony size. For most studies, we use the statistical results and interpretations of the authors. However, in some studies, we performed statistical comparisons ourselves, either because the authors did not perform an analysis of colony size and ergonomic efficiency, or because we took issue with their methodology. In the latter event we either removed colonies that we thought should not be included [e.g. queenless colonies (Scharf et al., 2012a; Kramer et al., 2014); broodless colonies (e.g. Tierney et al., 2002); see Section VI below], or used a re‐calculated superior output metric [pupal biomass rather than brood count (Spradbery, 1971; Lee & Winston, 1985); for details, see Table S1]. For our statistical analyses, we used the two approaches described below in the meta‐analyses (Section VI), using 95% confidence intervals to determine if the predicted effect overlapped with the expected value for no effect. If the effect reported in a table comes from our own statistical analyses, we indicate this with an asterisk in Tables 2, 3, 4, 5, 6, 7, 8 summarizing our findings. Statistical analyses were performed in R version 4.0.2 (R Core Team 2020).
For all methods it is important to take sample size into account. A non‐significant test outcome (positive or negative) may simply reflect that the sample size was too small to find significance. Thus, the numbers of non‐significant test outcomes are not necessarily evidence against the Michener pattern, and a comparison of the numbers of significant positives and significant negatives is more useful. These issues are dealt with more rigorously by the formal meta‐analyses in Section VI.
In the sections below, we address the results of our review by taxonomic group.
(2). Bees
(a). Colletid and halictid bees
A number of studies of eusocial bees in the socially diverse family Halictidae have measured per‐capita productivity while controlling for seasonal and ontogenetic effects (Table 2). Most of the studies are based on DS or TPLS, and in most cases the proxy for productivity is the number of provisioned brood cells. Because in a number of species of these bees the first females to emerge are smaller than later‐emerging individuals (Chole, Woodard & Bloch, 2019), simple counts of provisioned cells may underestimate productivity. Brand & Chapuisat (2014) used an experimental approach to estimate the effect of helpers on per‐capita productivity in colonies of Halictus scabiosae (Rossi). They removed single individuals from the B1 (helper) generation and measured the impact on the numbers of B2 (reproductive) offspring produced. Over colonies of all sizes (1–11 B1 helpers), the effect of adding one helper had a negative effect; for colonies with 1–3 helpers, each additional helper produced on average 0.72 additional B2 offspring. However, when the greater biomass of gynes and males over helpers was factored into the analysis, the average per‐capita productivity of a helper in small colonies approached 1. That is, by this more realistic metric, colony size appeared to have no effect on per‐capita output.
Of the 40 data sets reported in Table 2 (14 species in four genera), group size had a positive effect on per‐capita output in four, a neutral effect in 20 and a negative effect in 16. The excessive number of negative effects, compared to positive, suggests a possible Michener effect in this group.
(b). Ceratinine and allodapine bees
Xylocopine bees in these two tribes nest in hollow twigs and stems (Michener, 2000). Ceratina australensis (Perkins), a mass‐provisioner, is facultatively social, with some nests containing two females (Rehan et al., 2014). The allodapines progressively feed their larvae, and most species show some degree of subsociality or simple eusociality (Schwarz et al., 1998). Most of the data reported in Table 3 are based on DS of colonies in the founding stage. In some of the studies a few nests contained no brood but still contained one or more females. Because it is likely that these cases are the result of predation by ants (Zammit et al., 2008), we considered these as failed colonies and excluded them from our survey. We also excluded studies that did not make it clear if broodless nests were excluded from their analyses of per‐capita productivity.
Numerous studies on these bees show that rates of broodlessness are higher among single‐female nests than among multi‐female nests, suggesting that brood defence is an important benefit of cooperative nesting (reviewed in Schwarz et al., 1998). However, even when broodless nests were excluded, some species had higher per‐capita productivity in two‐female nests than in single‐female nests, indicating that reduction of the risk of brood loss is not the only benefit of cooperation (Tierney et al., 2002).
Of the 46 data sets in Table 3 (16 species in 8 genera), 11 show a positive effect of group size, 28 showed no effect, and seven reported the negative Michener pattern.
(c). Bombus
In addition to Webb's dissertation on several bumble bee species (Webb, 1961) (Fig. 4), Owen, Rodd & Plowright (1980) and Müller & Schmid‐Hempel (1992) provided data on per‐capita productivity for one additional species each. Results among the three studies could not be more disparate (Table 4A). One possibility for the differences in the effect of worker number on per‐capita output of sexuals is that they represent actual species differences. However, the fact that all three of Webb's species showed the same positive effect of colony size on PCP suggests that this is not the case. An alternative possibility is that the species do not differ in this regard, and that the different outcomes reflect subtle procedural differences among the three studies. For example, while focusing on sex‐ratio differences between their study and Webb (1961), Owen et al. (1980) pointed out that Webb may have missed finding smaller colonies in the field, thereby skewing his samples towards larger colonies. However, it is unclear how such a bias could produce a positive effect of colony size on per‐capita biomass of sexuals produced. Another possibility also suggested by Owen et al. (1980) is that Webb may have undercounted males produced early in the season. If these early males are produced particularly heavily by small colonies, then this could underestimate the productivity of small colonies. Owen et al. (1980) also acknowledge that because their colonies were started in the laboratory and then allowed to free‐forage, queens that were too weak to have founded colonies in the wild may have been allowed to reproduce, possibly skewing the distribution of per‐capita productivity across colony size.
Müller & Schmid‐Hempel (1992) started colonies of B. lucorum in the laboratory from wild‐caught queens, then moved them to the field after a few workers had emerged. Colonies were censused every second or third night for number of workers and sexuals. Both biomass and number of sexuals produced suggested no effect of colony size on efficiency (Table 4A).
Taken together, the seven Bombus data sets in Table 4A show two positive, three neutral and two negative effects of group size on efficiency.
(d). Apis
While some studies of honey bees purport to support the hypothesis (Free & Racey, 1968; Accorti, Tarducci & Luti, 1991), they fail to meet our criteria because they do not take account of potential differences in amounts of stored food in the nest at the start of the season. The two studies we know of that avoid this problem started with founding swarms lacking comb or stored food (Table 4B). Lee & Winston (1985) measured the amount of sealed brood per worker at first worker emergence and found no support for the hypothesis. The amount of honey accumulated was not measured. The results of the other (Harbo, 1986) mirrored those of Farrar (1937), described above (Section IV.3); that is, brood reared per capita was higher in small colonies, while honey stored per capita was higher in large colonies. Harbo's measure of adjusted mass gain of the colony in mg/bee/day, an attempt to measure all output by including all honey and pollen used to rear brood, consumed by adults, and stored in the nest, showed a positive effect of colony size, increasing in colonies of 2300–9000 workers, then remaining constant up to sizes of 35,000 workers.
A more recent study directly measured all forms of worker output (Rangel & Seeley, 2012). The data again show how the chosen metric of output can lead to results that either support, refute, or are ambivalent towards the hypothesis. Rangel & Seeley (2012) set up colonies with founding swarms of three sizes: 5000, 10000, and 15000 workers (N = 4 of each size). They measured parameters of colony growth and development throughout the first year, but for our analysis, we selected each colony parameter after 18–20 days, before new workers eclosed, thereby accounting for the output of the workers present in the initially constituted founding swarms. The amount of worker comb built per worker was negatively correlated with colony size (Fig. 9A), in accordance with the hypothesis. Drone comb built, however, was positively correlated with colony size, against the hypothesis (Fig. 9B). None of the other colony parameters (sealed worker brood, sealed drone brood, honey stores amassed, workers lost) varied significantly with colony size (Fig. 9C–F), and so do not support the hypothesis.
Fig. 9.

Per‐capita output of Apis mellifera colonies. Data from Rangel & Seeley (2012) were analysed to show how the chosen form of worker output leads to results that either support, refute, or are neutral to Michener's pattern. Each colony parameter is measured in cm2 of comb area (A–E) or number of workers (F) and is plotted on a per‐capita basis (colony parameter/starting colony size). Starting colony size = number of workers in the swarm. Linear regression was used to determine how each colony parameter responded to colony size. Parameters were measured 18–20 days after the colonies were established, so that new workers had not yet eclosed. Black lines show statistically significant linear regressions (worker comb built: F 1,10 = 15.45, P < 0.005, r 2 = 0.57; drone comb built: F 1,10 = 13.80, P < 0.005, r 2 = 0.54; sealed worker brood: F 1,10 = 0.92, P > 0.05, NS, r 2 = −0.01; sealed drone brood: F 1,10 = 0.01, P > 0.05, NS, r 2 = −0.10; food stored: F 1,10 = 3.18, P > 0.05, NS, r 2 = 0.17; workers lost: F 1,10 = 0.22, P > 0.05, NS, r 2 = −0.08).
Of the 10 Apis data sets in Table 4B, two showed a positive effect of group size on output, while six were neutral and two negative. The single metric that most completely captured total output – mg of brood plus mg honey produced per day – showed a positive response to colony size (Harbo, 1986).
This analysis shows especially well how the form of worker output measured will influence the conclusion. Although one could try to convert the different parameters to a single metric of colony performance (e.g. it takes 6.25 kg of honey to produce 1 kg of beeswax; Weiss, 1965), those conversions would not account for associated costs, such as the time and energy a worker invests in wax secretion and comb building. Unfortunately, there is no easily applicable common currency for all forms of worker output for honey bees.
(3). Wasps
(a). Vespine wasps
Spradbery (1971) calculated per‐capita productivity of Vespula vulgaris (Linnaeus) based on data from destructively sampled colonies in England between 11 and 31 August 1961. Using the total numbers of eggs, larvae, and pupae in the nests as output and numbers of workers at collection as input, he concluded that per‐capita productivity was strongly negatively related to colony size (his fig. 10).
This method is flawed. It rests on at least one of two assumptions. The first is that each individual brood item – whether an egg, larva or pupa – represents the same investment (e.g. in biomass or energy) by the colony. This is clearly not true. The second is that these three stages of brood occur in the same relative proportions across colonies of all sizes. This is not supported by Spradbery's data. Colonies collected 11–31 August (his table 2) show a strong negative effect of colony size on the number of eggs in the nest per worker (eggs/worker = 0.7–0.000134*workers; N = 27; P < 0.001). By contrast, the number of pupae per worker shows no relation to colony size (pupae/worker = 1.249–0.000058*workers; N = 27; P = 0.394). That is, compared to smaller colonies, larger colonies have a higher ratio of pupae to eggs. Put another way, the mean biomass of individual brood is higher in larger colonies. This means that Spradbery's counts of brood underestimated the more relevant measure of productivity – brood biomass – of large colonies relative to small ones.
To improve on this analysis, we converted Spradbery's data on numbers of gyne, male, and worker pupae to total biomass of pupae [we used Archer's (2012) data on dry mass of V. vulgaris adult queens, males, and workers] to estimate colony productivity in terms of pupal biomass. The regression slope of log‐transformed total pupal biomass on log‐transformed worker number is slightly, but non‐significantly, greater than 1, consistent with no effect of worker number on efficiency (Fig. 5A; Table 5).
Although a complete accounting of brood productivity should include the biomass of larvae as well as pupae, this was not possible in this case because Spradbery did not break down the numbers of larvae in his nests by instar. However, a reasonable assumption is that the numbers of the largest (fourth and fifth instar) larvae per worker more closely reflect the relationship to colony size described above for pupae than for eggs, and therefore that pupal biomass is a more accurate proxy for total brood biomass than is the number of brood.
We performed the same analysis for V. germanica (Fabricius), using data from Spradbery (1971) and biomass data from Blackith (1958), and obtained a similar result (Table S1). Thus, we conclude that there is no effect of colony size on ergonomic efficiency for either species (Fig. S1; Table 5).
(b). Independent‐founding wasps
Michener did not consider productivity in Polistes or other independent‐founding wasps, because, at the time, there were no published data available for this group. In recent decades a number of studies of productivity in Polistes, Mischocyttarus, Ropalidia, and Belonogaster have been published, mostly on founding‐stage colonies (Table 6). Of the 59 data sets on independent‐founding Polistinae in Table 6, three show a positive effect of colony size, 23 show no effect, and 33 a negative effect. While these results might appear to support the hypothesis of lower worker efficiency in larger groups, such a conclusion comes with a caveat. Founding groups of Polistes are made up of cooperative breeders rather than a queen and workers (Leadbeater et al., 2011; Avila & Fromhage, 2015; Grinsted & Field, 2018). Helpers engage in a trade‐off of their helping effort against their expectation of inheriting the alpha position of egg‐layer. Conflict over access to direct reproduction is common and typically leads to the establishment of a dominance hierarchy, which can be modelled as a queue for the inheritance of the alpha position (Cant & Field, 2005). Because of the effect of dominance rank on expected future reproductive success, higher‐ranked individuals are predicted to be less willing than lower‐ranked ones to invest in rearing the current dominant's offspring at the expense of a reduction of their own chance of inheriting the reproductive position (Cant & Field, 2001, 2005). Further, conflicts tend to escalate more, and individuals of a given rank tend to work at lower rates, in larger founding groups compared to smaller ones (Grinsted & Field, 2018). A related prediction – that subordinates of a given rank should contribute less effort in larger than in smaller groups – has been supported for Polistes dominula (Cant & Field, 2001). Additional support for the model comes from empirical studies showing an inverse correlation between overt reproductive conflict and colony growth rate (West‐Eberhard, 1969; Shakarad & Gadagkar, 1995). Removal of the queen increases the rate of dominance interactions, resulting in a pronounced negative effect on group productivity (West‐Eberhard, 1969; Souza, Lino‐Neto & Nascimento, 2017) (see also Gobin et al., 2003). Indeed, some reproductive skew models explain how resources get expended on reproductive conflicts to the detriment of total colony output (Reeve & Keller, 2001). In sum, because a founding group does not consist of a queen plus one or more females behaving altruistically as workers, founding groups of these wasps do not provide valid tests of the hypothesis. A similar argument can be made for the Stenogastrinae (Francescato et al., 2002; Sumner et al., 2002; Fanelli, Boomsma & Turillazzi, 2005; Field, Cronin & Bridge, 2006). In some polistine species, workers are still totipotent and overt dominance and conflict over direct reproduction continue well into the post‐emergence stage (e.g. West‐Eberhard, 1969; Jeanne, 1972; Gadagkar, 2001). Thus, such conflict could contribute to the reduced PCP reported in larger groups of workers.
(c). Swarm‐founding wasps
Despite the limitations of the data (Richards & Richards, 1951) analysed by Michener, the epiponine wasps are ideal for a test of the hypothesis that ergonomic efficiency declines with increasing group size. Because founding swarms of a given species vary widely in size (Forsyth, 1981; Jeanne & Nordheim, 1996; Karsai & Wenzel, 1998; Bouwma et al., 2003b, 2006), the effect of group size on per‐capita output can be measured over a wide size range for this precisely delimited colony stage. In each of three TPLS investigations on two species, the colony cycle was reset to the founding stage by forcing adult populations out of their nests (Jeanne & Nordheim, 1996; Bouwma, Howard & Jeanne, 2005; Bouwma et al., 2006). The resulting absconding swarms initiated new colonies that were allowed to develop for 25 days, just short of the egg‐to‐adult development time, and were then collected to assess colony size and productivity. The results can be translated to a rate: output per female per day. Colony size was the final number of adult females. The rate of adult attrition during the period is independent of the size of the founding swarm in these wasps (Bouwma et al., 2006). Productivity was measured as (i) the size of the nest (number of brood cells) constructed by the founding swarm [nests constructed by the founding swarm are completed in the first 2–3 weeks after founding and are not expanded until well into the ergonomic stage (Jeanne & Bouwma, 2004; Loope & Jeanne, 2008)], and (ii) the total biomass (dry) of brood in the nest at the end of the fixed period of development. Between them, these two proxies capture all of the output of colonies during the founding stage, and so are valid estimates of ergonomic efficiency. Two of the data sets showed a positive effect of colony size, while the other four showed no effect (Table 7). For Polybia occidentalis, a typical small colony (278 females) in the study produced 3.6 brood cells and 10.4 mg of brood per founding female, whereas a typical large colony (719 adults) produced 6.3 cells and 19.4 mg of brood per female (Jeanne & Nordheim, 1996; Jeanne, 1999). In an attempt to reinterpret Jeanne and Nordheim's results so as to provide support for the hypothesis, Karsai & Wenzel (1998) ignored the significant year effect, included colonies that were known outliers, and drew their conclusion without statistical support [see Bouwma et al. (2006) for further discussion]. Therefore, we use the results of the original Jeanne and Nordheim analysis, which provided evidence for increasing, not decreasing, per‐capita productivity with increasing colony size. Note that in the meta‐analysis (Section VI), the results from each year are analysed separately, both showing effect size CIs that overlap with 1, suggesting a neutral effect (Fig. S1).
Taken together, the results for the swarm‐founding wasps provide no support for the hypothesis that per‐capita productivity decreases with increasing colony size for this taxon. This suggests no negative effect detectable at the colony level of foragers in larger colonies having to travel farther to find resources and no negative effect of having to build larger nests. The per‐cell cost of nest construction is a constant function of nest size in P. occidentalis (Jeanne & Nordheim, 1996).
(4). Ants
For several reasons, studies of ants are especially problematic when it comes to investigating ergonomic efficiency and results must be interpreted with care. First, colony cycles of ants last several years, so that even studies based on collections made on a single date (e.g. Franks et al., 2006) cannot rule out ontogenetic effects. Small colonies are likely to be in the early ergonomic stage, with their main output the production of worker brood, the usual proxy for output, whereas large colonies collected on the same day may be in the reproductive stage, with a large fraction of input investment directed to the production and maintenance of sexuals (Figs 2 & 6).
Second, for species with polymorphic workers, scoring output as numbers of worker brood may yield artificially low estimates of ergonomic efficiency across colony size if, for example, larger, more mature colonies produce higher percentages of the larger, more costly, soldier‐subcaste workers than do smaller colonies. In a field experiment on Solenopsis invicta Buren, the number of new workers produced per worker per day decreased with increasing colony size, but the mass or energy content produced per worker per day showed no decrease (Tschinkel, 1993). The same caveat applies to counts of alates as output because the costs of production of gynes and males typically differ from each other and exceed those of workers. Measuring output in terms of biomass or energy content is a way of accounting for such differences, but this is rare in the studies we cite (see Table 8).
Third, artificially constituted colonies housed in the laboratory, common in studies of ants, can also be problematic. Porter & Tschinkel (1985) found that small colonies of S. invicta produced 50% more brood per worker (measured as gram/gram and mg/worker) than colonies four times as large. However, the authors pointed out that because each experimental colony was assembled with a single mature queen, varying numbers of workers, and no brood, the per‐capita output of the larger colonies could have been limited by queen fecundity (oviposition rates were not measured), rather than by decreasing ergonomic efficiency.
Finally, drawing conclusions about ergonomic efficiency from laboratory studies can be risky because the unnatural conditions and housing configurations may create artificial inefficiencies (Brian, 1956a; Tschinkel, 2006; Leitner, Lynch & Dornhaus, 2019).
For all these reasons, it is especially difficult to determine whether a particular study of productivity in ants provides data that accurately measure ergonomic efficiency. Table 8 includes studies that appear to control for these sources of potential bias. We excluded studies that lacked sufficient methodological detail to determine whether our criteria were met. Some of those we include still warrant caveats. For example, per‐capita productivity in larger colonies of litter‐nesting species may be limited by nest‐site size rather than by decreasing ergonomic efficiency (Cole, 1984; Kaspari & Byrne, 1995; Kramer et al., 2014)
Studies of ants also illustrate the importance of selecting the most appropriate output metric. For example, effects differ substantially between alate counts and pupal counts for several species of Pheidole (Kaspari & Byrne, 1995), and while brood number suggested a negative effect in Pogonomyrmex badius (Tschinkel, 1999), stored seeds and fat content exhibited neutral or positive effects (Table 8).
The only other major multi‐species test of the hypothesis comes from Kramer et al. (2014), who assessed colony‐size effects on productivity in 12 large data sets from eight species of small‐colony ants (Temnothorax spp., Leptothorax spp, Myrmica spp. and Harpagoxenus spp.). Using the slope of log‐transformed productivity on colony size as an analysis method, they concluded that most species exhibit declining efficiency in larger colonies. The authors generously gave us access to their raw data, and we report here the results of a similar analysis, but with the removal of queenless colonies, as such colonies are likely to exhibit lower efficiency (Cole, 1986), which could obscure size effects among queenright colonies. For nine of the 11 data sets we re‐analysed, slopes were higher following queenless colony removal (mean difference = 0.098, paired t‐test: t 10 = 3.42, P < 0.01), resulting in a less negative pattern than found in the original study (see Fig. S1 and Table S1 for details of re‐analysis). Thus, the inclusion of queenless colonies represents yet another methodological bias that increases the chances of observing a Michener paradox pattern.
Of the 45 analyses on ants (24 species in 12 genera), six showed a positive effect of colony size on ergonomic efficiency, 27 showed no effect, and 12 a negative effect.
(5). Overall summary of review results
Combining the five taxonomic groups with larger colony sizes and more complex sociality (Apis mellifera, Bombus spp., Vespula spp., Epiponini, Formicidae), 42 show a neutral effect of colony size on efficiency, while 12 show a positive and 16 show a negative response. Thus, we find a similar number of positive and negative effects, with the majority (42/70) of data sets showing no effect. For small‐colony species (Colletidae + Halictidae, Xylocopinae, independent‐founding Polistinae), we find an excess of negative effects: nearly half of effects are neutral (71/145), but there are many more negative effects (56) than positive (18), suggesting a bias in the direction of Michener's pattern (but note that this bias is not present in the Xylocopinae when considered alone; Table 3).
In total, the available studies suggest substantial variation, but no bias toward negative effects in the more complex, large‐colony taxa, with negative biases primarily in Colletidae + Halictidae and in the independent‐founding paper wasps.
VI. META‐ANALYSIS OF POST‐MICHENER STUDIES
To account for the varying sample sizes, effect magnitudes, and the non‐independence of the above data sets, we performed two formal meta‐analyses statistically to synthesise these results into overall estimates of the effect of colony size on ergonomic efficiency (Nakagawa & Santos, 2012).
(1). Meta‐analysis methods
(a). Data collection
We conducted two different meta‐analyses reflecting the two major types of statistical comparisons we found in the literature. In the first, colony size was measured as a continuous variable (hereafter referred to as the continuous meta‐analysis or CMA). In the second, colonies were categorized into discrete size groups of either 1 female or >1 female (hereafter referred to as the discrete meta‐analysis or DMA). When we had the raw data available, data sets in which fewer than half of the colonies had a colony size of just one female were included in the CMA; the remaining data sets were included in the DMA. This threshold balanced the desire to include as many data sets as possible in the CMA, so that small‐colony and large‐colony species were included in the same meta‐analysis, with the desire to avoid fitting regressions to very lopsided colony‐size distributions in the case of data sets with many single‐female colonies.
For the DMA, numerous studies with discrete colony‐size classes reported means and SDs for multiple classes, and we acknowledge that simply comparing single‐female to multi‐female nests obscures the potential complexity of size effects on productivity at different colony sizes. However, we were unable to develop a suitable alternative effect size that would apply across most data sets, and numerous studies have already reported results in this format, so we adopted it as the best possible approach (see Section VI.1d). With some exceptions, the two types of meta‐analysis correlated with colony size, with studies of small‐colony species using discrete size categories, and those of large‐colony species using continuous measures of size. We obtained raw data from tables, from figures using the WebPlotDigitizer program (Rohatgi, 2020), or directly from authors. We used only raw data obtained from authors that were published in some form in the cited references. Reported descriptive or test statistics were used when raw data were unavailable.
(b). Inclusion criteria
Data sets reported in our meta‐analyses are a subset of those included in Tables 2, 3, 4, 5, 6, 7, 8. We considered all studies discovered in the literature searches described above (Section V.1a), but excluded studies for which we were unable to obtain necessary data or test statistics. In two cases, we excluded certain colonies within data sets. First, queenless colonies were removed from data sets in Chan, Hingle & Bourke (1999), Scharf et al. (2012a), and Kramer et al. (2014), as queenlessness can substantially influence colony behaviour and productivity (Landolt, Akre & Greene, 1977; Cole, 1986; Keiser et al., 2018; Smith, 2018). Second, we removed colonies with zero brood from some halictid and allodapine data sets (20 data sets from seven studies), either by obtaining raw data sets and omitting them, or by adjusting mean, SD, and N using Welford's formulae (Welford, 1962) to remove broodless colonies from PCP summary statistics. Zero‐productivity colonies were rare for the continuous colony‐size meta‐analysis but were common in some small‐colony bee species in the discrete meta‐analysis (e.g. Silva, Stevens & Schwarz, 2016; Smith, Kapheim & Wcislo, 2019). In allodapine and halictid bees, broodless colonies are disproportionately single‐female colonies and may be the result of ant predation (Zammit et al., 2008), thus representing colony survival failure, rather than low ergonomic productivity. Removing them is conservative for our purposes; broodless nests occur disproportionately in single‐female nests, and so removing them boosts apparent PCP in small‐colony nests, increasing the chances of detecting a Michener pattern (see also Fig. 3). Because it is also possible that some such colonies result from low productivity rather than colony failure, we conducted a second version of the DMA that included broodless colonies, as well as three studies (seven data sets) that included broodless nests in reported summary statistics but for which raw data were unavailable (Tierney et al., 1997; Chenoweth & Schwarz, 2007; Tierney & Schwarz, 2009). The number of broodless colonies in each such data set is reported in Table S2 and ranged from <5% to over 50% of the nests, depending on the study. Polistine wasp studies that included failed (depredated or abandoned) colonies were omitted when we could not obtain raw data to remove broodless colonies (e.g. Tibbetts & Reeve, 2003; Tindo, Kenne & Dejean, 2008).
(c). Multiple outputs
Numerous studies reported more than one form of output for the same set of colonies (e.g. brood number and brood biomass, or brood number and amount of food stored). A few studies reported multiple incomplete outputs, such as production of males and production of gynes, or independent food storage and brood‐production data. For these studies, we included multiple outputs in the meta‐analysis, but coded them as ‘partial’ under the output completeness moderator (see Section VI.1e). For two papers, Spradbery (1971) and Lee & Winston (1985), we were able to use the raw data reported in the text to calculate a biomass estimate of output in addition to the count data reported in the text (see Table S1 for details). For the data sets with both brood count and biomass data for the same set of colonies, we used only the more accurate and less‐biased output measure (biomass) in the meta‐analysis (Fig. 5). We included a random effect of study to account for multiple outputs from within a study in the overall effect estimate.
(d). Effect sizes
We conducted separate meta‐analyses for continuous and discrete colony size data sets. For the CMA, we used the slope of the regression of log‐transformed output on log‐transformed input. This effect size can conveniently be compared to 1.0 (no effect of colony size on efficiency) and requires no standardization or transformation of inputs or outputs on different scales. It also avoids the heteroscedasticity problem found in many per‐capita‐productivity data sets (see Section V.1b). We typically calculated the slope, slope variance, and sample size from raw data, but for a few data sets used the estimates reported by authors instead (Tschinkel, 1993, 1999; Franks et al., 2006).
For the DMA, we compared PCP of single‐female colonies to multi‐female colonies using a standardized mean‐difference effect size e (Aoki, 2020). This effect size is similar to Cohen's d and reflects the difference between the two group means divided by a measure related to the pooled standard deviation, but accounts for unequal variances between groups using a correction based on the method of Welch's t‐test (Aoki, 2020). We used the es.para.e() function in the es.dif package (Aoki, 2020) to estimate e and its variance from means, SDs, and sample sizes extracted from figures or text, or in some cases calculated by us from raw data. Numerous studies included more than two colony‐size categories and reported summary statistics in figures or tables. For these, if we could not obtain the raw data, we generated a pooled mean, SD, and sample size for all multi‐female groups using the pool.groups function in the dmetar package in R (Harrer et al., 2019). Multi‐female group‐size information was available in all studies included in the DMA, but we chose to combine multi‐female nests into a single PCP estimate in order to allow for a single, comparable effect size to be calculated for all data sets. The effect sizes, sample sizes, and source information for each data set are included in Tables S1 and S2.
(e). Moderator variables
For the CMA, we used two moderator variables to explore the role of output measure on the colony size–productivity relationship: output type and output completeness. Output type was coded as ‘offspring count’, ‘offspring mass or energy’, ‘stored food’, or ‘nest area’, with ‘offspring count’ set as the intercept. Output completeness was coded as ‘complete’ when it involved an estimate of the total production (offspring of all castes + stored food if the species stores food) during the time period considered, or ‘partial’ if it included only a partial measure of output (e.g. sexuals produced in a species also investing in workers, or brood produced in a species that also stores food). The intercept was set to ‘complete’. In the CMA we also included a moderator variable for taxonomic group with eight levels: Halictidae, Xylocopinae, Bombus, Apis mellifera, Vespinae, independent‐founding Polistinae, Epiponini, Formicidae. In the DMA, there was insufficient variation among studies to score output type or output completeness, so we included only one moderator variable, taxonomic group, with three levels: Halictidae + Colletidae, Xylocopinae, independent‐founding Polistinae. In both cases, Halictidae was used as the intercept.
(f). Phylogeny
It is important to account for shared evolutionary history in meta‐analyses, as this generates non‐independence among data collected from related species (Adams, 2008; Nakagawa & Santos, 2012). A common approach that accounts for this non‐independence is to generate a covariance matrix from an ultrametric phylogenetic tree, and then incorporate this as a random effect in the meta‐analysis model (Nakagawa & Santos, 2012). We created two phylogenies, one for each meta‐analysis. Phylogenies were generated by hand in Mesquite (Maddison & Maddison, 2021) using estimates of node ages (in millions of years ago) from taxon‐specific molecular phylogenies. Specifically, we used published chronograms for Allodapini (Rehan, Leys & Schwarz, 2012), Lasioglossum (Gibbs et al., 2012), Bombus (Hines, 2008), Apoidea tribes and families (Branstetter et al., 2017; Shell et al., 2021), Vespidae (Menezes, Lloyd & Brady, 2020), non‐myrmicine ants (Moreau et al., 2006), Myrmicinae (Ward et al., 2015; Prebus, 2017), and we used Branstetter et al. (2017) for the divergence between ant, bee, and wasp clades. For several species, close relatives were substituted (e.g. congeners when only one species of the genus was present in our analysis). Unknown topologies were entered as polytomies. Divergence dates for several nodes within genera (indicated by asterisks in Fig. S2) were not available in any published trees. For these nodes, we entered arbitrary ages estimated as roughly half the age of the genus or subgenus, or species complex (e.g. Temnothorax nylanderi and T. crassispinus). Branch lengths were then computed from node ages, and the trees were imported into R.
(g). Meta‐analysis models
We used the function rma.mv() in the package metafor (Viechtbauer, 2010) to build random‐effects meta‐analytical models for our two subsets of data sets. Species, study, data set (nested within study), and the variance–covariance matrix from the phylogeny were included as random effects. Taxonomic group as well as output type and output completeness (only in the CMA) were entered as a modulator variable to determine if they significantly influenced effect sizes. Models were also created for taxonomic subgroups to obtain summary estimates for each subgroup, and for all of the large‐colony taxa in the CMA together (excluding Halictidae, Xylocopinae and the independent‐founding Polistinae). In the CMA we also separately examined the subsets of studies with complete output measures and those with brood mass output. Finally, we assessed the effects of moderator variables in the large‐colony taxa. We also created a DMA model that included the three studies (12 data sets) on xylocopine species with an unknown number of broodless colonies that were omitted from the original DMA model, and the broodless colonies that were removed from seven studies on xylocopine and halictid species included in the original DMA (20 data sets). For each model we performed a Q‐test to determine whether there was residual heterogeneity in effect sizes beyond that expected by chance. For our study, a significant result would indicate that there are likely to be true differences in effect sizes among data sets; the null hypothesis is that there is one common effect size shared by all data sets, with noise creating the apparent differences in effect sizes among them. We also calculated I 2, a measure of the percentage of variance in effect size that is due to true heterogeneity in effect size rather than chance (Higgins & Thompson, 2002), using the approach described on the metafor website [https://www.metafor-project.org/doku.php/tips:i2_multilevel_ multivariate; Accessed 9/13/2021].
(2). Meta‐analysis results
The CMA of 109 effect sizes from 49 species suggests substantial and significant heterogeneity in effect sizes that is not due to sampling variance, with high I 2 values and significant Q‐tests for most taxa (Figs 10 & S1; Table S3). When considering all moderator predictors together, Bombus had significantly higher slopes than Halictidae (the intercept), although no other differences between moderator levels were significant (Table S4). However, some trends are apparent, with small‐colony species like the halictids and independent‐founding paper wasps showing negative trends, while other groups such as Bombus and Epiponini show positive trends (Figs 10 & S1; Table S4). The large majority of individual effect sizes overlap 1.0 (the expectation for no effect), and the overall slope estimate across all taxa after accounting for phylogeny is 0.95, with confidence intervals that overlap 1.0. The same overall result holds when considering only studies that measure brood mass (Table S5), or only studies that include a ‘complete’ estimate of output (Table S6). When considering only the large‐colony taxa (excluding Halictidae, Xylcopinae and independent‐founding Polistinae), the estimate is even closer to 1 (N = 66 data sets, estimated slope = 0.99, 95% CI: 0.89–1.10; Tables S7 & S8). Taken together, this strongly supports the idea that for most social insect species, particularly those in the large‐colony taxonomic groups, colony size does not negatively affect ergonomic efficiency.
Fig. 10.

Summary of results by taxonomic group for the continuous colony size meta‐analysis (CMA). Effect sizes and 95% confidence intervals are plotted, with 1.0 indicating no effect of colony size on ergonomic efficiency. In the table, k is the number of data sets within each group, and results of Q‐tests (Q statistics and P values) indicate whether there is significant residual heterogeneity in effect sizes, i.e. heterogeneity not due to sampling variance. I 2 values are a measure of the percentage of variance in the estimated slopes that is not due to sampling variance. For a full forest plot of all studies, see Fig. S1. IF Polistinae, independent‐founding Polistinae.
The DMA of 54 data sets from 24 species comparing single‐female with multi‐female nests in small‐colony species revealed a trend towards a negative effect of colony size on PCP, although this was not significant (95% CI of summary effect size overlaps zero; Figs 11 & S3; Table S9). Confidence intervals for the independent‐founding paper wasps summary effect did not overlap zero, indicating a strongly negative effect, and the summary effect for halictids was also negative, although not significantly so (Fig. S3). Taxonomic groups did not differ significantly (Q M = 3.2273, df = 2, P = 0.20; Fig. S3; Table S10). However, there was substantial and significant heterogeneity in effect sizes (Figs 11 & S3), rather than a uniform negative effect across studies and taxa, and particularly in the xylocopine bees, numerous data sets showed either no effect or a positive effect of colony size. When broodless colonies are included in the analysis, the estimated effect size for Halictidae + Colletidae becomes less negative and that for Xylocopinae actually becomes positive, although both confidence intervals are extremely wide and overlap zero (Fig. S4; Table S11). This occurs because the vast majority of broodless nests are single‐female nests, and thus their inclusion lowers PCP for these nests while leaving the PCP for multi‐female nests the same. The changes in individual studies that result from this inclusion, and the number of broodless colonies in each data set, can be seen by comparing Figs S3 and S4. It remains unclear whether including broodless colonies is appropriate for our test, given the uncertain cause of broodlessness (i.e. low productivity versus nest failure due to predation).
Fig. 11.

Summary of results by taxonomic group for the discrete colony size meta‐analysis (DMA). Effect sizes (standardized mean difference, e) and 95% confidence intervals are plotted, with 0 indicating no effect of colony size on per‐capita productivity. In the table, k is the number of data sets within each group, I 2 values are a measure of the percentage of variance in the estimated slopes that is not due to sampling variance, and results of Q‐tests (Q statistics and P values) indicate whether there is significant residual heterogeneity in effect sizes, i.e. heterogeneity not due to sampling variance. For a full forest plot of all studies, see Fig. S3. Note that broodless nests were omitted from this analysis. For results including broodless nests, see Fig. S4. IF Polistinae, independent‐founding Polistinae.
Taken together, these results suggest that most groups do not meet the prediction of the hypothesis, but that there is likely to be declining ergonomic efficiency with increasing colony size in small‐colony taxa like halictids and independent‐founding polistines. This finding is consistent with the hypothesis that conflict over direct reproductive opportunities reduces ergonomic benefits of social living, as these groups typically exhibit strong conflict among totipotent females (Cant & Field, 2005; Leadbeater et al., 2011; also see Section VII). Survival benefits to small‐colony sociality, well documented in the literature (Gibo, 1978; Litte, 1981; Bull & Schwarz, 1996; Schwarz et al., 1998), could alleviate the selective disadvantage of a reduction in PCP in social colonies and may resolve the paradox in these groups. Importantly, in large‐colony social insects, where direct‐fitness options for workers are limited, we see no evidence of declining per‐capita productivity with increasing colony size.
The critical importance of accurate output measures and measurement is highlighted by the observed bias created by using brood counts instead of brood masses in data sets for which we have both measures (Fig. 5). In the CMA, we detected no significant effects of output type or completeness (Table S4). However, when considering only the large‐colony taxa, ‘stored food’ had a significantly higher slope than ‘offspring count’ (Table S8); ‘nest area’ was significantly lower, but this is based on a single data point. For output completeness, ‘partial output’ studies were estimated to have a slope of productivity on colony size that is 0.20 lower than that for ‘complete output’ estimates, though this result was not significant (P = 0.14; Table S8). Although we did not detect significant differences in the CMA between incomplete and complete outputs, nor between brood mass and brood count, the paired within‐study comparison of brood mass and count has a much greater power to detect such a bias, and we stress the importance of considering all forms of output when empirically testing Michener's paradox in the future.
Our meta‐analyses were marked by high heterogeneity among data sets, and this variation was likely due to true differences rather than to sampling variance, given the significant Q‐tests and high I 2 values for most taxonomic groups (Figs 10 & 11). This suggests that many factors influence apparent efficiency–size relationships, including observation decisions (output definition, accuracy of measurement, control for season and developmental stage, geographic and temporal range considered), and biological realities (resource variation, population, and species differences).
VII. MECHANISMS
Investigating efficiency at the level of individuals or small groups can reveal the behavioural mechanisms, or proximate causes (Naug, 2001), behind the colony‐level responses reviewed above (Robson & Traniello, 1999). As colony size increases during ontogenetic development, what behavioural changes occur among workers to bring about a change in the colony's ergonomic efficiency? If there is a true positive or negative effect of size on efficiency, what happens at the individual level to explain it?
There are reasons why per‐capita colony efficiency (rates of brood production) might decrease as colony size increases. Identifying the sources of negative feedback that cause this has long been recognized as a central question in colony population dynamics (Wilson, 1971; Tschinkel, 1988). A number of authors, beginning with Michener (1964), have suggested ways that larger colonies might experience decreasing per‐capita output. These include: (i) declining fecundity of the queen (Michener, 1964). Tschinkel (1988), for example, found a decline of efficiency in the stimulation of queen fecundity by larvae in larger colonies of the fire ant, leading to a decline in the per‐larva reproductive rate as colony size and larval population increase. (ii) Larger colonies may be labour‐saturated and retain a larger reserve force, indicated by increasing numbers of inactive workers (Dornhaus, Holley & Franks, 2009; Waters et al., 2010; Kramer et al., 2014; Stroeymeyt et al., 2017). (iii) Colony members engage in reproductive conflict, reducing per‐capita productivity (see discussion of independent‐founding polistines in Section V). (iv) Large colonies allocate a larger percentage of workers from brood care into a reserve population (Porter & Tschinkel, 1985). (v) Ineffectiveness of some worker castes at rearing larvae. In monomorphic ants, the larger the worker, the less effective it is at brood rearing. In large colonies of fire ants, up to 70% of colony mass is majors, which may depress mean brood‐rearing efficiency (Porter & Tschinkel, 1985). (vi) Larger colonies require longer lines of communication and resource distribution within the nest (Porter & Tschinkel, 1985). (vii) Clumping of brood in ants may reduce worker efficiency due to saturation of working space around the brood pile (Brian, 1956a; Porter & Tschinkel, 1985; but see Tschinkel, 2018). (viii) Costs of having to search a larger area for food supplies (Michener, 1964; Kramer et al., 2014; Stroeymeyt et al., 2017). (ix) Nest‐site limitation (Kramer et al., 2014; Stroeymeyt et al., 2017). In many of these cases (but not all) the decrease in PCP the authors are trying to explain is based on incomplete measures of colony output and therefore is not necessarily a decrease in colony efficiency.
Equally important is to explain the numerous cases we report of neutral and positive effects on efficiency. Here we focus primarily on mechanisms likely to have a positive effect on efficiency, countering, at least in part, the negative effects listed above. We first consider potential gains in task‐performance efficiency, followed by gains in task‐integration efficiency.
(1). Task‐performance gains
In a number of species of bees that form simple societies, groups as small as two benefit from efficiency gains (Tables 2 & 3) through the enabling of a rudimentary division of labour (Schwarz, 1994; Schwarz et al., 1998). Division of labour in guarding, nursing, and foraging can reduce handling and travelling times, reduce learning costs, and increase the amount of time that a guard is at the nest entrance, freeing up time for nestmates to spend foraging. With this most rudimentary form of division of labour, the total amount of effort devoted to foraging in a group of two can more than double, resulting in an increase in per‐capita productivity (Packer, 1993). Because the variance of the mean decreases with increasing sample size, larger groups also benefit from a reduction of variance (= greater predictability) in food acquisition. In the literature, this simple statistical effect is sometimes referred to as the Central Limit Theorem (CLT) (Wenzel & Pickering, 1991; Stevens et al., 2007). (Using proper statistical terminology, the CLT refers to asymptotic normality.)
Although the subset of studies with data available for our meta‐analysis do not suggest a significant difference between Halictidae + Colletidae and the Xylocopinae in the DMA (Figs 11 & S3; N = 45), when the larger number of data sets reported in Tables 2 and 3 (N = 86) is considered, the difference in the proportion of positive, negative, and no‐effect outcomes between the two groups implies significantly more negative effects in Halictidae + Colletidae (𝜒2 = 7.74, df = 2, N = 86, P = 0.021). This suggests that these two groups may differ in some aspect of their behaviour or ecology leading to lower per‐capita efficiency in the Halictidae + Colletidae. Most studies of bees in these two groups use numbers of provisioned cells (Halictidae + Colletidae) or of immatures (Xylocopinae). Although body size is often variable in these bees (Michener, 1990a,b), making biomass a more precise measure of investment in output, the use of counts instead is not likely to account for the possible differences between the two taxa. One source of a potential difference may be reproductive conflict among founding females. Halictids set up dominance hierarchies in founding groups (Strohm & Bordon‐Hauser, 2003; Kapheim et al., 2013; Chole et al., 2019), which may reduce per‐capita output. This likely also explains the strong negative effect observed in the independent‐founding Polistinae, which also exhibit overt conflict and dominance hierarchies. By contrast, agonistic interactions are less pronounced in the allodapines and do not appear to reduce ergonomic efficiency (Michener, 1990a; Schwarz et al., 1998; Silva et al., 2016). Further investigation is needed to determine if there is indeed a difference in efficiency between these groups, and if intra‐colony conflict is responsible for it.
For several of the allodapines reported in Table 3, the gains in per‐capita output peak at groups of two or a few females, then plateau or decline. Schwarz (1994) suggested that the positive effects for smaller groups trace to cooperative brood defence, increased task‐performance efficiency, and lower per‐capita costs in nest construction. With larger numbers, the negative effects of overcrowding in the hollow twigs or stems in which these bees nest may exceed the efficiency gains seen among smaller groups. That is, these two opposing selective forces may equalise at groups of 2–3.
With the larger colonies of Bombus, benefits arise from greater division of labour. Bombus is unusual among social Hymenoptera in its wide intraspecific range of worker body sizes, so it is not surprising that division of labour is tied more closely to worker size than to dominance interactions or age (Cameron, 1989). Larger workers tend to be foragers and guards, while smaller individuals tend to be brood nurses (Jandt & Dornhaus, 2009). For a number of Bombus species, foraging specialists have been shown to be more efficient at their tasks than are generalists (Cartar, 1992; Hagbery & Nieh, 2012). Large foragers forage at higher rates than small foragers (Spaethe & Weidenmüller, 2002). Flower constancy by foragers leads to increased speed of flower handling and faster transitions between flowers (Chittka & Thomson, 1997). Foragers attain their best performance when they have learned only one flower species and specialize on it: they make fewer errors, are faster at correcting them, and have the lowest handling times (Heinrich, 1976; Chittka & Thomson, 1997). Several studies show that speed of accessing pollen and nectar in morphologically complex flowers increases with experience (Laverty, 1980; Laverty & Plowright, 1988; Raine & Chittka, 2007; Muth, Papaj & Leonard, 2016), suggesting that this effect will be larger in larger colonies, where the degree of specialization can be greater. Inside the nest, workers tend to remain within small spatial zones, which can lead to efficiency gains by minimizing the distance they travel between tasks (Jandt & Dornhaus, 2009). Worker body mass within a colony can range over an order of magnitude in some Bombus species (Goulson et al., 2002), suggesting that if the range increases later in the colony cycle, it would enable more efficient division of labour in larger colonies (Plowright & Jay, 1968). However, a test on one species (B. impatiens Cresson) showed that the range and variance in worker size actually decreased with colony size (Couvillon et al., 2010), casting doubt on this hypothesis. Colony performance in thermoregulation and undertaking behaviour did not increase with variation in worker body size (Jandt & Dornhaus, 2014). A direct test using B. impatiens showed that colony performance, but not degree of variation in size, increases with mean worker size (Herrmann, Haddad & Levey, 2018). If production costs and lifespan are taken into account, intermediate‐sized workers were shown to have the highest net resource contribution (Kerr, Crone & Williams, 2019). The question of how natural selection maintains size polymorphism in Bombus workers remains unresolved.
The much larger colony sizes found in many species in the three more socially complex taxa – the swarm‐founding bees (Apis) and wasps (Epiponini) and some ants – create opportunities for additional mechanisms that increase task‐performance efficiency (Richards & Richards, 1951; Bourke & Franks, 1995). Some of the examples of the effects of colony size in the following discussion cite interspecific differences, but the principles apply intraspecifically as well. Large colonies are characterized by decentralized worker control under which workers play a pure helper strategy (Bourke, 1999; Jeanne, 2003), creating opportunities for efficiency gains that selection at the colony level should favour. The underlying enabling mechanism is the well‐documented increase in division of labour that emerges in larger colonies (Gautrais et al., 2002; Thomas & Elgar, 2003; Jeanson et al., 2007; Holbrook, Barden & Fewell, 2011; Ferguson‐Gow et al., 2014; Fewell & Harrison, 2016; Ulrich et al., 2018). Temporal (age) polyethism, widespread in all three groups, typically allocates risky tasks to older individuals, providing a demographic advantage (Seeley, 1982; Jeanne, 1986a; Wakano, Nakata & Yamamura, 1998; Tofilski, 2002, 2006). The resulting increase in specialization gives rise to a variety of mechanisms that can increase task‐performance efficiency in individual workers. Specialist foragers forage farther, spend more time in the field than non‐specialists (Thomas & Framenau, 2005), forage at higher rates (O'Donnell & Jeanne, 1990), carry larger loads (Eckert, 1990; Wolf & Schmid‐Hempel, 1990), and spend less time resting (Smith, Koenig & Peters, 2017), although exceptions have been reported (e.g. Fewell, Ydenberg & Winston, 1991; Dornhaus, 2008). The rate of foraging success increases with experience in some social wasps (Akre et al., 1976; O'Donnell & Jeanne, 1992), but not in others (Santoro, Hartley & Lester, 2019). Among nest workers, specialization on one or a few tasks leads to reduced delays in the search for new tasks, reduced response thresholds for performing those tasks, and faster and more error‐free task completion (Trumbo & Robinson, 1997; Weidenmuller, 2004), resulting in lower rates of task switching by individuals and more tasks performed per worker (Thomas & Elgar, 2003; Holbrook et al., 2013). An increase in group size in small artificial colonies of the clonal raider ant, Ooceraea biroi (Forel), can increase colony homeostasis by stabilizing task performance frequencies and decreasing task neglect, and this effect may operate independently of the increase in division of labour, which also improves homeostasis and colony growth (Ulrich et al., 2018). Modelling has shown that the cost of task switching can select for division of labour (Goldsby et al., 2012), although in the clonal raider ant, experiments and modelling suggest that reduced task switching can emerge in larger groups even in the absence of a cost (Ulrich et al., 2018). In ants with polymorphic workers, each size‐based subcaste is most efficient at performing the tasks it specializes on (Wilson, 1980; Porter & Tschinkel, 1985; Kay & Rissing, 2005; Tschinkel, 2006; Mertl & Traniello, 2009). Elites – workers that consistently perform disproportionately more work than others – are widespread in these groups (Oster & Wilson, 1978; Hurd, 2005; Pinter‐Wollman et al., 2012; Modlmeier et al., 2014; Hammel et al., 2016; Mateus et al., 2019). Finally, individuals vary in their degree of flexibility of task performance: more canalized workers gain efficiency through greater specialization and a reduction in the cost of task switching, whereas more flexible individuals may allow colonies to adapt more rapidly to environmental fluctuations (Jeanson, 2019). Whether the balance between flexible and canalized individuals responds in an adaptive way to changes in colony size or stage of development remains to be investigated (Jeanson, 2019).
(2). Task‐integration gains
In the simple social bee taxa, there is little evidence that task‐integration efficiency increases with colony size. Task partitioning – the division of materials‐handling tasks into subtasks, each carried out by specialists (Jeanne, 1986a) – does not occur. Even in large Bombus colonies, returning pollen and nectar foragers deposit their loads directly into storage pots (Michener, 1974). This suggests that the observed increase in per‐capita productivity with colony size in Bombus colonies derives primarily from gains in task‐performance efficiency. On the other hand, the efficiency of their nest‐based food‐alert system (Dornhaus & Chittka, 2001; Dornhaus, Brockmann & Chittka, 2003) likely increases with colony size.
In the complex social groups – ants and swarm‐founding bees and wasps – increases in task‐performance efficiency through specialization among workers are accompanied by increases in task‐integration efficiencies. Larger colonies tend to have more sophisticated forms of communication (Beckers et al., 1989; Beekman, Sumpter & Ratnieks, 2001), with efficiency gains coming through the expanded use of cues and signals, more rapid transfer of information, reduced queuing delays for material transfer, and Allee effects (Oster & Wilson, 1978; Jeanne, 1986b, 1999, 2003; Hölldobler & Wilson, 1990; Wilson, 1990; Queller, 1996; Anderson & Ratnieks, 1999; Mailleux, Deneubourg & Detrain, 2003; Tschinkel, 2006; O'Donnell & Bulova, 2007; Johnson, 2010; Luque, Giraud & Courchamp, 2013) and greater resilience in the face of stochastic events (Fewell & Harrison, 2016). Series–parallel processing and the greater redundancy in larger groups lead to greater reliability at the colony level (Oster & Wilson, 1978), even if individual reliability declines (Herbers, 1981). Larger colonies also generate greater rates of encounters among nestmates (Karsai & Wenzel, 1998; Smith et al., 2017). The resulting enhanced connectivity among workers (O'Donnell & Bulova, 2007) leads to greater information‐gathering capacity (Donaldson‐Matasci, DeGrandi‐Hoffman & Dornhaus, 2013) and enhanced information flow within the colony (Gordon, 1996; Pacala, Gordon & Godfray, 1996; Holbrook et al., 2013).
The recognition that reporting the mean behaviour of individuals belonging to temporal or physical castes is not fine‐grained enough fully to explain colony dynamics has given rise to the concept of ‘key individuals’, workers that enhance task‐integration efficiency by facilitating colony activities. Drawing on their work with ants, Robson & Traniello (1999) proposed three functional categories of key individuals: catalysts stimulate others to greater activity, performers carry out the majority of work but do not motivate others to assist, and organizers maintain group cohesion around a task until it is completed, but do not take part in the task. Others have identified different categories of key individuals that are specific to particular species (e.g. Frank & Linsenmair, 2017).
As colonies grow in size, more complex ways of organizing work emerge that may enhance efficiency (Gautrais et al., 2002). Task partitioning is a common form of emergent behaviour in larger colonies. In many species of bees, wasps, and ants, foragers hand off their loads to nest workers who then distribute the materials to the larvae, food‐storage areas, or to workers engaged in nest construction. This introduces a cost in the form of a finite queuing delay in the transfer of the material, but modelling shows that this cost decreases roughly exponentially as colony size increases (Anderson & Ratnieks, 1999). Complete task partitioning enables more efficient workflow in larger colonies (Anderson & Ratnieks, 1999). At least in some cases, points of no return can be passed. As an example, on one extremely small pre‐emergence colony of the swarm‐founding wasp Polybia occidentalis (14 females; nest under construction with 66 cells, no envelope) in Costa Rica, the pulp and water foragers continued to return with full loads, much bigger than builders could work with, leading to extremely long queuing delays in transferring their materials to receivers at the nest (Jeanne, 2003). For colonies this small it probably would be more efficient to abandon the series–parallel system that task partitioning engenders and fall back on the parallel–series system of the independent‐founding wasps, but the species apparently lacks the behavioural flexibility to do so, resulting in a loss in efficiency for small colonies of this species (Jeanne, 2003).
Even more complex forms of cooperation occur in some ants. Retrieval of solid food by groups or teams of workers, documented in over 40 genera (Hölldobler & Wilson, 1990), increases the size range of food items a colony can exploit (Czaczkes & Ratnieks, 2013; McCreery & Breed, 2014), but requires a high degree of coordination among the workers. Efficiency gains come in several ways. The speed of transport, for example, increases with the number of ants carrying an item (Czaczkes, Nouvellet & Ratnieks, 2011). In the swarm‐raiding army ants, prey‐retrieval teams can be ‘superefficient’, able to carry more as a single piece than the same number of workers could carry if the piece were fragmented and divided among them (Franks, 1986; Anderson & Franks, 2001).
Finer degrees of task partitioning occur in some of the seed‐harvester and leaf‐cutting ants. Bucket‐brigading is a multi‐stage partitioned foraging system consisting of direct load transfer between individual workers (Anderson & Jadin, 2001; Anderson, Boomsma & Bartholdi, 2002). A leaf forager (Atta sp.) carries her load along the trunk trail towards the nest until she meets an unladen outgoing ant. If the load is transferred, each worker reverses direction. A given leaf fragment can experience more than one such transfer on its way to the nest. The seed‐harvesting ant Messor barbarus (Linnaeus) uses a similar system. Efficiency gains may come through foragers becoming faster at traversing the section of trail they are most familiar with. Transfers tend to be in the direction of larger, faster workers, resulting in higher mean transport rates to the nest and an increase in efficiency (Reyes & Fernández‐Haeger, 1999; Anderson et al., 2002).
An even more extreme form of partitioning in Atta involves indirect transfer of leaf fragments via caches (Fowler & Robinson, 1979). In many populations, each forager ascends a tree, cuts a leaf fragment, and carries it down the tree and on to the nest, perhaps with transfers along the way. But in others, colonies deploy a small number of smaller workers into the tree canopy to cut large pieces of leaf and let them drop to the ground. On the ground, a second group cuts the fallen leaves into portable fragments, carries them to the nearest trunk trail, and drops them in a pile. A third group exploits these caches and transports the pieces to the nest. This is a particularly good example of economy of scale. The cut‐and‐drop system is more efficient than cut‐and‐carry when the ratio of fragments that reach the nest to those that do not is more than the ratio of the cost of cutting and dropping a fragment to that of climbing and descending the tree (Hubbell et al., 1980). In the Fowler & Robinson (1979) study, the former ratio was 1:1, that is, about 50% of cut and dropped fragments were recovered. Although the energetic costs have not been quantified, it is likely that the smaller the colony the smaller the recovery ratio, so that cut‐and‐drop becomes the more efficient strategy only when the colony reaches a certain size threshold, although this remains to be tested.
Empirical support linking any of these performance‐ and integration‐enhancing mechanisms to greater per‐capita output at the colony level in larger colonies is sparse. One study compared the efficiency of nest‐construction behaviour in large and small colonies of the wasp Polybia occidentalis (Jeanne, 1986b). Large colonies (mean size: 512 adults) accomplished a standardized amount of nest‐construction labour in just 57% of the time required by small colonies (mean of 32 adults) to do the same amount of work. Most of the time saved came in the form of shorter queueing delays during transfer of materials from one worker to another at the nest. Workers in large colonies spent 45% less time at these tasks than in small colonies, compared to an 11% saving for water and wood‐pulp foraging, tasks that involve no transfers. In other words, much more of the increase in efficiency seen in large colonies was due to gains in task‐integration efficiency than task‐performance efficiency. This increase in task‐integration efficiency aligns with colony‐level results showing that larger colonies are as or more productive per capita (Jeanne, 1986b) and rear brood significantly faster (Howard & Jeanne, 2004) than smaller ones. It remains to be determined how much of these colony‐level efficiency gains are the result of the increased ergonomic efficiency documented at the individual level. Additional benefits of larger colonies may come from the greater predictability of resource acquisition (Wenzel & Pickering, 1991) and to more effective thermoregulation of the nest (Howard & Jeanne, 2004). The relative importance of these and perhaps other yet‐unrecognized benefits of larger size remains to be investigated.
Only a few studies have documented organizational transitions in response to ontological increases in colony size. When colonies of Monomorium pharaonis (Linnaeus) grow to 600–700 workers they undergo a non‐linear phase shift from disorganized foraging (no trail pheromone) to organized (pheromone‐trail‐based) foraging (Beekman et al., 2001). Colonies of the desert leafcutter ant (Acromyrmex versicolor) undergo a similar phase transition in efficiency during early colony development (Clark & Fewell, 2014). In the yellowjackets Vespula pensylvanica (de Saussure) and V. atropilosa (Sladen), foraging for nectar and prey and their distribution at the nest are rarely partitioned in small (young) colonies, but partitioning becomes the rule later in development, when colonies are larger and queuing delays are short (Akre et al., 1976). In several ant species the degree of partitioning of honeydew collection from aphids increases with colony size (Novgorodova, 2015). When colonies of Formica cunicularia Latreille are small (102 workers), each forager engages in sequential collection and transport to the nest; when colonies reach 103, foragers specialize as either ‘shepherds’ (collect honeydew), ‘guards’ (protect aphids from competitors), or ‘scouts’ (search for new aphid colonies). When colonies of F. lugubris Zetterstedt grow to 105 workers, they add specialized transporters, or tank‐truckers, that collect honeydew from shepherds and bring it to the nest. This increasing degree of specialization as colonies grow likely increases the efficiency of honeydew harvesting.
Such facultative responses to growth in colony size are probably especially adaptive for haplometrotic species, such as yellowjacket wasps and many ants, whose colonies are initiated by a single queen and undergo growth in their worker populations to thousands, millions, or more. For swarm‐founding species, the relative increase in size from the founding group to mature colony size is much less, so such flexibility may be less adaptive.
Among the questions remaining to be investigated is whether simpler forms of task organization, such as the parallel–series system of foraging for nectar and prey seen in small colonies of Vespula, for example, are replaced by a task‐partitioned series–parallel system because they become less efficient as colony size grows or because the series–parallel system becomes more efficient, even if the efficiency of the former does not change.
VIII. CONCLUSIONS
Michener speculated that one of the causes of the declining per‐capita output he reported is that workers become less efficient as colony size increases (Michener, 1964). This has wrongly come to be accepted as supported by Michener's analyses. If this were true, then natural selection should (in the absence of survival benefits to large colonies) favour the evolution of ever‐smaller colony size, ultimately leading to solitary behaviour. That sociality persists in the face of this has been called ‘Michener's paradox’ (Wenzel & Pickering, 1991). By defining efficiency correctly and treating its claimed negative relationship to colony size as a hypothesis to be tested, we have shown that for many taxa the hypothesis has little support. We argue instead that the pattern Michener reported can be traced to his use of proxies for per‐capita output of sexuals, allowing a variety of biasing factors not related to ergonomic efficiency to go unaccounted for. These include intrinsic factors (e.g. limits of queen fecundity; allocation of investment in mature colonies to forms of output not captured by the proxies), extrinsic factors (e.g. seasonal differences in resource availability), and methodological errors (e.g. failure to measure all forms of colony output; inappropriate experimental design). In many cases, if these causes of decreasing per‐capita productivity are controlled for and if all forms of worker output are taken into account, overall efficiency does not decrease and Michener's so‐called paradox disappears. We conclude that most studies fail to support the hypothesis: in many species, larger colonies frequently show no decline, or even an increase, in output per capita compared to smaller ones. In a review of 215 data sets in our systematized review and 163 data sets in the meta‐analyses, we find support for the Michener pattern only in the independent‐founding paper wasps and possibly the halictid bees. Factors other than ergonomic efficiency, both extrinsic and intrinsic, can of course interact with colony size, both as cause and as effect. Their effects, however, are anything but paradoxical and can be parsed and measured by carefully designed observations and experiments.
Only if per‐capita productivity includes all forms of input and output does it measure a colony's efficiency. Because most published studies use proxy measures of input and/or output, i.e. measure only one form of input and/or output, their measures of per‐capita productivity are not valid measures of efficiency. In most of the studies Michener analysed, reproductivity in terms of numbers of reproductives produced is not what was measured. In his case studies, small colonies often showed a higher per‐capita output than did large ones simply because more of their total effort went into what the proxy measured than was the case for larger colonies. Despite these shortcomings, studies using proxies are useful for the more limited purpose of assessing the effects of colony size on PCP within a sample of colonies of a species, as long as biasing variables such as colony stage, season, and others are strictly controlled for.
Because few of the studies reviewed here had the measurement of per‐capita productivity as their primary purpose, we cannot conclude that the hypothesis that ergonomic efficiency decreases in larger groups has been fully tested and fails. That will require additional studies designed specifically to measure ergonomic efficiency in targeted taxa, with the proper phylogenetic corrections in place. But at a minimum, the results of our survey call the hypothesis into serious question for many species. This is not to deny that the paradox can occur in principle. The halictids (Table 2) may be good candidates. If colony efficiency actually does decline with group size in some species, then the mechanisms behind it can be sought. We have suggested reproductive conflict among founding females as one mechanism. In addition, perhaps in these groups workers actually do get in one another's way, as Michener speculated.
Although the focus of Michener's analysis and of this review is on colony dynamics at the intraspecific level, the question of the relationship between colony size and colony efficiency can be posed across species as well. Do large‐colony species in genera such as Atta, Apis, and Agelaia convert resources into reproductives more (or less) efficiently than do small‐colony species in such genera as Leptothorax, Megalopta, and Mischocyttarus?
At the interspecific level, it is clear that the various major taxa of eusocial Hymenoptera are characterized by differing degrees of division of labour and task partitioning. Stingless bees and honey bees partition nectar‐handling tasks (Seeley, 1995; Hart & Ratnieks, 2002), but bumble bees do not (Michener, 1974). Among the social wasps, Polistes and other independent‐founding polistines have very weak temporal polyethism and rudimentary task partitioning (Jeanne, 1999), whereas the epiponine wasps have strong temporal polyethism and complete task partitioning of the handling of all resources (prey, nectar, water, and nesting material) (Jeanne, 1986b). The vespines appear to be intermediate between the independent‐ and swarm‐founders. Despite colonies that can grow to thousands of workers, they have weak temporal polyethism and partition the handling of food but not of nest material.
In sum, efficiency gains in larger groups, both within and across species, can accrue through a combination of economies of scale and more efficient performance and organization of tasks, including division of labour, worker specialization, greater task integration, group food retrieval, and task partitioning (Traniello & Beshers, 1991; Shakarad & Gadagkar, 1995; Anderson & Ratnieks, 1999; Anderson et al., 2002). The range of colony sizes over which each of these will become cost‐effective likely varies widely from one type of benefit to another. For example, the simple partitioning of resource‐handling tasks into foraging by one group of workers and distribution/utilization on the nest by another may become cost effective at colony sizes of a hundred workers or fewer, whereas leaf dropping and caching by attine ants may require colonies of hundreds of thousands for it to realize efficiency gains, but then the gains may be substantial.
Ergonomic efficiency, a measure of how cost effectively a colony converts resources into reproductives, is a social trait and a component of colony fitness. It is a colony‐level phenotype through which natural selection acts not only on colony size, but on such work‐organizational traits as division of labour, task partitioning, and mechanisms of colony integration via cues and signals (Holbrook et al., 2011; Goldsby et al., 2012). It could be argued that this is the mechanism through which ‘emergent behaviour’ emerges in social insect colonies. Natural selection should act at the colony level to increase efficiency, and probably acts most strongly when colonies are larger and potential energetic savings are greater. An unresolved, but possibly important issue is the causal relationship between efficiency, size, and colony failure: can low efficiency be a cause of colony failure in small colonies of any species?
Because of the scientific community's failure to interpret Michener's paper correctly, we have barely begun to investigate the cause–effect relationships between colony size and colony efficiency. A full understanding of the evolution and maintenance of colony size will require clarity about how these traits interact and respond to selection. Does enhanced efficiency enable larger colony size, or does cause–effect work in the other direction? Thus, the role of energetic efficiency is deserving of study (Fjerdingstad & Crozier, 2006; Modlmeier & Foitzik, 2011), not just in social insects, but in any group of cooperating individuals, including humans and robots.
Supporting information
Fig. S1. Full forest plot for the continuous colony size meta‐analysis (CMA).
Fig. S2. Phylogenetic trees used to control for shared ancestry in the continuous meta‐analysis and the discrete meta‐analysis.
Fig. S3. Full forest plot for the discrete colony size meta‐analysis (DMA).
Fig. S4. Full forest plot for the discrete colony size meta‐analysis (DMA), including broodless colonies.
Table S1. Details of the data sets used in the continuous colony size meta‐analysis (CMA).
Table S2. Details of the data sets used in the discrete colony size meta‐analysis (DMA).
Table S3. Multivariate meta‐analysis model results for the continuous colony size meta‐analysis (CMA).
Table S4. Multivariate meta‐analysis model results for the continuous colony size meta‐analysis (CMA) with taxonomic and output moderators.
Table S5. Multivariate meta‐analysis model results for the offspring mass data sets in the continuous colony size meta‐analysis (CMA).
Table S6. Multivariate meta‐analysis model results for the complete‐output data sets in the continuous colony size meta‐analysis (CMA).
Table S7. Multivariate meta‐analysis model results for the large‐colony taxa in the continuous colony size meta‐analysis (CMA).
Table S8. Multivariate meta‐analysis model results for the large‐colony taxa in the continuous colony size meta‐analysis (CMA)with taxonomic and output moderators.
Table S9. Multivariate meta‐analysis model results for the discrete colony size meta‐analysis (DMA).
Table S10. Multivariate meta‐analysis model results for the discrete colony size meta‐analysis (DMA) with taxonomic moderators.
Table S11. Multivariate meta‐analysis model results for the discrete colony size meta‐analysis (DMA), including broodless nests in studies that reported them.
IX. ACKNOWLEDGEMENTS
The following kindly provided raw data and/or answered questions we had about their data: Olivia Bernauer, Michel Chapuisat, Carmen da Silva, Rebecca Dew, Susanne Foitzik, Edilberto Giannotti, Malcolm Keeping, Boris Kramer, Juliana Rangel, Sandra Rehan, Inon Scharf, Michael Schwarz, Perttu Seppa, Adam Smith, Mark Stevens, Simon Tierney, Walter Tschinkel. The following colleagues provided valuable suggestions for improving various drafts of this review: Jeffrey Baylis, Blaine Cole, Tess Doumas, Lauren Gregory, James Jeanne, Sean O'Donnell, Walter Tschinkel, and Diane Wiernasz. Sam Engle and Karen Dunn helped answer questions about systematized reviews and meta‐analysis. We gratefully acknowledge two anonymous reviewers for insights and suggestions leading to a final round of improvements.
Contributor Information
Robert L. Jeanne, Email: rljeanne@wisc.edu.
Kevin J. Loope, Email: kjloope@gmail.com.
REFERENCES
- Accorti, M. , Tarducci, F. & Luti, F. (1991). Numerical ratio between adult bees and reared brood. Ethology Ecology & Evolution 3(sup1), 119–122. [Google Scholar]
- Adams, D. C. (2008). Phylogenetic meta‐analysis. Evolution 62(3), 567–572. [DOI] [PubMed] [Google Scholar]
- Akre, R. D. , Garnett, W. B. , Mac Donald, J. F. , Greene, A. & Landolt, P. (1976). Behavior and colony development of Vespula pensylvanica and V. atropilosa (Hymenoptera: Vespidae). Journal of the Kansas Entomological Society 49(1), 63–84. [Google Scholar]
- Anderson, C. , Boomsma, J. J. & Bartholdi, J. J. (2002). Task partitioning in insect societies: bucket brigades. Insectes Sociaux 49(2), 171–180. [Google Scholar]
- Anderson, C. & Franks, N. (2001). Teams in animal societies. Behavioral Ecology 12(5), 534–540. [Google Scholar]
- Anderson, C. , Franks, N. R. & McShea, D. W. (2001). The complexity and hierarchical structure of tasks in insect societies. Animal Behaviour 62, 643–651. [Google Scholar]
- Anderson, C. & Jadin, J. L. V. (2001). The adaptive benefit of leaf transfer in Atta colombica . Insectes Sociaux 48(4), 404–405. [Google Scholar]
- Anderson, C. & Ratnieks, F. L. W. (1999). Task partitioning in insect societies. I. Effect of colony size on queueing delay and colony ergonomic efficiency. The American Naturalist 154(5), 521–535. [DOI] [PubMed] [Google Scholar]
- Aoki, S. (2020). Effect sizes of the differences between means without assuming variance equality and between a mean and a constant. Heliyon 6(1), 1–9. [DOI] [PMC free article] [PubMed] [Google Scholar]
- Archer, M. E. (2012). Vespine Wasps of the World. Behaviour, Ecology & Taxonomy of the Vespinae. Siri Scientific Press, Manchester. [Google Scholar]
- Avila, P. & Fromhage, L. (2015). No synergy needed: ecological constraints favor the evolution of eusociality. The American Naturalist 186(1), 31–40. [DOI] [PubMed] [Google Scholar]
- Beckers, R. , Goss, S. , Deneubourg, J. L. & Pasteels, J. M. (1989). Colony size, communication and ant foraging strategy. Psyche (Cambridge) 96(3–4), 239–256. [Google Scholar]
- Beekman, M. , Sumpter, D. J. T. & Ratnieks, F. L. W. (2001). Phase transition between disordered and ordered foraging in Pharaoh's ants. Proceedings of the National Academy of Sciences of the United States of America 98(17), 9703–9706. [DOI] [PMC free article] [PubMed] [Google Scholar]
- Bernauer, O. M. , Cook, J. M. & Tierney, S. M. (2021). Nesting biology and social organisation of the allodapine bee Exoneura angophorae (Hymenoptera: Apidae): montane environmental constraints yield biased sex allocation yet phenology is unhindered. Insectes Sociaux 68(4), 337–349. [Google Scholar]
- Beshers, S. N. & Traniello, J. F. A. (1994). The adaptiveness of worker demography in the attine ant Trachymyrmex septentrionalis . Ecology 75(3), 763–775. [Google Scholar]
- Billick, I. (2001). Density dependence and colony growth in the ant species Formica neorufibarbis . Journal of Animal Ecology 70(6), 895–905. [Google Scholar]
- Blackith, R. E. (1958). An analysis of polymorphism in social wasps. Insectes Sociaux 5(3), 263–272. [Google Scholar]
- Boomsma, J. J. & Isaaks, J. A. (1985). Energy investment and respiration in queens and males of Lasius niger (Hymenoptera: Formicidae). Behavioral Ecology and Sociobiology 18(1), 19–27. [Google Scholar]
- Boomsma, J. J. , van der Lee, G. A. & van der Have, T. M. (1982). On the production ecology of Lasius niger (Hymenoptera: Formicidae) in successive coastal dune valleys. Journal of Animal Ecology 51(3), 975–991. [Google Scholar]
- Bourke, A. F. G. (1999). Colony size, social complexity and reproductive conflict in social insects. Journal of Evolutionary Biology 12(2), 245–257. [Google Scholar]
- Bourke, A. F. G. & Franks, N. R. (1995). Social Evolution in Ants. Princeton University Press, Princeton. [Google Scholar]
- Bouwma, A. M. , Bouwma, P. E. , Nordheim, E. V. & Jeanne, R. L. (2003a). Adult mortality rates in young colonies of a swarm‐founding social wasp. Journal of Zoology 260, 11–16. [Google Scholar]
- Bouwma, A. M. , Bouwma, P. E. , Nordheim, E. V. & Jeanne, R. L. (2003b). Founding swarms in a tropical social wasp: adult mortality, emigration distance, and swarm size. Journal of Insect Behavior 16, 439–452. [Google Scholar]
- Bouwma, A. M. , Howard, K. J. & Jeanne, R. L. (2005). Parasitism in a social wasp: effect of gregarines on foraging behavior, colony productivity, and adult mortality. Behavioral Ecology and Sociobiology 59(2), 222–233. [Google Scholar]
- Bouwma, A. M. , Nordheim, E. V. & Jeanne, R. L. (2006). Per‐capita productivity in a social wasp: no evidence for a negative effect of colony size. Insectes Sociaux 53, 412–419. [Google Scholar]
- Brahma, A. , Mandal, S. & Gadagkar, R. (2018). Emergence of cooperation and division of labor in the primitively eusocial wasp Ropalidia marginata . Proceedings of the National Academy of Sciences of the United States of America 115(4), 756–761. [DOI] [PMC free article] [PubMed] [Google Scholar]
- Brand, N. & Chapuisat, M. (2014). Impact of helpers on colony productivity in a primitively eusocial bee. Behavioral Ecology and Sociobiology 68(2), 291–298. [Google Scholar]
- Branstetter, M. G. , Danforth, B. N. , Pitts, J. P. , Faircloth, B. C. , Ward, P. S. , Buffington, M. L. , Gates, M. W. , Kula, R. R. & Brady, S. G. (2017). Phylogenomic insights into the evolution of stinging wasps and the origins of ants and bees. Current Biology 27(7), 1019–1025. [DOI] [PubMed] [Google Scholar]
- Brian, M. V. (1950). The stable winter population structure in species of Myrmica . Journal of Animal Ecology 19(2), 119–123. [Google Scholar]
- Brian, M. V. (1953). Brood‐rearing in relation to worker number in the ant Myrmica . Physiological Zoology 26(4), 355–366. [Google Scholar]
- Brian, M. V. (1956a). Group form and causes of working inefficiency in the ant Myrmica rubra L. Physiological Zoology 29(3), 173–194. [Google Scholar]
- Brian, M. V. (1956b). Inefficiency in brood‐rearing in the ant Myrmica rubra L. Insectes Sociaux 3, 71–74. [Google Scholar]
- Brian, M. V. (1965). Social Insect Populations. Academic Press, London. [Google Scholar]
- Brian, M. V. & Elmes, G. W. (1974). Production by the ant Tetramorium caespitum in a southern English heath. Journal of Animal Ecology 43(3), 889–903. [Google Scholar]
- Bull, N. J. & Schwarz, M. P. (1996). The habitat saturation hypothesis and sociality in an allodapine bee: cooperative nesting is not “making the best of a bad situation”. Behavioral Ecology and Sociobiology 39(4), 267–274. [Google Scholar]
- Cameron, S. A. (1989). Temporal patterns of division of labor among workers in the primitively eusocial bumble bee, Bombus griseocollis . Ethology 80, 137–151. [Google Scholar]
- Cant, M. A. & Field, J. (2001). Helping effort and future fitness in cooperative animal societies. Proceedings of the Royal Society B‐Biological Sciences 268(1479), 1959–1964. [DOI] [PMC free article] [PubMed] [Google Scholar]
- Cant, M. A. & Field, J. (2005). Helping effort in a dominance hierarchy. Behavioral Ecology 16(4), 708–715. [Google Scholar]
- Cartar, R. V. (1992). Adjustment of foraging effort and task switching in energy‐manipulated wild bumblebee colonies. Animal Behaviour 44, 75–87. [Google Scholar]
- del Castillo, R. C. & Fairbairn, D. J. (2012). Macroevolutionary patterns of bumblebee body size: detecting the interplay between natural and sexual selection. Ecology and Evolution 2(1), 46–57. [DOI] [PMC free article] [PubMed] [Google Scholar]
- de Castro, M. M. , de Avelar, D. L. G. , de Souza, A. R. & Prezoto, F. (2014). Nesting substrata, colony success and productivity of the wasp Mischocyttarus cassununga . Revista Brasileira de Entomologia 58(2), 168–172. [Google Scholar]
- Chan, G. L. & Bourke, A. F. G. (1994). Split sex‐ratios in a multiple‐queen ant population. Proceedings of the Royal Society B‐Biological Sciences 258(1353), 261–266. [Google Scholar]
- Chan, G. L. , Hingle, A. & Bourke, A. F. G. (1999). Sex allocation in a facultatively polygynous ant: between‐population and between‐colony variation. Behavioural Ecology 10(4), 409–421. [Google Scholar]
- Chao, J.‐T. (1984). Dominance and ovarian development in the paper wasp Polistes annularis (L.) (Hymenoptera: Vespidae) (caste, division labor, laying workers). Ph.D. thesis, University of Georgia.
- Chenoweth, L. B. & Schwarz, M. P. (2007). Social biology of two Malagasy Halterapis: evidence that eusociality is plesiomorphic for an ancient allodapine lineage. Annals of the Entomological Society of America 100(2), 311–319. [Google Scholar]
- Chittka, L. & Muller, H. (2009). Learning, specialization, efficiency and task allocation in social insects. Communicative & Integrative Biology 2(2), 151–154. [DOI] [PMC free article] [PubMed] [Google Scholar]
- Chittka, L. & Thomson, J. D. (1997). Sensori‐motor learning and its relevance for task specialization in bumble bees. Behavioral Ecology and Sociobiology 41(6), 385–398. [Google Scholar]
- Chole, H. , Woodard, S. H. & Bloch, G. (2019). Body size variation in bees: regulation, mechanisms, and relationship to social organization. Current Opinion in Insect Science 35, 77–87. [DOI] [PubMed] [Google Scholar]
- Clark, R. M. & Fewell, J. H. (2014). Transitioning from unstable to stable colony growth in the desert leafcutter ant Acromyrmex versicolor . Behavioral Ecology and Sociobiology 68(1), 163–171. [Google Scholar]
- Clouse, R. (2001). Some effects of group size on the output of beginning nests of Mischocyttarus mexicanus (Hymenoptera: Vespidae). Florida Entomologist 84(3), 418–425. [Google Scholar]
- Cole, B. J. (1984). Colony efficiency and the reproductivity effect in Leptothorax allardycei (Mann). Insectes Sociaux 31(4), 403–407. [Google Scholar]
- Cole, B. J. (1986). The social behavior of Leptothorax allardycei – time budgets and the evolution of worker reproduction. Behavioral Ecology and Sociobiology 18, 165–173. [Google Scholar]
- Cole, B. J. & Wiernasz, D. C. (2000). Colony size and reproduction in the western harvester ant, Pogonomyrmex occidentalis . Insectes Sociaux 47(3), 249–255. [Google Scholar]
- Couvillon, M. J. , Jandt, J. M. , Duong, N. & Dornhaus, A. (2010). Ontogeny of worker body size distribution in bumble bee (Bombus impatiens) colonies. Ecological Entomology 35(4), 424–435. [DOI] [PMC free article] [PubMed] [Google Scholar]
- Czaczkes, T. J. , Nouvellet, P. & Ratnieks, F. L. W. (2011). Cooperative food transport in the Neotropical ant, Pheidole oxyops . Insectes Sociaux 58(2), 153–161. [Google Scholar]
- Czaczkes, T. J. & Ratnieks, F. L. W. (2013). Cooperative transport in ants (Hymenoptera: Formicidae) and elsewhere. Myrmecological News 18, 1–11. [Google Scholar]
- Dew, R. , Tierney, S. , Gardner, M. & Schwarz, M. (2018a). Casteless behaviour in social groups of the bee Exoneurella eremophila . Apidologie 49(2), 265–275. [Google Scholar]
- Dew, R. M. , Tierney, S. M. & Schwarz, M. P. (2018b). Lack of ovarian skew in an allodapine bee and the evolution of casteless social behaviour. Ethology Ecology & Evolution 30(1), 51–69. [Google Scholar]
- Donaldson‐Matasci, M. C. , DeGrandi‐Hoffman, G. & Dornhaus, A. (2013). Bigger is better: honeybee colonies as distributed information‐gathering systems. Animal Behaviour 85(3), 585–592. [DOI] [PMC free article] [PubMed] [Google Scholar]
- Dornhaus, A. (2008). Specialization does not predict individual efficiency in an ant. PLoS Biology 6(11), 2368–2375. [DOI] [PMC free article] [PubMed] [Google Scholar]
- Dornhaus, A. , Brockmann, A. & Chittka, L. (2003). Bumble bees alert to food with pheromone from tergal gland. Journal of Comparative Physiology. A, Neuroethology, Sensory, Neural, and Behavioral Physiology 189(1), 47–51. [DOI] [PubMed] [Google Scholar]
- Dornhaus, A. & Chittka, L. (2001). Food alert in bumblebees (Bombus terrestris): possible mechanisms and evolutionary implications. Behavioral Ecology and Sociobiology 50(6), 570–576. [Google Scholar]
- Dornhaus, A. , Holley, J.‐A. & Franks, N. R. (2009). Larger colonies do not have more specialized workers in the ant Temnothorax albipennis . Behavioral Ecology 20(5), 922–929. [Google Scholar]
- Eckert, C. D. (1990). The relationship between colony state and individual foraging behavior in the honey bee, Apis mellifera L. MSc thesis, Simon Fraser University, Burnaby, BC, Canada.
- Fanelli, D. , Boomsma, J. J. & Turillazzi, S. (2005). Multiple reproductive strategies in a tropical hover wasp. Behavioral Ecology and Sociobiology 58(2), 190–199. [Google Scholar]
- Farrar, C. L. (1931). A measure of some factors affecting the development of the honeybee colony. Ph.D. thesis, Massachusetts State College, Amherst.
- Farrar, C. L. (1937). The influence of colony populations on honey production. Journal of Agricultural Research 54, 945–954. [Google Scholar]
- Ferguson‐Gow, H. , Sumner, S. , Bourke, A. F. G. & Jones, K. E. (2014). Colony size predicts division of labour in attine ants. Proceedings of the Royal Society B‐Biological Sciences 281(1793), 20141411. [DOI] [PMC free article] [PubMed] [Google Scholar]
- Fewell, J. H. & Harrison, J. F. (2016). Scaling of work and energy use in social insect colonies. Behavioral Ecology and Sociobiology 70, 1047–1061. [Google Scholar]
- Fewell, J. H. , Ydenberg, R. C. & Winston, M. L. (1991). Individual foraging efforts as a function of colony population in the honey bee, Apis mellifera L. Animal Behaviour 42(1), 153–155. [Google Scholar]
- Field, J. , Cronin, A. & Bridge, C. (2006). Future fitness and helping in social queues. Nature 441(7090), 214–217. [DOI] [PubMed] [Google Scholar]
- Field, J. , Shreeves, G. , Sumner, S. & Casiraghi, M. (2000). Insurance‐based advantage to helpers in a tropical hover wasp. Nature 404(6780), 869–871. [DOI] [PubMed] [Google Scholar]
- Field, J. & Toyoizumi, H. (2020). The evolution of eusociality: no risk‐return tradeoff but the ecology matters. Ecology Letters 23(3), 518–526. [DOI] [PMC free article] [PubMed] [Google Scholar]
- Fjerdingstad, E. J. & Crozier, R. (2006). The evolution of worker caste diversity in social insects. American Naturalist 167, 390–400. [DOI] [PubMed] [Google Scholar]
- Forsyth, A. B. (1981). Swarming activity of polybiine social wasps (Hymenoptera: Vespidae:Polybiini). Biotropica 13(2), 93–99. [Google Scholar]
- Foster, K. R. (2004). Diminishing returns in social evolution: the not‐so‐tragic commons. Journal of Evolutionary Biology 17(5), 1058–1072. [DOI] [PubMed] [Google Scholar]
- Fowler, H. G. & Robinson, S. W. (1979). Foraging by Atta sexdens (Formicidae: Attini): seasonal patterns, caste, and efficiency. Ecological Entomology 4, 239–247. [Google Scholar]
- Francescato, E. , Massolo, A. , Landi, M. , Gerace, L. , Hashim, R. & Turillazzi, S. (2002). Colony membership, division of labor, and genetic relatedness among females of colonies of Eustenogaster fraterna (Hymenoptera, Vespidae, Stenogastrinae). Journal of Insect Behavior 15(2), 153–170. [Google Scholar]
- Frank, E. T. & Linsenmair, K. E. (2017). Flexible task allocation and raid organization in the termite‐hunting ant Megaponera analis . Insectes Sociaux 64(4), 579–589. [Google Scholar]
- Franks, N. R. (1986). Teams in social insects: group retrieval of prey by army ants (Eciton burchelli, Hymenoptera: Formicidae). Behavioral Ecology and Sociobiol 18, 425–429. [Google Scholar]
- Franks, N. R. , Dornhaus, A. , Best, C. S. & Jones, E. L. (2006). Decision making by small and large house‐hunting ant colonies: one size fits all. Animal Behaviour 72, 611–616. [Google Scholar]
- Free, J. B. & Racey, P. A. (1968). The effect of the size of honeybee colonies on food consumption, brood rearing and the longevity of the bees during winter. Enttomologia Experimentalis et Applicata 11(2), 241–249. [Google Scholar]
- Fu, F. , Kocher, S. D. & Nowak, M. A. (2015). The risk–return trade‐off between solitary and eusocial reproduction. Ecology Letters 18(1), 74–84. [DOI] [PMC free article] [PubMed] [Google Scholar]
- Gadagkar, R. (2001). The Social Biology of Ropalidia marginata. Toward Understanding the Evolution of Eusociality. Harvard University Press, Cambridge. [Google Scholar]
- Gautrais, J. , Theraulaz, G. , Deneubourg, J.‐L. & Anderson, C. (2002). Emergent polyethism as a consequence of increased colony size in insect societies. Journal of Theoretical Biology 215, 363–373. [DOI] [PubMed] [Google Scholar]
- Gibbs, J. , Brady, S. G. , Kanda, K. & Danforth, B. N. (2012). Phylogeny of halictine bees supports a shared origin of eusociality for Halictus and Lasioglossum (Apoidea: Anthophila: Halictidae). Molecular Phylogenetics and Evolution 65(3), 926–939. [DOI] [PubMed] [Google Scholar]
- Gibo, D. L. (1978). The selective advantage of foundress associations in Polistes fuscatus (Hymenoptera Vespidae): a field‐study of the effects of predation on productivity. Canadian Entomologist 110(5), 519–540. [Google Scholar]
- Gibo, D. L. & Metcalf, R. A. (1978). Early survival of Polistes apachus (Hymenoptera: Vespidae) colonies in California: a field study of an introduced species. Canadian Entomologist 110(12), 1339–1343. [Google Scholar]
- Gobin, B. , Heinze, J. , Stratz, M. & Roces, F. (2003). The energetic cost of reproductive conflicts in the ant Pachycondyla obscuricornis . Journal of Insect Physiology 49(8), 747–752. [DOI] [PubMed] [Google Scholar]
- Goldsby, H. J. , Dornhaus, A. , Kerr, B. & Ofria, C. (2012). Task‐switching costs promote the evolution of division of labor and shifts in individuality. Proceedings of the National Academy of Sciences of the United States of America 109(34), 13686–13691. [DOI] [PMC free article] [PubMed] [Google Scholar]
- Goodisman, M. A. D. & Ross, K. G. (1996). Relationship of queen size and worker number in polygyne colonies of the fire ant Solenopsis invicta . Insectes Sociaux 43, 303–307. [Google Scholar]
- Gordon, D. M. (1996). The organization of work in social insect colonies. Nature 380, 121–124. [Google Scholar]
- Goulson, D. , Peat, J. , Stout, J. C. , Tucker, J. , Darvill, B. , Derwent, L. C. & Hughes, W. O. H. (2002). Can alloethism in workers of the bumblebee, Bombus terrestris, be explained in terms of foraging efficiency? Animal Behaviour 64(1), 123–130. [Google Scholar]
- Grant, M. J. & Booth, A. (2009). A typology of reviews: an analysis of 14 review types and associated methodologies. Health Information and Libraries Journal 26(2), 91–108. [DOI] [PubMed] [Google Scholar]
- Grinsted, L. & Field, J. (2018). Predictors of nest growth: diminishing returns for subordinates in the paper wasp Polistes dominula . Behavioral Ecology and Sociobiology 72(6), 1–8. [DOI] [PMC free article] [PubMed] [Google Scholar]
- Hagbery, J. & Nieh, J. C. (2012). Individual lifetime pollen and nectar foraging preferences in bumble bees. Naturwissenschaften 99(10), 821–832. [DOI] [PubMed] [Google Scholar]
- Hammel, B. , Vollet‐Neto, A. , Menezes, C. , Nascimento, F. S. D. O. , Engels, W. & Gruter, C. (2016). Soldiers in a stingless bee: work rate and task repertoire suggest they are an elite force. The American Naturalist 187(1), 120–129. [DOI] [PubMed] [Google Scholar]
- Harbo, J. R. (1986). Effect of population size on brood production, worker survival and honey gain in colonies of honeybees. Journal of Apicultural Research 25(1), 22–29. [Google Scholar]
- Harrer, M. , Cuijpers, P. , Furukawa, T. & Ebert, D. D. (2019). dmetar: Companion R Package For The Guide ‘Doing Meta‐Analysis in R’.
- Hart, A. G. & Ratnieks, F. L. W. (2002). Task‐partitioned nectar transfer in stingless bees: work organisation in a phylogenetic context. Ecological Entomology 27(2), 163–168. [Google Scholar]
- Hee, J. J. , Holway, D. A. , Suarez, A. V. & Case, T. J. (2000). Role of propagule size in the success of incipient colonies of the invasive Argentine ant. Conservation Biology 14(2), 559–563. [Google Scholar]
- Heinrich, B. (1976). Foraging specializations of individual bumblebees. Ecological Monographs 46(2), 105–128. [Google Scholar]
- Herbers, J. (1981). Reliability theory and foraging by ants. Journal of Theoretical Biology 89, 175–189. [Google Scholar]
- Herrmann, J. D. , Haddad, N. M. & Levey, D. J. (2018). Mean body size predicts colony performance in the common eastern bumble bee (Bombus impatiens). Ecological Entomology 43(4), 458–462. [Google Scholar]
- Higgins, J. P. & Thompson, S. G. (2002). Quantifying heterogeneity in a meta‐analysis. Statistics in Medicine 21(11), 1539–1558. [DOI] [PubMed] [Google Scholar]
- Hines, H. M. (2008). Historical biogeography, divergence times, and diversification patterns of bumble bees (Hymenoptera: Apidae: Bombus). Systematic Biology 57(1), 58–75. [DOI] [PubMed] [Google Scholar]
- Hocherl, N. & Tautz, J. (2015). Nesting behavior of the paper wasp Polistes dominula in Central Europe – a flexible system for expanding into new areas. Ecosphere 6(12), 1–11. [Google Scholar]
- Hogendoorn, K. & Zammit, J. (2001). Benefits of cooperative breeding through increased colony survival in an allodapine bee. Insectes Sociaux 48(4), 392–397. [Google Scholar]
- Holbrook, C. T. , Barden, P. M. & Fewell, J. H. (2011). Division of labor increases with colony size in the harvester ant Pogonomyrmex californicus . Behavioral Ecology 22(5), 960–966. [Google Scholar]
- Holbrook, C. T. , Eriksson, T. H. , Overson, R. P. , Gadau, J. & Fewell, J. H. (2013). Colony‐size effects on task organization in the harvester ant Pogonomyrmex californicus . Insectes Sociaux 60, 191–201. [Google Scholar]
- Hölldobler, B. & Wilson, E. O. (1990). The Ants. Harvard University Press, Cambridge. [Google Scholar]
- Howard, K. J. & Jeanne, R. L. (2004). Rates of brood development in a social wasp: effects of colony size and parasite infection. Insectes Sociaux 51, 179–185. [Google Scholar]
- Hubbell, S. P. , Johnson, L. K. , Stanislav, E. , Wilson, B. & Fowler, H. (1980). Foraging by bucket‐brigade in leaf‐cutter ants. Biotropica 12(3), 210–213. [Google Scholar]
- Hurd, C. R. (2005). Patterns of labor organization in the eusocial wasp, Vespula germanica (Hymenoptera: Vespidae). Ph.D. thesis, The University of Wisconsin‐Madison.
- Inagawa, K. , Kojima, J. , Sayama, K. & Tsuchida, K. (2001). Colony productivity of the paper wasp Polistes snelleni: comparison between cool‐temperate and warm‐temperate populations. Insectes Sociaux 48(3), 259–265. [Google Scholar]
- Ito, Y. (1983). Social behaviour of a subtropical paper wasp, Ropalidia fasciata (F.): field observations during founding stage. Journal of Ethology 1(1–2), 1–14. [Google Scholar]
- Ito, Y. (1985). Colony development and social structure in a subtropical paper wasp, Ropalidia fasciata (F.) (Hymenoptera, Vespidae). Researches on Population Ecology 27(2), 333–349. [Google Scholar]
- Ito, Y. & Itioka, T. (2008). Demography of the Okinawan eusocial wasp Ropalidia fasciata (Hymenoptera: Vespidae) II. Effects of foundress group size on survival rates of colonies and foundresses, and production of progeny. Entomological Science 11(1), 17–30. [Google Scholar]
- Jandt, J. M. & Dornhaus, A. (2009). Spatial organization and division of labour in the bumblebee Bombus impatiens . Animal Behaviour 77(3), 641–651. [Google Scholar]
- Jandt, J. M. & Dornhaus, A. (2014). Bumblebee response thresholds and body size: does worker diversity increase colony performance? Animal Behaviour 87, 97–106. [Google Scholar]
- Jeanne, R. L. (1972). Social biology of the Neotropical wasp Mischocyttarus drewseni . Bulletin of the Museum of Comparative Zoology, Harvard University 144, 63–150. [Google Scholar]
- Jeanne, R. L. (1986a). The evolution of the organization of work in social insects. Monitore Zoologico Italiano (Nuova Serie) 20, 119–133. [Google Scholar]
- Jeanne, R. L. (1986b). The organization of work in Polybia occidentalis: costs and benefits of specialization in a social wasp. Behavioral Ecology and Sociobiology 19(5), 333–341. [Google Scholar]
- Jeanne, R. L. (1999). Group size, productivity, and information flow in social wasps. In Information Processing in Social Insects (eds Detrain C., Deneubourg J.‐L. and Pasteels J. M.). Birkhauser Verlag, Basel. [Google Scholar]
- Jeanne, R. L. (2003). Social complexity in the Hymenoptera, with special attention to the wasps. In Genes, Behaviors and Evolution of Social Insects (eds Kikuchi T., Azuma N. and Higashi S.), pp. 81–130. Hokkaido University Press, Sapporo. [Google Scholar]
- Jeanne, R. L. & Bouwma, A. M. (2004). Divergent patterns of nest construction in eusocial wasps. Journal of the Kansas Entomological Society 77, 429–447. [Google Scholar]
- Jeanne, R. L. & Nordheim, E. V. (1996). Productivity in a social wasp: per capita output increases with swarm size. Behavioral Ecology 7(1), 43–48. [Google Scholar]
- Jeanson, R. (2019). Within‐individual behavioural variability and division of labour in social insects. Journal of Experimental Biology 222(10), jeb190868. [DOI] [PubMed] [Google Scholar]
- Jeanson, R. , Fewell, J. H. , Gorelick, R. & Bertram, S. M. (2007). Emergence of increased division of labor as a function of group size. Behavioral Ecology and Sociobiology 62(2), 289–298. [Google Scholar]
- Johnson, B. R. (2010). Task partitioning in honey bees: the roles of signals and cues in group‐level coordination of action. Behavioral Ecology 21(6), 1373–1379. [Google Scholar]
- Joyce, N. C. & Schwarz, M. P. (2006). Sociality in the Australian allodapine bee Brevineura elongata: small colony sizes despite large benefits to group living. Journal of Insect Behavior 19(1), 45–61. [Google Scholar]
- Joyce, N. C. & Schwarz, M. P. (2007). Sociality and sex allocation in an Australian allodapine bee Braunsapis protuberans . Australian Journal of Entomology 46, 121–128. [Google Scholar]
- Kapheim, K. M. , Smith, A. R. , Nonacs, P. , Wcislo, W. T. & Wayne, R. K. (2013). Foundress polyphenism and the origins of eusociality in a facultatively eusocial sweat bee, Megalopta genalis (Halictidae). Behavioral Ecology and Sociobiology 67(2), 331–340. [Google Scholar]
- Karsai, I. & Wenzel, J. W. (1998). Productivity, individual‐level and colony‐level flexibility, and organization of work as consequences of colony size. Proceedings of the National Academy of Sciences of the United States of America 95(15), 8665–8669. [DOI] [PMC free article] [PubMed] [Google Scholar]
- Kaspari, M. & Byrne, M. M. (1995). Caste allocation in litter Pheidole: lessons from plant defense theory. Behavioral Ecology and Sociobiology 37(4), 255–263. [Google Scholar]
- Kay, A. & Rissing, S. W. (2005). Division of foraging labor in ants can mediate demands for food and safety. Behavioral Ecology and Sociobiology 58(2), 165–174. [Google Scholar]
- Keeping, M. G. (1989). Social biology and colony dynamics of the polistine wasp, Belonogaster petiolata (Hymenoptera: Vespidae). PhD thesis, University of the Witwatersrand, Johannesburg.
- Keiser, C. N. , Vojvodic, S. , Butler, I. O. , Sartain, E. , Rudolf, V. H. & Saltz, J. B. (2018). Queen presence mediates the relationship between collective behaviour and disease susceptibility in ant colonies. Journal of Animal Ecology 87(2), 379–387. [DOI] [PubMed] [Google Scholar]
- Kerr, N. Z. , Crone, E. E. & Williams, N. M. (2019). Integrating vital rates explains optimal worker size for resource return by bumblebee workers. Functional Ecology 33(3), 467–478. [Google Scholar]
- Knerer, G. (1983). The biology and social behaviour of Evylaeus linearis (Schenk) (Apoidea; Halictinae). Zoologischer Anzeiger 211, 177–186. [Google Scholar]
- Kojima, J. (1989). Growth and survivorship of preemergence colonies of Ropalidia fasciata in relation to foundress group size in the subtropics (Hymenoptera, Vespidae). Insectes Sociaux 36(3), 197–218. [Google Scholar]
- Kramer, B. H. , Scharf, I. & Foitzik, S. (2014). The role of per‐capita productivity in the evolution of small colony sizes in ants. Behavioral Ecology and Sociobiology 68(1), 41–53. [Google Scholar]
- Kramer, B. H. , Schrempf, A. , Scheuerlein, A. & Heinze, J. (2015). Ant colonies do not trade‐off reproduction against maintenance. PLoS One 10(9), 1–13. [DOI] [PMC free article] [PubMed] [Google Scholar]
- Krispyn, J. W. (1979). Colony productivity and survivorship of the paper wasp Polistes annularis. Ph.D. thesis, University of Georgia.
- Kukuk, P. F. & Sage, G. K. (1994). Reproductivity and relatedness in a communal halictine bee Lasioglossum (Chilalictus) hemichalceum . Insectes Sociaux 41, 443–455. [Google Scholar]
- Landolt, P. J. , Akre, R. D. & Greene, A. (1977). Effects of colony division on Vespula atropilosa (Sladen) (Hymenoptera: Vespidae). Journal of the Kansas Entomological Society 50(1), 135–147. [Google Scholar]
- Laverty, T. M. (1980). The flower‐visiting behavior of bumble bees: floral complexity and learning. Canadian Journal of Zoology 58, 1324–1335. [Google Scholar]
- Laverty, T. M. & Plowright, R. C. (1988). Flower handling by bumblebees: a comparison of specialists and generalists. Animal Behaviour 36, 733–740. [Google Scholar]
- Leadbeater, E. , Carruthers, J. M. , Green, J. P. , Rosser, N. S. & Field, J. (2011). Nest inheritance is the missing source of direct fitness in a primitively eusocial insect. Science (Washington DC) 333(6044), 874–876. [DOI] [PubMed] [Google Scholar]
- Lee, P. C. & Winston, M. L. (1985). The influence of swarm size on brood production and emergent worker weight in newly founded honey bee colonies (Apis mellifera L.). Insectes Sociaux 32, 96–103. [Google Scholar]
- Leitner, N. , Lynch, C. & Dornhaus, A. (2019). Ants in isolation: obstacles to testing worker responses to task stimuli outside of the colony context. Insectes Sociaux 66(3), 343–354. [Google Scholar]
- Liebert, A. E. , Nonacs, P. & Wayne, R. K. (2005). Solitary nesting and reproductive success in the paper wasp Polistes aurifer . Behavioral Ecology and Sociobiology 57(5), 445–456. [Google Scholar]
- Liebert, A. E. & Starks, P. T. (2006). Taming of the skew: transactional models fail to predict reproductive partitioning in the paper wasp Polistes dominulus . Animal Behaviour 71, 913–923. [Google Scholar]
- Litte, M. (1977a). Aspects of the social biology of the bee Halictus ligatus in New York State. Insectes Sociaux 24(1), 9–36. [Google Scholar]
- Litte, M. (1977b). Behavioral ecology of the social wasp Mischocyttarus mexicanus . Behavioral Ecology and Sociobiology 2(3), 229–246. [Google Scholar]
- Litte, M. (1981). Social biology of the polistine wasp Mischocyttarus labiatus: survival in a Colombian rain forest. Smithsonian Contributions to Zoology 327, iii, 27 p. [Google Scholar]
- Litte, M. I. (1976). Self, kin and social behavior in the polistine wasp Mischocyttarus mexicanus. Doctoral dissertation thesis, Cornell University.
- Loope, K. J. & Jeanne, R. L. (2008). A test of adaptive hypotheses for rapid nest construction in a swarm‐founding wasp. Insectes Sociaux 55(3), 274–282. [Google Scholar]
- Luque, G. M. , Giraud, T. & Courchamp, F. (2013). Allee effects in ants. Journal of Animal Ecology 82(5), 956–965. [DOI] [PubMed] [Google Scholar]
- Maddison, W. P. & Maddison, D. R. (2021). Mesquite: A Modular System for Evolutionary Analysis. Version 3.70. http://www.mesquiteproject.org
- Mailleux, A.‐C. , Deneubourg, J. L. & Detrain, C. (2003). How does colony growth influence communication in ants? Insectes Sociaux 50, 24–31. [Google Scholar]
- Mateus, S. , Ferreira‐Caliman, M. J. , Menezes, C. & Gruter, C. (2019). Beyond temporal‐polyethism: division of labor in the eusocial bee Melipona marginata . Insectes Sociaux 66(2), 317–328. [Google Scholar]
- McCreery, H. F. & Breed, M. D. (2014). Cooperative transport in ants: a review of proximate mechanisms. Insectes Sociaux 61(2), 99–110. [Google Scholar]
- Menezes, R. S. T. , Lloyd, M. W. & Brady, S. G. (2020). Phylogenomics indicates Amazonia as the major source of Neotropical swarm‐founding social wasp diversity. Proceedings of the Royal Society B‐Biological Sciences 287(1928), 20200480. [DOI] [PMC free article] [PubMed] [Google Scholar]
- Mertl, A. L. & Traniello, J. F. A. (2009). Behavioral evolution in the major worker subcaste of twig‐nesting Pheidole (Hymenoptera: Formicidae): does morphological specialization influence task plasticity? Behavioral Ecology and Sociobiology 63, 1411–1426. [Google Scholar]
- Metcalf, R. A. & Whitt, G. S. (1977). Relative inclusive fitness in the social wasp Polistes metricus . Behavioral Ecology and Sociobiology 2(4), 353–360. [Google Scholar]
- Michener, C. D. (1964). Reproductive efficiency in relation to colony size in hymenopterous societies. Insectes Sociaux 11(4), 317–342. [Google Scholar]
- Michener, C. D. (1974). The Social Behavior of the Bees. A Comparative Study. Harvard University Press, Cambridge. [Google Scholar]
- Michener, C. D. (1990a). Castes in xylocopine bees. In Social Insects. An Evolutionary Approach to Castes and Reproduction (ed. Engels W.), pp. 123–146. Springer‐Verlag, Berlin. [Google Scholar]
- Michener, C. D. (1990b). Reproduction and castes in social halictine bees. In Social Insects: An Evolutionary Approach to Castes and Reproduction (ed. Engels W.), pp. 77–121. Springer‐Verlag, Heidelberg. [Google Scholar]
- Michener, C. D. (2000). The Bees of the World. The Johns Hopkins University Press, Baltimore. [Google Scholar]
- Michener, C. D. , Brothers, D. J. & Kamm, D. R. (1971). Interactions in colonies of primitively social bees: artificial colonies of Lasioglossum zephyrum . Proceedings of the National Academy of Sciences of the United States of America 68(6), 1241–1245. [DOI] [PMC free article] [PubMed] [Google Scholar]
- Michener, C. D. & Lange, R. B. (1958). Observations on the behavior of Brazilian halictid bees (Hymenoptera, Apoidea). 1. Pseudagapostemon . Annals of the Entomological Society of America 51, 155–164. [Google Scholar]
- Michener, C. D. & Lange, R. B. (1959). Observations on the behavior of Brazilian halictid bees IV. Augochloropsis, with notes on extralimital forms. American Museum Novitates 1924, 1–41. [Google Scholar]
- Michener, C. D. & Wille, A. (1961). The bionomics of a primitively social bee, Lasioglossum inconspicuum . University of Kansas Science Bulletin 42, 1123–1202. [Google Scholar]
- Modlmeier, A. P. & Foitzik, S. (2011). Productivity increases with variation in aggression among group members in Temnothorax ants. Behavioral Ecology 22(5), 1026–1032. [Google Scholar]
- Modlmeier, A. P. , Keiser, C. N. , Watters, J. V. , Sih, A. & Pruitt, J. N. (2014). The keystone individual concept: an ecological and evolutionary overview. Animal Behaviour 89, 53–62. [Google Scholar]
- Moeller, F. E. (1961). The relationship between colony populations and honey production as affected by honey bee stock lines. In Production Research Report (Volume 55), pp. 1–20. United States Department of Agriculture, Washington, DC. [Google Scholar]
- Moreau, C. S. , Bell, C. D. , Vila, R. , Archibald, S. B. & Pierce, N. E. (2006). Phylogeny of the ants: diversification in the age of angiosperms. Science 312(5770), 101–104. [DOI] [PubMed] [Google Scholar]
- Müller, C. B. & Schmid‐Hempel, P. (1992). Correlates of reproductive success among field colonies of Bombus lucorum . Ecological Entomology 17, 343–353. [Google Scholar]
- Muth, F. , Papaj, D. R. & Leonard, A. S. (2016). Bees remember flowers for more than one reason: pollen mediates associative learning. Animal Behaviour 111, 93–100. [Google Scholar]
- Nakagawa, S. & Santos, E. S. (2012). Methodological issues and advances in biological meta‐analysis. Evolutionary Ecology 26(5), 1253–1274. [Google Scholar]
- Nakata, K. (2000). Stability in worker production and colony size in ant colonies (Hymenoptera: Formicidae). Sociobiology 35(3), 441–446. [Google Scholar]
- Naug, D. (2001). Ergonomic mechanisms for handling variable amounts of work in colonies of the wasp Ropalidia marginata . Ethology 107(12), 1115–1123. [Google Scholar]
- Novgorodova, T. A. (2015). Organization of honeydew collection by foragers of different species of ants (Hymenoptera: Formicidae): effect of colony size and species specificity. European Journal of Entomology 112(4), 688–697. [Google Scholar]
- O'Donnell, S. & Bulova, S. J. (2007). Worker connectivity: a review of the design of worker communication systems and their effects on task performance in insect societies. Insectes Sociaux 54(3), 203–210. [Google Scholar]
- O'Donnell, S. & Jeanne, R. L. (1990). Forager specialization and the control of nest repair in Polybia occidentalis Olivier (Hymenoptera: Vespidae). Behavioral Ecology and Sociobiology 27, 359–364. [Google Scholar]
- O'Donnell, S. & Jeanne, R. L. (1992). Forager success increases with experience in Polybia occidentalis (Hymenoptera, Vespidae). Insectes Sociaux 39(4), 451–454. [Google Scholar]
- Odum, E. P. & Pontin, A. J. (1961). Population density of the underground ant, Lasius flavus, as determined by tagging with P32 . Ecology 42(1), 186–188. [Google Scholar]
- Oliveira, A. R. S. , Cohnstaedt, L. W. , Cernicchiaro, N. & Reddy, G. V. P. (2021). Unbiased approaches for reviewing entomology literature: a systematized review. Annals of the Entomological Society of America 114(2), 229–246. [Google Scholar]
- Oster, G. F. & Wilson, E. O. (1978). Caste and Ecology in the Social Insects. Princeton University Press, Princeton. [PubMed] [Google Scholar]
- Ostwald, M. M. , Fox, T. P. , Harrison, J. F. & Fewell, J. H. (2021). Social consequences of energetically costly nest construction in a facultatively social bee. Proceedings of the Royal Society B‐Biological Sciences 288, 20210033. 10.1098/rspb.2021.0033. [DOI] [PMC free article] [PubMed] [Google Scholar]
- Owen, R. E. , Rodd, F. H. & Plowright, R. C. (1980). Sex ratios in bumble bee colonies: complications due to orphaning? Behavioral Ecology and Sociobiology 7, 287–291. [Google Scholar]
- Pacala, S. W. , Gordon, D. M. & Godfray, H. C. J. (1996). Effects of social group size on information transfer and task allocation. Evolutionary Ecology 10(2), 127–165. [Google Scholar]
- Packer, L. (1986). Multiple‐foundress associations in a temperate population of Halictus ligatus . Canadian Journal of Zoology 64, 2325–2362. [Google Scholar]
- Packer, L. (1993). Multiple‐foundress associations in sweat bees. In Queen Number and Sociality in Insects (ed. Keller L.), pp. 215–233. Oxford University Press, New York. [Google Scholar]
- Packer, L. , Jessome, V. , Lockerbie, C. & Sampson, B. (1989). The phenology and social biology of four sweat bees in a marginal environment: Cape Breton Island. Canadian Journal of Zoology 67, 2871–2877. [Google Scholar]
- Pinter‐Wollman, N. , Hubler, J. , Holley, J.‐A. , Franks, N. R. & Dornhaus, A. (2012). How is activity distributed among and within tasks in Temnothorax ants? Behavioral Ecology and Sociobiology 66(10), 1407–1420. [Google Scholar]
- Plowright, R. C. & Jay, S. C. (1968). Caste differentiation in bumblebees (Bombus Latr.: Hym). 1. The determination of female size. Insectes Sociaux 15, 171–192. [Google Scholar]
- Poitrineau, K. , Mitesser, O. & Poethke, H. J. (2009). Workers, sexuals, or both? Optimal allocation of resources to reproduction and growth in annual insect colonies. Insectes Sociaux 56(2), 119–129. [Google Scholar]
- Porter, S. D. & Tschinkel, W. R. (1985). Fire ant polymorphism: the ergonomics of brood production. Behavioral Ecology and Sociobiology 16(4), 323–336. [Google Scholar]
- Powers, S. T. & Lehmann, L. (2016). When is bigger better? The effects of group size on the evolution of helping behaviours. Biological Reviews 92(2), 902–920. [DOI] [PubMed] [Google Scholar]
- Prebus, M. (2017). Insights into the evolution, biogeography and natural history of the acorn ants, genus Temnothorax Mayr (Hymenoptera: Formicidae). BMC Evolutionary Biology 17(1), 1–22. [DOI] [PMC free article] [PubMed] [Google Scholar]
- Queller, D. C. (1996). The origin and maintenance of eusocialiity: the advantage of extended parental care. In Natural History and Evolution of Paper‐Wasps (eds Turillazzi S. and West‐Eberhard M. J.), pp. 218–234. Oxford University Press, New York. [Google Scholar]
- R Core Team (2020). R: A Language and Environment for Statistical Computing. R Core Team, Vienna. [Google Scholar]
- Raine, N. E. & Chittka, L. (2007). Pollen foraging: learning a complex motor skill by bumblebees (Bombus terrestris). Naturwissenschaften 94(6), 459–464. [DOI] [PubMed] [Google Scholar]
- Rangel, J. & Seeley, T. D. (2012). Colony fissioning in honey bees: size and significance of the swarm fraction. Insectes Sociaux 59(4), 453–462. [Google Scholar]
- Ratnieks, F. L. W. & Anderson, C. (1999). Task partitioning in insect societies. Insectes Sociaux 46(2), 95–108. [Google Scholar]
- Reeve, H. K. & Hölldobler, B. (2007). The emergence of a superorganism through intergroup competition. Proceedings of the National Academy of Sciences of the United States of America 104(23), 9736–9740. [DOI] [PMC free article] [PubMed] [Google Scholar]
- Reeve, H. K. & Keller, L. (2001). Tests of reproductive‐skew models in social insects. Annual Review of Entomology 46, 347–385. [DOI] [PubMed] [Google Scholar]
- Rehan, S. M. , Leys, R. & Schwarz, M. P. (2012). A mid‐Cretaceous origin of sociality in xylocopine bees with only two origins of true worker castes indicates severe barriers to eusociality. PLoS One 7(4), e34690. [DOI] [PMC free article] [PubMed] [Google Scholar]
- Rehan, S. M. , Richards, M. H. , Adams, M. & Schwarz, M. P. (2014). The costs and benefits of sociality in a facultatively social bee. Animal Behaviour 97, 77–85. [Google Scholar]
- Reyes, J. L. & Fernández‐Haeger, F. (1999). Sequential co‐operative load transport in the seed‐harvesting ant Messor barbarus . Insectes Sociaux 46, 199–125. [Google Scholar]
- Richards, O. W. & Richards, M. J. (1951). Observations on the social wasps of South America (Hymenoptera Vespidae). Transactions of the Royal Entomological Society London 102, 1–170. [Google Scholar]
- Robson, S. K. & Traniello, J. F. A. (1999). Key individuals and the organization of labor in ants. In Information Processing in Social Insects (eds Detrain C., Deneubourg J.‐L. and Pasteels J. M.), pp. 239–259. Birkhauser Verlag, Basel. [Google Scholar]
- Rohatgi, A. WebPlotDigitizer, version: 4.5. August, 2021, Pacifica. https://automeris.io/WebPlotDigitizer
- Santoro, D. , Hartley, S. & Lester, P. J. (2019). Behaviourally specialized foragers are less efficient and live shorter lives than generalists in wasp colonies. Scientific Reports 9(1), 5366. [DOI] [PMC free article] [PubMed] [Google Scholar]
- Scharf, I. , Modlmeier, A. P. , Beros, S. & Foitzik, S. (2012a). Ant societies buffer individual‐level effects of parasite infections. American Naturalist 180(5), 671–683. [DOI] [PubMed] [Google Scholar]
- Scharf, I. , Modlmeier, A. P. , Fries, S. , Tirard, C. & Foitzik, S. (2012b). Characterizing the collective personality of ant societies: aggressive colonies do not abandon their home. PLoS One 7(3), e33314. [DOI] [PMC free article] [PubMed] [Google Scholar]
- Schwarz, M. P. (1994). Female‐biased sex ratios in a facultatively social bee and their implications for social evolution. Evolution 48(5), 1684–1697. [DOI] [PubMed] [Google Scholar]
- Schwarz, M. P. , Bull, N. J. & Hogendoorn, K. (1998). Evolution of sociality in the allodapine bees: a review of sex allocation, ecology and evolution. Insectes Sociaux 45(4), 349–368. [Google Scholar]
- Schwarz, M. P. , Lowe, R. M. & Lefevere, K. S. (1996). Kin association in the allodapine bee Exoneura richardsoni Rayment (Hymenoptera: Apidae). Australian Journal of Entomology 35, 65–71. [Google Scholar]
- Schwarz, M. P. , Tierney, S. M. , Zammit, J. , Schwarz, P. M. & Fuller, S. (2005). Brood provisioning and colony composition of a Malagasy species of Halterapis: implications for social evolution in the allodapine bees (Hymenoptera: Apidae: Xylocopinae). Annals of the Entomological Society of America 98(1), 126–133. [Google Scholar]
- Seeley, T. D. (1982). Adaptive significance of the age polyethism schedule in honeybee colonies. Behavioral Ecology and Sociobiology 11(4), 287–293. [Google Scholar]
- Seeley, T. D. (1995). The Wisdom of the Hive: The Social Physiology of Honey Bee Colonies. Harvard University Press, Cambridge. [Google Scholar]
- Seppa, P. , Queller, D. C. & Strassmann, J. E. (2002). Reproduction in foundress associations of the social wasp, Polistes carolina: conventions, competition, and skew. Behavioral Ecology 13(4), 531–542. [Google Scholar]
- Shakarad, M. & Gadagkar, R. (1995). Colony founding in the primitively eusocial wasp, Ropalidia marginata (Lep.) (Hymenoptera: Vespidae). Ecological Entomology 20(3), 273–282. [Google Scholar]
- Shell, W. A. , Steffen, M. A. , Pare, H. K. , Seetharam, A. S. , Severin, A. J. , Toth, A. L. & Rehan, S. M. (2021). Sociality sculpts similar patterns of molecular evolution in two independently evolved lineages of eusocial bees. Communications Biology 4(1), 1–9. [DOI] [PMC free article] [PubMed] [Google Scholar]
- Shreeves, G. , Cant, M. A. , Bolton, A. & Field, J. (2003). Insurance‐based advantages for subordinate co‐foundresses in a temperate paper wasp. Proceedings of the Royal Society B‐Biological Sciences 270(1524), 1617–1622. [DOI] [PMC free article] [PubMed] [Google Scholar]
- Shreeves, G. & Field, J. (2002). Group size and direct fitness in social queues. American Naturalist 159(1), 81–95. [DOI] [PubMed] [Google Scholar]
- Silberbauer, L. X. & Schwarz, M. P. (1995). Life cycle and social behavior in a heathland population of the allodapine bee, Exoneura bicolor (Hymenoptera, Apidae). Insectes Sociaux 42(2), 201–218. [Google Scholar]
- da Silva, C. R. B. , Stevens, M. I. & Schwarz, M. P. (2016). Casteless sociality in an allodapine bee and evolutionary losses of social hierarchies. Insectes Sociaux 63(1), 67–78. [Google Scholar]
- Smith, A. R. , Kapheim, K. M. & Wcislo, W. T. (2019). Survival and productivity benefits of sociality vary seasonally in the tropical, facultatively eusocial bee Megalopta genalis . Insectes Sociaux 66(4), 555–568. [Google Scholar]
- Smith, A. R. , Wcislo, W. T. & O'Donnell, S. (2007). Survival and productivity benefits to social nesting in the sweat bee Megalopta genalis (Hymenoptera: Halictidae). Behavioral Ecology and Sociobiology 61(7), 1111–1120. [Google Scholar]
- Smith, J. A. & Schwarz, M. P. (2006). Sociality in a Malagasy allodapine bee, Macrogalea antanosy, and the impacts of the facultative social parasite, Macrogalea maizina . Insectes Sociaux 53(1), 101–107. [Google Scholar]
- Smith, J. A. , Schwarz, M. R. & Chapman, T. W. (2006). Sociality in the allodapine bee genus Macrogalea: insights from two Malagasy species. African Entomology 14(1), 147–152. [Google Scholar]
- Smith, M. L. (2018). Queenless honey bees build infrastructure for direct reproduction until their new queen proves her worth. Evolution 72(12), 2810–2817. [DOI] [PubMed] [Google Scholar]
- Smith, M. L. , Koenig, P. A. & Peters, J. M. (2017). The cues of colony size: how honey bees sense that their colony is large enough to begin to invest in reproduction. Journal of Experimental Biology 220, 1597–1605. [DOI] [PubMed] [Google Scholar]
- Smith, M. L. , Ostwald, M. M. , Loftus, J. C. & Seeley, T. D. (2014). A critical number of workers in a honeybee colony triggers investment in reproduction. Naturwissenschaften 101(10), 783–790. [DOI] [PubMed] [Google Scholar]
- Smith, M. L. , Ostwald, M. M. & Seeley, T. D. (2016). Honey bee sociometry: tracking honey bee colonies and their nest contents from colony founding until death. Insectes Sociaux 63(4), 553–563. [Google Scholar]
- de Souza, A. R. , Lino‐Neto, J. & do Nascimento, F. S. (2017). Pushing wasps to work: decentralized aggression induces increased activity in the paper wasp Polistes versicolor . Journal of Insect Behavior 30(4), 360–373. [Google Scholar]
- Spaethe, J. & Weidenmüller, A. (2002). Size variation and foraging rate in bumblebees (Bombus terrestris). Insectes Sociaux 49, 142–146. [Google Scholar]
- Spessa, A. , Schwarz, M. P. & Adams, B. J. (2000). Sociality in Amphylaeus morosus (Hymenoptera: Colletidae: Hylaeinae). Annals of the Entomological Society of America 93, 684–692. [Google Scholar]
- Spradbery, J. P. (1971). Seasonal changes in population structure of wasp colonies (Hymenoptera, Vespidae). Journal of Animal Ecology 40(2), 501–523. [Google Scholar]
- Starr, C. K. (2006). Steps toward a general theory of the colony cycle. In Life Cycles in Social Insects. Behaviour, Ecology and Evolution (ed. Kipyatkov V. E.), pp. 1–20. St. Petersburg University Press, St. Petersburg. [Google Scholar]
- Stevens, M. I. , Hogendoorn, K. & Schwarz, M. P. (2007). Evolution of sociality by natural selection on variances in reproductive fitness: evidence from a social bee. BMC Evolutionary Biology 7, 1–9. [DOI] [PMC free article] [PubMed] [Google Scholar]
- Strassmann, J. E. , Queller, D. C. & Hughes, C. R. (1988). Predation and the evolution of sociality in the paper wasp Polistes bellicosus . Ecology 69(5), 1497–1505. [Google Scholar]
- Stroeymeyt, N. , Joye, P. & Keller, L. (2017). Polydomy enhances foraging performance in ant colonies. Proceedings of the Royal Society B‐Biological Sciences 284(1853), 20170269. [DOI] [PMC free article] [PubMed] [Google Scholar]
- Strohm, E. & Bordon‐Hauser, A. (2003). Advantages and disadvantages of large colony size in a halictid bee: the queen's perspective. Behavioral Ecology 14(4), 546–553. [Google Scholar]
- Sumner, S. , Casiraghi, M. , Foster, W. & Field, J. (2002). High reproductive skew in tropical hover wasps. Proceedings of the Royal Society B‐Biological Sciences 269(1487), 179–186. [DOI] [PMC free article] [PubMed] [Google Scholar]
- Suzuki, T. (1981). Flesh intake and production of offspring in colonies of Polistes chinenesis antennalis (Hymenoptera, Vespidae). II. Flesh intake and production of reproductives. Kontyu 49(2), 283–301. [Google Scholar]
- Thomas, M. L. (2003). Seasonality and colony‐size effects on the life‐history characteristics of Rhytidoponera metallica in temperate south‐eastern Australia. Australian Journal of Zoology 51(6), 551–567. [Google Scholar]
- Thomas, M. L. & Elgar, M. A. (2003). Colony size affects division of labour in the ponerine ant Rhytidoponera metallica . Naturwissenschaften 90(2), 88–92. [DOI] [PubMed] [Google Scholar]
- Thomas, M. L. & Framenau, V. W. (2005). Foraging decisions of individual workers vary with colony size in the greenhead ant Rhytidoponera metallica (Formicidae, Ectatomminae). Insectes Sociaux 52(1), 26–30. [Google Scholar]
- Thompson, S. & Schwarz, M. P. (2006). Cooperative nesting and complex female‐biased sex allocation in a tropical allodapine bee. Biological Journal of the Linnean Society 89(2), 355–364. [Google Scholar]
- Tibbetts, E. A. & Reeve, H. K. (2003). Benefits of foundress associations in the paper wasp Polistes dominulus: increased productivity and survival, but no assurance of fitness returns. Behavioral Ecology 14(4), 510–514. [Google Scholar]
- Tierney, S. M. & Schwarz, M. P. (2009). Reproductive hierarchies in the African allodapine bee Allodapula dichroa (Apidae; Xylocopinae) and ancestral forms of sociality. Biological Journal of the Linnean Society 97(3), 520–530. [Google Scholar]
- Tierney, S. M. , Schwarz, M. P. & Adams, M. (1997). Social behaviour in an Australian allodapine bee Exoneura (Brevineura) xanthoclypeata (Hymenoptera: Apidae). Australian Journal of Zoology 45(4), 385–398. [Google Scholar]
- Tierney, S. M. , Schwarz, M. P. , Neville, T. & Schwarz, P. M. (2002). Sociality in the phylogenetically basal allodapine bee genus Macrogalea (Apidae: Xylocopinae): implications for social evolution in the tribe Allodapini. Biological Journal of the Linnean Society 76(2), 211–224. [Google Scholar]
- Tindo, M. , Kenne, M. & Dejean, A. (2008). Advantages of multiple foundress colonies in Belonogaster juncea juncea L.: greater survival and increased productivity. Ecological Entomology 33(2), 293–297. [Google Scholar]
- Tofilski, A. (2002). Influence of age polyethism on longevity of workers in social insects. Behavioral Ecology and Sociobiology 51(3), 234–237. [Google Scholar]
- Tofilski, A. (2006). Influence of caste polyethism on longevity social insect colonies. Journal of Theoretical Biology 238(3), 527–531. [DOI] [PubMed] [Google Scholar]
- Traniello, J. F. A. & Beshers, S. N. (1991). Maximization of foraging efficiency and resource defense by group retrieval in the ant Formica schaufussi . Behavioral Ecology and Sociobiology 29(4), 283–289. [Google Scholar]
- Trumbo, S. T. & Robinson, G. E. (1997). Learning and task interference by corpse‐removal specialists in honey bee colonies. Ethology 103(11), 966–975. [Google Scholar]
- Tschinkel, W. R. (1988). Colony growth and the ontogeny of worker polymorphism in the fire ant, Solenopsis invicta . Behavioral Ecology and Sociobiology 22, 103–115. [Google Scholar]
- Tschinkel, W. R. (1993). Sociometry and sociogenesis of colonies of the fire ant Solenopsis invicta during one annual cycle. Ecological Monographs 63(4), 425–457. [Google Scholar]
- Tschinkel, W. R. (1999). Sociometry and sociogenesis of colony‐level attributes of the Florida harvester ant (Hymenoptera: Formicidae). Annals of the Entomological Society of America 92(1), 80–89. [Google Scholar]
- Tschinkel, W. R. (2006). The Fire Ants. Harvard University Press, Cambridge. [Google Scholar]
- Tschinkel, W. R. (2017). Lifespan, age, size‐specific mortality and dispersion of colonies of the Florida harvester ant, Pogonomyrmex badius . Insectes Sociaux 64(2), 285–296. [Google Scholar]
- Tschinkel, W. R. (2018). Testing the effect of a nest architectural feature in the fire ant, Solenopsis invicta . Myrmecological News 27, 1–5. [Google Scholar]
- Turillazzi, S. , Piccioli, M. T. M. , Hervatin, L. & Pardi, L. (1982). Reproductive capacity of single foundress and associated foundress females of Polistes gallicus (L.) (Hymenoptera Vespidae). Monitore Zoologico Italiano‐Italian Journal of Zoology 16(1), 75–88. [Google Scholar]
- Ulrich, Y. , Saragosti, J. , Tokita, C. K. , Tarnita, C. E. & Kronauer, D. J. C. (2018). Fitness benefits and emergent division of labour at the onset of group living. Nature 560(7720), 635–638. [DOI] [PMC free article] [PubMed] [Google Scholar]
- Viechtbauer, W. (2010). Conducting meta‐analyses in R with the metafor package. Journal of Statistical Software 36(3), 1–48. [Google Scholar]
- Wakano, J. Y. , Nakata, K. & Yamamura, N. (1998). Dynamic model of optimal age polyethism in social insects under stable and fluctuating environments. Journal of Theoretical Biology 193, 153–165. [Google Scholar]
- Ward, P. S. , Brady, S. G. , Fisher, B. L. & Schultz, T. R. (2015). The evolution of myrmicine ants: phylogeny and biogeography of a hyperdiverse ant clade (Hymenoptera: Formicidae). Systematic Entomology 40(1), 61–81. [Google Scholar]
- Waters, J. S. , Holbrook, C. T. , Fewell, J. H. & Harrison, J. F. (2010). Allometric scaling of metabolism, growth, and activity in whole colonies of the seed‐harvester ant Pogonomyrmex californicus . American Naturalist 176(4), 501–510. [DOI] [PubMed] [Google Scholar]
- Wcislo, W. T. , Wille, A. & Orozco, E. (1993). Nesting biology of tropical solitary and social sweat bees, Lasioglossum (Dialictus) figueresi Wcislo and L. (D.) aeneiventre (Friese) (Hymenoptera: Halictidae). Insectes Sociaux 40(1), 21–40. [Google Scholar]
- Webb, M. C., III . (1961). The biology of the bumblebees of a limited area in eastern Nebraska. PhD thesis, University of Nebraska, Lincoln.
- Weidenmuller, A. (2004). The control of nest climate in bumblebee (Bombus terrestris) colonies: interindividual variability and self reinforcement in fanning response. Behavioral Ecology 15(1), 120–128. [Google Scholar]
- Weiss, K. (1965). Über den Zuckerverbrauch und die Beanspruchung der Bienen bei der Wachserzeugung. Zeitschrift für Bienenforschung 8, 106–124. [Google Scholar]
- Welford, B. P. (1962). Note on a method for calculating corrected sums of squares and products. Technometrics 4(3), 419–420. [Google Scholar]
- Wenzel, J. W. & Pickering, J. (1991). Cooperative foraging, productivity, and the central limit theorem. Proceedings of the National Academy of Sciences of the United States of America 88(1), 36–38. [DOI] [PMC free article] [PubMed] [Google Scholar]
- West‐Eberhard, M. J. (1969). The social biology of polistine wasps. Miscellaneous Publications of the Museum of Zoology, University of Michigan 140, 1–101. [Google Scholar]
- Wilson, E. O. (1971). The Insect Societies. Harvard University Press, Cambridge. [Google Scholar]
- Wilson, E. O. (1975). Sociobiology. The New Synthesis. Harvard University Press, Cambridge. [Google Scholar]
- Wilson, E. O. (1980). Caste and division of labor in leaf‐cutter ants (Hymenoptera, Formicidae, Atta). 2. The ergonomic optimization of leaf cutting. Behavioral Ecology and Sociobiology 7(2), 157–165. [Google Scholar]
- Wilson, E. O. (1990). Success and Dominance in Ecosystems: The Case of the Social Insects. Ecology Institute, Oldendorf/Luhe. [Google Scholar]
- Wolf, T. J. & Schmid‐Hempel, P. (1990). On the integration of individual foraging strategies with colony ergonomics in social insects: nectar‐collection in honeybees. Behavioral Ecology and Sociobiology 27(2), 103–111. [Google Scholar]
- Yagi, N. & Hasegawa, E. (2012). A halictid bee with sympatric solitary and eusocial nests offers evidence for Hamilton's rule. Nature Communications 3, 939. [DOI] [PubMed] [Google Scholar]
- Yamauchi, K. , Kinomura, K. & Miyake, S. (1982). Sociobiological studies of the polygynic ant Lasius sakagamii II. Production of colony members. Insectes Sociaux 29(2), 164–174. [Google Scholar]
- Zammit, J. , Hogendoorn, K. & Schwarz, M. P. (2008). Strong constraints to independent nesting in a facultatively social bee: quantifying the effects of enemies‐at‐the‐nest. Insectes Sociaux 55(1), 74–78. [Google Scholar]
Associated Data
This section collects any data citations, data availability statements, or supplementary materials included in this article.
Supplementary Materials
Fig. S1. Full forest plot for the continuous colony size meta‐analysis (CMA).
Fig. S2. Phylogenetic trees used to control for shared ancestry in the continuous meta‐analysis and the discrete meta‐analysis.
Fig. S3. Full forest plot for the discrete colony size meta‐analysis (DMA).
Fig. S4. Full forest plot for the discrete colony size meta‐analysis (DMA), including broodless colonies.
Table S1. Details of the data sets used in the continuous colony size meta‐analysis (CMA).
Table S2. Details of the data sets used in the discrete colony size meta‐analysis (DMA).
Table S3. Multivariate meta‐analysis model results for the continuous colony size meta‐analysis (CMA).
Table S4. Multivariate meta‐analysis model results for the continuous colony size meta‐analysis (CMA) with taxonomic and output moderators.
Table S5. Multivariate meta‐analysis model results for the offspring mass data sets in the continuous colony size meta‐analysis (CMA).
Table S6. Multivariate meta‐analysis model results for the complete‐output data sets in the continuous colony size meta‐analysis (CMA).
Table S7. Multivariate meta‐analysis model results for the large‐colony taxa in the continuous colony size meta‐analysis (CMA).
Table S8. Multivariate meta‐analysis model results for the large‐colony taxa in the continuous colony size meta‐analysis (CMA)with taxonomic and output moderators.
Table S9. Multivariate meta‐analysis model results for the discrete colony size meta‐analysis (DMA).
Table S10. Multivariate meta‐analysis model results for the discrete colony size meta‐analysis (DMA) with taxonomic moderators.
Table S11. Multivariate meta‐analysis model results for the discrete colony size meta‐analysis (DMA), including broodless nests in studies that reported them.