Abstract
Objective:
Cone beam CT (CBCT) in preclinical small animal irradiation platforms provides essential information for image guidance and radiation dose calculation for experiment planning. This project developed a photon-counting detector (PCD)-based multi(3)-energy (ME-)CBCT on a small animal irradiator to improve accuracy of material differentiation and hence dose calculation, and compared to conventional flat panel detector (FPD)-based CBCT.
Approach:
We constructed a mechanical structure to mount a PCD to an existing preclinical irradiator platform and built a data acquisition pipeline to acquire x-ray projection data with a 100 kVp x-ray beam using three different energy thresholds in a single gantry rotation. We implemented an energy threshold optimization scheme to determine optimal thresholds to balance signal-to-noise ratios (SNRs) among energy channels. Pixel-based detector response calibration was performed to remove ring artifacts in reconstructed CBCT images. Feldkamp-Davis-Kress (FDK) method was employed to reconstruct CBCT images and a total-variance regularization-based optimization model was used to decompose CBCT images into bone and water material images. We compared dose calculation results using PCD-based ME-CBCT with that of FPD-based CBCT.
Main Results:
The optimal nominal energy thresholds were determined as 26, 56, and 90 keV, under which SNRs in a selected region-of-interest in water region were 6.11, 5.91 and 5.93 in the three energy channels, respectively. Comparing with dose calculation results using FPD-based CBCT, using PCD-based ME-CBCT reduced mean relative error from 49.5% to 16.4% in bone regions and from 7.5% to 6.9% in soft tissue regions.
Significance:
PCD-based ME-CBCT is beneficial in improving radiation dose calculation accuracy in experiment planning of preclinical small animal irradiation researches.
1. Introduction
Preclinical small animal irradiation using dedicated image-guided small animal irradiators plays a critical role in advancing cancer radiation therapy (Verhaegen et al., 2011). In these irradiation hardware platforms, cone beam CT (CBCT) is often used as an image guidance tool to precisely guide the delivery of a radiation beam to a targeted area with sub-millimeter geometric accuracy (Clarkson et al., 2011). The CBCT images also provide critical geometry and material property information needed for radiation dose calculation, a critical component in the design of an experimental plan to ensure dosimetric accuracy.
Different from cancer radiotherapy that often employs a mega-voltage x-ray beam, preclinical radiation experiments use a kilo-voltage (kV) x-ray beam because of the small subject size. In this energy range, dose calculation problem is more challenging. While Monte Carlo (MC) simulation can reliably perform accurate dose calculations by faithful modeling the underlying radiation transport physics and simulation geometry (Alaei et al., 2000), the accuracy is built on the foundation of accurate information of material type and density to describe the environment of radiation transport. Due to the sharp increase of x-ray attenuation coefficient in the photoelectric interaction in the kV energy range, the calculated radiation dose distribution is sensitive to the material and density distribution information. Incorrectly assigning tissue type, such as assigning a tissue voxel to a bone material at the bone-tissue interface, can yield 3 times dose calculation error (Montanari et al., 2014; Ding et al., 2010). Therefore, it is of central importance to accurately derive material and density distribution information to support the dose calculation task.
The current standard approach of deriving the material information relies on CBCT images, which however, encounters the challenge of a degeneracy problem, as different combinations of material type and density can yield the same CT number. In contrast, employing the energy dimension of CBCT (Granton et al., 2008; Bazalova et al., 2008) is known to be an effective way to differentiate materials and derive the needed material properties. Our group has previously developed multi-energy CBCT imaging function on a SmART preclinical radiation platform (Precision X-ray Inc., North Branford, CT, USA) (Huang et al., 2021). Because that study was restricted to using the existing flat-panel based CBCT hardware system, a multiple-scan approach (3 scans with different kVps) was employed. While the multi-energy CBCT was found to improve dose calculation accuracy, the three sequential CBCT scans inevitably increased the scan time, unfavorable for preclinical small animal radiation experiments due to increased anesthesia use and hence the risks to the animal subjects. The prolonged scan time also increases chances of animal motion, which could potentially cause inconsistency between image contents at different scans and impede the accuracy of material decomposition calculations. To overcome this limitation, we recently installed a photon-counting detector (PCD) on our small animal irradiator and achieved multi(3)-energy (ME-)CBCT in only one gantry rotation.
In this paper, we will report our developments on this PCD-based CBCT and demonstrate its effectiveness in terms of improving dose calculation accuracy. To our knowledge, this is the first time that a PCD-based CBCT was developed on a preclinical small animal irradiation platform. We will describe our experimental setups including the installation of the PCD to the CBCT gantry and acquisition of multi-energy projection data. We will present the method to decide energy thresholds for the three energy channels and to calibrate detector pixel responses to remove image ring artifacts. We will also report our preliminary study using the multi-energy CBCT images for material decomposition and assessing the gains in terms of improved accuracy of MC-based radiation dose calculations.
2. Methods
2.1. Experimental setup
The SmART preclinical radiation platform (Precision X-ray Inc., North Branford, CT, USA) shown in Figure 1 includes a rotating C-arm gantry and an animal bed enclosed in a self-shielded cabinet. The gantry can perform CBCT data acquisition using a gantry-mounted x-ray tube (Comet MXR-225/26, JME Ltd, Suffolk, UK) and an amorphous silicon flat-panel detector (FPD) (XRD 0820 AN3-ES, Perkin-Elmer, Wiesbaden, Germany). The x-ray tube can emit an x-ray beam with energy up to 225 kVp, with low kVp beams for CBCT imaging and high kVp ones for radiation experiments.
Figure 1:
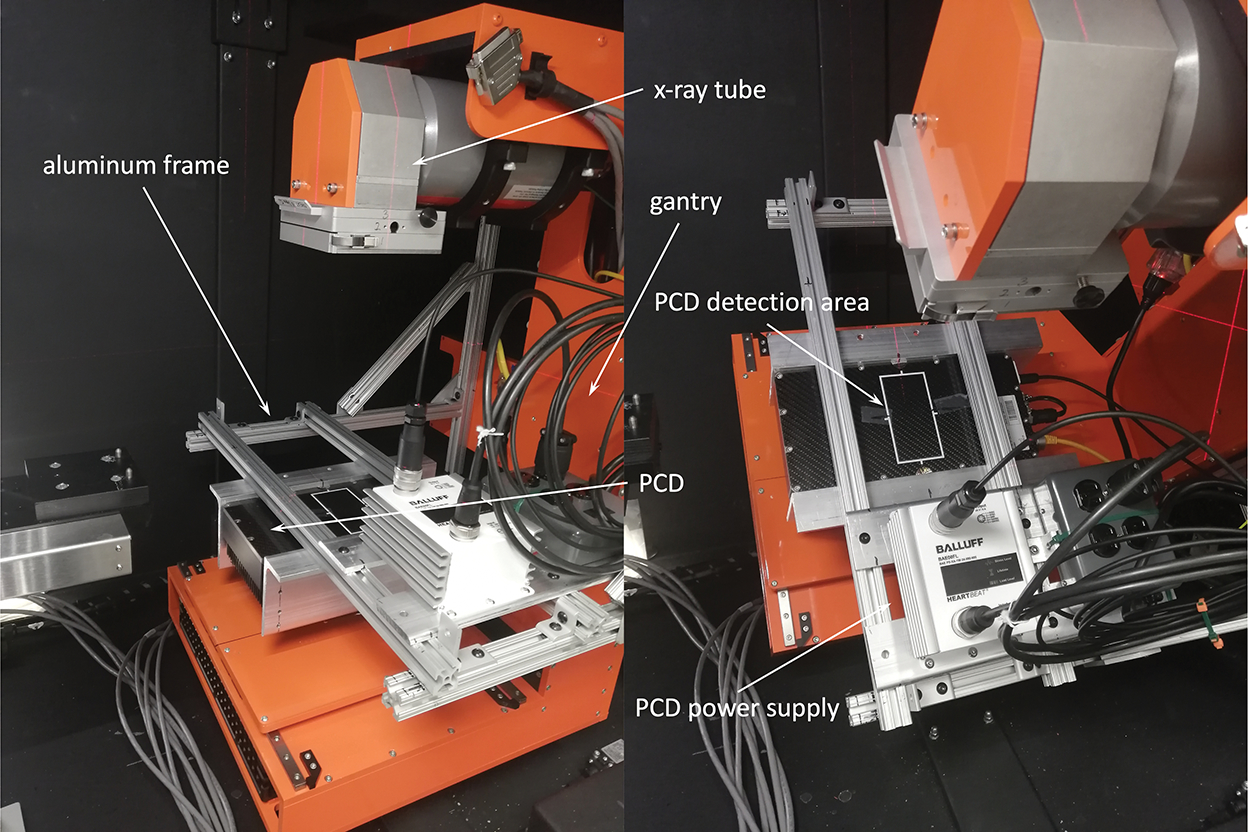
Installation of the PCD on the SmART preclinical radiation platform. Photos showing gantry at 0 degree (left) and 45 degree (right).
We used a XC-Thor CdTe PCD (Direct Conversion AB, Sweden) that has a detection area of 51.2 × 100.0 mm2 with a 100 μm pixel size. To mount the PCD on the gantry, we constructed an aluminum bracket frame using aluminum extrusion rails and attached it to the gantry. The PCD was mounted on the two parallel bars of this frame opposite to the x-ray tube (Figure 1). The long side of the PCD was along the lateral direction. The source to rotation axis distance SAD was 30.5 cm and source to detector distance SDD was 44.2 cm.
Charge sharing and pulse pile-up are two major issues in degrading the spatial and energy resolution of the photon-counting detector. To correct the charge sharing, the PCD was operated under the detector anti-coincidence mode for acquiring all the experimental data (Ullberg et al., 2013). A pixel-by-pixel calibration, as elaborated in subsection 2.1.2, was performed to calibrate detector response and correct counts for the pile-up issue.
The PCD is able to output the number of photon counts for each pixel above a user-specified energy threshold T for a time interval Δt. The image for an energy channel with lower and upper energy bounds Elow and Ehigh can be obtained by taking the difference between images acquired with T = Elow and T = Ehigh.
In this study, we set the x-ray tube to emit an 100 kVp x-ray beam with a filter of 0.3 mm Cu. A CBCT scan acquired projection data in a full rotation at a rotation speed of 1 rotation/min. The data acquisition of the PCD was controlled via the Application Programming Interface provided by the vendor. Specifically, we triggered the PCD to acquire projection data at a frequency of 30 frame/sec and each data frame receive photons for Δt = 20 msec. The remaining ~ 13 msec time interval was allocated for data processing and readout. The energy threshold T was set to sequentially cycle through three energy thresholds Ti, i = 1, 2, 3, whose values will be determined in the next subsection. The projection angle of each projection was read out from the encoder of the gantry. With this setting, we acquired 600 projection images within 360 degrees for each energy threshold.
2.1.1. Selection of energy thresholds
In this study, we determined the thresholds by balancing signal to noise ratio (SNR) in log-transformed projection images of different energy channels. Since the log-transformed data will be used in subsequent CBCT reconstruction, its SNR will be directly related to that of the reconstructed images.
The lowest energy threshold T1 was set to be 26 keV to avoid electronic noises (Flohr et al., 2020; Danielsson et al., 2021). This number was chosen primarily based on the x-ray spectrum. For the beam used in this study (100 kVp with 0.3 mm Cu filter), the number of photons below 26 keV accounts for ~ 0.38% of the total number of photons. We acquired air projection images at 0 degree gantry angle under 3 mA for Nt = 42 candidate thresholds Tl, l = 1, ..., Nt, ranged from 28 to 110 keV, with increment of 2 keV. Note that the threshold values were nominal values input to the PCD. Therefore our search range went beyond the 100 kVp. At every threshold Tl, we acquired Nf = 200 projections and denote the count image , where x is the index of pixel position, k = 1, 2, ..., Nf. For a given threshold combination Ti, i = 1, 2, 3, with T2 and T3 selected among possible Tl, l = 1, ..., Nt values, the count images at these three energy channels CH1 = (T1, T2] keV, CH2 = (T2, T3] keV and CH3 = (T3, 100] keV, were for i = 1, 2 and . Note that we wrote the upper bound 100 keV in the third energy channel because of the 100 kVp x-ray beam, yet in practice this channel represents photon counts with energy above the threshold T3.
Following the same procedure, we acquired projection images of a CT calibration phantom, denoted as Ci,k(x) for the energy channel i and frame k. We then computed the log-transformed projection image , where is the averaged counts of the air projection images over all frames. Using the repeatedly acquired 200 projections, we calculated the mean and standard deviation of gi,k(x), denoted as and , respectively. Finally, the SNR at coordinate x was calculated as
| (1) |
We averaged over 100 randomly selected pixels inside the phantom region on the projection image, and denoted the averaged SNR as . It was our objective to find proper thresholds such that approximately equal among all energy channels i = 1, 2, 3. As such, we considered the metric
| (2) |
Apparently γ ≥ 1. The case γ = 1 is desired, as it indicates that the SNRs in all channels are identical. Hence, we enumerated all possible combinations of thresholds T2 and T3, and found out the combination that minimized γ (closest to the desired case) as the optimal thresholds for subsequent studies.
2.1.2. Detector calibration and count statistics
We acquired air scan under the threshold sweeping mode as in the actual CBCT scan using the energy threshold values determined in the previous step. We repeated this for different levels of x-ray tube currents I in the range of [0, 3.4] mA. Let us denote the count image at energy threshold Ti, i = 1, 2, 3 with the jth tube current Ij, j = 1, 2, … as . k = 1, 2, …, Nf is the index of repeated acquisition for Nf = 200 times. The two following studies were performed with the acquired data.
First, PCD pixels have different responses to x-ray photons. Severe ring artifacts would occur in the reconstructed images without proper detector calibrations. For this purpose, we generated a pixel-wise calibration model. We took the average of over different acquisitions to reduce noise, yielding . With these count images, we computed count images at the three energy channels by taking the difference between images with subsequent energy thresholds. Additionally, we considered dark images with zero counts for all pixels being the case in the absence of x-ray (I0 = 0).
With the count images acquired for each energy channel i = 1, 2, 3 and tube current levels j = 0, 1, 2, ..., for each pixel x and energy channel, we fit the tube current as a function of count using the data Ij and in a polynomial form. The coefficient of determination R2 was used to evaluate the goodness of the fitting model. In the fitting procedure, we set the polynomial order to one initially. If the resulting R2 did not meet the criterion , we repeated the fitting process with the polynomial of one order higher. This was continued, until . It was not preferable to overfit the data using polynomials with high orders. Hence, we empirically set the maximal order as 4-th order. For those pixels whose at the highest fitting order, they were considered ‘dead pixels’.
Second, PCD readout of photon counts is expected to follow Poisson statistics. We studied the statistic properties of counts, which is fundamental in understanding the trade-off between image noise and radiation dose. As such, we computed the means and variances of photon counts at a randomly selected pixel and two regions of interest (ROIs). The mean values and variations were computed using the middle 180 frames out of the Nf = 200 frames to avoid the transition period for the detector switching between thresholds. Each of the two ROIs were a square region with 5 × 5 pixels. Additionally, Kolmogorov-Smirnov test was performed for the selected pixel and two ROIs at each mA level with the null hypothesis that detected photon counts follow Poisson statistics.
2.2. CBCT reconstruction and material decomposition
2.2.1. Projection data processing and CBCT reconstruction
For a CBCT data acquisition, using the pixel-wise calibration model established in the previous step, the raw count images of each energy channel i was converted to corresponding image of current , i = 1, ..., 3, where θ denotes projection angle. In this step, nearest-neighbor interpolation was applied to handle those ‘dead pixels’. After that, for each projection at angle θ, based on the estimated phantom size, we first identified a region that was not blocked by the phantom by forward projecting the estimated phantom region to the PCD region at this angle. We then selected a rectangle in this unblocked region, and computed the averaged pixel value in this rectangle as the air norm I0,θ. Compared to using the nominal tube current in the scan as the air norm, this approach considered the tube current fluctuation among projections during the CBCT data acquisition. We remark that for those projection angles that the whole PCD region was blocked by the phantom, this method would fail and the air norm should be estimated by interpolating between air norms at unblocked projections. However, in this work, our phantoms were small enough, and the air norm I0,θ was computed directly without interpolation.
With the and air norm I0,θ estimated, we computed the projection image . Finally, CBCT image of each energy channel fi, i = 1, ..., 3 were reconstructed using the corresponding projection data and the GPU-based Feldkamp-Davis-Kress (FDK) reconstruction code (Feldkamp et al., 1984; Jia et al., 2010).
2.2.2. Material decomposition
Let us denote f = (f1, f2, f3)⊤ as the reconstructed images of the three energy channels. They represent effective x-ray attenuation in each channel, hence in the unit of cm−1. We considered a two-material decomposition model that each image voxel can be expressed as a linear combination of two basis materials, water and bone. Specifically, f = Am, where m = (mw, mb)⊤ is a two-component image with the two components representing mass image of the two basis materials, and is the system matrix. The two columns of the matrix A are x-ray attenuation coefficients of corresponding materials in the three energy channels at unit mass. In our study, we scanned a small animal CT insert phantom with known material information. X-ray attenuation values of a water and a bone insert in reconstructed images were extracted and normalized by the corresponding material density. The result was used to compose the A matrix.
It is straightforward to solve the decomposition problem by seeking the least square solution of the equation f = Am, namely m = (A⊤A)−1A⊤f. Yet this would inevitably lead to amplified noise in the resulting decomposed images due to a typically large condition number of the matrix A⊤A (Niu et al., 2014). To suppress noise, we performed material decomposition by solving an optimization problem
| (3) |
where the first term of the objective function ensured fidelity of the solution to the CBCT images, and the second one was a regularization term. The regularization term was introduced to reduce noise while preserving edges in the solution. We selected a total-variation form for this regularization term for simplicity. λ is a weighting factor controling the releative importance of the two terms. Note that the operator ∇ was applied to the spatial direction only. This model was solved using the Alternating Direction Method of Multipliers (ADMM) (Boyd et al., 2011). The algorithm is listed in Appendix A.
2.3. Evaluation
We utilized two phantoms (SmART Scientific Solutions B.V., Maastricht, Netherlands) to calibrate the PCD system and the decomposition system matrix, as well as to evaluate the PCD CBCT imaging procedure and image quality. The first one was a preclinical CT calibration insert phantom that contained 10 inserts of different materials plugged into a 30 mm diameter background slab representing water. The second phantom was a plastinated mouse specimen. Due to the small size of the PCD (~5.0 cm along the rotation axis), the longitudinal coverage was ~ 3 cm. Hence, only mouse head was covered in CBCT scans.
After the CBCT images were reconstructed, in addition to visually evaluate image quality, for the CT insert phantom, we computed mean x-ray linear attenuation coefficient μexp of each insert at each energy channel by averaging the image pixel values within the insert region. We compared this with the calculated value μcomp, which was computed as the x-ray linear attenuation coefficients of the known rod material weighted by the x-ray spectrum.
For material decomposition, we picked two regions of interest with water and bone materials (indicated by circles in Figure 6) and used the average reconstructed image intensity values normalized by the known material density to construct the material decomposition system matrix A. We then decomposed the CBCT images of both phantoms into the two-material images using the model in Eq. (3).
Figure 6:
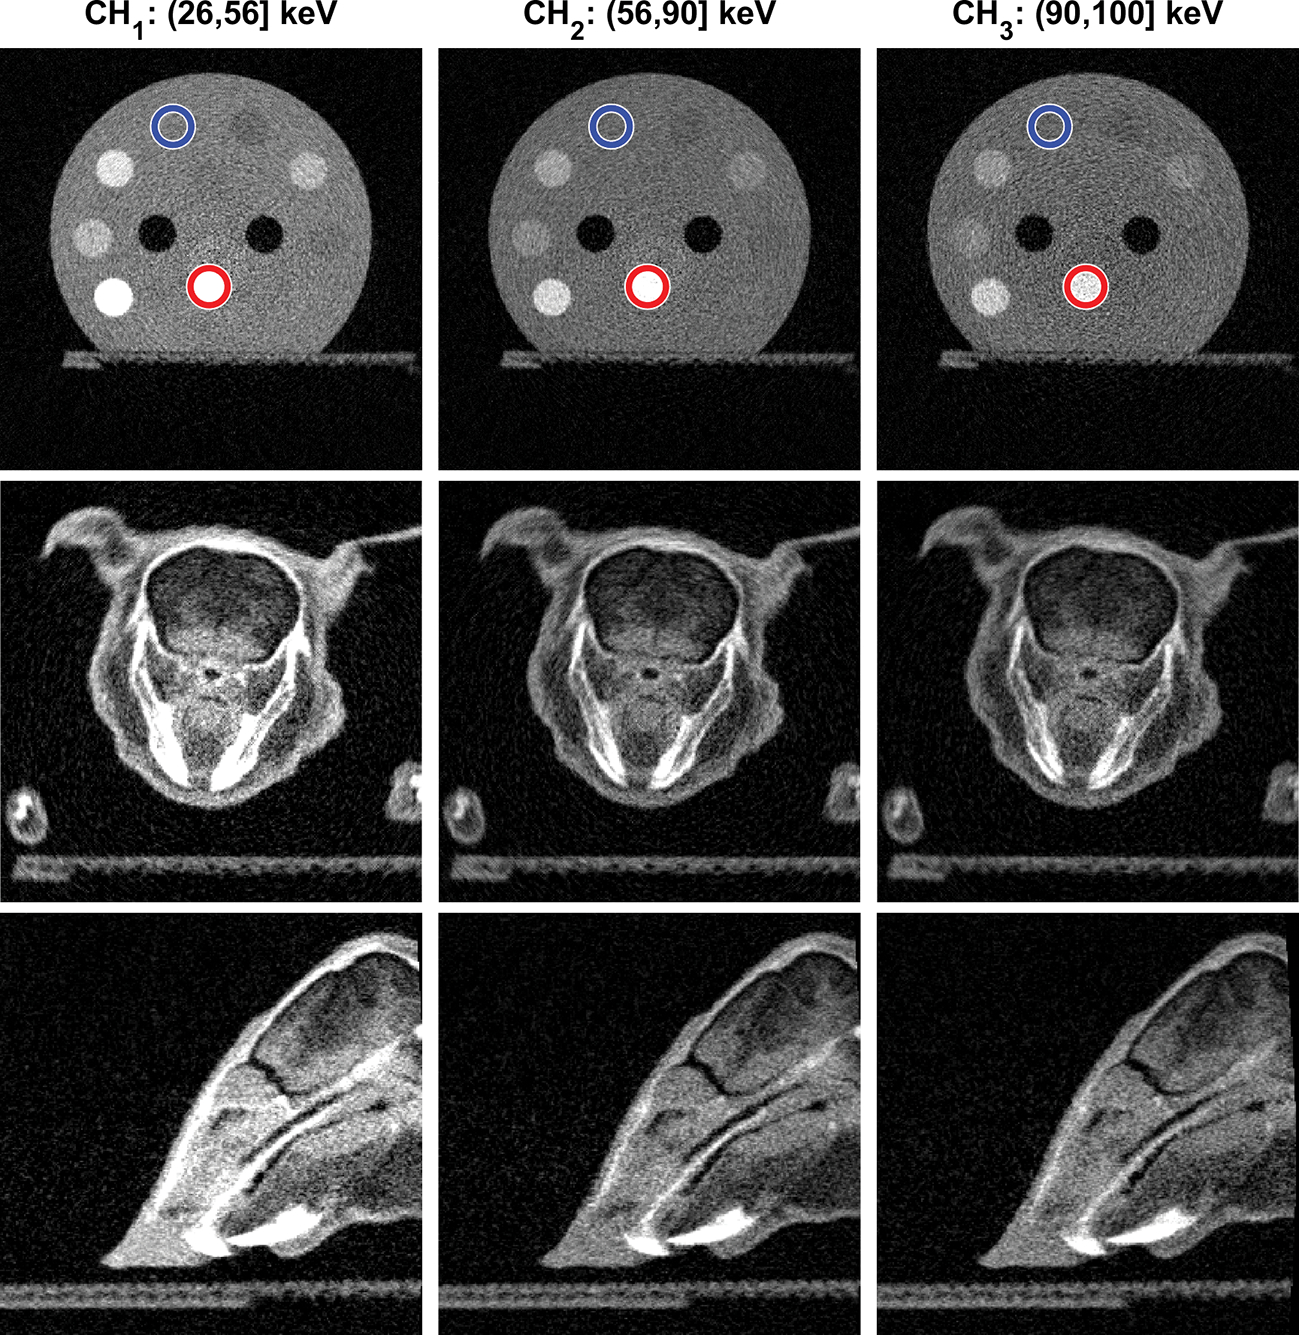
Top row: CBCT images of the CT calibration insert phantom in the three energy channels. Blue and red circles indicate the regions of water and bone basis materials used in material decomposition. Middle and Bottom rows: CBCT images of the plastinated mouse phantom on transverse and sagittal planes respectively. Display window [0,0.5] cm−1 for all images.
Since the motivation of developing this PCD-based ME-CBCT on the small animal irradiation platform was to improve radiation dose calculation accuracy in pre-clinical radiation studies, we investigated gain of dose calculation accuracy under MC simulations. As such, we computed dose distribution of a 5 × 5 cm2 225 kVp x-ray beam vertically impinged to the CT calibration phantom using our in-house developed GPU-based MC tool for kV photon transport (Jia et al., 2012). We used the CT calibration phantom because of the known ground truth material information provided by the vendor. Using the information, the MC simulation yielded the ground truth dose distribution. Additionally, we conducted two more MC dose calculations with different settings. The first one used the phantom defined by deriving material type and density based on CT number in the 40 kVp CBCT image acquired with the FPD available in the irradiation platform (with PCD not in front of it). This is the current standard approach to define a numerical phantom for MC simulation from a CBCT image. The material type needed by MC simulation was determined as one of four possible types (air, tissue, lung, and bone) by comparing the CT number with thresholds, and the density was determined by a mapping consisting of two piece-wise linear functions between CT number and density (Schneider et al., 2000). As for the second simulation, we defined the phantom material and density based on the results derived from material decomposition using PCD-based CBCT images. Specifically, material composition was derived based on the known material compositions of the base materials and the decomposition vector m. Density was calculated as mw + mb, because components of m represent the density of two base materials. We compared the dose calculation results in these two settings with the ground truth one.
3. Results
3.1. Energy thresholds
Figure 2 shows the SNR ratios γ computed with all the combinations of thresholds (T2, T3). Since T3 > T2, the image only exist in the lower right triangular region. As can be observed from this figure, the SNR ratio was relatively high, when two of the three energy thresholds were close to each other, e.g. when T2 ~ 26 keV or T2 ~ T3. In these cases, one of the energy channels was very narrow and the low number of photons in this channel caused amplified noise and substantially reduced SNR. The optimized thresholds were selected, when this ratio was minimized among all the combinations. The smallest SNR ratio was γ = 1.048, when the two energy thresholds were T2 = 56 keV and T3 = 90 keV. The corresponding SNRs were 7.067, 7.316 and 6.982 for the three energy channels, respectively. In the rest of this study, we used these energy thresholds for ME-CBCT imaging, and hence the corresponding energy channels of CH1 for 26–56 keV, CH2 for 56–90 keV, and CH3 for above 90 keV.
Figure 2:
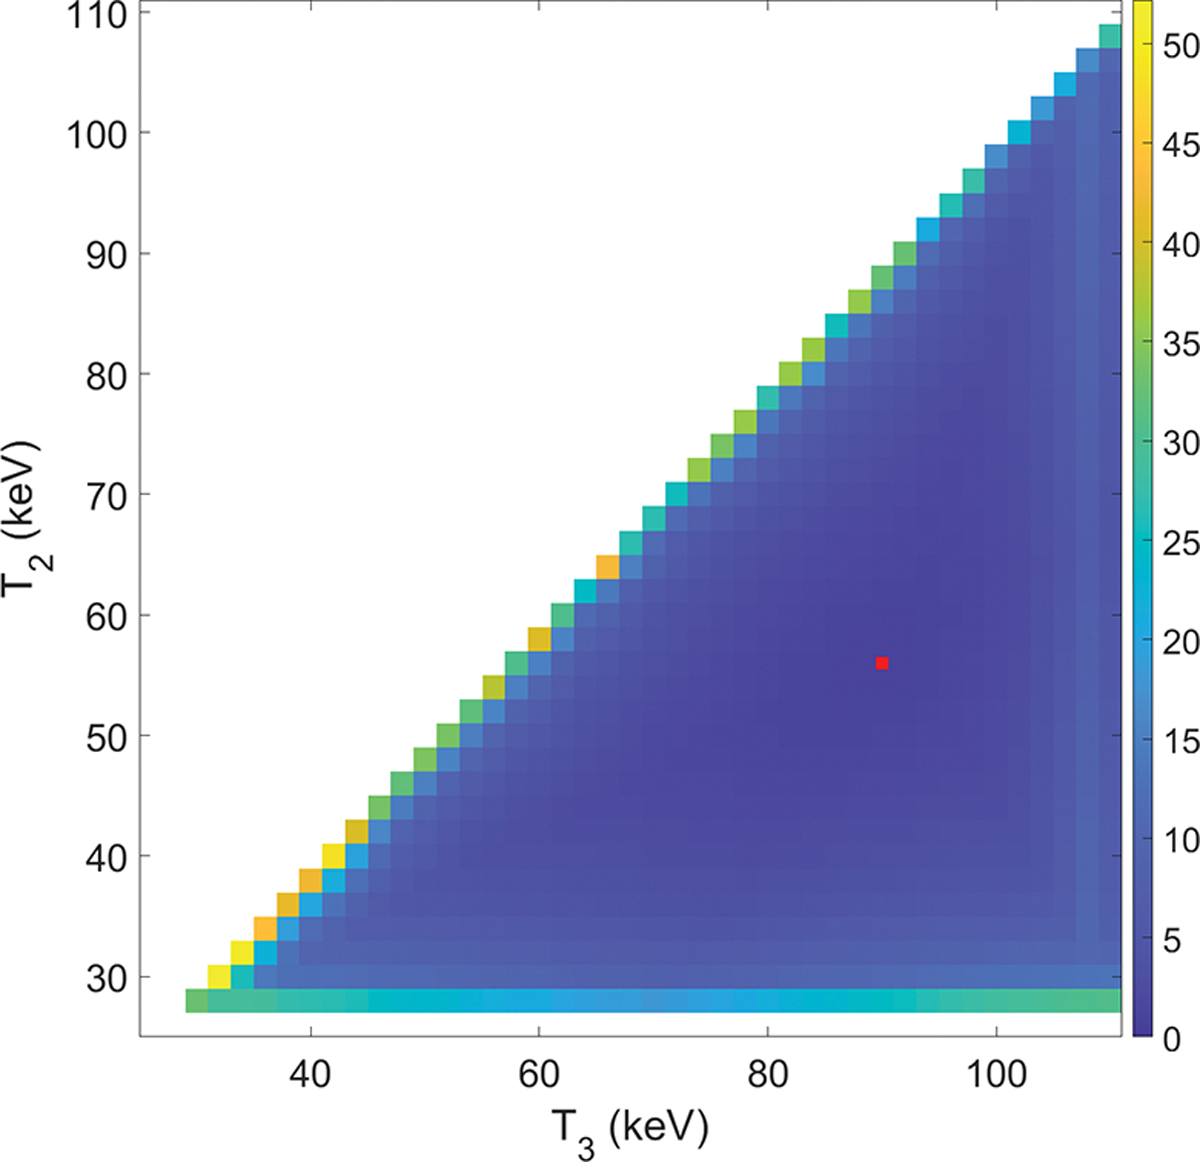
SNR ratios γ as a function of (T2, T3) combinations; red point indicates the location of the minimum SNR ratio.
3.2. Detector calibration and count statistics
The left subfigure of Figure 3 presents fitting functions of three energy channels for a representative pixel of the detector. The channel CH1 used second order polynomial fitting, whereas the other two channels used third order fittings. For the same mA, a higher energy channel had less number of counts. This figure shows the number counts without an object. Because the x-ray attenuation coefficients generally reduces with energy, a less number of photons is needed for a higher energy channel to maintain the same SNR in the presence of an object. The right subfigure of Figure 3 presents histograms of R2 values for the three energy channels. The horizontal scale covered a very small interval close to unity, indicating the good quality of fitting.
Figure 3:
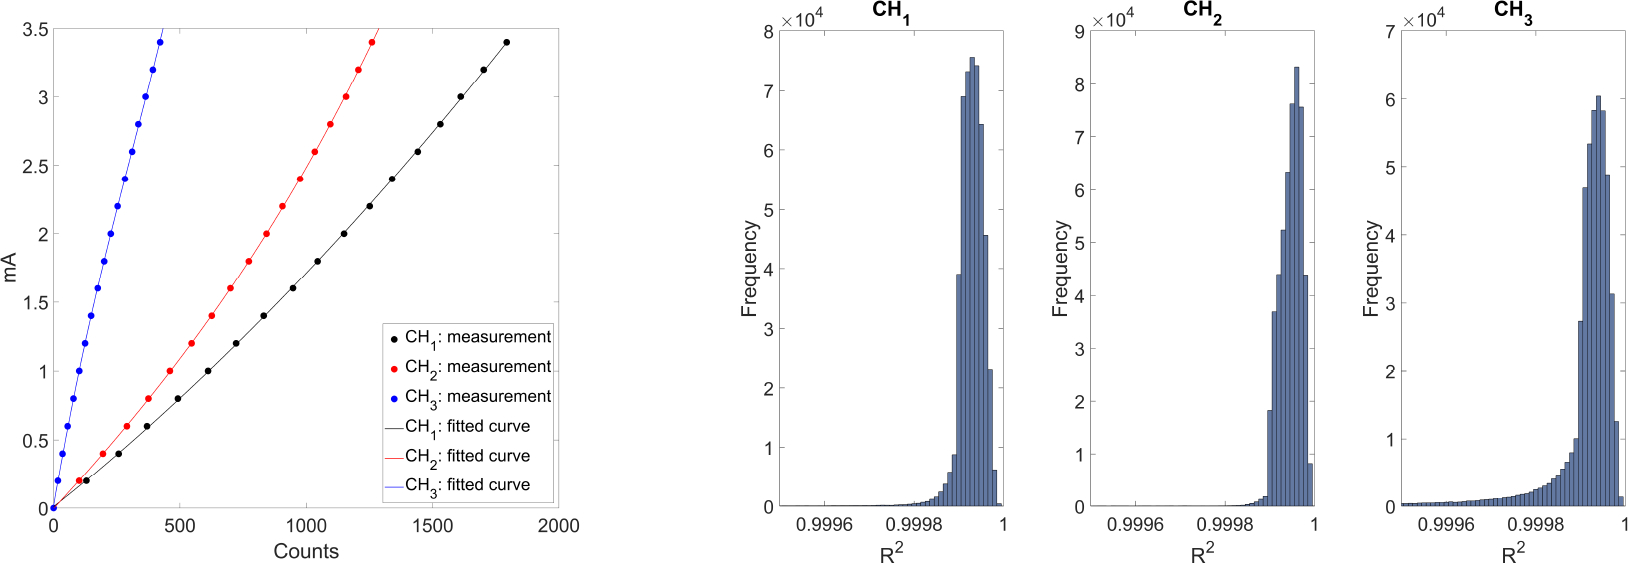
Left: Detector calibration fitting for one selected pixel in the three energy channels. Right: histograms of R2 for the three energy channels.
To demonstrate the impact of this detector calibration step, we present in Figure 4 one projection image of the CT calibration phantom, and the resulting reconstructed CBCT image. Without calibration, we clearly observed different panels that were assembled to form the entire detector, as well as strips around the panels. The variation of detector pixel responses caused severe ring artifacts in the reconstructed CBCT image. After the detector calibration, the artifacts in the project image and reconstructed CBCT images were largely removed.
Figure 4:
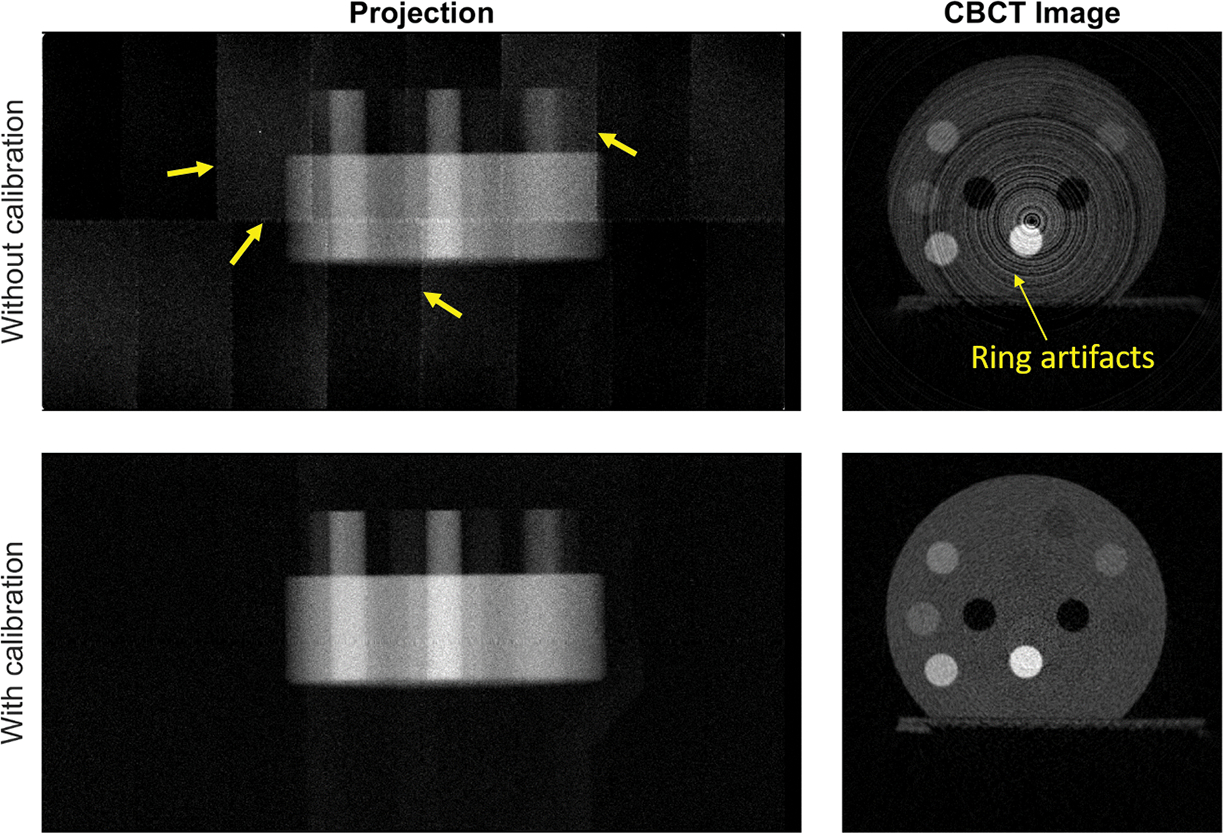
One projection image at θ = 0 degree (left) and an axial cross section of reconstructed CBCT images of energy channel CH1 (right) with and without detector calibration. Arrows indicate artifacts. Display window of CBCT: [0, 1.0] cm−1.
The relationship between means and variances of photon counts for a randomly selected pixel and two ROIs is presented in Figure 5. Each dot represent measurements acquired at a tube current level. Generally, the results showed that the variance and mean value approximately equal, a typical behavior for Poisson statistics. Kolmogorov-Smirnov test was performed for the selected pixel and two ROIs at each mA level. In all cases, the p values ranged in [0.1637, 0.9986]. We considered the threshold of p* = 0.01 as the level of significance to reject the null hypothesis. The fact that p > 0.01 in all cases indicated that we cannot reject the null hypothesis that the detected photon counts follow Poisson statistics. The last subfigure of Figure 5 presents the cumulative histogram of measured photon counts for a ROI at a mA level, as compared to the theoretical cumulative distribution function of Poisson distribution. The two curves were found to be in good agreement.
Figure 5:
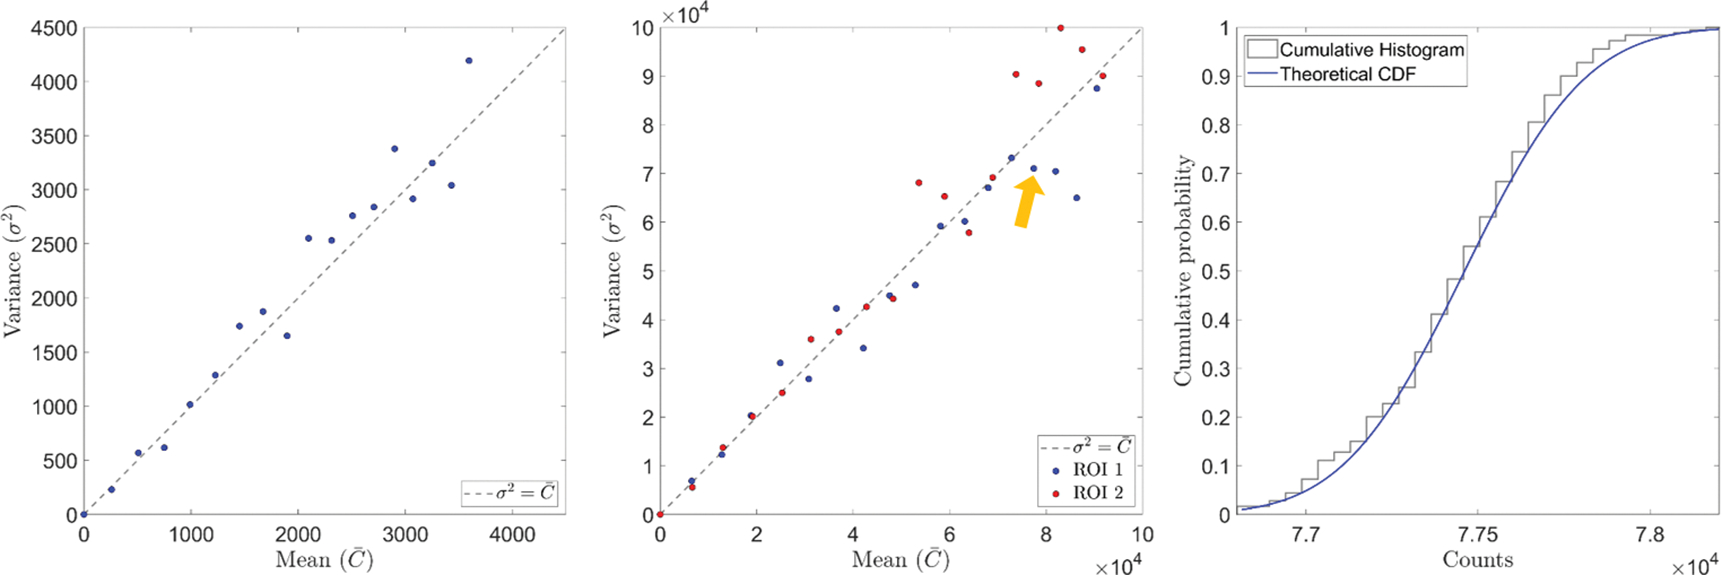
Comparison of mean and variance of photon counts in a randomly selected pixel (left) and two ROIs (middle). Right: cumulative histogram and theoretical cumulative distribution function of Poisson distribution of a selected point indicated by the yellow arrow in the middle figure.
3.3. CBCT images
The first row of Figure 6 presents CBCT images of the CT calibration insert phantom in the three energy channels. The SNRs in a selected ROI in the background material (water) region were 6.11, 5.91 and 5.93 in the three energy channels respectively. The approximately equal SNRs among energy channels indicated effectiveness of our energy threshold selection method. We observed reduced image contrasts with increasing photon energies. Compared to images shown in our previous study using FPD-based CBCT (Huang et al., 2021), we did not observe beam hardening artifacts in these images because of reduced energy range of each channel, demonstrating one of the advantages of PCD-based CBCT.
The second and third row of Figure 6 shows the CBCT images of the plastinated mouse specimen in the three energy channels. Due to the relatively small size of the PCD along the gantry axis, only the mouse head was covered by the imaging field of view. Again, we observed higher object contrast in the images of the lower energy channel.
Figure 7 compares the x-ray linear attenuation coefficients derived from the CT insert phantom images μexp with those computed values μcomp. The three curves (CH1,CH2 and CH3) correspond to three energy channels and different dots are for different inserts of the phantom. These curves are generally along the diagonal line. We would like to point out that this plot is expected to show the general agreement between μexp and μcomp, but not as a means to quantitatively demonstrate accuracy of reconstruction results. For polychromatic x-ray CT, the reconstructed attenuation coefficient value is expected to be close, but may not identical to the attenuation coefficients weighted by the spectrum. For comparison, we plotted the linear attenuation coefficient curve for the same phantom scanned with a FPD-based CBCT under 40 kVp (Huang et al., 2021). The measured attenuation coefficients from FPD-based CBCT deviated from computed values much larger than those of PCD-based MECBCT.
Figure 7:
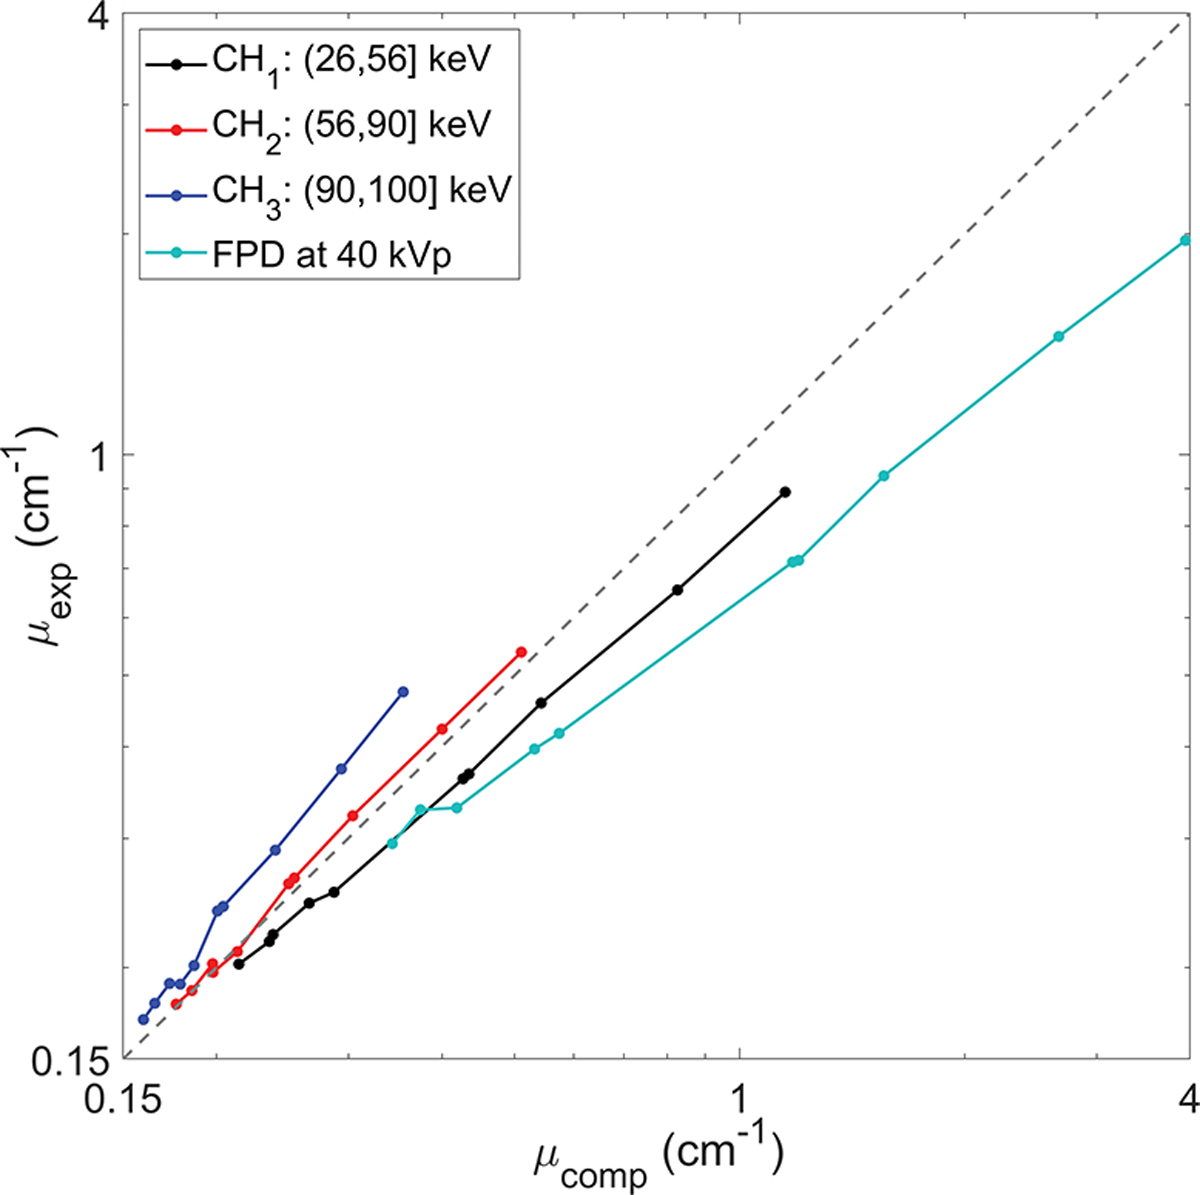
Comparisons of linear attenuation coefficients abstracted from ME-CBCT images and FPD based CBCT image with computed values. The gray dot-line along diagonal indicates μexp = μcomp.
3.4. Material decomposition
To perform the material decomposition, we selected the solid water (4-th insert) and bone (9-th insert) as basis materials (Figure 8). The obtained mass attenuation coefficients of the two basis materials in the three energy channels were [0.2399, 0.1983, 0.1864] cm2/g and [0.4887, 0.2956, 0.2610] cm2/g.
Figure 8:
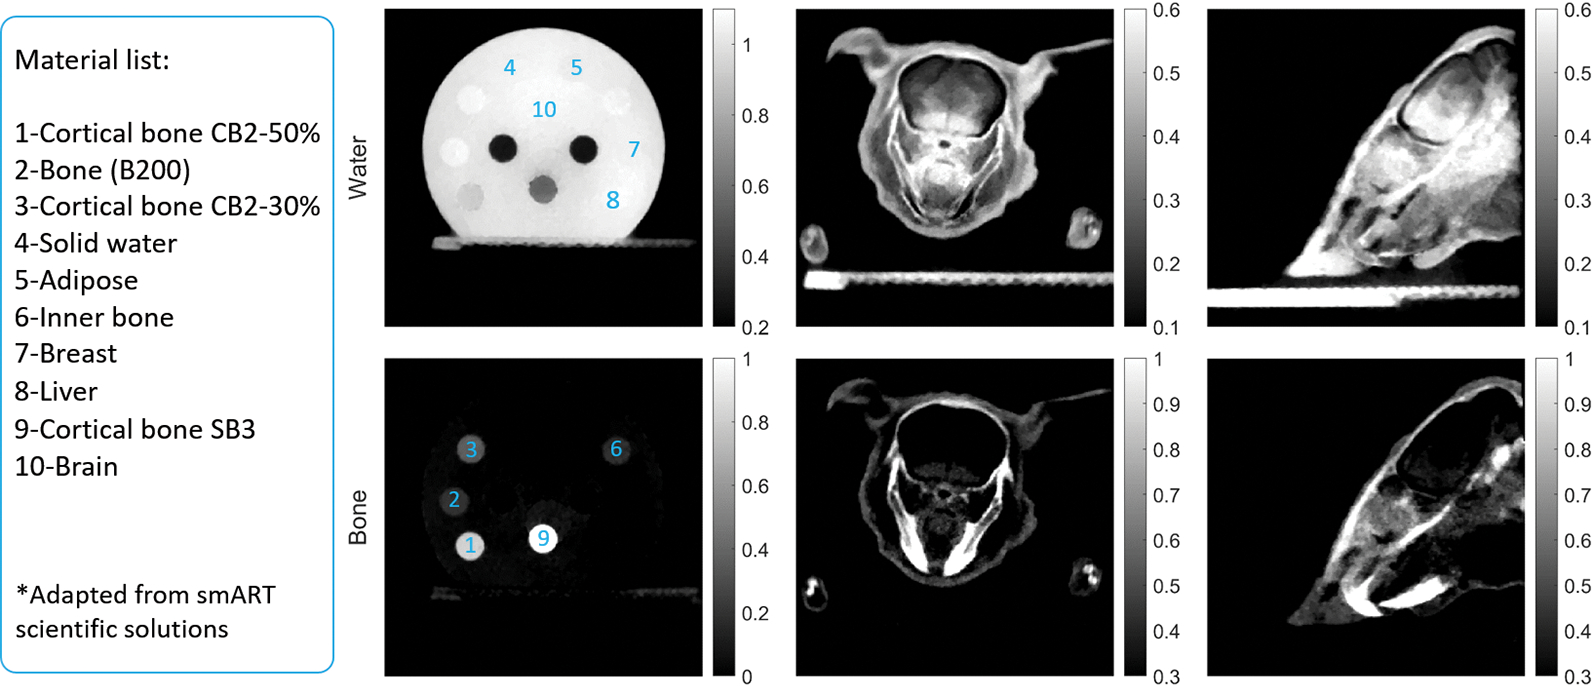
Solid water (top) and bone (bottom) maps of the CT calibration phantom (second column) and the plastinated mouse phantom (third and fourth columns).
Figure 8 presents the material images of water and bone of the two phantoms. The two basis materials were differentiated clearly in the material images. Note that the animal skin also appeared in the bone image. The manufacture process of the plastinated mouse caused accumulation of polymer materials at the skin, which appeared as bone-like materials under x-ray imaging.
Quantitatively, the decomposition accuracy is affected by the choice of λ in Eq. (3). As the primary objective of PCD-based ME-CBCT and material decomposition is to improve dose calculation accuracy, we optimized this parameter for the best accuracy of effective atomic number Zeff, as this quantity closely related to dose calculation results. Figure 9 shows the Zeff in the water and bone basis materials as a function of λ. Note that the trends of Zeff of water and bone are different, and they reach the minimum deviation to their own ground truth at different λ values. We selected λ = 250 that minimized the error in water, because it is the major material in animal subjects. Under this value, the mole percentages of decomposed elements in the water and bone basis are listed in Table 1 and compared with ground truth.
Figure 9:
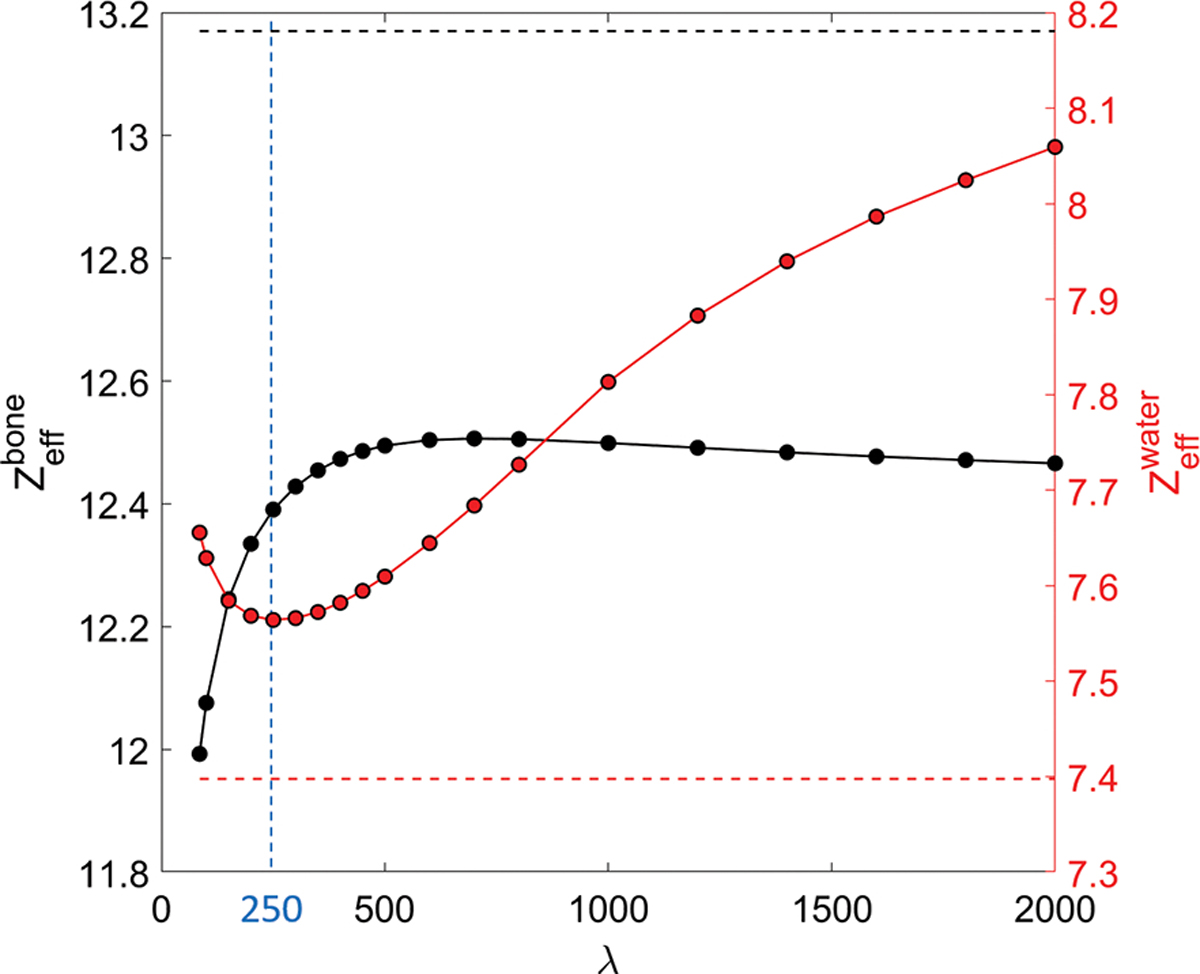
Zeff as a function of the penalty parameter λ. Horizontal dash lines are the ground truth. Vertical line indicates the selected λ value of 250.
Table 1:
Zeff and mole percentage of decomposed elements in the water and bone basis. W: water insert; B: bone insert; GT: ground truth; PCD: PCD-based MECBCT model.
| Zeff | H[%] | C[%] | N[%] | O[%] | Cl[%] | Ca[%] | ||
|---|---|---|---|---|---|---|---|---|
|
| ||||||||
| W | GT | 7.40 | 53.04 | 37.18 | 1.13 | 8.23 | 0.026 | 0.383 |
| PCD | 7.52 | 52.93 | 37.12 | 1.13 | 8.35 | 0.026 | 0.432 | |
|
| ||||||||
| B | GT | 13.17 | 37.43 | 28.73 | 1.44 | 25.04 | 0.012 | 7.35 |
| PCD | 12.50 | 41.36 | 30.86 | 1.36 | 20.80 | 0.016 | 5.60 | |
3.5. Dose calculation
Figure 10 presents the dose calculation results using material information derived from the PCD-based ME-CBCT and that derived from single kVp FPD-based CBCT. The advantages of using PCD-based CBCT can be observed in the dose line profile comparison in Figure 10(b).
Figure 10:
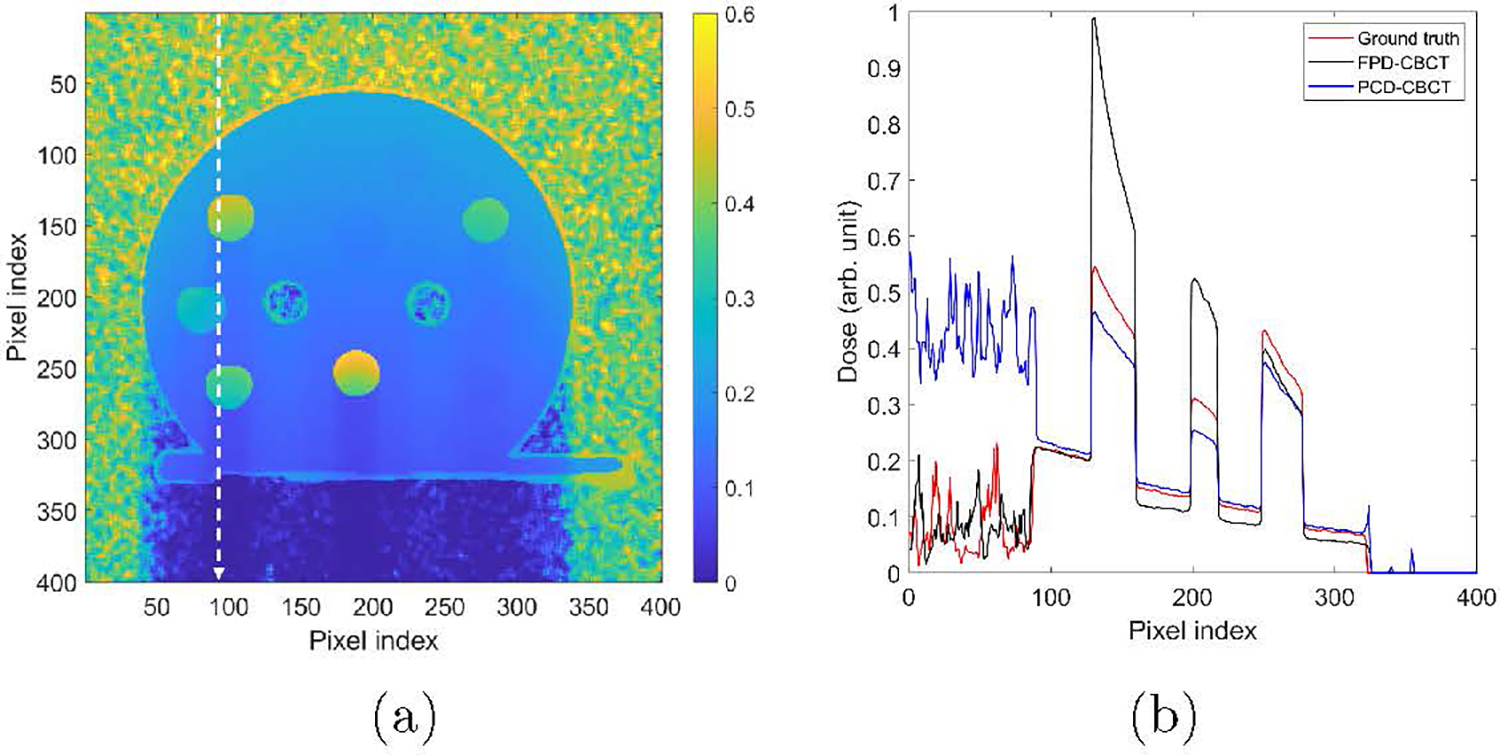
(a) MC dose calculation results. (b) Dose profiles along the vertical dash lines in (a).
Overall the dose calculated using the PCD-based CBCT image matched well with ground truth value in soft tissue region with a relative error 6.9% averaged over this region. The Zeff in the water insert was slightly larger than the ground truth value, as shown in Table 1. Hence the computed dose was higher than that computed based on the ground truth material information. As for the dose calculation results using FPD-CBCT, the averaged relative dose error was 7.5%. Specifically, the dose at the entrance soft-tissue region agreed well with that of the ground truth. In particular, when deriving material properties from a single-energy CBCT, the model used to converting CT number into material properties is conventionally calibrated in such a way that the conversion is accurate for water materials. Hence, dose calculation result in water region using materials derived from the FPD-based CBCT is expected to be accurate. However, after the beam traveled through the bone inserts, large underestimated dose appeared for the FPD-CBCT approach, which was caused by the substantially overestimated x-ray attenuation in the bone inserts.
As for dose in bone inserts, we observed significant improvements. Dose error was reduced from 49.5% using FPD-based CBCT to 16.4% using PCD-based CBCT. The 16.4% underestimated dose can be ascribed to the ~ 5% underestimated Zeff, as dose scales approximately with in this low-energy range.
4. Discussions
In this study, we triggered the PCD data acquisition at a frequency of 30 frame/sec, with each frame receiving data 20 msec and processing and readout for the remaining ~13 msec. The energy threshold sequentially cycled through the three energy thresholds. One drawback of this setting is radiation exposure to the object, as at the data processing and readout time, the object remains exposed to the x-ray. This setup was designed under constraints of the PCD hardware. One potential remedy is to synchronize the x-ray tube and detector data acquisition and pause the the x-ray tube during the data processing.
The values of energy threshold in this study were those nominal values used to control the PCD output. It is expected that these nominal values may not match precisely the actual energy thresholds, under which the detector functions to count number of photons. For instance, one of the optimal energy thresholds was found to be 90 keV. If this were the correct value, the number of photons in the energy channel above 90 keV under a 100 kVp beam would be much smaller than those of the other two channels. Hence, it is not likely the SNR of this channel is comparable to those of other channels. While using this nominal threshold values allowed us to carry out our experiments, it is desired to calibrate the energy response of this detector for a complete understanding about the detector’s characteristics (Panta et al., 2015; Li et al., 2020). This will be our future work.
The current study reports our initial developments towards a PCD-based CBCT system for a small animal irradiation platform. While initial success has been achieved, there are a number of areas that we could further improve the system. For instance, the CBCT reconstruction in this study assumed an ideal circular projection geometry. We simply used nominal SAD and measured SDD values. However, our previous study using the FPD-based CBCT found that the scanning geometry deviated from the ideal one due to gravity (Huang et al., 2021). With the added PCD on the gantry, the previous geometry calibration for the FPD-based CBCT has to be performed again. We skipped this geometry calibration step in the current study, because we intended to focus on system development and detector calibration, and the image quality was found visually acceptable. It is our ongoing work to precisely calibrate the scanning geometry to improve image quality. In addition, the system geometry could be optimized for better imaging performance. The finite focal size (Hu et al., 2022) is expected to impede the high spatial resolution offered by the PCD, and we will investigate this issue to further enhance the image resolution. Regarding angular sampling, our scan employed 600 projections per rotation for each energy, which may be not optimal for the detector with 1000 pixels per row. Although streak artifacts in the CBCT images were not visible, e.g. in Figure 6, the number of projections could be further optimized.
For simplicity, we employed a classical material decomposition algorithm to derive water and bone images using the CBCT images at the three energy channels. A total-variation regularization approach was employed to control noise levels in the resulting images. Over the years, there have been extensive studies for material decomposition from multi-energy CT (McCollough et al., 2015). Recent advances in deep learning (Shen et al., 2020) also permitted accomplishing image-processing tasks with high quality results, including material decomposition (Gong et al., 2020). These novel approaches could be employed in future studies to further enhance the material decomposition results. Another issue to consider is the number of energy channels. We chose three energy channels in this study and decomposed the images to two materials. This is a relatively simple setting, because of the over-complete decomposition problem. With the freedom of setting up energy thresholds of the PCD, in principle, we could acquire images with more number of channels, and decompose results into multiple materials. The specific choice has to be made based on the balance of multiple factors, such as number of photons and SNRs of CBCT images, energy thresholds, the choice of base materials, numerical properties of the mathematical problems associated with the decomposition tasks etc.
We also want to comment on the choice of energy thresholds. In this study, we randomly selected 100 pixels in the phantom region of projection images to decide the average SNR in each energy channel. Optimizing the γ metric towards equalizing SNRs among energy channels led to the energy thresholds 26, 56, and 90 keV. In principle, the SNRs and hence optimized thresholds would depend on the object imaged, e.g. object thickness and heterogeneity, and the pixels selected. We verified that, if using all pixels in the phantom region, the three energy thresholds would be 26, 56, and 88 keV with corresponding γ = 1.039. This indicated the representativeness of the 100 pixels selected, and the robustness of this approach. In addition, we selected energy threshold values to balance signal to noise ratio of different channels in the raw count data. Yet the data after correction for responses were used for image reconstruction. Because of different responses among pixels, SNRs of corrected data under the selected energy thresholds may not be the same anymore. However, the pixel response function indeed depends on the energy thresholds. Hence, it is a challenging task to select energy thresholds with pixel response function considered. Our study ignored the different responses among pixels when determining the energy thresholds. The validity of this simplification was demonstrated by the acceptable results as shown in Figure 6, where the SNRs in reconstructed images were still approximately equal. This was likely ascribed to the insensitivity of pixel response to energy thresholds to a certain extent, which requires further investigations to confirm. Additionally, the choice of energy thresholds depends on specific applications. For example, (He et al., 2012) proposed an signal-difference-to-noise-ratio criterion to optimize the energy channel width in order to differentiate materials specifically for k-edge imaging. It will be a valuable study for task-based threshold selection, which is an ongoing study at our group to optimize the energy thresholds for low-concentration gold contrast agent identification.
5. Conclusion
In this study, we reported our initial study on a PCD-based ME-CBCT developed for a preclinical small animal irradiation platform. We developed the data acquisition, processing, and image reconstruction pipeline to reconstruct CBCT images at three energy channels. An optimization model was used to decompose ME-CBCT images into images of water and bone. Based on the decomposed material density images, we investigated improvement of dose calculation accuracy using MC simulations. Radiation dose error was reduced from 49.5% to 16.4% in bone inserts and from 7.5% to 6.9% in soft tissue inserts, indicating that the PCD-based ME-CBCT offers improvement in dose calculation for preclinical radiation research.
Acknowledgement
This study is supported in part by grants from National Institutes of Health (R37CA214639, R01CA227289).
Appendix A. Numerical algorithm to solve decomposition problem in Eq. (3)
The optimization problem in Eq. (3) is equivalent to
| (A.1) |
The augmented Lagrangian of this optimization problem is
| (A.2) |
We iteratively solved the subproblems with respect to m and s, updated the dual variable y. Specifically, in the kth iteration step, the subproblem with respect to m is a quadratic problem
| (A.3) |
which can be solved using conjugate gradient method (Boyd et al., 2004), yielding m(k+1). The subproblem with respect to s had a closed form solution of
| (A.4) |
where shrink(x, δ) = max{0, x−δ}sgn(x) is the shrinkage function. Finally, the dual variable y was updated as
| (A.5) |
The algorithm iterated the above three steps until convergence.
References
- Alaei Parham, Gerbi Bruce J, and Geise Richard A. Evaluation of a model-based treatment planning system for dose computations in the kilovoltage energy range. Medical physics, 27(12):2821–2826, 2000. [DOI] [PubMed] [Google Scholar]
- Bazalova Magdalena, Carrier Jean-François, Beaulieu Luc, and Verhaegen Frank. Dual-energy ct-based material extraction for tissue segmentation in monte carlo dose calculations. Physics in Medicine & Biology, 53(9):2439, 2008. [DOI] [PubMed] [Google Scholar]
- Boyd Stephen, Boyd Stephen P, and Vandenberghe Lieven. Convex optimization. Cambridge university press, 2004. [Google Scholar]
- Boyd Stephen, Parikh Neal, and Chu Eric. Distributed optimization and statistical learning via the alternating direction method of multipliers. Now Publishers Inc, 2011. [Google Scholar]
- Clarkson R, Lindsay PE, Ansell S, Wilson G, Jelveh S, Hill RP, and Jaffray DA. Characterization of image quality and image-guidance performance of a preclinical microirradiator. Medical physics, 38(2):845–856, 2011. [DOI] [PMC free article] [PubMed] [Google Scholar]
- Danielsson Mats, Persson Mats, and Sjölin Martin. Photon-counting x-ray detectors for CT. Physics in Medicine & Biology, 66(3):03TR01, jan 2021. doi: 10.1088/1361-6560/abc5a5. [DOI] [PubMed] [Google Scholar]
- Ding Aiping, Gu Jianwei, Trofimov Alexei V, and Xu X George. Monte carlo calculation of imaging doses from diagnostic multidetector ct and kilovoltage cone-beam ct as part of prostate cancer treatment plans. Medical physics, 37(12):6199–6204, 2010. [DOI] [PMC free article] [PubMed] [Google Scholar]
- Feldkamp Lee A, Davis Lloyd C, and Kress James W. Practical cone-beam algorithm. Josa a, 1(6):612–619, 1984. [Google Scholar]
- Flohr Thomas, Petersilka Martin, Henning Andre, Ulzheimer Stefan, Ferda Jiri, and Schmidt Bernhard. Photon-counting ct review. Physica Medica, 79:126–136, 2020. ISSN 1120–1797. doi: 10.1016/j.ejmp.2020.10.030. [DOI] [PubMed] [Google Scholar]
- Gong Hao, Tao Shengzhen, Rajendran Kishore, Zhou Wei, McCollough Cynthia H, and Leng Shuai. Deep-learning-based direct inversion for material decomposition. Medical physics, 47(12):6294, 2020. [DOI] [PMC free article] [PubMed] [Google Scholar]
- Granton PV, Pollmann SI, Ford NL, Drangova M, and Holdsworth DW. Implementation of dual-and triple-energy cone-beam micro-ct for postreconstruction material decomposition. Medical physics, 35(11):5030–5042, 2008. [DOI] [PubMed] [Google Scholar]
- He Peng, Wei Biao, Cong Wenxiang, and Wang Ge. Optimization of k-edge imaging with spectral ct. Medical Physics, 133(11):6572–6579, 2012. doi: 10.1118/1.4754587. [DOI] [PMC free article] [PubMed] [Google Scholar]
- Hu Xiaoyu, Zhong Yuncheng, Huang Yanqi, Shen Chenyang, and Jia Xun. Improving small animal cone beam CT resolution by mitigating x-ray focal spot induced blurring via deconvolution. Physics in Medicine & Biology, 67(12):125005, jun 2022. doi: 10.1088/1361-6560/ac6b7a. [DOI] [PMC free article] [PubMed] [Google Scholar]
- Huang Yanqi, Hu Xiaoyu, Zhong Yuncheng, Lai Youfang, Shen Chenyang, and Jia Xun. Improving dose calculation accuracy in preclinical radiation experiments using multi-energy element resolved cone-beam ct. Physics in Medicine & Biology, 66 (24):245003, 2021. [DOI] [PMC free article] [PubMed] [Google Scholar]
- Jia Xun, Lou Yifei, Li Ruijiang, Song William Y, and Jiang Steve B. Gpu-based fast cone beam ct reconstruction from undersampled and noisy projection data via total variation. Medical physics, 37(4):1757–1760, 2010. [DOI] [PubMed] [Google Scholar]
- Jia Xun, Yan Hao, Gu Xuejun, and Jiang Steve B. Fast monte carlo simulation for patient-specific ct/cbct imaging dose calculation. Physics in Medicine & Biology, 57(3):577, 2012. [DOI] [PubMed] [Google Scholar]
- Li Mengzhou, Rundle David S., and Wang Ge. X-ray photon-counting data correction through deep learning, 2020.
- McCollough Cynthia H, Leng Shuai, Yu Lifeng, and Fletcher Joel G. Dual-and multi-energy ct: principles, technical approaches, and clinical applications. Radiology, 276(3):637–653, 2015. [DOI] [PMC free article] [PubMed] [Google Scholar]
- Montanari D, Scolari E, Silvestri C, Graves CYJ, Rice R, Cervino L, Steve BJ, and Jia X. Cone beam ct dose assessments using monte carlo simulations phys. Med. Biol, 59:1239, 2014. [DOI] [PubMed] [Google Scholar]
- Niu Tianye, Dong Xue, Petrongolo Michael, and Zhu Lei. Iterative image-domain decomposition for dual-energy ct. Medical Physics, 41(4):041901, 2014. [DOI] [PubMed] [Google Scholar]
- Panta Raj Kumar, Walsh Michael F., Bell Stephen T., Anderson Nigel G., Butler Anthony P., and Butler Philip H.. Energy calibration of the pixels of spectral x-ray detectors. IEEE Transactions on Medical Imaging, 34(3):697–706, 2015. doi: 10.1109/TMI.2014.2337881. [DOI] [PubMed] [Google Scholar]
- Schneider Wilfried, Bortfeld Thomas, and Schlegel Wolfgang. Correlation between ct numbers and tissue parameters needed for monte carlo simulations of clinical dose distributions. Physics in Medicine & Biology, 45(2):459, 2000. [DOI] [PubMed] [Google Scholar]
- Shen Chenyang, Nguyen Dan, Zhou Zhiguo, Steve B Jiang Bin Dong, and Jia Xun. An introduction to deep learning in medical physics advantages, potential, and challenges. Physics in Medicine and Biology, 65(5):05TR01, 2020. [DOI] [PMC free article] [PubMed] [Google Scholar]
- Ullberg Christer, Urech Mattias, Weber Niclas, Engman Anders, Redz Anna, and Henckel Fredrik. Measurements of a dual-energy fast photon counting cdte detector with integrated charge sharing correction. In Medical Imaging 2013: Physics of Medical Imaging, volume 8668, pages 169–176. SPIE, 2013. [Google Scholar]
- Verhaegen Frank, Granton Patrick, and Tryggestad Erik. Small animal radiotherapy research platforms. Physics in Medicine & Biology, 56(12):R55, 2011. [DOI] [PubMed] [Google Scholar]


