

Introduction
Chronic liver disease (CLD) is an increasing concern for both the US and world healthcare systems, with approximately 2 million people dying each year worldwide from CLD3. Importantly, this problem is not going away or lessening. While prevention and treatment of viral hepatitis has significantly improved over the past few decades, the growing global problem of obesity and type 2 diabetes has led to continued increase in CLD, particularly due to non-alcoholic fatty liver disease (NAFLD)3,5.
With more and more CLD patients, it is imperative to develop methods to screen and monitor for disease progression efficiently and effectively. Although histological analysis through liver biopsy remains the gold standard7, practical limitations such as availability, cost, and risk of complications limit its utility as a widespread or long-term solution. Therefore, noninvasive imaging, both underlying etiology (e.g., hepatic steatosis and iron deposition) and the end result (hepatic fibrosis), has and will continue to be an important part of CLD management. In the past, imaging assessment of CLD was typically limited to somewhat rudimentary qualitative assessment, such as evaluating liver morphology as a sign of fibrosis or decreased hepatic attenuation on computed tomography (CT) as a sign of hepatic steatosis. However, advances in magnetic resonance (MR) imaging have allowed for accurate noninvasive assessment of CLD. In this review, we will discuss current MR techniques for evaluation of hepatic fibrosis, steatosis, and iron content as well as future avenues for advancement currently being studied.
MR Imaging of Liver Fibrosis
Current Techniques
Routine or morphologic based techniques
Advanced fibrosis or cirrhosis has long been identified on cross-sectional imaging by macro-alterations to the liver morphology and architecture. For instance, surface nodularity, caudate and left lateral lobe hypertrophy with right and left medial lobe atrophy, widening of the fissures, and increased parenchymal reticulation on pre-and post-contrast MR images are all signs of advanced fibrosis8,9. However, these features are typically only present on advanced fibrosis cases when it may be too late for effective treatment and to prevent progression of CLD9. Secondary effects of hepatic fibrosis such as sequela of portal hypertension (e.g. ascites, splenomegaly, and upper abdominal varices) are mostly seen in advanced cases and are also more non-specific, as they can be seen in non-fibrotic processes such as nodular regenerative hyperplasia (NRH)10. Therefore, while these morphologic signs can be used to indicate advanced fibrosis, they are not suitable for diagnosis or monitoring of liver fibrosis.
MR Elastography
MR elastography (MRE) is the primary MR technique currently utilized to evaluate hepatic fibrosis. The increased extracellular matrix and collagen deposition that occurs with hepatic fibrosis leads to increased liver stiffness (LS)11. This increased stiffness can be measured using MRE, allowing for indirect but accurate fibrosis assessment. Examples of MRE exams in different stages of fibrosis are shown in Figures 1–3.
Figure 1.
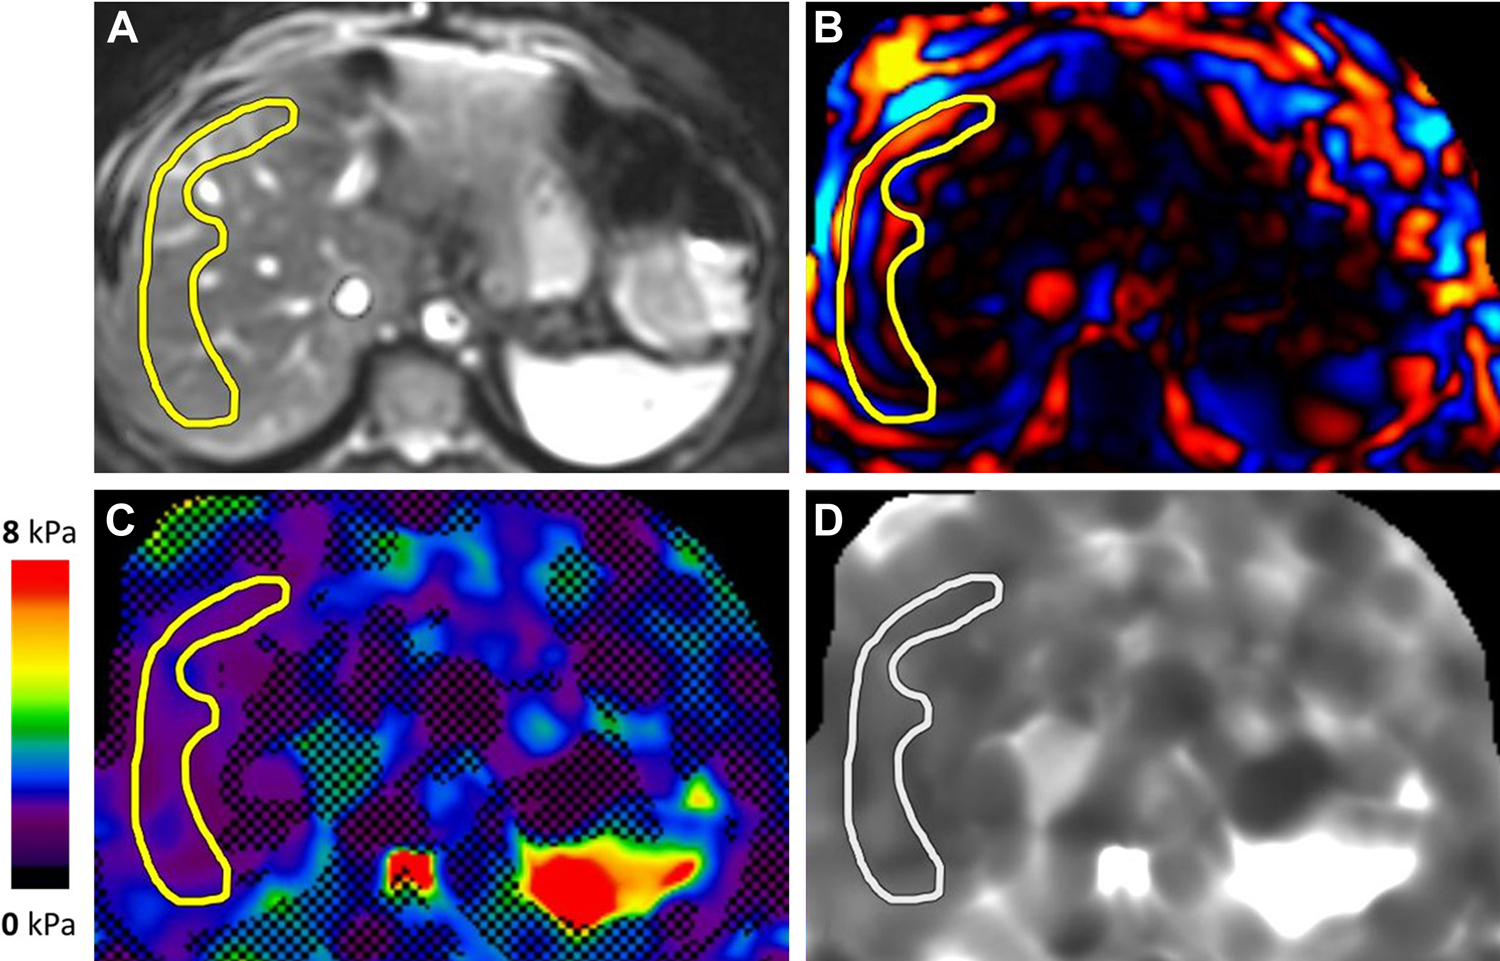
MR elastogram in a patient with suspected primary sclerosing cholangitis. Magnitude (A), color wave (B), color elastogram with confidence map (C), and gray-scale elastogram (D) are shown. Liver stiffness was 1.6 kPa, in the normal range.
Figure 3.
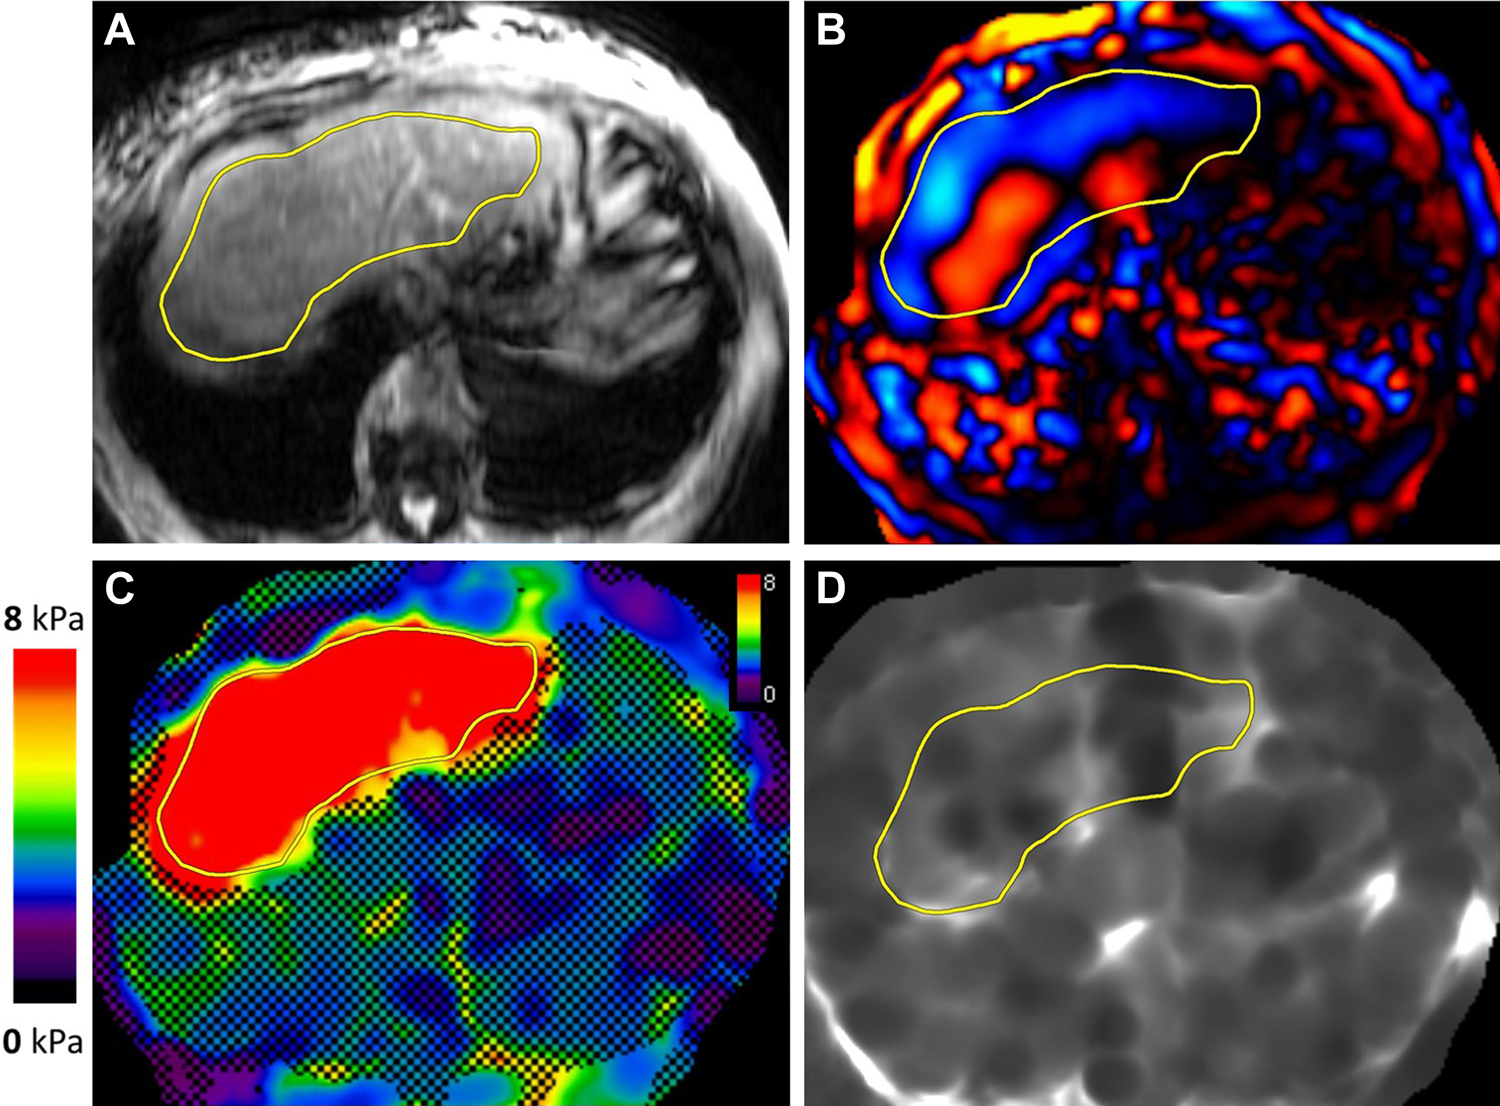
MR elastogram in a patient with alcohol related liver disease. Magnitude (A), color wave (B), color elastogram with confidence map (C), and gray-scale elastogram (D) are shown. Liver stiffness was 10.3 kPa, in the stage 4 fibrosis or cirrhosis range.
Currently, two-dimensional (2D) MRE is the predominant technique for clinical evaluation. MRE can be performed as a standalone exam or as part of a more comprehensive MR evaluation. While MRE at 1.5T overall has better technical performance due to decreased artifacts12, both 1.5T and 3T systems offer accurate and reproducible liver stiffness measurement (LSM).
MRE has been shown to be highly accurate, and is widely regarded as the most accurate noninvasive method for diagnosing hepatic fibrosis4. Studies have consistently shown high diagnostic accuracies greater than 85%, both in detecting fibrosis as well as discriminating severe fibrosis (F3–4) from mild fibrosis13–15. In addition, numerous studies have shown the results of MRE are highly reproducible with high interobserver agreement, with studies showing intraclass correlation coefficients typically >0.85, and >0.9 for repeatability and reproducibility16–19. One advantage of MRE is that it is not significantly affected by hepatic steatosis, an important issue with the high prevalence of hepatic steatosis20. MRE also benefits from a rather large volume of liver sampled compared to other, non-MR based, noninvasive methods. This larger sample size leads to more accurate and consistent results, particularly in patients with heterogenous fibrosis such as in primary sclerosing cholangitis21.
MRE does have a few limitations. First, any patient contraindication to MRI, such as an MR incompatible device, will preclude the use of MRE. The primary sequence obtained in MR is a gradient-recalled echo (GRE) sequence. GRE is susceptible to short T2* relaxation times with elevated hepatic iron content, especially in 3T systems, which can make a GRE MRE nondiagnostic. A spin-echo echo planar imaging (SE-EPI) based MRE, which is much less affected by high hepatic iron content may be useful and studies have shown an overall greater technical success rate for SE-EPI MRE due to fewer technical failures in elevated hepatic iron patients12. Another limitation of MRE are several confounding factors that can increase hepatic stiffness, unrelated to hepatic fibrosis. Examples include hepatic inflammation, hepatic congestion, biliary obstruction, portal hypertension, and infiltrative diseases such as amyloidosis22,23. These confounding factors should be kept in mind and the radiologist consider clinical context when evaluating an MRE.
Diffusion weighted imaging
Diffusion weighted imaging (DWI) is a well-established MRI technique, which measures the Brownian motion of water molecules in a voxel of tissue. A fibrotic liver restricts the intravoxel motion of water, likely due to the increased connective tissue/collagen. This leads to a lower apparent diffusion coefficient (ADC), which can be measured and used to assess for and stage fibrosis. A few studies have shown accuracy in detecting significant fibrosis with DWI24,25, though the technique does not perform as well as MRE26. A main advantage of DWI is its wide availability without additional hardware needed. However, it does have its drawbacks. ADC cutoff values can vary between studies and scanners, leading to difficulty establishing value ranges. DWI can also be affected by noise, motion artifacts, and hepatic iron/fat content27,28.
Recent Advancements and Future MR Techniques
Three-dimensional MRE
The current predominantly used MRE technique is a 2D technique, specifically 2D GRE MRE which measures shear waves moving in a two-dimensional plane. However, as shear waves propagate in three dimensions in tissue, a technique measuring shear wave properties in all three dimensions could be more accurate. This 3D-MRE is best accomplished using an SE-EPI technique, as the large number of slices needed necessitates a fast speed of acquisition. Early studies have shown similar accuracy between 3D SE-EPI MRE and 2D GRE MRE29.
3D MRE derived parameters
As discussed in the MR elastography section, there are several confounding factors in the liver that can increase liver stiffness without fibrosis. Using advanced techniques of 3D MRE, it is possible to evaluate other tissue mechanical properties with a goal of producing a more accurate assessment of fibrosis. The technical details are out of scope for this review, though the technique utilizes multiple frequencies and complex inversion algorithms. Among the parameters obtained include liver viscosity, dispersion of shear wave velocity, damping ratio, and volumetric strain30. Of these, shear modulus has been shown to correlate with fibrosis; while others correlate more with steatosis (dispersion of shear wave velocity) or necroinflammation (damping ratio and loss modulus), for example30,31. More research is needed to bring these factors into clinical use, though their potential to improve MRE is promising.
Hepatocyte function using hepatobiliary contrast agents
Hepatobiliary contrast agents (HBA) are taken up by functioning hepatocytes, with a peak hepatobiliary phase enhancement of about 20 minutes with gadoxetate disodium and about 60–180 minutes with gadobenate dimeglumine. As the liver becomes more fibrotic, there is a decrease in functional hepatocytes and therefore decreased HBA uptake32. The hepatobiliary phase enhancement can be compared to precontrast images or internal comparisons such as the spleen or muscle to detect and stage fibrosis. While the research into staging fibrosis by HBA uptake is somewhat sparse, several studies have shown the ability to accurately detect fibrosis and further research is needed32–34.
T1 Mapping
T1 mapping is a technique that takes advantage of the prolonged T1 relaxation times in tissue with higher water content. The increased extracellular space associated with fibrosis creates this increased tissue water content that can be measured and used to correlate with stages of fibrosis35. As hepatic iron will shorten T1 relaxation time, this technique is often performed with a compensatory algorithm to account for the iron, referred to as corrected T1 (cT1). Early studies have shown T1/cT1 to be predominantly inferior to MRE in fibrosis evaluation, though research is ongoing36.
Intravoxel incoherent motion (IVIM)
Earlier, we discussed DWI assessment of hepatic fibrosis. A closely related technique also being studied for evaluation of fibrosis is intravoxel incoherent motion (IVIM). Both DWI and IVIM use gradients to evaluate the motion of water molecules in tissue. However, DWI uses stronger gradients and assesses the diffusibility of water molecules, primarily affected by cell membranes and macromolecules. On the other hand, IVIM uses smaller gradients to assess microperfusion in the capillary network37. Several studies have shown high accuracy in IVIM detecting hepatic fibrosis, though cohort sizes are relatively small and further research is needed37,38.
Other Techniques
A few additional MR techniques in evaluating hepatic fibrosis are described in Table 2.
Table 2:
Additional MR techniques for the evaluation of hepatic fibrosis.
| Technique | Description |
|---|---|
| Spin-Lattice Relaxation in the Rotating Frame (T1ρ) |
|
| T2 Mapping | |
| Susceptibility-Weighted Imaging (SWI) |
|
| MR Perfusion Techniques |
MR Imaging of Hepatic Steatosis and Iron
Background
Hepatic steatosis, the pathognomonic and earliest histological feature of NAFLD, is characterized by the intracellular accumulation of triglycerides within hepatocytes. In some patients, the resultant inflammatory response can drive progression to NASH and, ultimately, cirrhosis and its associated complications, such as hepatocellular carcinoma and liver failure. Furthermore, there is mounting evidence that there is significant interplay between the development of hepatic steatosis and pathologic processes in other organ systems. One recent study documented a strong association between hepatic steatosis on noncontrast CT and coronary artery disease39, which accounts for a greater fraction of mortality in patients with NAFLD than liver disease, while several recent analyses have suggested that steatosis may be a causal factor of both the metabolic syndrome and type II diabetes40,41.
Excessive iron deposition within the body typically stems from conditions that result in disordered intestinal absorption, such as hereditary hemochromatosis, ineffective erythropoiesis seen with inherited anemias, or repeated transfusions in patients with profound anemia such as that seen in bone marrow suppression. These mechanisms result in pathologic accumulation of iron in the liver, damaging hepatocytes and predisposing patients to progressive hepatic fibrosis and the development of cirrhosis42, and a surplus of iron may accelerate hepatic injury in patients with NASH43. In the heart, toxic iron accumulation can result in cardiomyopathies and fatal arrythmias, while in the pancreas, iron overload can cause exocrine dysfunction and lead to type I diabetes; iron accumulation in the anterior pituitary gland disrupts gonadotropin synthesis, yielding gonadal dysfunction and decreased serum levels of estrogen and testosterone42.
Accordingly, the accurate quantification of hepatic fat and iron has long been important in the detection, prevention and treatment of chronic liver disease. Traditional methods of diagnosing steatosis and iron overload, such as non-targeted liver biopsy, are subject to sampling error and can be complicated by pain, bleeding and high cost44–46. As a result, there has been increasing interest in recent years in the development of imaging biomarkers for the non-invasive identification and quantification of hepatic steatosis and iron overload.
Conventional MRI Techniques
In-phase and opposed-phase imaging
For decades, conventional MRI imaging sequences, including in-phase and opposed-phase (IOP) imaging and fat suppression, have utilized the different resonance frequencies of fat and water to provide pseudo-quantitative estimates of hepatic fat content.
IOP imaging utilizes multiple echo times to acquire images in which the signals from water and fat are either in-phase (IP = |W + F|) or out-of-phase (OP = |W – F|), where the vertical bars indicated the absolute value, ie: magnitude.
However, a number of factors confound measurement of signal fat-fraction47,48, which may not accurately reflect hepatic fat content. This approach is also limited by a dynamic range of 0–50% hepatic fat fraction; in practice, hepatic fat fractions in excess of 50% are rare but do occur49.
MR Spectroscopy
Magnetic resonance spectroscopy (MRS) has also been used to quantify hepatic fat. With MRS, the resonant frequencies of water and fat protons are demonstrated on a spectral tracing and the signal intensities of the protons at their respective frequencies are quantified, yielding a signal fat fraction48. MRS is limited by the need for specialized expertise and time-intensive postprocessing. Furthermore, the MRS signal is usually obtained with a small voxel, meaning that sampling error is a potential problem in patients with heterogeneous hepatic fat distribution49.
T2 and T2* Imaging
The accumulation of iron in tissue impacts MRI signal by shortening the relaxation times T2*, T1, and T2. A qualitative estimate of hepatic iron overload can be obtained with either T2- or T2*-weighted images. In cases of iron overload, the liver demonstrates decreased signal intensity relative to a normal liver on T2-weighted images, which are usually acquired with fast spin echo (FSE) sequences. IOP gradient echo (GRE) sequences have also been used to qualitatively estimate excessive iron accumulation within hepatocytes by taking advantage of T2* weighting. In IOP imaging, the second echo, given its longer echo time, is more T2* weighted than the first; hepatic parenchymal signal loss between the first echo (opposed-phase images) and the second echo (in-phase images) suggests short T2* decay and is indicative of iron deposition42.
Quantitative assessment of liver iron content has been performed using signal intensity ratio (SIR) techniques using either T2- or T2*-weighted imaging, MR susceptometry, and quantitative relaxometry. A comprehensive review of these methods is beyond the scope of this text but can be found elsewhere in the literature42.
Recent Imaging Techniques
Quantitative chemical shift-encoded MRI
Quantitative chemical shift-encoded (CSE) MRI is an imaging technique that facilitates the separation of MR signal into fat and water components by acquiring images at three or more echo times, although typically 6 are used. CSE MRI corrects for an assortment of technical and biological factors—such as T1 relaxation, T2* decay, noise bias, eddy currents, and spectral complexity of fat47,48,50,51—that can otherwise confound accurate and reproducible measurements of signal fat-fraction within the liver. In doing so, the resultant signal fat-fraction becomes equivalent to the proton density fat-fraction, which is a fundamental property of tissue, defined as the ratio of mobile protons attributable to fat to the total number of mobile protons47,52.
The two major approaches to perform CSE MRI can be characterized as either magnitude-based or complex-based: the magnitude-based technique48,53,54, which is generally easier to implement, consists only of magnitude images and thus is insensitive to phase errors. The main drawbacks of magnitude-based CSE MRI are lower SNR performance and a dynamic range limited to PDFF between 0–50%. Complex-based technique54–56 incorporates both phase and magnitude information, enabling estimation of PDFF with higher SNR performance and a full dynamic range between 0–100%.
CSE MRI data are frequently obtained with a short breath hold and a 3D acquisition of the liver, from which a parametric map can be produced at the level of the scanner. The same acquisition used to produce an estimate of hepatic fat content in the form of PDFF can also be used to generate a confounder-corrected map of R2* (1/T2*) that is corrected for the presence of fat42,57,58. These maps provide a visual representation of both hepatic fat fraction, expressed as a percentage, and hepatic iron content in the form of R2*, which is directly proportional to liver iron content (LIC). Regions of interest (ROIs) can be drawn within the hepatic parenchyma on these maps to quantitate hepatic fat and iron content. Examples of PDFF and R2* images are depicted in Figures 4–6.
Figure 4.

1.5T MRI in a patient with elevated liver enzymes. In-phase (A) and opposed-phase (B) images demonstrate only a small drop in signal intensity (SI) on opposed-phase images. Proton density fat fraction (C) images demonstrate a fat fraction (FF) of approximately 3.2%, within normal limits. R2* images (D) demonstrate a R2* of approximately 33 s−1, also within normal limits.
Figure 6.
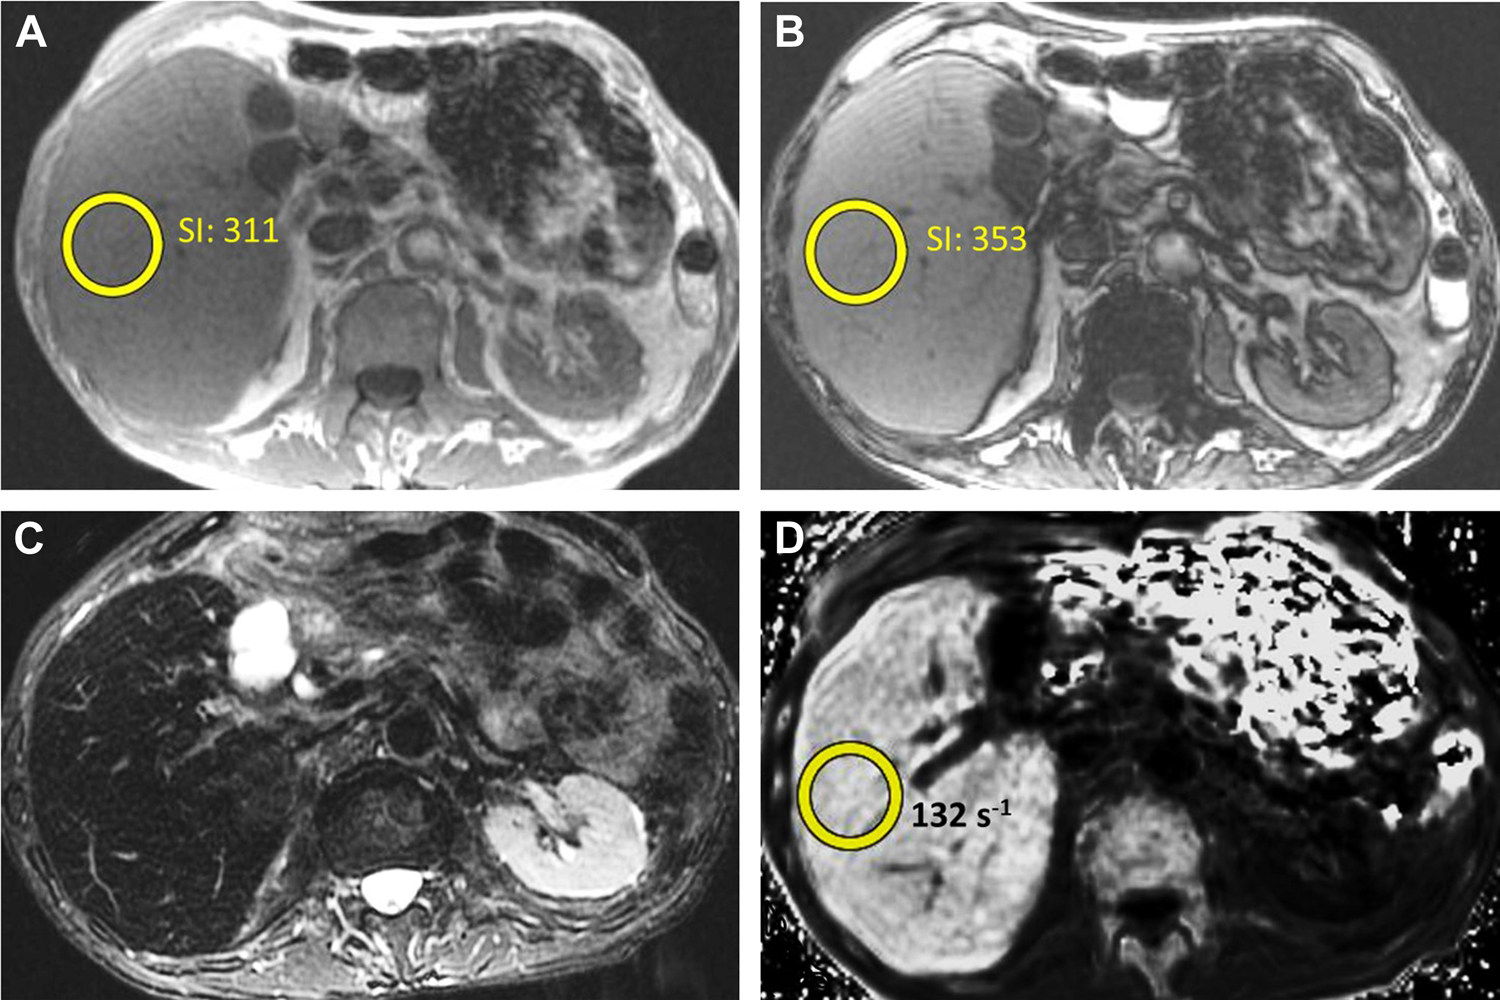
1.5T MRI in a patient for elevated liver enzymes. In-phase (A) and opposed-phase (B) images demonstrate slightly increased signal intensity (SI) on opposed-phase images. T2-weighted images (C) demonstrate diffusely decreased signal throughout the liver. R2* images (D) demonstrate a R2* of approximately 132 s−1, moderately increased.
There is no current consensus with respect to the best technique by which to analyze PDFF and R2* parametric maps, as wide variability exists with regard to the size and number of ROIs used to measure hepatic fat and iron content and the locations in which they are placed59–61. These differences may impede accurate comparison of PDFF and R2* values across institutions. One recent investigation60 found that intra- and interobserver variability was minimized by maximizing the volume of liver sampled through a large number of ROIs (in either the medial, lateral, posterior, and anterior segments of the liver or in each of the nine Couinaud segments). In the future, automated whole-liver segmentation may eliminate the need for manual ROI placement49.
Confounder-corrected CSE MRI techniques have demonstrated excellent correlation with PDFF as calculated by MRS52, have been validated in both phantoms and animals62,63, and, with a dynamic range of 0–100%, obviate challenges associated with heterogeneous hepatic fat deposition. Recently, CSE MRI techniques have been utilized to devise limited imaging protocols that permit quantification of liver fat and iron in as little as three breath-holds and five total minutes of table time, at a cost similar to that of most laboratory tests64, highlighting the promise of this imaging method as a means of accurate, noninvasive diagnosis and monitoring of both hepatic steatosis and iron overload.
Figure 2.
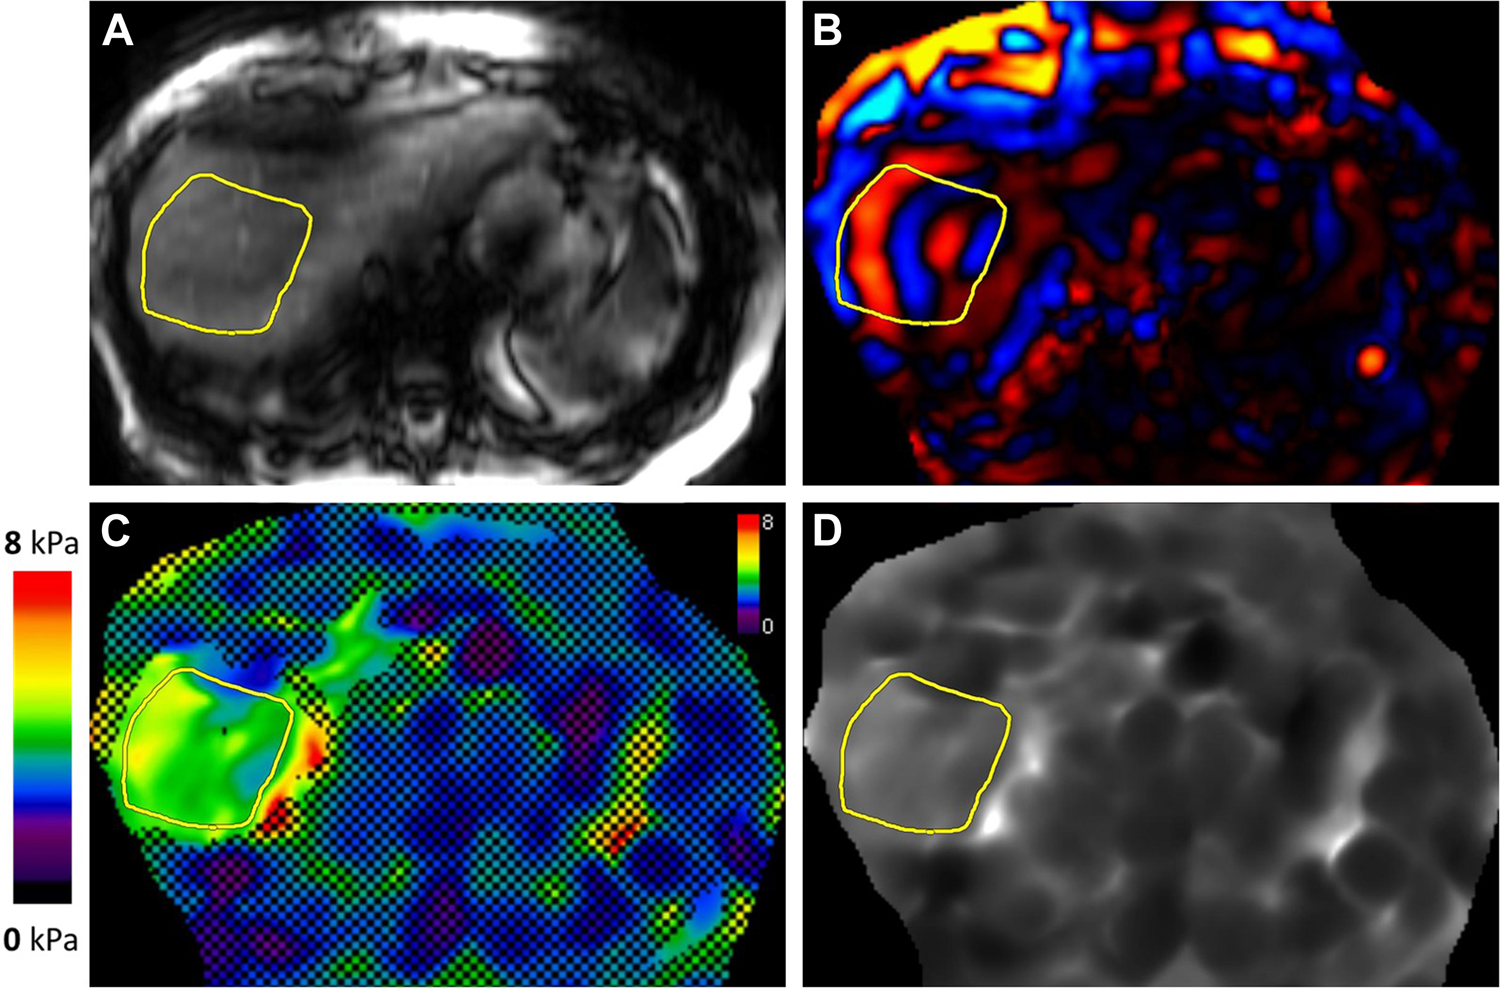
MR elastogram in a patient with non-alcoholic steatohepatitis. Magnitude (A), color wave (B), color elastogram with confidence map (C), and gray-scale elastogram (D) are shown. Liver stiffness was 3.8 kPa, in the stage 2–3 fibrosis range.
Figure 5.
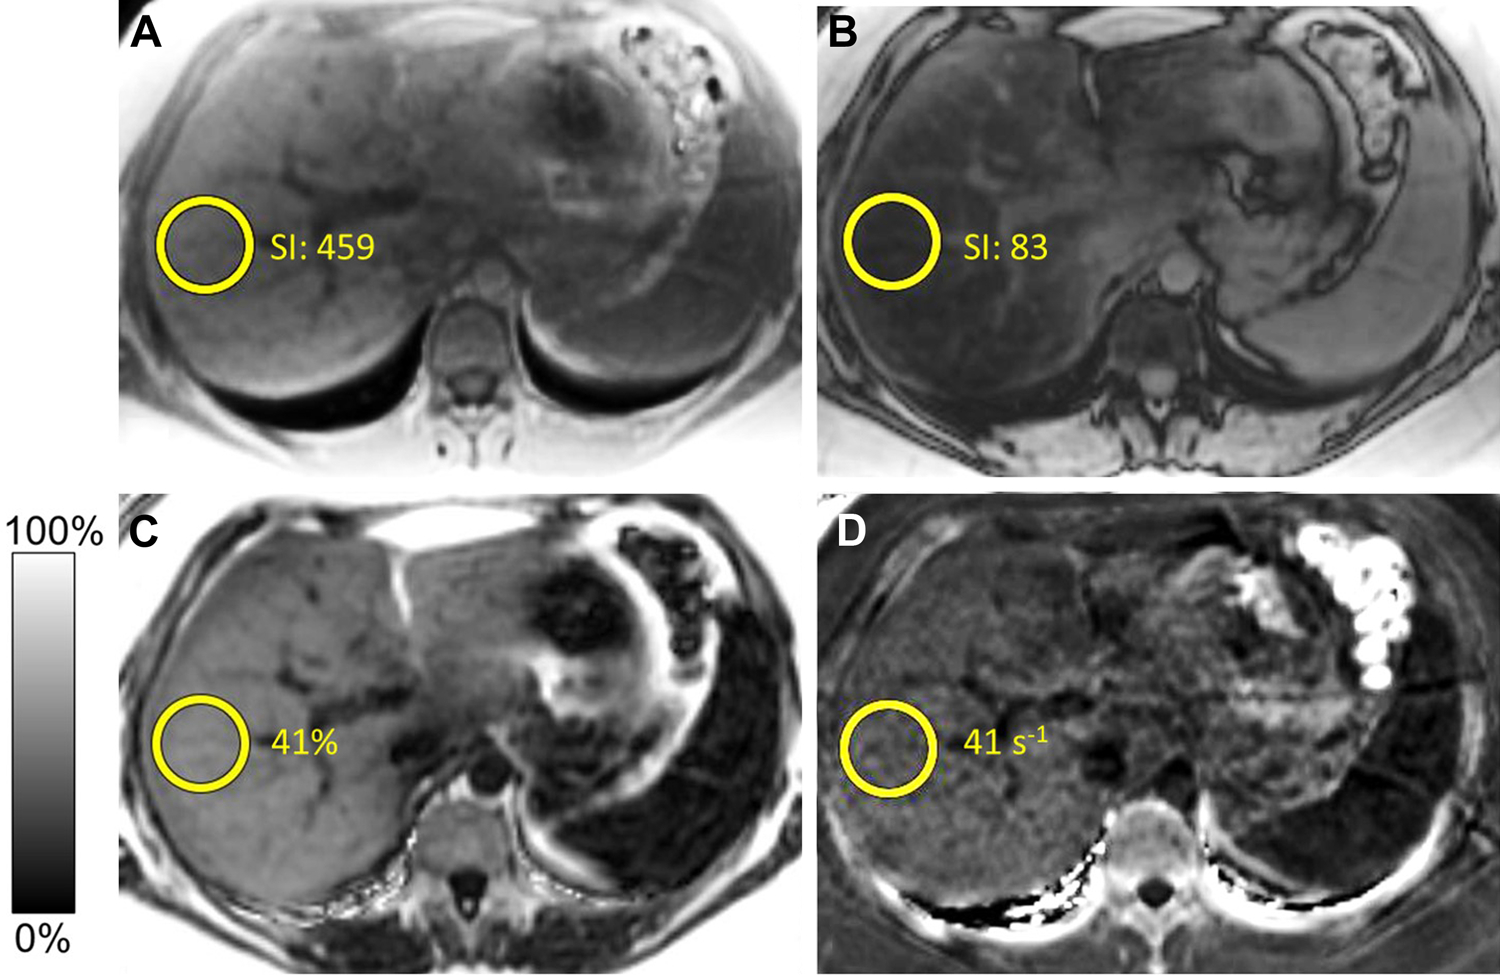
1.5T MRI in a patient with suspected hepatic steatosis. In-phase (A) and opposed-phase (B) images demonstrate a significant drop in signal intensity (SI) on opposed-phase images. Proton density fat fraction (C) images demonstrate a fat fraction (FF) of approximately 41% consistent with severe steatosis. R2* images (D) demonstrate a R2* of approximately 41 s−1, within normal limits.
Table 1:
MR elastography liver stiffness measurement (LSM) correlation with fibrosis stage
| Mean LSM | Fibrosis Stage |
|---|---|
| <2.5 kPa | Normal |
| 2.5–3.0 kPa | Normal or Inflammation |
| 3.0–3.5 kPa | Stage 1–2 Fibrosis |
| 3.5–4.0 kPa | Stage 2–3 Fibrosis |
| 4.0–5.0 kPa | Stage 3–4 Fibrosis |
| >5.0 kPa | Stage 4 Fibrosis or Cirrhosis |
Synopsis.
Chronic liver disease is a large and ever growing problem in both the US and world healthcare systems. While histological analysis through liver biopsy is the gold standard for hepatic parenchymal evaluation, this is not feasible in such a large population of patients or as a way of monitoring change over time. This review discusses MRI based techniques for assessing hepatic fibrosis, hepatic steatosis, and hepatic iron content, with discussions of both current techniques and future advancements.
Key Points.
Chronic liver disease is a large and increasing problem in the world, and non-invasive imaging modalities are needed for assessment and long-term monitoring.
MR elastography is the predominant non-invasive MR method for detecting and staging hepatic fibrosis and shows high accuracy and reproducibility.
Multiple additional MR techniques are being researched for assessment of hepatic fibrosis.
Recent advances in hepatic fat and iron measurement using quantitative chemical shift-encoded MRI have made measuring hepatic iron and fat straightforward and accessible.
MR Elastography Technique.
Available on all major vendor platforms and as an addition to existing MR system or part of a new MR installation.
MRE is available for both 1.5T and 3T clinical scanners
Uses an active driver system to produce and transmit acoustic pressure waves (60Hz frequency) into the liver.
A passive driver is strapped snugly to the patient’s lower chest over the liver. Passive driver is connected to active driver with a plastic tube that transmits the acoustic waves.
The propagating shear waves are visualized using a special phase-contrast MR sequence. As shear waves have a higher velocity in more stiff tissues, they are visualized as waves with longer wavelength4.
An inversion algorithm automatically converts wave information (velocity, amplitude, and wavelength) into stiffness maps.
Typically, 4 slices are obtained and for each slice, several images are obtained, both raw data and post-processed images.
Magnitude images demonstrate anatomy and confirm appropriate location of the prescribed slices.
Phase images can be used to confirm presence of propagating shear waves in the liver. Gray-scale and color elastograms are used for liver stiffness measurement and visual representation of degrees of fibrosis respectively.
MRE Liver Stiffness Measurement.
There are both automated and manual methods for liver stiffness measurement (LSM) using MRE1, though currently a manual process is the widely used method clinically.
The process for manual LSM varies depending on the manufacturer and sequences obtained. In the end, regions of interest (ROIs) are drawn on the gray-scale elastogram to obtain the LSM, with careful correlation with the magnitude image to ensure the ROI is avoiding the liver edge and major vessels and correlation with the wave images to ensure only good quality waves are being sampled.
If a confidence overlay is available, the ROI should be within the available (non-hashed out) area.
ROIs should be as large as possible to ensure the largest area of liver is sampled6.
The process is repeated for all four slices, with a weighted arithmetic mean calculated. This mean LSM can then be used to correlate with the histological stages of fibrosis (Table 1).
Hepatic Signal Fat-Fraction Calculation.
Where η is the signal fat fraction, IP is the signal from the fat protons (F) plus the signal from the water protons (W), and OP is the signal from the water protons minus the signal from the fat protons.
Given that the IP and OP signals are magnitude-only signals, there is a 50% ambiguity of the fat-fraction estimate for fat concentrations greater than 50%.
Pseudo-quantitative Estimation of Fat Fraction.
Requires acquisition of two different sets of images, with identical parameters save for one set employs fat-saturation.
- The difference in signal intensity between the sequences is assumed secondary to fat, and an approximate fat fraction can be calculated by:
η is the signal fat fraction, SNFS is the liver signal intensity without fat suppression, and SFS is the signal intensity with fat suppression.
Potential issues with this technique include the unintentional suppression of water signal and the incomplete or inhomogeneous suppression of fat, problems that would render the signal fat-fraction invalid2.
Disclosure Statement:
Dr. Venkatesh’s contribution was supported by National Institute of Health Grant (EB001981) and U.S. Department of Defense grant (W81XWH-19-1-0583-01). Drs. Welle and Olson have no disclosures.
Abbreviations:
- CLD
Chronic liver disease
- MRE
Magnetic resonance elastography
- LS
Liver stiffness
- GRE
Gradient-recalled echo
- SE-EPI
Spin-echo echo planar imaging
- IOP
In-phase and opposed-phase
- CSE
Chemical shift-encoded
- PDFF
Proton density fat fraction
Contributor Information
Christopher L Welle, Department of Radiology, Mayo Clinic, Rochester, MN.
Michael C Olson, Department of Radiology, Mayo Clinic, Rochester, MN.
Scott B Reeder, Department of Radiology, University of Wisconsin, Madison, WI.
Sudhakar K Venkatesh, Department of Radiology, Mayo Clinic, Rochester, MN.
References
- 1.Dzyubak B, Venkatesh SK, Manduca A, Glaser KJ, Ehman RL. Automated liver elasticity calculation for MR elastography. J Magn Reson Imaging. 2016;43(5):1055–1063. [DOI] [PMC free article] [PubMed] [Google Scholar]
- 2.Reeder SB, Cruite I, Hamilton G, Sirlin CB. Quantitative Assessment of Liver Fat with Magnetic Resonance Imaging and Spectroscopy. J Magn Reson Imaging. 2011;34(4):729–749. [DOI] [PMC free article] [PubMed] [Google Scholar]
- 3.Paik JM, Golabi P, Younossi Y, Mishra A, Younossi ZM. Changes in the Global Burden of Chronic Liver Diseases From 2012 to 2017: The Growing Impact of NAFLD. Hepatology. 2020;72(5):1605–1616. [DOI] [PubMed] [Google Scholar]
- 4.Tan CH, Venkatesh SK. Magnetic Resonance Elastography and Other Magnetic Resonance Imaging Techniques in Chronic Liver Disease: Current Status and Future Directions. Gut Liver. 2016;10(5):672–686. [DOI] [PMC free article] [PubMed] [Google Scholar]
- 5.Estes C, Razavi H, Loomba R, Younossi Z, Sanyal AJ. Modeling the epidemic of nonalcoholic fatty liver disease demonstrates an exponential increase in burden of disease. Hepatology. 2018;67(1):123–133. [DOI] [PMC free article] [PubMed] [Google Scholar]
- 6.Kim M, Kang BK, Jun DW, Kim Y. MR elastography of the liver: comparison of three measurement methods. Clin Radiol. 2020;75(9):715 e711–715 e717. [DOI] [PubMed] [Google Scholar]
- 7.Berger D, Desai V, Janardhan S. Con: Liver Biopsy Remains the Gold Standard to Evaluate Fibrosis in Patients With Nonalcoholic Fatty Liver Disease. Clin Liver Dis (Hoboken). 2019;13(4):114–116. [DOI] [PMC free article] [PubMed] [Google Scholar]
- 8.Dodd GD 3rd, Baron RL, Oliver JH 3rd, Federle MP. Spectrum of imaging findings of the liver in end-stage cirrhosis: Part II, focal abnormalities. AJR Am J Roentgenol. 1999;173(5):1185–1192. [DOI] [PubMed] [Google Scholar]
- 9.Faria SC, Ganesan K, Mwangi I, et al. MR imaging of liver fibrosis: current state of the art. Radiographics. 2009;29(6):1615–1635. [DOI] [PMC free article] [PubMed] [Google Scholar]
- 10.Hartleb M, Gutkowski K, Milkiewicz P. Nodular regenerative hyperplasia: evolving concepts on underdiagnosed cause of portal hypertension. World J Gastroenterol. 2011;17(11):1400–1409. [DOI] [PMC free article] [PubMed] [Google Scholar]
- 11.Venkatesh SK, Xu S, Tai D, Yu H, Wee A. Correlation of MR elastography with morphometric quantification of liver fibrosis (Fibro-C-Index) in chronic hepatitis B. Magn Reson Med. 2014;72(4):1123–1129. [DOI] [PubMed] [Google Scholar]
- 12.Kim DW, Kim SY, Yoon HM, Kim KW, Byun JH. Comparison of technical failure of MR elastography for measuring liver stiffness between gradient-recalled echo and spin-echo echo-planar imaging: A systematic review and meta-analysis. J Magn Reson Imaging. 2020;51(4):1086–1102. [DOI] [PubMed] [Google Scholar]
- 13.Ichikawa S, Motosugi U, Ichikawa T, et al. Magnetic resonance elastography for staging liver fibrosis in chronic hepatitis C. Magn Reson Med Sci. 2012;11(4):291–297. [DOI] [PubMed] [Google Scholar]
- 14.Rustogi R, Horowitz J, Harmath C, et al. Accuracy of MR elastography and anatomic MR imaging features in the diagnosis of severe hepatic fibrosis and cirrhosis. J Magn Reson Imaging. 2012;35(6):1356–1364. [DOI] [PMC free article] [PubMed] [Google Scholar]
- 15.Venkatesh SK, Wang G, Lim SG, Wee A. Magnetic resonance elastography for the detection and staging of liver fibrosis in chronic hepatitis B. Eur Radiol. 2014;24(1):70–78. [DOI] [PubMed] [Google Scholar]
- 16.Lee Y, Lee JM, Lee JE, et al. MR elastography for noninvasive assessment of hepatic fibrosis: reproducibility of the examination and reproducibility and repeatability of the liver stiffness value measurement. J Magn Reson Imaging. 2014;39(2):326–331. [DOI] [PubMed] [Google Scholar]
- 17.Shire NJ, Yin M, Chen J, et al. Test-retest repeatability of MR elastography for noninvasive liver fibrosis assessment in hepatitis C. J Magn Reson Imaging. 2011;34(4):947–955. [DOI] [PMC free article] [PubMed] [Google Scholar]
- 18.Venkatesh SK, Wang G, Teo LL, Ang BW. Magnetic resonance elastography of liver in healthy Asians: normal liver stiffness quantification and reproducibility assessment. J Magn Reson Imaging. 2014;39(1):1–8. [DOI] [PubMed] [Google Scholar]
- 19.Hoodeshenas S, Welle CL, Navin PJ, et al. Magnetic Resonance Elastography in Primary Sclerosing Cholangitis: Interobserver Agreement for Liver Stiffness Measurement with Manual and Automated Methods. Acad Radiol. 2019;26(12):1625–1632. [DOI] [PubMed] [Google Scholar]
- 20.Chen J, Allen AM, Therneau TM, et al. Liver stiffness measurement by magnetic resonance elastography is not affected by hepatic steatosis. Eur Radiol. 2021. [DOI] [PMC free article] [PubMed] [Google Scholar]
- 21.Eaton JE, Dzyubak B, Venkatesh SK, et al. Performance of magnetic resonance elastography in primary sclerosing cholangitis. J Gastroenterol Hepatol. 2016;31(6):1184–1190. [DOI] [PMC free article] [PubMed] [Google Scholar]
- 22.Hoodeshenas S, Yin M, Venkatesh SK. Magnetic Resonance Elastography of Liver: Current Update. Top Magn Reson Imaging. 2018;27(5):319–333. [DOI] [PMC free article] [PubMed] [Google Scholar]
- 23.Venkatesh SK, Hoodeshenas S, Venkatesh SH, et al. Magnetic Resonance Elastography of Liver in Light Chain Amyloidosis. J Clin Med. 2019;8(5). [DOI] [PMC free article] [PubMed] [Google Scholar]
- 24.Charatcharoenwitthaya P, Sukonrut K, Korpraphong P, Pongpaibul A, Saiviroonporn P. Diffusion-weighted magnetic resonance imaging for the assessment of liver fibrosis in chronic viral hepatitis. PLoS One. 2021;16(3):e0248024. [DOI] [PMC free article] [PubMed] [Google Scholar]
- 25.Kocakoc E, Bakan AA, Poyrazoglu OK, et al. Assessment of Liver Fibrosis with Diffusion-Weighted Magnetic Resonance Imaging Using Different b-values in Chronic Viral Hepatitis. Med Princ Pract. 2015;24(6):522–526. [DOI] [PMC free article] [PubMed] [Google Scholar]
- 26.Horowitz JM, Venkatesh SK, Ehman RL, et al. Evaluation of hepatic fibrosis: a review from the society of abdominal radiology disease focus panel. Abdom Radiol (NY). 2017;42(8):2037–2053. [DOI] [PMC free article] [PubMed] [Google Scholar]
- 27.Bulow R, Mensel B, Meffert P, Hernando D, Evert M, Kuhn JP. Diffusion-weighted magnetic resonance imaging for staging liver fibrosis is less reliable in the presence of fat and iron. Eur Radiol. 2013;23(5):1281–1287. [DOI] [PubMed] [Google Scholar]
- 28.Petitclerc L, Sebastiani G, Gilbert G, Cloutier G, Tang A. Liver fibrosis: Review of current imaging and MRI quantification techniques. J Magn Reson Imaging. 2017;45(5):1276–1295. [DOI] [PubMed] [Google Scholar]
- 29.Morisaka H, Motosugi U, Glaser KJ, et al. Comparison of diagnostic accuracies of two- and three-dimensional MR elastography of the liver. J Magn Reson Imaging. 2017;45(4):1163–1170. [DOI] [PMC free article] [PubMed] [Google Scholar]
- 30.Li J, Venkatesh SK, Yin M. Advances in Magnetic Resonance Elastography of Liver. Magn Reson Imaging Clin N Am. 2020;28(3):331–340. [DOI] [PMC free article] [PubMed] [Google Scholar]
- 31.Deffieux T, Gennisson JL, Bousquet L, et al. Investigating liver stiffness and viscosity for fibrosis, steatosis and activity staging using shear wave elastography. J Hepatol. 2015;62(2):317–324. [DOI] [PubMed] [Google Scholar]
- 32.Watanabe H, Kanematsu M, Goshima S, et al. Staging hepatic fibrosis: comparison of gadoxetate disodium-enhanced and diffusion-weighted MR imaging--preliminary observations. Radiology. 2011;259(1):142–150. [DOI] [PubMed] [Google Scholar]
- 33.Goshima S, Kanematsu M, Watanabe H, et al. Gd-EOB-DTPA-enhanced MR imaging: prediction of hepatic fibrosis stages using liver contrast enhancement index and liver-to-spleen volumetric ratio. J Magn Reson Imaging. 2012;36(5):1148–1153. [DOI] [PubMed] [Google Scholar]
- 34.Kumazawa K, Edamoto Y, Yanase M, Nakayama T. Liver analysis using gadolinium-ethoxybenzyl-diethylenetriamine pentaacetic acid-enhanced magnetic resonance imaging: Correlation with histological grading and quantitative liver evaluation prior to hepatectomy. Hepatol Res. 2012;42(11):1081–1088. [DOI] [PubMed] [Google Scholar]
- 35.Hoffman DH, Ayoola A, Nickel D, Han F, Chandarana H, Shanbhogue KP. T1 mapping, T2 mapping and MR elastography of the liver for detection and staging of liver fibrosis. Abdom Radiol (NY). 2020;45(3):692–700. [DOI] [PubMed] [Google Scholar]
- 36.Thomaides-Brears HB, Lepe R, Banerjee R, Duncker C. Multiparametric MR mapping in clinical decision-making for diffuse liver disease. Abdom Radiol (NY). 2020;45(11):3507–3522. [DOI] [PMC free article] [PubMed] [Google Scholar]
- 37.Wang YXJ, Huang H, Zheng CJ, Xiao BH, Chevallier O, Wang W. Diffusion-weighted MRI of the liver: challenges and some solutions for the quantification of apparent diffusion coefficient and intravoxel incoherent motion. Am J Nucl Med Mol Imaging. 2021;11(2):107–142. [PMC free article] [PubMed] [Google Scholar]
- 38.Li YT, Cercueil JP, Yuan J, Chen W, Loffroy R, Wang YX. Liver intravoxel incoherent motion (IVIM) magnetic resonance imaging: a comprehensive review of published data on normal values and applications for fibrosis and tumor evaluation. Quant Imaging Med Surg. 2017;7(1):59–78. [DOI] [PMC free article] [PubMed] [Google Scholar]
- 39.Puchner SB, Lu MT, Mayrhofer T, et al. High-risk coronary plaque at coronary CT angiography is associated with nonalcoholic fatty liver disease, independent of coronary plaque and stenosis burden: results from the ROMICAT II trial. Radiology. 2015;274(3):693–701. [DOI] [PMC free article] [PubMed] [Google Scholar]
- 40.Sung KC, Jeong WS, Wild SH, Byrne CD. Combined influence of insulin resistance, overweight/obesity, and fatty liver as risk factors for type 2 diabetes. Diabetes Care. 2012;35(4):717–722. [DOI] [PMC free article] [PubMed] [Google Scholar]
- 41.Lonardo A, Ballestri S, Marchesini G, Angulo P, Loria P. Nonalcoholic fatty liver disease: a precursor of the metabolic syndrome. Dig Liver Dis. 2015;47(3):181–190. [DOI] [PubMed] [Google Scholar]
- 42.Hernando D, Levin YS, Sirlin CB, Reeder SB. Quantification of liver iron with MRI: state of the art and remaining challenges. J Magn Reson Imaging. 2014;40(5):1003–1021. [DOI] [PMC free article] [PubMed] [Google Scholar]
- 43.George DK, Goldwurm S, MacDonald GA, et al. Increased hepatic iron concentration in nonalcoholic steatohepatitis is associated with increased fibrosis. Gastroenterology. 1998;114(2):311–318. [DOI] [PubMed] [Google Scholar]
- 44.Bravo AA, Sheth SG, Chopra S. Liver biopsy. N Engl J Med. 2001;344(7):495–500. [DOI] [PubMed] [Google Scholar]
- 45.Rockey DC, Caldwell SH, Goodman ZD, Nelson RC, Smith AD, American Association for the Study of Liver D. Liver biopsy. Hepatology. 2009;49(3):1017–1044. [DOI] [PubMed] [Google Scholar]
- 46.Ratziu V, Charlotte F, Heurtier A, et al. Sampling variability of liver biopsy in nonalcoholic fatty liver disease. Gastroenterology. 2005;128(7):1898–1906. [DOI] [PubMed] [Google Scholar]
- 47.Reeder SB, Hu HH, Sirlin CB. Proton density fat-fraction: a standardized MR-based biomarker of tissue fat concentration. J Magn Reson Imaging. 2012;36(5):1011–1014. [DOI] [PMC free article] [PubMed] [Google Scholar]
- 48.Reeder SB, Sirlin CB. Quantification of liver fat with magnetic resonance imaging. Magn Reson Imaging Clin N Am. 2010;18(3):337–357, ix. [DOI] [PMC free article] [PubMed] [Google Scholar]
- 49.Starekova J, Reeder SB. Liver fat quantification: where do we stand? Abdom Radiol (NY). 2020;45(11):3386–3399. [DOI] [PMC free article] [PubMed] [Google Scholar]
- 50.Liu CY, McKenzie CA, Yu H, Brittain JH, Reeder SB. Fat quantification with IDEAL gradient echo imaging: correction of bias from T(1) and noise. Magn Reson Med. 2007;58(2):354–364. [DOI] [PubMed] [Google Scholar]
- 51.Yu H, McKenzie CA, Shimakawa A, et al. Multiecho reconstruction for simultaneous water-fat decomposition and T2* estimation. J Magn Reson Imaging. 2007;26(4):1153–1161. [DOI] [PubMed] [Google Scholar]
- 52.Yokoo T, Serai SD, Pirasteh A, et al. Linearity, Bias, and Precision of Hepatic Proton Density Fat Fraction Measurements by Using MR Imaging: A Meta-Analysis. Radiology. 2018;286(2):486–498. [DOI] [PMC free article] [PubMed] [Google Scholar]
- 53.Bydder M, Yokoo T, Hamilton G, et al. Relaxation effects in the quantification of fat using gradient echo imaging. Magn Reson Imaging. 2008;26(3):347–359. [DOI] [PMC free article] [PubMed] [Google Scholar]
- 54.Yu H, Shimakawa A, Hines CD, et al. Combination of complex-based and magnitude-based multiecho water-fat separation for accurate quantification of fat-fraction. Magn Reson Med. 2011;66(1):199–206. [DOI] [PMC free article] [PubMed] [Google Scholar]
- 55.Reeder SB, McKenzie CA, Pineda AR, et al. Water-fat separation with IDEAL gradient-echo imaging. J Magn Reson Imaging. 2007;25(3):644–652. [DOI] [PubMed] [Google Scholar]
- 56.Meisamy S, Hines CD, Hamilton G, et al. Quantification of hepatic steatosis with T1-independent, T2-corrected MR imaging with spectral modeling of fat: blinded comparison with MR spectroscopy. Radiology. 2011;258(3):767–775. [DOI] [PMC free article] [PubMed] [Google Scholar]
- 57.Hernando D, Kramer JH, Reeder SB. Multipeak fat-corrected complex R2* relaxometry: theory, optimization, and clinical validation. Magn Reson Med. 2013;70(5):1319–1331. [DOI] [PMC free article] [PubMed] [Google Scholar]
- 58.Kuhn JP, Hernando D, Munoz del Rio A, et al. Effect of multipeak spectral modeling of fat for liver iron and fat quantification: correlation of biopsy with MR imaging results. Radiology. 2012;265(1):133–142. [DOI] [PMC free article] [PubMed] [Google Scholar]
- 59.Tang A, Tan J, Sun M, et al. Nonalcoholic fatty liver disease: MR imaging of liver proton density fat fraction to assess hepatic steatosis. Radiology. 2013;267(2):422–431. [DOI] [PMC free article] [PubMed] [Google Scholar]
- 60.Campo CA, Hernando D, Schubert T, Bookwalter CA, Pay AJV, Reeder SB. Standardized Approach for ROI-Based Measurements of Proton Density Fat Fraction and R2* in the Liver. AJR Am J Roentgenol. 2017;209(3):592–603. [DOI] [PMC free article] [PubMed] [Google Scholar]
- 61.Bannas P, Kramer H, Hernando D, et al. Quantitative magnetic resonance imaging of hepatic steatosis: Validation in ex vivo human livers. Hepatology. 2015;62(5):1444–1455. [DOI] [PMC free article] [PubMed] [Google Scholar]
- 62.Hines CD, Yu H, Shimakawa A, McKenzie CA, Brittain JH, Reeder SB. T1 independent, T2* corrected MRI with accurate spectral modeling for quantification of fat: validation in a fat-water-SPIO phantom. J Magn Reson Imaging. 2009;30(5):1215–1222. [DOI] [PMC free article] [PubMed] [Google Scholar]
- 63.Hines CD, Yu H, Shimakawa A, et al. Quantification of hepatic steatosis with 3-T MR imaging: validation in ob/ob mice. Radiology. 2010;254(1):119–128. [DOI] [PMC free article] [PubMed] [Google Scholar]
- 64.Pooler BD, Hernando D, Ruby JA, Ishii H, Shimakawa A, Reeder SB. Validation of a motion-robust 2D sequential technique for quantification of hepatic proton density fat fraction during free breathing. J Magn Reson Imaging. 2018;48(6):1578–1585. [DOI] [PMC free article] [PubMed] [Google Scholar]
- 65.Allkemper T, Sagmeister F, Cicinnati V, et al. Evaluation of fibrotic liver disease with whole-liver T1rho MR imaging: a feasibility study at 1.5 T. Radiology. 2014;271(2):408–415. [DOI] [PubMed] [Google Scholar]
- 66.Rauscher I, Eiber M, Ganter C, et al. Evaluation of T1rho as a potential MR biomarker for liver cirrhosis: comparison of healthy control subjects and patients with liver cirrhosis. Eur J Radiol. 2014;83(6):900–904. [DOI] [PubMed] [Google Scholar]
- 67.Takayama Y, Nishie A, Asayama Y, et al. T1 rho Relaxation of the liver: A potential biomarker of liver function. J Magn Reson Imaging. 2015;42(1):188–195. [DOI] [PubMed] [Google Scholar]
- 68.Lee MJ, Kim MJ, Yoon CS, Han SJ, Park YN. Evaluation of liver fibrosis with T2 relaxation time in infants with cholestasis: comparison with normal controls. Pediatr Radiol. 2011;41(3):350–354. [DOI] [PubMed] [Google Scholar]
- 69.Feier D, Balassy C, Bastati N, Fragner R, Wrba F, Ba-Ssalamah A. The diagnostic efficacy of quantitative liver MR imaging with diffusion-weighted, SWI, and hepato-specific contrast-enhanced sequences in staging liver fibrosis--a multiparametric approach. Eur Radiol. 2016;26(2):539–546. [DOI] [PubMed] [Google Scholar]
- 70.Obmann VC, Marx C, Berzigotti A, et al. Liver MRI susceptibility-weighted imaging (SWI) compared to T2* mapping in the presence of steatosis and fibrosis. Eur J Radiol. 2019;118:66–74. [DOI] [PubMed] [Google Scholar]
- 71.Chen BB, Hsu CY, Yu CW, et al. Dynamic contrast-enhanced magnetic resonance imaging with Gd-EOB-DTPA for the evaluation of liver fibrosis in chronic hepatitis patients. Eur Radiol. 2012;22(1):171–180. [DOI] [PubMed] [Google Scholar]
- 72.Hagiwara M, Rusinek H, Lee VS, et al. Advanced liver fibrosis: diagnosis with 3D whole-liver perfusion MR imaging--initial experience. Radiology. 2008;246(3):926–934. [DOI] [PubMed] [Google Scholar]
- 73.Xie S, Sun Y, Wang L, Yang Z, Luo J, Wang W. Assessment of liver function and liver fibrosis with dynamic Gd-EOB-DTPA-enhanced MRI. Acad Radiol. 2015;22(4):460–466. [DOI] [PubMed] [Google Scholar]