Abstract
What is already known about this topic?
In recent decades, the prevalence of food allergy has increased worldwide; however, a comprehensive estimate of the prevalence of food allergy and allergens in China is not yet available.
What is added by this report?
By searching the English databases PubMed, Embase, Cochrane Library, and Chinese databases CNKI, Wanfang Data, and VIP Chinese epidemiological studies on food allergy, the probability of food allergy in China and related influencing factors were determined.
What are the implications for public health practice?
The findings of this study provide up-to-date estimates of the prevalence of food allergy rates in China in terms of age, gender, and the eight major food allergens.
Keywords: Chinese, food allergies, food allergens, prevalence
Food allergy is a pathological, potentially fatal, immune response induced by food protein antigens (1). In recent decades, the prevalence of food allergy has increased worldwide, but there is no comprehensive estimation of the prevalence of food allergy and food allergens in Chinese scientific literature. To evaluate the above content, we searched for Chinese epidemiological studies of food allergy in different databases. We selected 24 cross-sectional studies from 9,767 publications and extracted data for statistical analysis. Our results show that different regions, ages, gender, food types, and other factors can cause different food allergy rates. These reviews provide up-to-date estimates of the frequency of food allergy in China in general and in particular, indicating that the prevalence of specific food allergy in China is significantly different from that in the West.
The Codex Alimentarius Commission (CAC) has stipulated the food or ingredients that must be marked on the label of prepackaged food, including gluten, crustaceans, eggs, fish, peanuts, soybeans, milk, and nuts (2). These special food substances are often referred to as “priority food allergens” because they account for more than 90% of all food allergic reactions (3). In Asia, allergic reactions to shellfish and fish are more common than those to nuts, peanuts, and wheat (4). Most of the allergens proposed by China and other countries and regions have been modified based on the eight categories proposed by CAC, and less consideration is given to the prevalence of different food allergens in different geographical regions. Considering the different dietary habits of different countries and races, determining food allergens for the management of allergic patients is vital and can prevent extensive dietary restrictions. In this systematic review and meta-analysis, we aimed to determine the prevalence of food allergy and allergenicity of specific food allergens in the Chinese population.
We searched PubMed, EMBASE, and Cochrane Library in English and CNKI, Wanfang Data, and VIP databases in Chinese for the epidemiological studies of food allergy in China, published from January 1, 2000 to 2021. There were no limits to the type of literature and the language. Key words include allergen, allergy, hypersensitivity, China, Chinese, prevalence, and epidemiology. To select the most suitable articles and to extract the data of the selected articles, evaluation tables and data extraction tables were respectively applied. The expert committee finally evaluated the article and ruled out inappropriate articles after discussing the dispute (Supplementary Figure S1, available in http://weekly.chinacdc.cn).
The following data were extracted from the final selected articles: study date, region, sample size, age range, gender, result evaluation method, number of food allergy, and allergic food (Supplementary Table S1, available in http://weekly.chinacdc.cn). The American Health Care Quality and Research Institution scale was used to evaluate the quality of the literature. Stata State (version 15.0; Institute Stata Corp LLC. U.S.) was used for data analysis. Detailed experimental methods are in Supplementary Materials, available in http://weekly.chinacdc.cn.
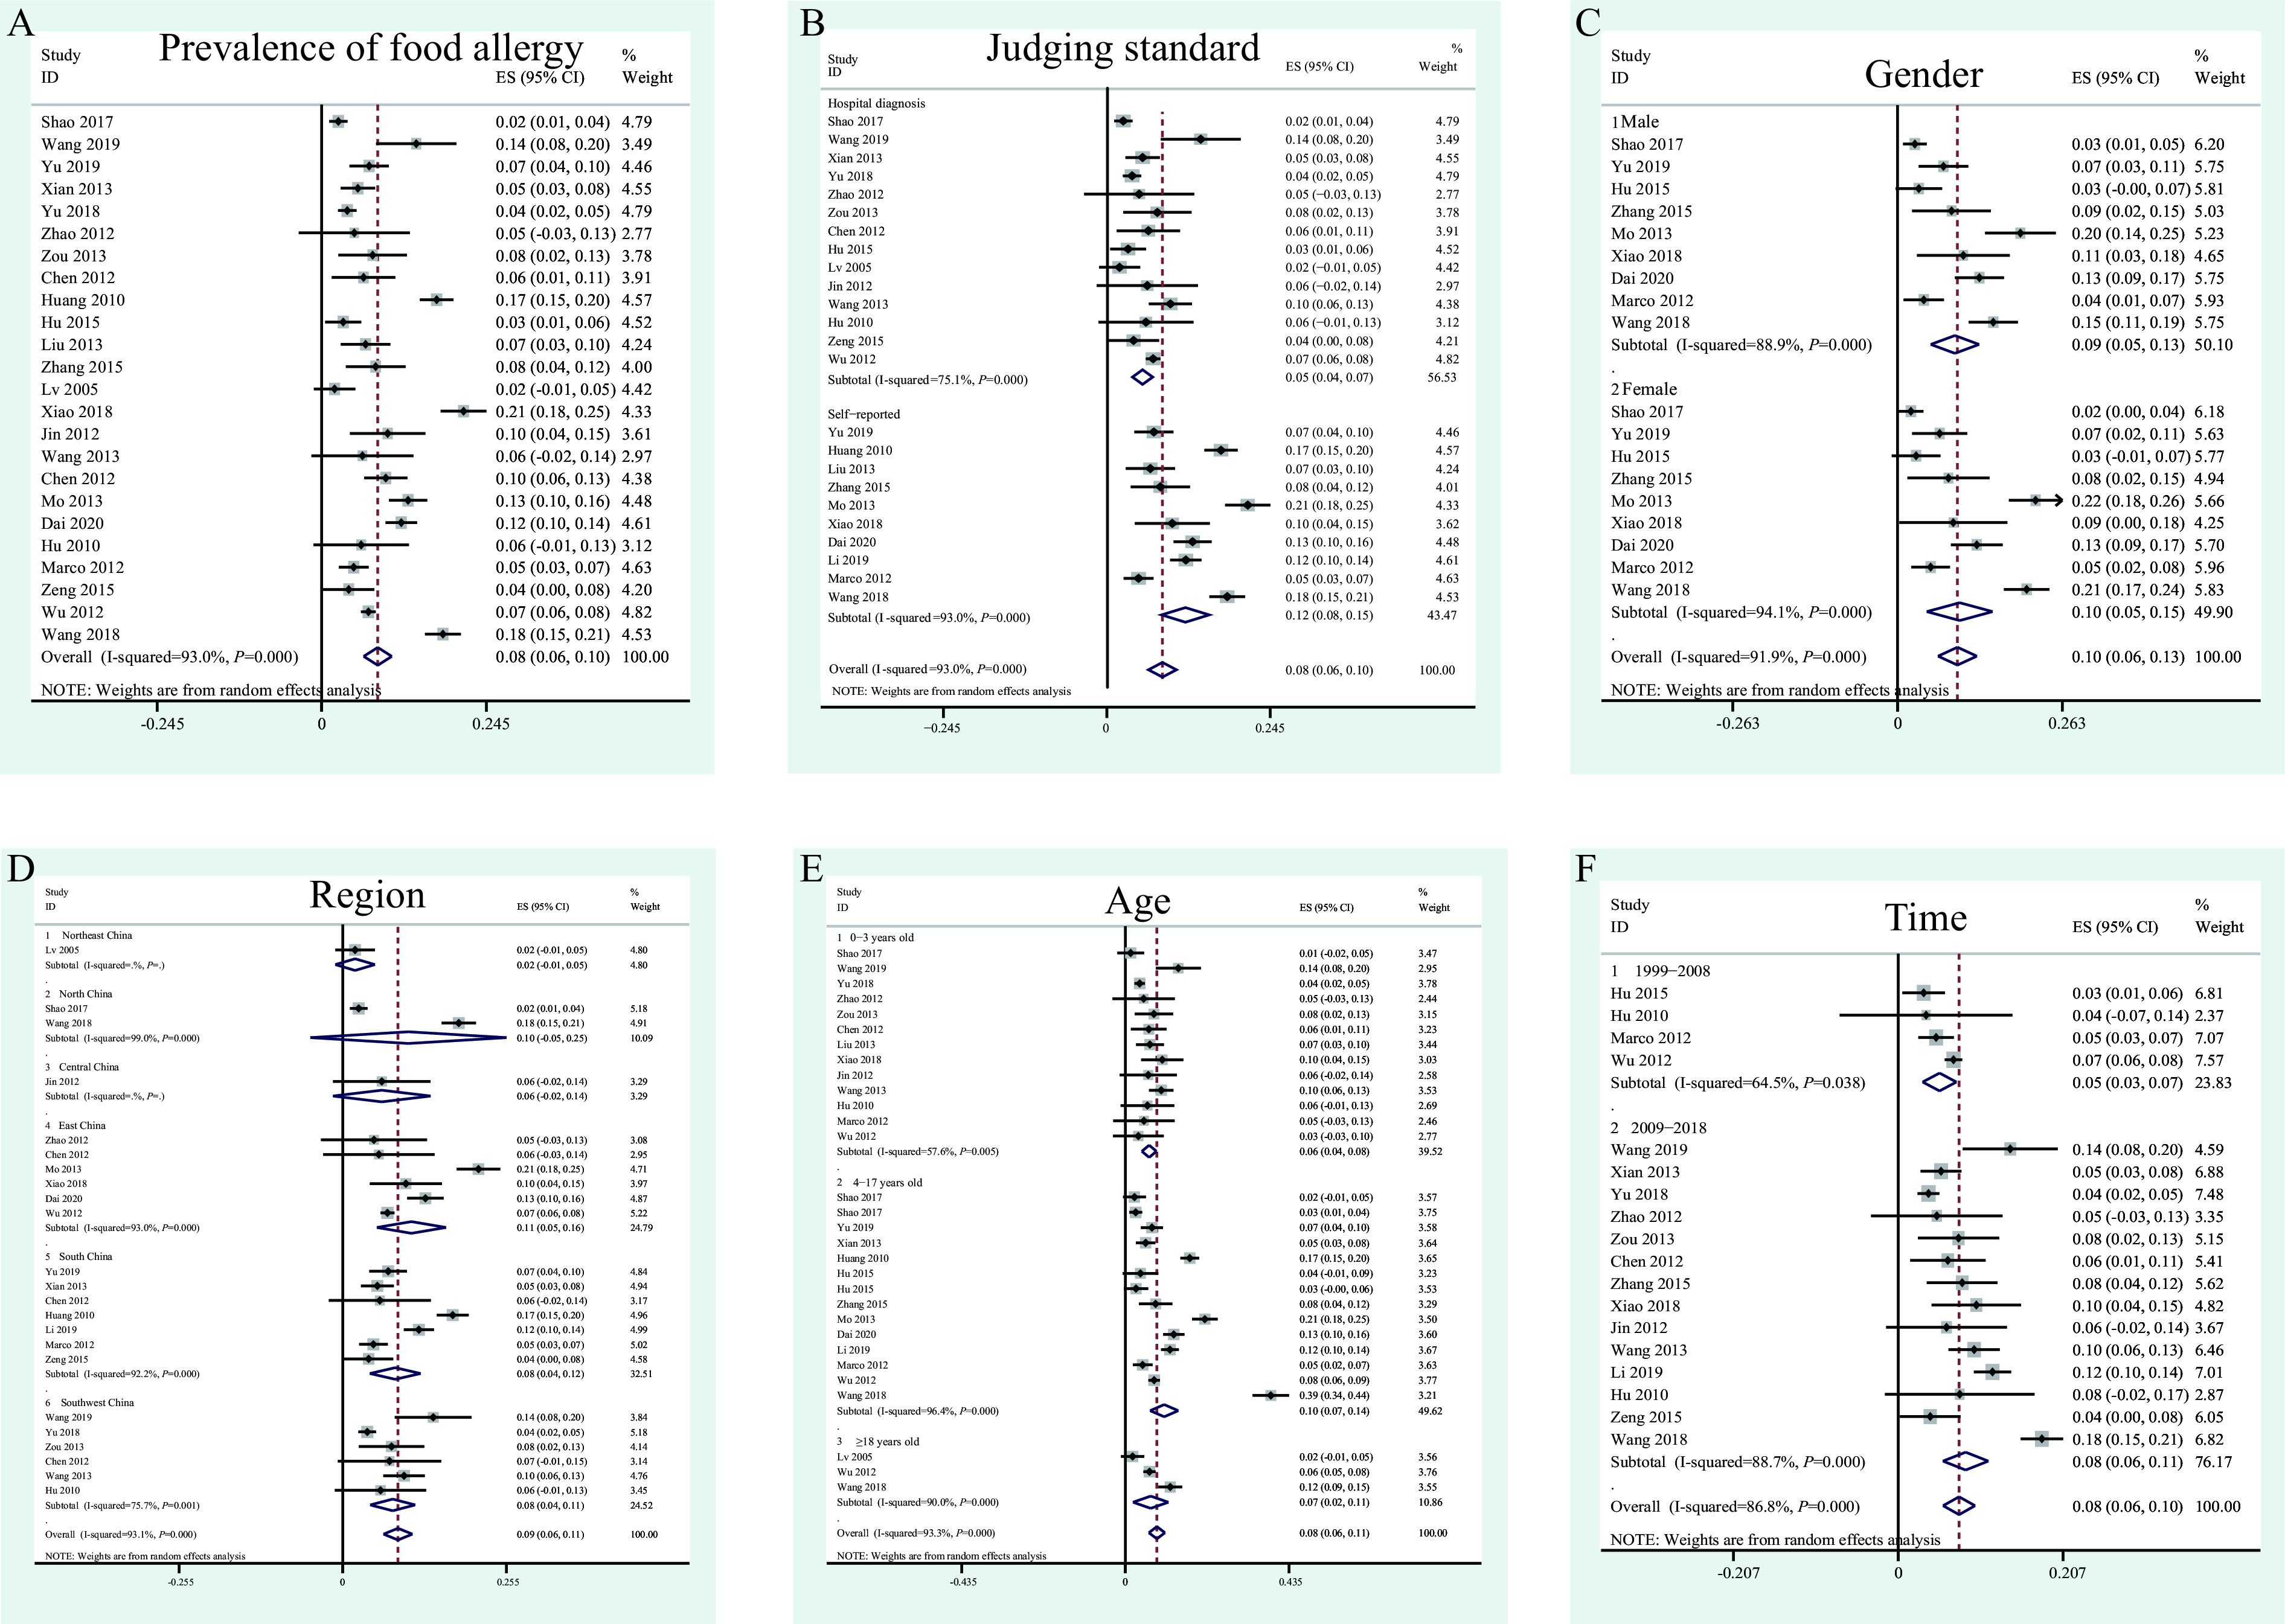
We selected 24 studies from 9,767 publications in this field, with data from 138,740 children and adults who met the inclusion criteria for the meta-analysis. Participants included infants, children, and adults of all ages. The combined prevalence of self-reported and hospital-diagnosed food allergy was 8% [95% confidence interval (CI): 6%–10%, P<0.05] (Figure 1A). The self-reported prevalence rate of food allergy was 12% (95% CI: 8%–15%), while that of hospital-diagnosed food allergy was 5% (95% CI: 4%–7%) (Figure 1B). In addition, the prevalence of food allergy in males and females were 9% (95% CI: 5%–13%) and 10% (95% CI: 5%–15%), respectively (Figure 1C). According to the scope of sample cities, we divided them into Northeast, North China, Central China, East China, South China, and Southwest for analysis. Owing to data limitations, no effective studies on Northeast, North, and Central China were observed (Figure 1D). The prevalence of food allergy in East China was 11% (95% CI: 6%–15%), higher than that in South China (8%; 95% CI: 4%–12%) and Southwest China (8%; 95% CI: 4%–11%). Furthermore, the prevalence of food allergy in children aged 4–17 years was the highest (10%; 95% CI: 7%–14%), followed by that in adults (7%; 95% CI: 2%–11%) and infants 6% (95% CI: 4%–8%) (Figure 1E). The results also showed that the prevalence of food allergy from 2009–2018 was 8% (95% CI: 6%–11%), higher than that in 1999–2008 (5%; 95% CI: 3%–7%) (Figure 1F), indicating that the prevalence of food allergy in China is on the rise.
Figure 1.

Prevalence of food allergy in Chinese. (A) Overall prevalence of food allergy. (B) The difference between the prevalence of self-report (questionnaire survey) and hospital confirmed food allergy. (C) Prevalence of food allergy in male and female. (D) Prevalence of food allergy in different regions. (E) Prevalence of food allergy in different ages. (F) Prevalence of food allergy in different time periods.
Note: In the figure, group 1 represents questionnaire survey, and group 2 represents hospital diagnosis. Diagnosis methods include SPT, sIgE, FE, ET, OFC, or clinical history of hospital diagnosis.
Abbreviation: SPT=skin prick test; sIgE=serum-specific immunoglobulin E; FE=food elimination test; ET=Allergic patients Exclusion Diet Test; OFC=Open Food Challenge; ES=effect size; CI=confidence interval.
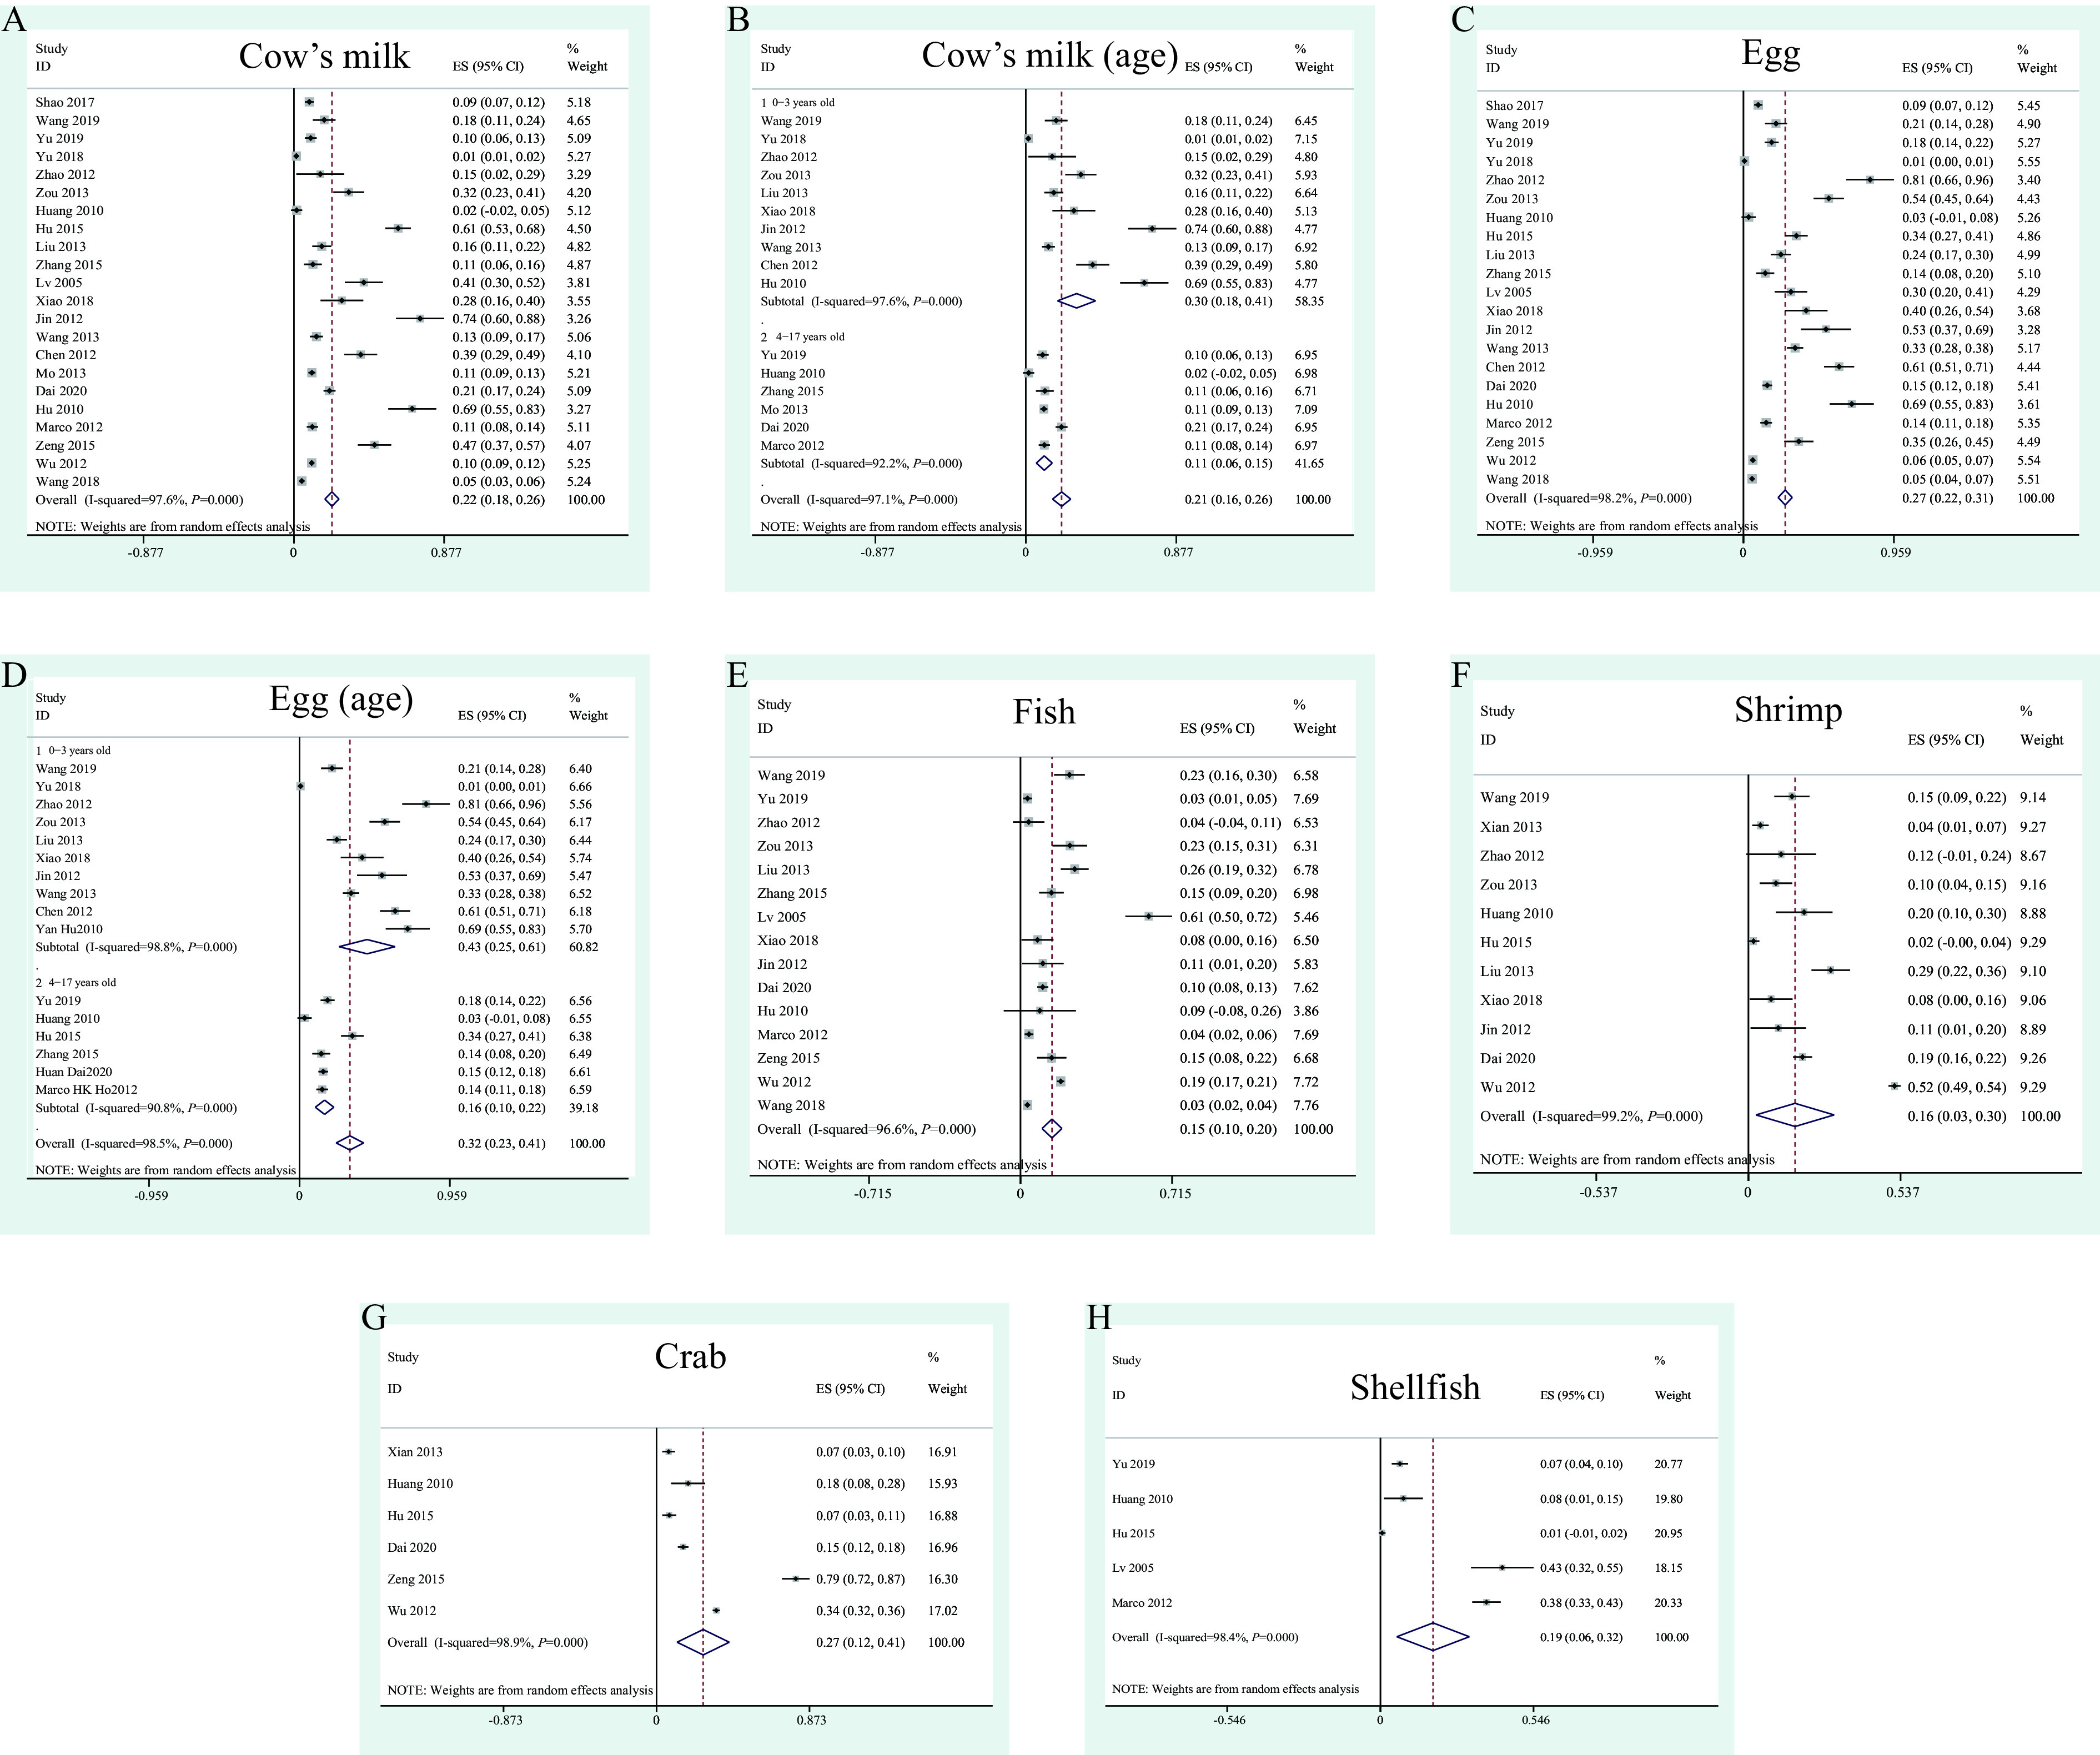
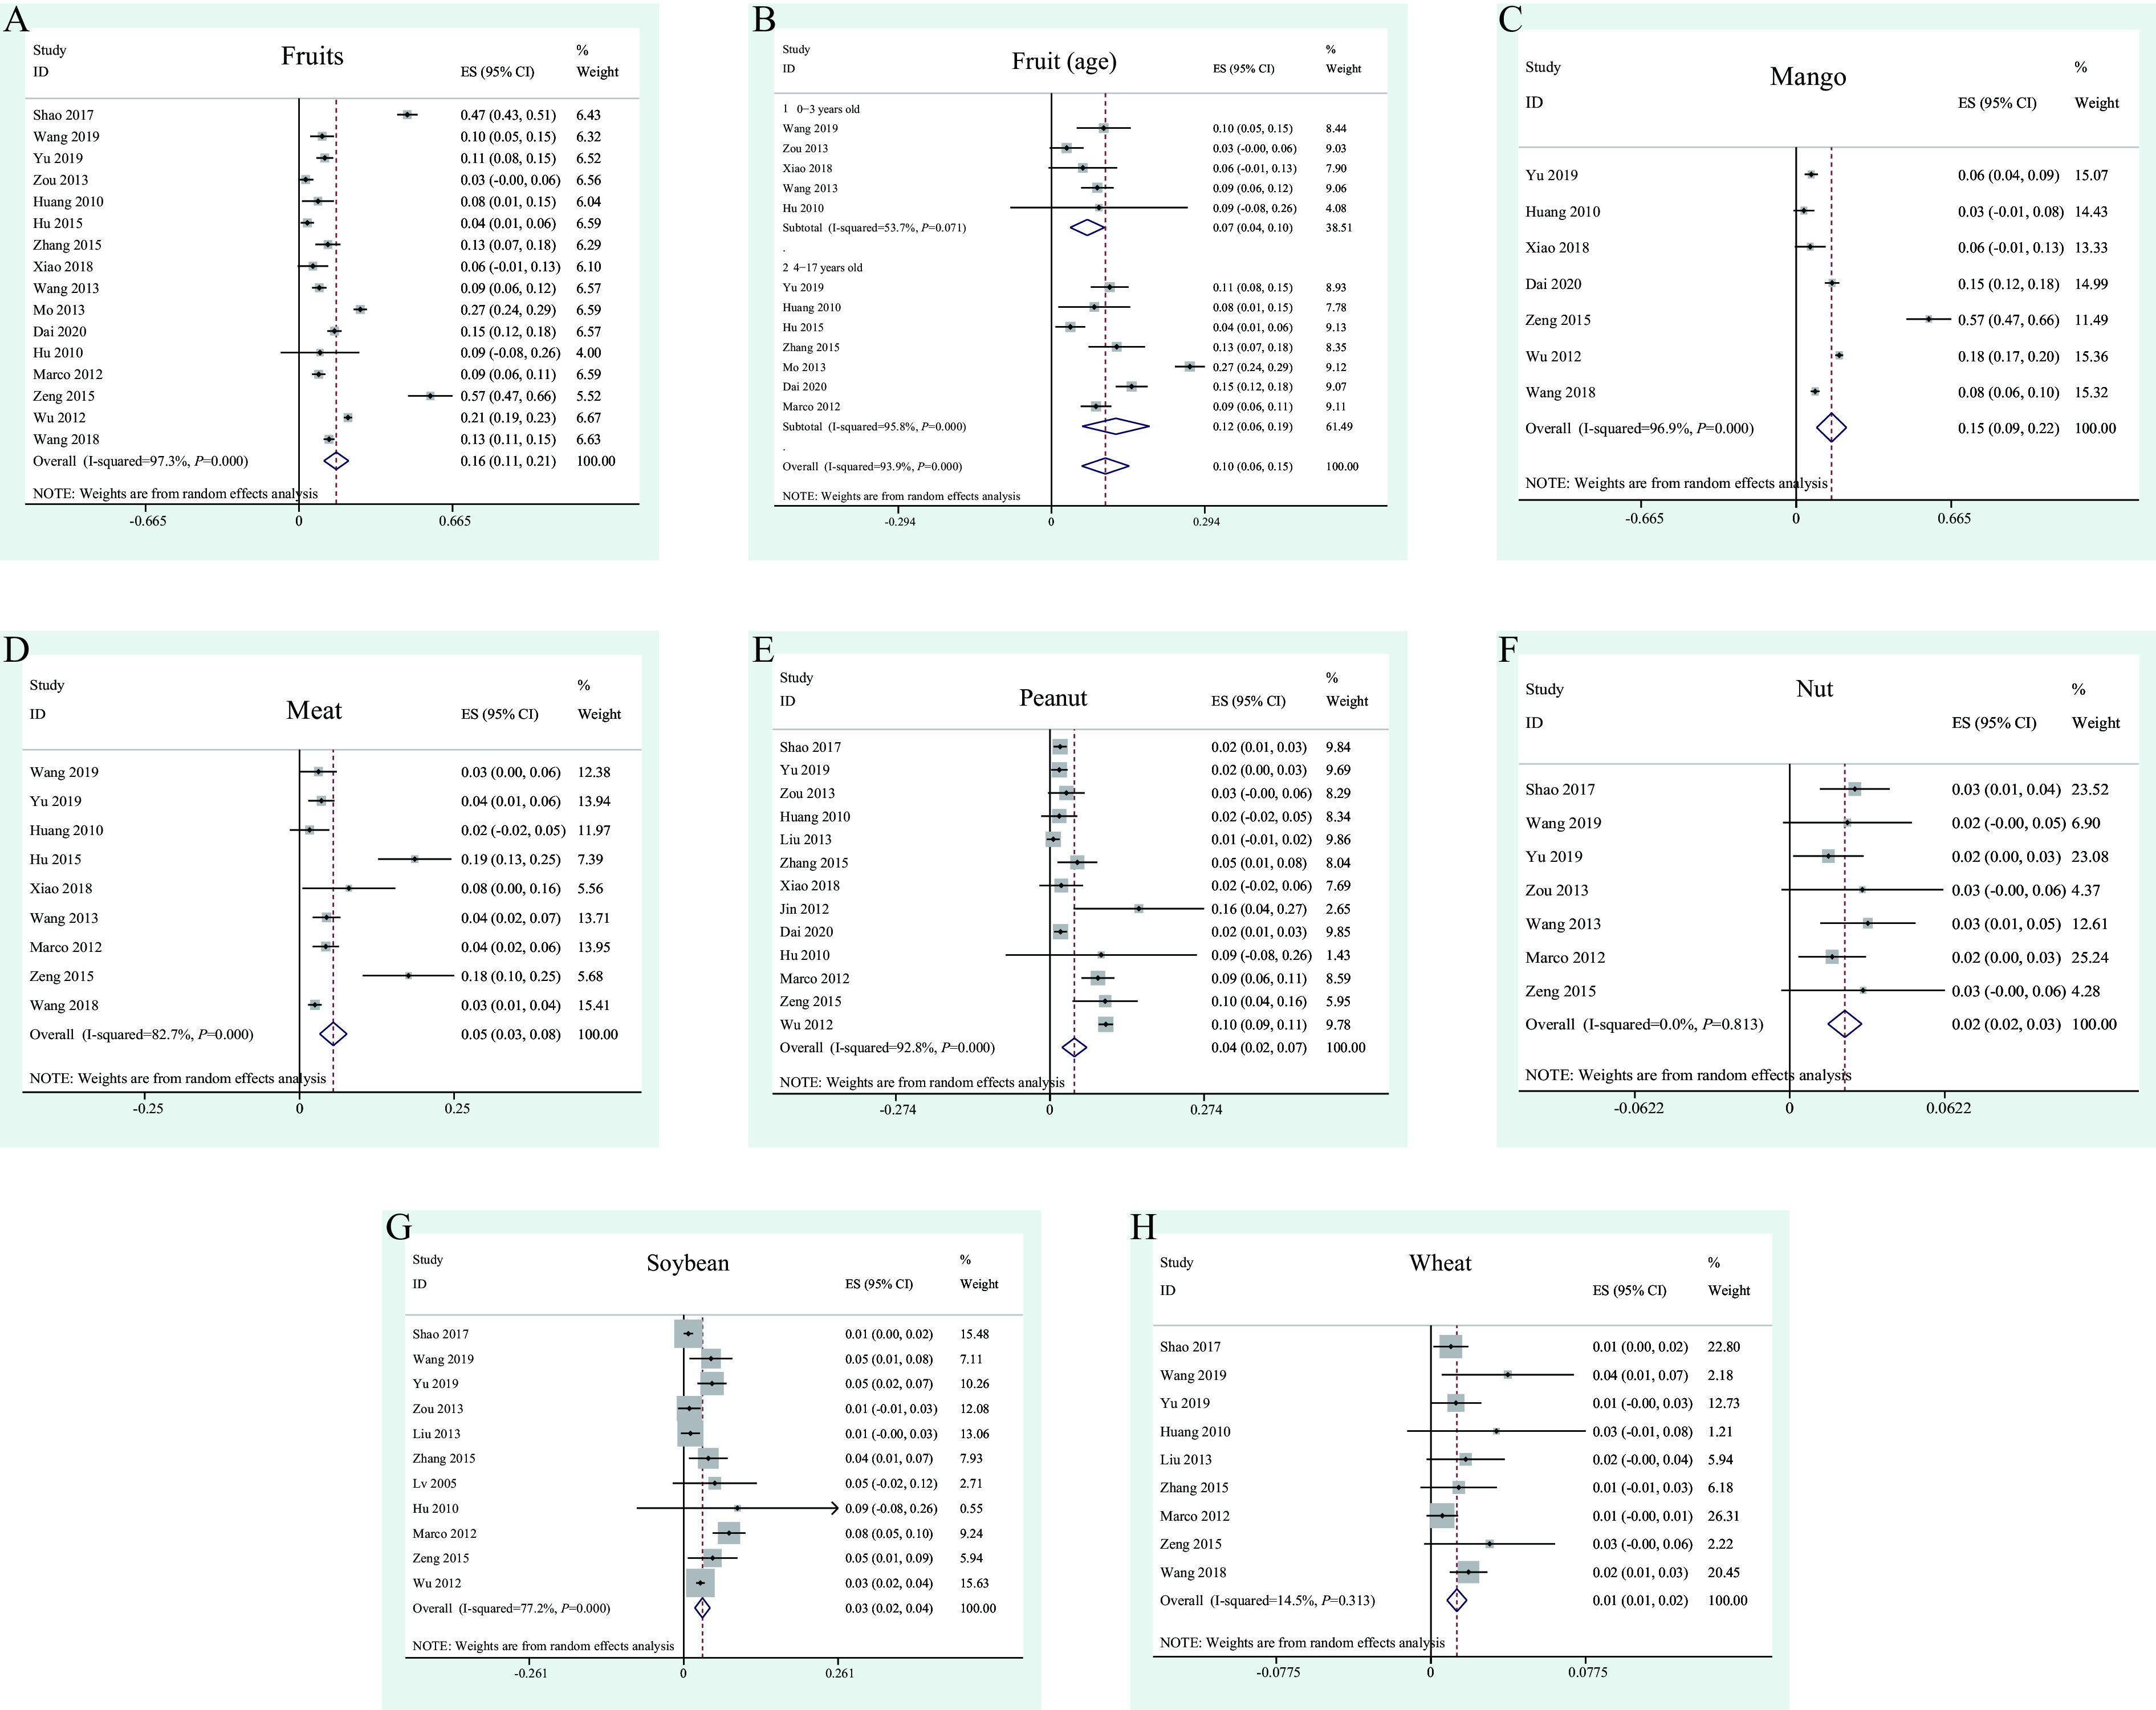
The proportion of different types of food allergies to the total number of patients with food allergies in China was measured. A total of 22% of the patients have cow’s milk allergy (Figure 2A). Furthermore, 0–3 year old infants were more likely to be allergic to milk than to all kinds of food allergens (95% CI: 18%–41%) (Figure 2B). In addition, 27% (95% CI: 22%–31%) of the patients have egg allergy (Figure 2C). Infants were more likely to be allergic to eggs than children (Figure 2D). Fish allergy was observed in 15% (95% CI: 10%–20%) of the total patients with food allergy (Figure 2E), while shrimp allergy was observed in 16% (95% CI: 3%–30%) of the patients (Figure 2F). Crab allergy accounted for 27% (95% CI: 12%–41%) (Figure 2G), while shellfish allergies accounted for 19% (95% CI: 6%–32%) (Figure 3H). A total of 16% (95% CI: 11%–21%) of the patients have fruit allergies (Figure 3A). Contrary to egg and milk allergies, fruit allergies were more common in children than in infants (Figure 3B). Specifically, we extracted the data for mango allergy, the most studied allergic fruit. The proportion of patients with mango allergy was 15% (95% CI: 9%–22%) (Figure 3C). Furthermore, patients with meat allergies accounted for 5% (95% CI: 3%–8%) (Figure 3D). Patients with peanut allergies accounted for 4% (95% CI: 2%–7%) of the total food allergy patients (Figure 3E), while those with nut allergies accounted for 2% (95% CI: 2%–3%) (Figure 3F). Soybean allergies were observed in 3% (95% CI: 2%–4%) of the patients (Figure 3G), whereas wheat allergies were observed in 1% (95% CI: 1%–2%) of the patients (Figure 3H).
Figure 2.

Prevalence of milk, egg, and aquatic product allergy in patients with food allergy. (A) Cow’s milk. (B) Different ages of cow’s milk allergy patients. (C) Egg. (D) Egg allergy rates in different age groups. (E) Fish. (F) Shrimp. (G) Crab. (H) Shellfish.
Abbreviation: ES=effect size; CI=confidence interval.
Figure 3.

Prevalence of fruit, meat, peanut, nut, soybean, and wheat allergy in patients with food allergy. (A) Fruits, including mangoes, peaches, pineapples, oranges, dates, apples, cherries, tomatoes, kiwifruit, and other. (B) Different ages of fruit allergy patients. (C) Mango. (D) Meat, including beef, mutton, chicken. (E) Peanut. (F) Nut. (G) Soybean. (H) Wheat.
Abbreviation: ES=effect size; CI=confidence interval.
DISCUSSION
In our survey, milk allergy was found to be one of the most important food allergens for infant food allergies. In the study of Chen et al., milk is the main allergen of children under two years old, and children with milk allergy will exhibit “milk refusal” and other manifestations in the process of OFC (5). Although milk allergy is more common in children, it does not mean that there are no milk allergy in adults. In a study in Taiwan, China, 7.5% of the people over 19 years old with food allergy still had milk allergy (6). In our study, egg allergy accounted for 27% of the total food allergy patients.
According to CAC, fish and crustaceans are two of the eight allergens in aquatic products. In western countries, allergy to crab aquatic products is more common in crab processing workers who are sensitized by inhalation (7). In China, a large number of aquatic product allergies have been reported in infants under one year old. Studies have shown that up to 42.3% of children with food allergy are allergic to aquatic products (8). Compared with eggs, milk, peanuts, and other allergic foods, fruit allergy is not common in the West, and no fruits are classified as allergens requiring identification by CAC. In our study, fruit allergy accounted for 16% of the total food allergies patients. In our study, the proportion of mango allergy patients of the total food allergy patients was 15%, which was much higher than that of common western allergens such as peanuts and nuts. In our study, meat allergy patients accounted for 5% of the total food allergy patients, mainly beef allergy patients. Although the prevalence of meat allergy is not high, there are great differences among the studies included in this paper. These differences may be due to different criteria for determining food allergy, or to different meat ranges defined in different studies. Studies have shown that Asian children have relatively low rates of allergy to peanuts and nuts (9), which is confirmed by our study. In our study, peanut and nut allergies accounted for 4% and 2% of the total food allergy patients, respectively. Soybean is considered to be one of the eight most important food allergens. Population based meta-analysis of European countries showed that the prevalence of soybean allergy was 0.4% (10). In our study, soybean allergy patients accounted for 3% of the total food allergy patients.
This study was subject to some limitations. In order to accurately calculate the prevalence of food allergy in the general population of China, this paper only includes community-based studies, excluding hospital-based studies, limiting the statistical analysis of specific food allergens, and lacking the statistics of the prevalence of specific food allergy in allergic diseases.
This study shows that different regions, ages, gender, food types, and other factors can cause different food allergy rates. This study provides some reference information for dealing with food allergy symptoms caused by different influencing factors and provides reference for formulating relevant food allergy prevention policies.
References
- 1.Yu W, Freeland DMH, Nadeau KC Food allergy: immune mechanisms, diagnosis and immunotherapy. Nat Rev Immunol. 2016;16(12):751–65. doi: 10.1038/nri.2016.111. [DOI] [PMC free article] [PubMed] [Google Scholar]
- 2.Food and Agricultural Organization of the United Nations, The International Atomic Energy Agency, World Health Organization. Revision of the recommended international general standard for irradiated foods and of the recommended international code of practice for the operation of radiation facilities used for the treatment of foods. 1981. https://inis.iaea.org/collection/NCLCollectionStore/_Public/14/742/14742020.pdf?r=1. [2021-1-21].
- 3.Boye JI Food allergies in developing and emerging economies: need for comprehensive data on prevalence rates. Clin Transl Allergy. 2012;2(1):25. doi: 10.1186/2045-7022-2-25. [DOI] [PMC free article] [PubMed] [Google Scholar]
- 4.Hill DJ, Hosking CS, Zhie CY, Leung R, Baratwidjaja K, Iikura Y, et al The frequency of food allergy in Australia and Asia. Environ Toxicol Pharmacol. 1997;4(1-2):101–10. doi: 10.1016/S1382-6689(97)10049-7. [DOI] [PubMed] [Google Scholar]
- 5.Chen J, Hu Y, Allen KJ, Ho MHK, Li HQ The prevalence of food allergy in infants in Chongqing, China. Pediatr Allergy Immunol. 2011;22(4):356–60. doi: 10.1111/j.1399-3038.2011.01139.x. [DOI] [PubMed] [Google Scholar]
- 6.Wu TC, Tsai TC, Huang CF, Chang FY, Lin CC, Huang IF, et al Prevalence of food allergy in Taiwan: a questionnaire-based survey. Intern Med J. 2012;42(12):1310–5. doi: 10.1111/j.1445-5994.2012.02820.x. [DOI] [PubMed] [Google Scholar]
- 7.Bønløkke JH, Gautrin D, Sigsgaard T, Lehrer SB, Maghni K, Cartier A Snow crab allergy and asthma among Greenlandic workers-a pilot study. Int J Circumpolar Health. 2012;71(1):19126. doi: 10.3402/ijch.v71i0.19126. [DOI] [PMC free article] [PubMed] [Google Scholar]
- 8.Lv XZ, Liu XM, Yang XG Preliminary survey on status of food allergy in young Chinese students. Chin J Food Hyg. 2005;17(2):119–21. doi: 10.13590/j.cjfh.2005.02.008. [DOI] [Google Scholar]
- 9.Shek LPC, Cabrera-Morales EA, Soh SE, Gerez I, Ng PZ, Yi FC, et al A population-based questionnaire survey on the prevalence of peanut, tree nut, and shellfish allergy in 2 Asian populations. J Allergy Clin Immunol. 2010;126(2):324–31.e7. doi: 10.1016/j.jaci.2010.06.003. [DOI] [PubMed] [Google Scholar]
- 10.Nwaru BI, Hickstein L, Panesar SS, Roberts G, Muraro A, Sheikh A, et al Prevalence of common food allergies in Europe: a systematic review and meta-analysis. Allergy. 2014;69(8):992–1007. doi: 10.1111/all.12423. [DOI] [PubMed] [Google Scholar]


