

Abstract
Background
Infection with rhinovirus (RV) is a major risk factor for disease exacerbations in patients with allergic asthma. This study analysed a broad set of cytokines in the noses of children and adults with asthma during RV infection in order to identify immunophenotypes that may link to virus‐induced episodes.
Methods
Nasal wash specimens were analysed in children (n = 279 [healthy, n = 125; stable asthma, n = 64; wheeze, n = 90], ages 2–12) who presented to a hospital emergency department, and in adults (n = 44 [healthy, n = 13; asthma, n = 31], ages 18–38) who were experimentally infected with RV, including a subset who received anti‐IgE. Cytokines were measured by multiplex bead assay and data analysed by univariate and multivariate methods to test relationships to viral load, allergic status, airway inflammation, and clinical outcomes.
Results
Analysis of a core set of 7 cytokines (IL‐6, CXCL8/IL‐8, IL‐15, EGF, G‐CSF, CXCL10/IP‐10 and CCL22/MDC) revealed higher levels in children with acute wheeze versus those with stable asthma or controls. Multivariate analysis identified two clusters that were enriched for acutely wheezing children; one displaying high viral load (“RV‐high”) with robust secretion of CXCL10, and the other displaying high IgE with elevated EGF, CXCL8 and both eosinophil‐ and neutrophil‐derived mediators. Broader assessment of 39 cytokines confirmed that children with acute wheeze were not deficient in type 1 anti‐viral responses. Analysis of 18 nasal cytokines in adults with asthma who received RV challenge identified two clusters; one that was “RV‐high” and linked to robust induction of anti‐viral cytokines and anti‐IgE; and the other associated with more severe symptoms and a higher inflammatory state featuring eosinophil and neutrophil factors.
Conclusions
The results confirm the presence of different immunophenotypes linked to parameters of airway disease in both children and adults with asthma who are infected with RV. Such discrepancies may reflect the ability to regulate anti‐viral responses.
Keywords: asthma, chemokines, clinical immunology, omics‐ and systems biology, virus
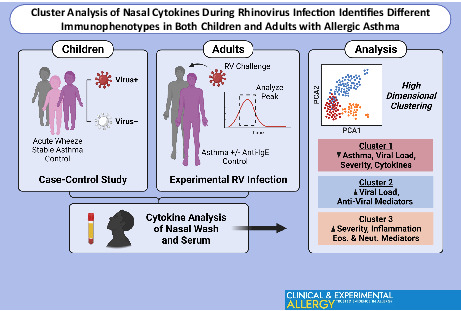
Unsupervised analysis of nasal cytokines in children and adults with asthma during RV infection identified two distinct clusters associated with asthma; one defined by high viral load with increased production of specific anti‐viral mediators, and the other featuring high IgE and worse airway symptoms in the presence of a higher inflammatory state. These immunophenotypes may reflect differences in the ability to regulate anti‐viral responses in patients with asthma. Graphical abstract created with BioRender.com.
Key Messages
Cluster analysis of complex mediators identifies common features in children and adults with asthma who are infected with rhinovirus.
One immunophenotype defined by robust induction of specific anti‐viral mediators links to the presence of higher viral loads.
A different immunophenotype consisting of globally enhanced cytokines and granulocyte‐derived mediators, indicates a propensity to dysregulated anti‐viral immunity.
1. INTRODUCTION
Infection with rhinovirus (RV) is recognized as a major risk factor for acute wheeze in children with allergic asthma. An interaction between the allergic status of the host and virus infection appears to be a critical factor in promoting wheeze, as evidenced by reduced disease exacerbations in children with asthma who receive anti‐IgE therapy. 1 In furtherance of this notion, other work has demonstrated a synergistic interaction between serum IgE levels to dust mite allergen and the risk of acute wheeze in children living in Costa Rica where dust mite exposure is high. 2
Despite this knowledge, the underlying immune mechanisms for RV‐induced acute episodes of asthma are unclear. It has been proposed that deficient anti‐viral responses, and innate interferons in particular, may impede viral clearance at the epithelial barrier, leading to increased viral loads and consequent inflammatory responses. 3 , 4 , 5 , 6 , 7 , 8 , 9 Alternatively, or perhaps in combination, RV infection may worsen pre‐existing type 2 inflammation in patients with asthma who are allergic. 10 , 11 However, recent studies imply that the picture is more complex. For example, in experimental RV‐infection models, patients with allergic asthma were found to display similar viral loads to those in healthy controls, and levels of virus‐induced interferons and other type 1 mediators found in the airways were also comparable, or else actually increased. 12 , 13 , 14 , 15 Moreover, analysis of T cells by our group, which are a critical component of downstream adaptive immunity to viruses, revealed that anti‐viral Th1 responses were augmented in allergic asthma. Specifically, higher numbers of virus‐specific Th1 cells were induced in the blood of subjects with allergic asthma during acute RV infection as compared with healthy individuals. 14 Notably, amplification of Th1 cells was accompanied by a parallel expansion of allergen‐specific Th2 cells in the blood and mixed cytokine signatures in the nose, thereby confirming the interplay between type 1 and type 2 immunity in asthmatic patients infected with RV.
Innate immune events at the epithelial barrier set the stage for downstream T‐cell responses. Data from cultured bronchial epithelial cells and epithelial scrapings obtained from asthmatic patients who are infected with RV indicate that the airway epithelium in patients with allergic asthma is “primed” to respond differently, or else in an exaggerated fashion to virus. 16 , 17 We recently reported increased expression of genes encoding inflammatory mediators in epithelial scrapings, even before infection, and RV challenge induced markedly dysregulated expression of a large number of genes that persisted for several days. 18
Children are especially susceptible to acute wheezing episodes caused by RV. To date, most studies in children have examined immune profiles associated with wheeze in the blood 19 , 20 , 21 , 22 , examined nasal gene expression using transcriptomic methods 23 , 24 , focused on targeted nasal cytokines 24 , 25 , 26 , 27 , or utilized univariate analytical methods. 28 Given that different asthma endotypes are known to exist, we theorized that a comprehensive assessment of nasal mediators was warranted in the context of RV infection, including examination of relationships to viral load, allergic status, and respiratory symptoms. Here, by applying unsupervised analytical methods to multiplex cytokine data, we report the presence of different immunophenotypes in patients with allergic asthma who are infected with RV. Existing specimens were analysed from children and young adults whose infection and clinical status were well characterized in the context of natural or experimental infection. Our results support the presence of different inflammatory states that may relate to the ability to control anti‐viral responses in the upper airways of asthmatic patients who are allergic.
2. METHODS
2.1. Human subjects
2.1.1. Children
Samples were analysed from a paediatric case–control study that was performed in partnership with the Hospital Nacional de Niños in San José, Costa Rica, a region with high dust mite exposure and high asthma prevalence. Details of the paediatric cohort are published. 2 Briefly, children (ages 2–12, n = 279) were enrolled upon presentation to the emergency department, and categorized as: (1) Those with acute wheezing illness who were referred for acute care nebulization; (2) those with stable asthma presenting to the emergency department for non‐wheezing conditions; and (3) non‐asthmatic control subjects presenting to the emergency department (Table S1A). Children with acute wheeze were significantly younger than those without asthma (Table S1B). As previously reported, use of asthma medication (bronchodilator, controller, or both) within the previous 12 months was similar between children with acute wheeze and those with stable asthma, although those with stable asthma reported higher daily use of nasal and inhaled steroids. 2 Nasal wash samples were obtained at the time of presentation.
2.1.2. Adults
Specimens were analysed from adults (ages 18–38, n = 44) who participated in a previous study of experimental infection with RV‐A16. 12 This included: (1) Subjects with mild allergic asthma (n = 11); (2) subjects with mild allergic asthma who were enrolled in a double‐blind placebo‐controlled trial involving treatment for 8 weeks with anti‐IgE (Omalizumab) prior to RV challenge and throughout the challenge phase (n = 20 subjects in treated and placebo groups); and (3) healthy non‐allergic controls (n = 13) (Table S2). 12 , 14 Nasal lavage specimens were obtained during RV infection (days 0–4, 7), as well as immediately prior to administration of anti‐IgE, if applicable (day −56). Additional details on study subjects, clinical assessments, and nasal sampling can be found in this article's Supplemental Information, and in published reports. 12 , 14
Studies in children were approved by the University of Virginia Human Investigations Committee (Protocol #12342) and the Ethics Committee of the Hospital Nacional de Niños. Studies in adults were approved by the Food and Drug Administration, the National Institute of Allergy and Infectious Diseases Safety Committee, and the University of Virginia Human Investigations Committee (Protocols #12673 and #14427; ClinicalTrials.gov ID: NCT02111772, NCT02388997). All adults gave written informed consent, and children provided informed assent with parental informed consent.
2.2. Cytokine assays and data
Cytokines were measured by multiplex bead assay according to the manufacturer's instructions (Milliplex MAP Magnetic Bead Assays, EMD Millipore). Eosinophilic cationic protein (ECP/RNASE3) was measured by ImmunoCAP (Phadia). Eosinophil‐derived neurotoxin (EDN/RNASE2), neutrophil elastase, and myeloperoxidase (MPO) were measured by ELISA (EDN: MBL International Corp.; NE: Hycult Biotech; MPO: R&D Systems, Inc.). Mediator assays were performed in children for the purpose of the present study. For adults, an existing dataset generated by the same methods was used from the original study. 14
2.3. Statistical analysis
Investigator‐selected nasal cytokine analyses were assessed using restricted maximum likelihood (REML) mixed models with Geisser–Greenhouse and family‐wise error rate corrections for all cytokines (Figures 1, 11 cytokines; Figures 5, 21 cytokines), or else for all cytokines selected for cluster analysis (Figures 2, 7 cytokines; Figures 6, 18 cytokines). All other between‐group comparisons at single time points were performed using the Mann–Whitney test (two groups) or the Kruskal–Wallis test with Dunn's multiple comparisons correction (three groups). Comparisons of asthma and RV‐infection status among subject clusters were performed using the Chi‐Square test. Statistical analyses were performed using R (version 4.0.2) and GraphPad Prism (version 8.4.3). Analysis of existing cytokine data in adults involved new univariate and multi‐variate analyses for the purpose of validating findings in children.
FIGURE 1.
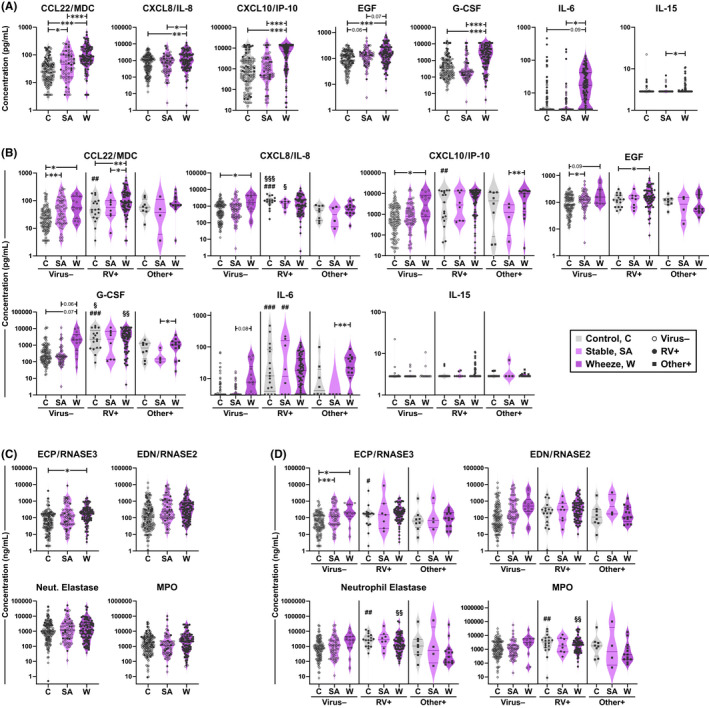
Pro‐inflammatory cytokines are increased in the nose of acutely wheezing children. Nasal mediators were measured in 279 children who presented to a hospital emergency department. (A and B) Levels of cytokines measured by a 7‐plex bead assay for asthma groups (A) and RV infection subgroups (B). (C and D) Levels of eosinophil‐ and neutrophil‐derived mediators measured by ImmunoCAP (ECP) and ELISA (EDN, Neut. Elastase, MPO) for asthma groups (C) and RV infection subgroups (D). Horizontal lines denote the median and interquartile range. Neut., Neutrophil. C, control (n = 125); SA, stable asthma (n = 64); W, wheeze (n = 90). Mixed effects model (REML) with Tukey correction (between‐group); Mann–Whitney test (RV+ vs. virus−/other virus+). *p ≤ .05, **p ≤ .01, ***p ≤ .001. #Within‐group comparison for RV+ versus virus– subjects; §Within‐group comparison for RV+ versus other virus+ subjects
FIGURE 5.
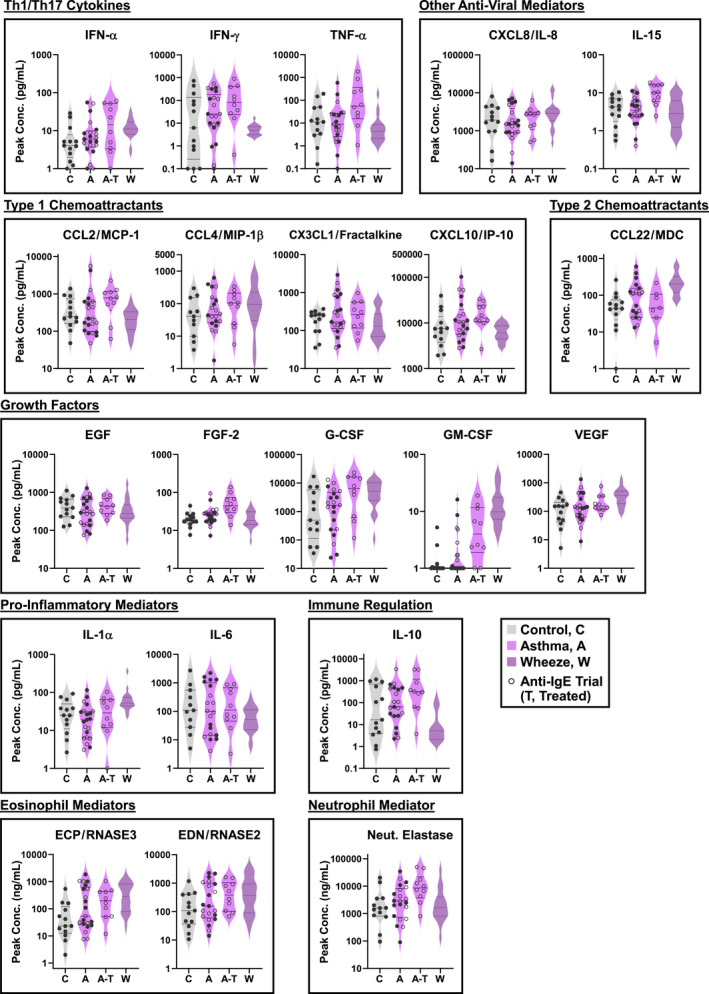
Profile of nasal mediators in adults with asthma during an experimental RV infection. Peak levels of 21 nasal mediators in subjects with asthma (A, n = 21) and healthy controls (C, n = 13). Open symbols denote subjects with asthma enrolled in a trial of anti‐IgE with RV challenge, including those who received anti‐IgE (A–T, n = 10) and placebo (A, n = 10). For the purposes of data analysis, the placebo group was incorporated into the asthma group (n = 21). Cytokine levels in children with acute wheeze are shown for visual comparison (W, n = 20). Neut., neutrophil. Mixed effects model (REML) with Sidak correction (Control vs. Asthma, Anti‐IgE vs. Placebo). *p ≤ .05
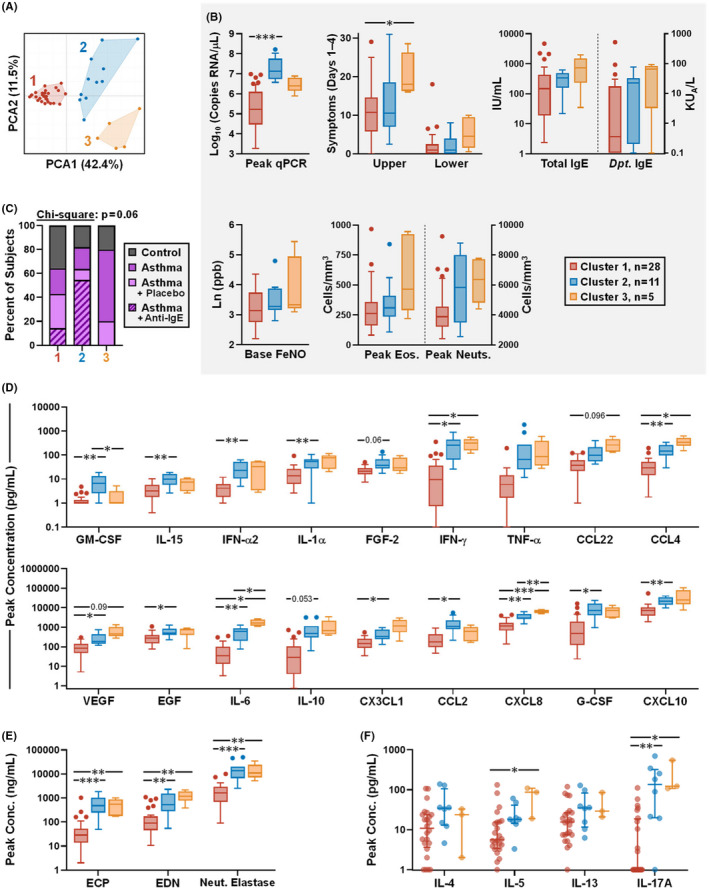
FIGURE 2.
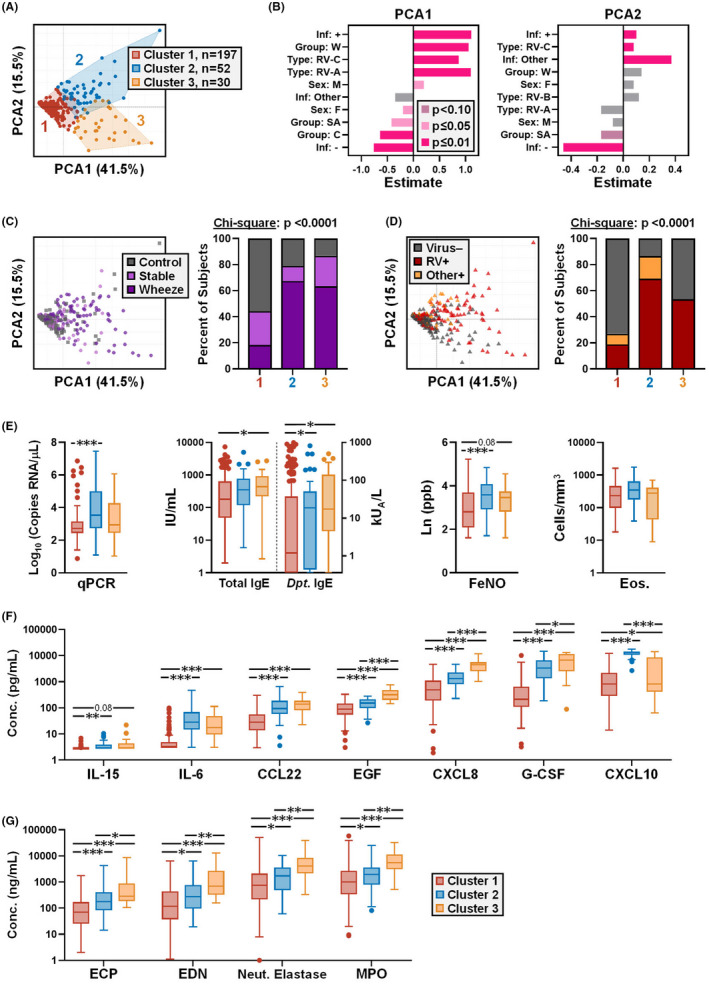
Different cytokine immunophenotypes link to viral load and IgE in children. (A) PCA and clustering of nasal cytokines in the paediatric cohort (n = 279) using a 7‐plex dataset. (B) Relationship of infection status, RV species, sex, and asthma group to principal components 1 and 2. Values represent t‐tests for each parameter analysed by FactoMineR 29 . (C and D) PCA plots (left) with bar charts (right) showing the percentage of subjects in each cluster by asthma group (C), and viral infection status (D). (E) Analysis of cytokine clusters for viral load, total and dust mite‐specific IgE, exhaled FeNO, and blood eosinophil counts (Eos.). (F and G) Analysis of clusters for 7‐plex cytokines (F) and eosinophil‐ and neutrophil‐derived mediators (G), in order of increasing concentration. Data shown as Tukey boxplots in E–G. Kruskal‐Wallis test with Dunn's correction (between‐cluster; E and G); Mixed effects model (REML) with Tukey correction (between‐cluster; F). Neut., neutrophil. *p ≤ .05, **p ≤ .01, ***p ≤ .001
FIGURE 6.
Different cytokine immunophenotypes link to viral load and symptoms in adults infected with RV. (A) PCA and clustering of nasal cytokines using an 18‐plex cytokine dataset. (B) Analysis of cytokine clusters for viral load; respiratory symptoms (sum symptom score, days 1–4); total and dust mite‐specific IgE; exhaled FeNO at baseline; and peak blood eosinophil and neutrophil counts. (C) The percentage of subjects in each cluster by group (healthy controls [n = 13], adults with asthma [n = 21, including 10 subjects in the placebo group of an anti‐IgE trial], and adults with asthma who received anti‐IgE [n = 10]). (D and E) Analysis of clusters for peak levels of 18‐plex nasal mediators used for clustering analysis, in order of increasing concentration (D), and peak levels of eosinophil and neutrophil mediators in nasal washes (E). (F) Analysis of clusters for Th2 and Th17 cytokines on day 4 of infection, as measured in nasal lining fluid in a subset of individuals (Cluster #1, n = 24; Cluster #2, n = 8; Cluster #3, n = 3). Neut., neutrophil. Kruskal‐Wallis test with Dunn's correction (between‐cluster; B, E and F); Mixed effects model (REML) with Tukey correction (between‐cluster; D). *p ≤ .05, **p ≤ .01, ***p ≤ .001
2.4. Dimensionality reduction and cluster analysis
High‐dimensional data analysis was performed using PCA and hierarchical clustering in R (FactoMineR package). 29 Subject clustering was performed using only nasal mediators. In order to prevent the skewing of results, in the event of missing data, FactoMineR imputed data points were excluded from subsequent between‐cluster comparisons. Optimal cluster numbers were determined as described in this article's online supplement. Annotated heatmaps of scaled cytokine data were created using ComplexHeatmaps. 30
3. RESULTS
3.1. Pro‐Inflammatory cytokines are increased in the nose of acutely wheezing children
Nasal wash specimens were analysed in a paediatric cohort (n = 279) enrolled in a cross‐sectional case–control study through the emergency department at the Hospital Nacional de Niños in San José, Costa Rica. 2 Children were grouped according to acute wheeze, stable asthma, and controls without asthma (Table S1A). PCR testing for RV infection revealed markedly higher positivity rates for children with acute wheeze (70.0%) versus those with stable asthma (12.5%) and controls (15.2%) (p < .0001) (Figure S1A). Infection with non‐RV respiratory viruses occurred in a minority of patients (10.4% overall positivity for RSV, coronavirus [229E, OC43, NL63], HMPV, adenovirus, parainfluenza [PIV3, PIV1], and influenza [FluA, FluB], in order of decreasing prevalence). Previous work demonstrated a synergistic effect of IgE to dust mite (D. pteronyssinus) and RV infection on risk for acute wheeze in this cohort 2 . As expected, serum IgE (total and dust mite‐specific) and exhaled nitric oxide (FeNO) were elevated in children with acute wheeze and stable asthma versus controls (Table S1B, Figures S1B,C).
As a first step, a multiplex assay of seven cytokines was used to test whether children with acute wheeze displayed increased cytokine production in their nose. Cytokines selected for study included airway remodelling factors (EGF, G‐CSF), virus‐induced mediators (IL‐6, CXCL8/IL‐8, IL‐15), and chemoattractants for Th1 and Th2 cells (CXCL10/IP‐10 and CCL22/MDC, respectively). All cytokines, with the exception of EGF and IL‐15, were present at higher levels in children with acute wheeze versus those with stable asthma and controls (p ≤ .05) (Figure 1A). Analysis of subgroups by RV‐infection status revealed that in virus‐negative children, G‐CSF, IL‐6, and CXCL10/IP‐10 trended higher in those with acute wheeze versus stable asthma (Figure 1B). In RV+ children with acute wheeze, only CCL22/MDC was further elevated as compared with their stable asthmatic counterparts (Figure 1B). Moreover, cytokine levels were generally higher for RV+ children regardless of asthma status, and were positively correlated with RV viral load (p ≤ .01). Higher levels of G‐CSF, CXCL8/IL‐8, and CXCL10/IP‐10 discriminated RV+ from virus‐negative controls, and levels of these cytokines were comparable for RV+ controls and those with acute wheeze. Moreover, levels of G‐CSF and CXCL8 were elevated in RV+ subgroups versus those who were positive for other viruses. Assessment of eosinophil‐derived mediators in separate assays, including ECP/RNASE3 and the anti‐viral factor EDN/RNASE2, showed higher levels in children with acute wheeze and stable asthma versus controls, although only ECP remained significant after multiple comparisons adjustment (Figure 1C). There were no differences by RV status, except for higher ECP in RV+ versus virus‐negative controls (Figure 1D). By contrast, although levels of neutrophil‐derived mediators (neutrophil elastase and MPO) did not differ significantly between asthma and control groups, levels were higher in RV+ versus virus– controls, and in children with acute wheeze who were RV+ versus those who were positive for other viruses (Figures 1C,D). Together, these findings demonstrate production of higher levels of pro‐inflammatory and anti‐viral mediators in acutely wheezing children, concomitant with eosinophil‐ and neutrophil‐derived mediators.
3.2. Cluster analysis links different cytokine immunophenotypes to viral load and IgE
Since single‐parameter analysis did not discriminate cytokine profiles in relation to RV‐associated wheeze, we next performed unsupervised multi‐parameter assessments. Complex cytokine signatures were analysed in relation to viral load and asthma using principal components analysis (PCA) followed by unsupervised clustering of 7‐plex cytokine data. For rigour, granulocyte‐derived mediators were excluded from the analysis owing to their assessment by different assays. By this method, three discrete clusters were identified (Figure 2A). Analysis of cluster relationships to subject attributes identified significant positive associations with the first principal component for wheeze and infection with RV‐A and RV‐C viruses (p < .0001), whereas stable asthma and control groups trended negatively (Figure 2B). RV‐B was only detected in 1.8% of children. These results aligned with the link between RV‐A and RV‐C strains, but not RV‐B, as triggers of acute asthma episodes. 31 Further analysis revealed that, although wheezing children were present in all clusters, clusters #2 and #3 were enriched for both acute wheeze and RV+ children, whereas cluster #1 was enriched for controls and virus‐negative subjects (Figures 2C,D). This is in keeping with our previous finding that children with high IgE titers to dust mite who are infected with RV are at increased risk for acute wheeze. 2 Analysis of quantitative viral PCR data showed the highest viral loads for cluster #2 (median = 92,481 copies RNA/μl [95% CI: 2033–22,925]) versus clusters #1 and #3 (533.8 [358.3–858.8] and 898.1 [447.7–8018], respectively) (Figure 2E). By contrast, IgE levels were elevated in clusters #2 and #3, with the highest levels observed for cluster #3 (geometric mean [gm] = 384.4 IU/ml [95% CI: 225.9–654.2] vs. 168.0 [132.7–212.8] and 294.0 [200.9–430.2] for clusters #1 and #2 respectively), as was FeNO (Figure 2E). Eosinophil counts did not differ between clusters (Figure 2E). Analysis of inflammatory mediators revealed that cluster #2 (designated “RV‐high”) displayed the highest levels of CXCL10/IP‐10, a Th1 chemoattractant that is induced by IFNs 32 (p < .001 versus other clusters). By contrast, EGF, G‐CSF, CXCL8/IL‐8, and eosinophil‐ and neutrophil‐derived factors were highest in cluster #3 (designated “Type 2‐high”) (p < .05 versus other clusters) (Figure 2F–G). This signature was notable given the contributions of eosinophils and neutrophils to allergic disease and RV infection, respectively, and the known link between CXCL8/IL‐8 and symptom severity during RV infection. 33 Together, these findings confirmed different immunophenotypes in children with acute wheeze; one defined by robust type 1 immunity with high viral load, and the other by elevated EGF, CXCL8/IL‐8, and mixed granulocyte mediators.
3.3. Type 1 responses are amplified in the nose of children with acute wheeze
Next, to further assess profiles linked to wheeze and rhinovirus infection, we performed a broader exploratory assessment of 39 mediators in the nose and matched serum samples in a subset of 38 children representative of the full cohort by disease group and infection status (Table S3). Single‐parameter analysis in the nose revealed that levels of type 1 mediators (IFN‐α2, IFN‐γ, CXCL10/IP‐10), growth factors (G‐CSF, EGF, VEGF), and other pro‐inflammatory/anti‐viral mediators (IL‐6, IL‐7, IL‐15, sCD40L) were increased in acute wheeze versus stable asthma (p ≤ .05)(Figure 3). Although type 2 cytokines (IL‐4, IL‐5, IL‐9, IL‐13) did not differ between these groups, IL‐5 and IL‐13 were higher in both asthma groups versus controls (p ≤ .09). Cytokines in the nose and serum were not correlated (data not shown), and the only notable finding in serum was elevated IL‐5 and IL‐10 in wheezing children versus other groups (p ≤ .05 and ≤.001, respectively) (Figure S2). Heatmap analysis revealed that children who produced the highest levels of multiple cytokines in the nose were infected with RV, and the majority of these had acute wheeze. Patterns of nasal cytokine expression were highly variable between each child, and type 1 chemoattractants, type 2 cytokines, and anti‐viral factors featured prominently in these RV+ children (Figure 4). Unsupervised cluster analysis of the 39‐plex dataset of nasal cytokines identified a cluster that secreted higher levels of multiple cytokines and was defined on the basis of RV infection, but not asthma status (Cluster B, Figure S3). Formation of this cluster was driven by cytokines common to anti‐viral responses, including IFN‐γ, IL‐12p40, IL‐12p70, IL‐7, IL‐15, sCD40L, and CCL3/MIP‐1α, and was mainly comprised of individuals assigned to clusters #2 and #3 in the 7‐plex cluster analysis (50% and 30% of Cluster B, respectively) (Figure S3F). Unsupervised cluster analysis of serum cytokines found no significant relationships (data not shown). Collectively, these data confirm amplified type 1 mediators in the nose of wheezing children and their link to RV infection, despite a type 2 cytokine milieu.
FIGURE 3.
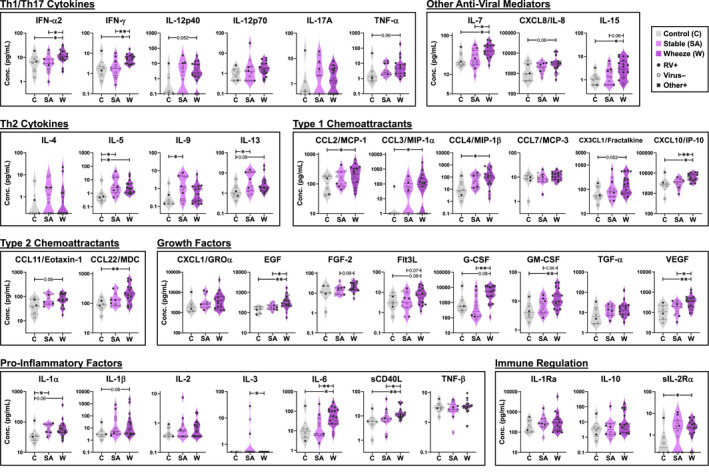
Broad assessment of inflammatory mediators in nasal washes of children. Levels are shown for 39 mediators in a representative subset of 38 children (C, n = 6; SA, n = 12; W, n = 20). Kruskal‐Wallis test with Dunn's correction (between‐group). *p ≤ .05, **p ≤ .01, ***p ≤ .001
FIGURE 4.
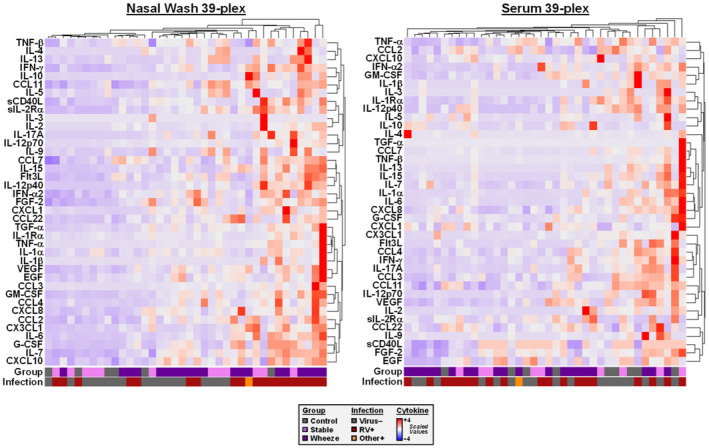
Heatmaps generated using a 39‐plex dataset for mediators in nasal washes and sera of children. Data is shown for a representative subset of 38 children. Values were scaled for comparison in nasal washes (left) and sera (right). Bars at the bottom of each heatmap denote disease group and viral infection status
3.4. Profile of nasal mediators in adults with asthma during an experimental RV infection
Next, we questioned whether distinct immunophenotypes could be identified in an experimental RV‐challenge model. Experimental infection overcomes some limitations of studies of natural RV infection, including variable sampling times and infection with different virus strains. New analyses were performed on an existing dataset of 21 nasal mediators in adults with mild allergic asthma (n = 31) and healthy controls (n = 13) who received RV‐A16 challenge. 12 , 14 This included data from subjects enrolled in a placebo‐controlled trial of anti‐IgE (n = 10 per group) initiated 8 weeks before RV challenge with maintenance throughout the challenge phase (Table S2, Figure S4). 12 , 14 Anti‐IgE had no significant effect on levels of nasal mediators before RV challenge (Table S4).
We previously reported the ability for RV to induce robust levels of type 1 mediators in the nose of asthmatic subjects in this model 14 . Here, as a first step, longitudinal cytokine data was assessed in order to select peak levels for establishing immunophenotypes and for comparison with those in the paediatric study. Additional measurements of Th2 and Th17 cytokines performed in nasal lining fluid (IL‐4, IL‐5, IL‐13, IL‐17A) were excluded from the formation of clusters owing to separate assays and a lack of data points on all subjects. Inspection of data revealed that mediators peaked at 2–4 days after RV challenge, regardless of asthma status; however, subjects with asthma who did not receive anti‐IgE showed earlier secretion of a variety of mediators, including ECP and EDN (Figure S5). As previously reported for these data, peak levels of type 1 mediators, including interferons and chemoattractants, were not deficient in subjects with asthma and levels of IFN‐α were actually enhanced by anti‐IgE treatment versus the placebo group. 14 New analyses of peak levels also revealed increased IL‐15 and GM‐CSF with anti‐IgE treatment, although these differences were not significant following multiple comparisons correction (Figure 5). It was not valid to directly compare cytokine levels in adults with those in children, given the different sample volumes (4.0 ml in adults versus 2.5 ml in children, see Methods). Nonetheless, a side‐by‐side visualization of the data indicated that levels of nasal mediators generally fell within the same range for adults with asthma and children with acute wheeze. These findings confirmed that adults with asthma are competent to secrete a broad array of pro‐inflammatory mediators in response to RV and that anti‐IgE modifies the kinetics and levels of a select subset.
3.5. Cluster analysis links different immunophenotypes to rhinovirus load and symptoms in experimentally infected adults with asthma
Principal component analysis of peak nasal cytokines performed in all RV‐infected adults revealed three discrete clusters (Figure 6A). Cluster #1 was enriched for controls, had the lowest viral load, and displayed the lowest cytokine levels overall. By contrast, cluster #2 constituted a “RV‐high” group based on peak viral loads (median = 13.3 × 10⁶ copies RNA/μl [95% CI: 5.0 × 10⁶–106 × 106] vs. 0.17 × 10⁶ [4.3 × 10⁴–1.0 × 10⁶] and 2.5 × 10⁶ [0.8 × 10⁶–7.7 × 10⁶] for clusters #1 and #3 respectively) (Figure 6B). This group was also enriched for subjects with asthma who received anti‐IgE, whereas subjects receiving placebo were distributed across all clusters (Figure 6C). Notably, levels of the anti‐viral cytokine IL‐15 and the monocyte chemoattractant CCL2/MCP‐1 were highest in cluster #2. Cluster #3 comprised predominantly subjects with asthma who had the highest scores for upper respiratory symptoms (median = 18.0 [16.0–28.5] vs. 10.8 [7.0–13.5] and 10.5 [5.5–24.5] for clusters #1 and #2, respectively). IgE levels also trended higher in cluster #3 (gm = 468.6 [67.9–3233] vs. 110.3 [50.0–243.5] and 207.2 [94.9–452.3] for clusters #1 and #2, respectively), as did expired nitric oxide and blood eosinophils. Moreover, cytokine levels were also generally elevated in cluster #3, including mediators associated with type 1 (IFN‐γ, CCL4/MIP‐1β) and type 2 (IL‐5, CCL22/MDC, EDN) responses (Figure 6D–F). High levels of IL‐6 and CXCL8/IL‐8 were also a notable feature of this cluster, and markers of neutrophil‐mediated immunity (blood neutrophils, neutrophil elastase, and IL‐17A) also trended higher. PCA analysis of cytokine measurements immediately prior to RV challenge failed to discriminate by clinical status, and found no relationships to viral load or symptoms (data not shown). Together, our results identify different immunophenotypes in adults with asthma who are infected with RV that point to distinct inflammatory states, including a role for anti‐IgE in broadly modulating cytokine responses to RV.
4. DISCUSSION
Here, we performed a comprehensive assessment of a broad set of nasal cytokines and tested multiple relationships in children and young adults in order to identify different nasal immunophenotypes in the context of RV infection. The first scenario involved measures in acutely wheezing children with natural infection who presented to a hospital emergency department, while the other focused on adults with allergic asthma who were experimentally infected with RV. Despite the contrasting study settings and cytokine panels tested by cluster analysis (7‐plex in children versus 18‐plex in adults), characteristic nasal immunophenotypes were identified in subjects with asthma that bore similarities in children and adults (Table 1). Specifically, cluster #2 within each complete cohort was associated with the highest viral load (“RV‐high”) but generally displayed intermediate levels of nasal cytokines; whereas cluster #3 displayed the highest cytokine levels overall, perhaps reflective of a mixed granulocytic phenotype. At the simplest level, these different immunophenotypes may reflect different inflammatory states. We speculate that cluster #2 constitutes a controlled anti‐viral response in the face of high viral load, as evidenced by high CXCL10/IP‐10 levels in children and reduced eosinophil‐derived factors. Treatment with anti‐IgE might be expected to redress an immune imbalance in response to RV, and thus, might also explain the enrichment of adults with asthma who received anti‐IgE in cluster #2. It is also notable that several cytokines critical to anti‐viral control were highly expressed in the noses of adults in cluster #2. These included interferons and the Th1 chemoattractant CCL2/MCP‐1. Our findings also build on our earlier report of the ability for anti‐IgE to modulate nasal interferons in adults with asthma who are infected with RV. 14 Specifically, we found that TNF‐α and IL‐15 were enhanced during acute infection (days 1–7) in those who received anti‐IgE. Given that IL‐15 promotes type 1 responses to rhinovirus in a mouse model 34 , this might be integral to type 1 responses in cluster #2.
TABLE 1.
Immunophenotypes in Children & Adults with Asthma in Relation to Viral Infection
| Children | Adults | |
|---|---|---|
| Cluster 1 | ▼ RV+/Viral Load, Asthma, Severity (Wheeze), Cytokine Levels | ▼ Viral Load, Asthma, Severity (Symptoms), Cytokine Levels |
| Cluster 2 | ▲ RV+/Viral Load, Severity (Wheeze), Eos & Neut Mediators | ▲ Anti‐Viral Mediators (IFN‐α, IL‐15), Eos & Neut Mediators |
| ▲▲ Anti‐Viral Mediators (CXCL10) | ▲▲ Viral Load | |
| Cluster 3 | ◄► Viral Load | ▼ Omalizumab (anti‐IgE) Treatment |
| ▲ RV+, Severity (Wheeze), IgE | ▲ Viral Load, Severity (Symptoms), IgE, Anti‐Viral Mediators (IFN‐γ), Eos & Neut Mediators | |
| ▲▲ Eos & Neut Mediators, EGF |
Note. Italics indicate cluster features unique to either children or adults.
Abbreviations: Eos, Eosinophil; Neut, Neutrophil.
On the other hand, elevated cytokine levels in cluster #3 might reflect an exaggerated anti‐viral response that occurs in the face of an eosinophilic component of mixed granulocytic inflammation. This could also explain the link to elevated IgE in children, and more severe symptoms in adults. Notably, cluster #3 in both children and adults displayed the highest levels of the anti‐viral mediator IL‐8, the eosinophil‐derived mediator EDN, and robust production of neutrophil mediators. These findings align with our previous report of an exaggerated immune response in a subset of adults with asthma who were infected with RV and who were highly allergic (total IgE levels >590 IU/ml). These individuals mounted an amplified T‐cell response and displayed dysregulated expression of a broad set of genes in their nasal epithelium. 14 , 18 Our results also highlight the lack of a clear delineation between type 1 and type 2 responses in RV‐associated wheeze, and a potential role for mixed granulocytic inflammation. 14 , 35 , 36 These collective data indicate that a subset of patients with allergic asthma are predisposed to aberrant anti‐viral immunity that initiates at the epithelial barrier and drives downstream responses.
In the original study of the paediatric cohort, RV infection and IgE‐mediated pathways interacted to increase the risk of wheeze. 2 Specifically, the highest risk for acute wheeze (probability of wheeze >0.9) was found in RV+ children who had serum IgE levels to house dust mite >50 IU/ml. Our current findings indicate that such children constitute more than one immunophenotype. Other noteworthy findings in the light of the interaction between RV and IgE in children were the disconnect between the highest viral load (cluster #2) and highest IgE (cluster #3) according to different immunophenotypes, as well as the presence of non‐viral wheeze within cluster #3 (16.7%). It is important to point out that children with the highest IgE do not necessarily have the highest viral loads (Spearman r = .07, p = .27). Indeed, work among children who presented to the University of Virginia emergency department found that viral loads actually trended lower in RV+ children with acute wheeze versus those who had acute rhinitis and lower IgE levels. 13 Thus, it is possible that a type 2 response actually decreases viral loads.
Collections of matched specimens from the nose and serum in the paediatric cohort allowed a direct comparison of cytokine patterns at the site of inflammation versus the periphery. These data not only highlighted the presence of robust type 1 responses in the nose, which were integral to the immunophenotypes identified, but also underscored the local nature of the inflammatory response in the upper airways. Interestingly, only two cytokines, IL‐5 and IL‐10, were markedly elevated in the serum of children with acute wheeze versus children with stable asthma and controls. By contrast, nasal levels of IL‐5 did not discriminate children with acute wheeze from those with stable asthma, and IL‐10 levels in the nose did not significantly differ across all 3 groups. Increased expression of IL‐5 and IL‐10 in the serum of children with asthma may reflect a systemic role in those who are not optimally controlled and prone to exacerbations. Given that IL‐5 plays a critical role in mobilizing eosinophils from the bone marrow 37 , elevated levels in the serum would be expected to aid in local recruitment of eosinophils and the consequent release of ECP and EDN at the site of infection. By contrast, IL‐10 is a master regulator that limits tissue damage during the acute phase of an immune response. 38 Interestingly, in adults, nasal levels of IL‐10 were the highest for cluster #3, perhaps reflecting counter‐regulation of the enhanced inflammatory state.
There were several limitations to the present study. First, studying natural infection has its drawbacks, including the involvement of multiple virus strains, and variable time of sampling during an infection. In particular, sampling at a single time point during the course of an infection does not capture asynchronous immune events and thus, may influence resulting immunophenotypes identified by our method. It should also be noted that not all children with asthma in the paediatric cohort were infected with RV, whereas all adults with asthma were. Moreover, as already mentioned, it was not possible to directly compare cytokine levels in children and adults, owing to the different volumes of saline used to collect nasal specimens. Several factors might contribute to different cytokine patterns in children and adults including maturity of the immune system; sex and racial differences; the dose of infecting virus in natural versus experimental infections; differences in sampling methods; and environmental factors. Another limitation is that Th2 cytokines were not included in unsupervised analyses, and thus, their contribution by immunophenotype was not tested. This was based on difficulties detecting these cytokines in nasal washes of children, and the lack of a uniform dataset across all specimens in adults. The influence of medications, and glucocorticoids in particular, on nasal inflammatory profiles, is also an important factor to consider. In children, use of any asthma medication was similar between children with stable asthma as compared with acute wheeze; however, those with wheeze reported lower daily usage of nasal and inhaled steroids. 2 With this in mind, it is unlikely that increased type 1 mediators present in children with acute wheeze are iatrogenic. By contrast, adults in the present study met the criteria for mild asthma and received no inhaled corticosteroids within 4 weeks of enrollment. Finally, our study did not sample the lower airways given the obvious safety concerns. Whether immunophenotypes identified in the upper airways are a feature of the cytokine milieu in the lower airways and airway function, are key questions that remain to be answered.
5. CONCLUSION
In summary, our data reveal the presence of different nasal immunophenotypes in both children and adults with asthma who are infected with RV. Such discrepancies at the site of infection may be pivotal to the ability to control anti‐viral responses and downstream inflammatory sequelae.
AUTHOR CONTRIBUTIONS
Studies of the paediatric case–control cohort and adults who received rhinovirus challenge were designed by P.H., with contributions from M.S‐Q., T.P‐M., and J.W. Oversight of the paediatric cohort study was provided by P.H., L.A., and M.S‐Q. Oversight of adults who received rhinovirus challenge was provided by P.H. and T.P‐M. Subjects were enrolled and specimens were collected by P.H., H.C., and D.M. Methods for nasal wash collection were developed by S.E. Experiments were designed by L.M., P.H., J.K., and J.W. and performed by L.M., H.C., E.R., J.K., and L.W. Data was analysed by L.M, P.H., and J.W. and the manuscript was prepared by L.M. and J.W., with input from all authors.
Supporting information
Appendix S1
Appendix S2
ACKNOWLEDGEMENT
The authors thank Michael Solga, MS and Alexander Wendling, BS (University of Virginia Flow Cytometry Core, RRID: SCR_017829) for assistance with multiplex bead assays.
Muehling LM, Heymann PW, Carper H , et al. Cluster analysis of nasal cytokines during rhinovirus infection identifies different immunophenotypes in both children and adults with allergic asthma. Clin Exp Allergy. 2022;52:1169‐1182. doi: 10.1111/cea.14176
Funding information
Work was supported by NIH/NIAID U01 AI100799, R01 AI020565, T32 AI007496, R21 AI138077, and U19 AI070364
DATA AVAILABILITY STATEMENT
The datasets generated and/or analysed during the current study are available from the corresponding author upon request.
REFERENCES
- 1. Busse WW, Morgan WJ, Gergen PJ, et al. Randomized trial of omalizumab (anti‐IgE) for asthma in inner‐city children. N Engl J Med. 2011;364(11):1005‐1015. [DOI] [PMC free article] [PubMed] [Google Scholar]
- 2. Soto‐Quiros M, Avila L, Platts‐Mills TAE, et al. High titers of IgE antibody to dust mite allergen and risk for wheezing among asthmatic children infected with rhinovirus. J Allergy Clin Immunol. 2012;129(6):1499‐1505. [DOI] [PMC free article] [PubMed] [Google Scholar]
- 3. Wark PA, Johnston SL, Bucchieri F, et al. Asthmatic bronchial epithelial cells have a deficient innate immune response to infection with rhinovirus. J Exp Med. 2005;201(6):937‐947. [DOI] [PMC free article] [PubMed] [Google Scholar]
- 4. Contoli M, Message SD, Laza‐Stanca V, et al. Role of deficient type III interferon‐λ production in asthma exacerbations. Nat Med. 2006;12(9):1023‐1026. [DOI] [PubMed] [Google Scholar]
- 5. Sykes A, Edwards MR, Macintyre J, et al. Rhinovirus 16‐induced IFN‐α and IFN‐β are deficient in bronchoalveolar lavage cells in asthmatic patients. J Allergy Clin Immunol. 2012;129(6):1506‐1514. [DOI] [PubMed] [Google Scholar]
- 6. Gill MA, Bajwa G, George TA, et al. Counterregulation between the FcεRI pathway and antiviral responses in human plasmacytoid dendritic cells. J Immunol. 2010;184:5999‐6006. [DOI] [PMC free article] [PubMed] [Google Scholar]
- 7. Message SD, Laza‐Stanca V, Mallia P, et al. Rhinovirus‐induced lower respiratory illness is increased in asthma and related to virus load and TH1/2 cytokine and IL‐10 production. Proc Natl Acad Sci U S A. 2008;105(36):13562‐13567. [DOI] [PMC free article] [PubMed] [Google Scholar]
- 8. Durrani SR, Montville DJ, Pratt AS, et al. Innate immune responses to rhinovirus are reduced by the high‐affinity IgE receptor in allergic asthmatic children. J Allergy Clin Immunol. 2012;130(2):489‐495. [DOI] [PMC free article] [PubMed] [Google Scholar]
- 9. Zhu J, Message SD, Mallia P, et al. Bronchial mucosal IFN‐α/β and pattern recognition receptor expression in patients with experimental rhinovirus‐induced asthma exacerbations. J Allergy Clin Immunol. 2019;143(1):114‐125. [DOI] [PMC free article] [PubMed] [Google Scholar]
- 10. Jackson DJ, Makrinioti H, Rana BMJ, et al. IL‐33–dependent type 2 inflammation during rhinovirus‐induced asthma exacerbations in vivo. Am J Respir Crit Care Med. 2014;190(12):1373‐1382. [DOI] [PMC free article] [PubMed] [Google Scholar]
- 11. Uller L, Persson C. Viral induced overproduction of epithelial TSLP: role in exacerbations of asthma and COPD? J Allergy Clin Immunol. 2018;142(2):712. [DOI] [PubMed] [Google Scholar]
- 12. Heymann PW, Platts‐Mills TA, Woodfolk JA, et al. Understanding the asthmatic response to an experimental rhinovirus infection: exploring the effects of blocking IgE. J Allergy Clin Immunol. 2020;146(3):545‐554. [DOI] [PMC free article] [PubMed] [Google Scholar]
- 13. Kennedy JL, Shaker M, McMeen V, et al. Comparison of viral load in individuals with and without asthma during infections with rhinovirus. Am J Respir Crit Care Med. 2014;189(5):532‐539. [DOI] [PMC free article] [PubMed] [Google Scholar]
- 14. Muehling LM, Heymann PW, Wright PW, et al. Human Th1 and Th2 cells targeting rhinovirus and allergen coordinately promote allergic asthma. J Allergy Clin Immunol. 2020;146(3):555‐570. [DOI] [PMC free article] [PubMed] [Google Scholar]
- 15. Hansel TT, Tunstall T, Trujillo‐Torralbo M‐B, et al. A comprehensive evaluation of nasal and bronchial cytokines and chemokines following experimental rhinovirus infection in allergic asthma: increased interferons (IFN‐γ and IFN‐λ) and type 2 inflammation (IL‐5 and IL‐13). EBioMedicine. 2017;19:128‐138. [DOI] [PMC free article] [PubMed] [Google Scholar]
- 16. Helling BA, Sobreira DR, Hansen GT, et al. Altered transcriptional and chromatin responses to rhinovirus in bronchial epithelial cells from adults with asthma. Commun Biol. 2020;3:678. [DOI] [PMC free article] [PubMed] [Google Scholar]
- 17. Altman MC, Reeves SR, Parker AR, et al. Interferon response to respiratory syncytial virus by bronchial epithelium from children with asthma is inversely correlated with pulmonary function. J Allergy Clin Immunol. 2018;142(2):451‐459. [DOI] [PMC free article] [PubMed] [Google Scholar]
- 18. Heymann PW, Nguyen H, Steinke JW, et al. Rhinovirus infection results in stronger and more persistent genomic dysregulation: evidence for altered innate immune response in asthmatics at baseline, early in infection, and during convalescence. PLoS One. 2017;12(5):e0178096. [DOI] [PMC free article] [PubMed] [Google Scholar]
- 19. Custovic A, Belgrave D, Lin L, et al. Cytokine responses to rhinovirus and development of asthma, allergic sensitization and respiratory infections during childhood. Am J Respir Crit Care Med. 2018;197(10):1265‐1274. [DOI] [PMC free article] [PubMed] [Google Scholar]
- 20. Matsuda S, Kato M, Koike T, et al. Differences in virus detection and cytokine profiles between first wheeze and childhood asthma. Tokai J Exp Clin Med. 2020;45(1):10‐17. [PubMed] [Google Scholar]
- 21. Nguyen‐Thi‐Dieu T, Le‐Thi‐Thu H, Le‐Thi‐Minh H, Pham‐Nhat A, Duong‐Quy S. Study of clinical characteristics and cytokine profiles of asthmatic children with rhinovirus infection during acute asthma exacerbation at National Hospital of pediatrics. Can Respir J. 2018;2018:9375967. [DOI] [PMC free article] [PubMed] [Google Scholar]
- 22. Roh DE, Park S‐H, Choi HJ, Kim YH. Comparison of cytokine expression profiles in infants with a rhinovirus induced lower respiratory tract infection with or without wheezing: a comparison with respiratory syncytial virus. Korean J Pediatr. 2017;60(9):296‐301. [DOI] [PMC free article] [PubMed] [Google Scholar]
- 23. Altman MC, Beigelman A, Ciaccio C, et al. Evolving concepts in how viruses impact asthma: a work group report of the microbes in allergy Committee of the American Academy of allergy, Asthma & Immunology. J Allergy Clin Immunol. 2020;145(5):1332‐1344. [DOI] [PMC free article] [PubMed] [Google Scholar]
- 24. Lewis TC, Metitiri EE, Mentz GB, et al. Influence of viral infection on the relationships between airway cytokines and lung function in asthmatic children. Respir Res. 2018;19:228. [DOI] [PMC free article] [PubMed] [Google Scholar]
- 25. Raita Y, Camargo CA, Bochkov YA, et al. Integrated‐omics endotyping of infants with rhinovirus bronchiolitis and risk of childhood asthma. J Allergy Clin Immunol. 2021;147(6):2108‐2117. [DOI] [PMC free article] [PubMed] [Google Scholar]
- 26. Perez GF, Pancham K, Huseni S, et al. Rhinovirus‐induced airway cytokines and respiratory morbidity in severely premature children. Pediatr Allergy Immunol. 2015;26:145‐152. [DOI] [PMC free article] [PubMed] [Google Scholar]
- 27. Perez GF, Pancham K, Huseni S, et al. Rhinovirus infection in young children is associated with elevated airway TSLP levels. Eur Respir J. 2014;44:1075‐1078. [DOI] [PMC free article] [PubMed] [Google Scholar]
- 28. Sikazwe CT, Laing IA, Imrie A, Smith DW. Nasal cytokine profiles of patients hospitalised with respiratory wheeze associated with rhinovirus C. Viruses. 2019;11(11):1038. [DOI] [PMC free article] [PubMed] [Google Scholar]
- 29. Le S, Josse J, Husson F. FactoMineR: an R package for multivariate analysis. J Stat Softw. 2008;25(1):1‐18. [Google Scholar]
- 30. Gu Z, Eils R, Schlesner M. Complex heatmaps reveal patterns and correlations in multidimensional genomic data. Bioinformatics. 2016;32(18):2847‐2849. [DOI] [PubMed] [Google Scholar]
- 31. Bashir H, Grindle K, Vrtis R, et al. Association of rhinovirus species with common cold and asthma symptoms and bacterial pathogens. J Allergy Clin Immunol. 2018;141(2):822‐824. [DOI] [PMC free article] [PubMed] [Google Scholar]
- 32. Luster AD, Ravetch JV. Biochemical characterization of a gamma interferon‐inducible cytokine (IP‐10). J Exp Med. 1987;166:1084‐1097. [DOI] [PMC free article] [PubMed] [Google Scholar]
- 33. Turner RB, Weingand KW, Yeh CH, Leedy DW. Association between interleukin‐8 concentration in nasal secretions and severity of symptoms of experimental rhinovirus colds. Clin Infect Dis. 1998;26:840‐846. [DOI] [PubMed] [Google Scholar]
- 34. Jayaraman A, Jackson DJ, Message SD, et al. IL‐15 complexes induce NK‐ and T‐cell responses independent of type I IFN signaling during rhinovirus infection. Mucosal Immunol. 2014;7(5):1151‐1164. [DOI] [PMC free article] [PubMed] [Google Scholar]
- 35. Teague WG, Lawrence MG, Shirley DAT, et al. Lung lavage granulocyte patterns and clinical phenotypes in children with severe, therapy‐resistant asthma. J Allergy Clin Immunol Pract. 2019;7(6):1803‐1812. [DOI] [PMC free article] [PubMed] [Google Scholar]
- 36. Irvin C, Zafar I, Good J, et al. Increased frequency of dual‐positive TH2/TH17 cells in bronchoalveolar lavage fluid characterizes a population of patients with severe asthma. J Allergy Clin Immunol. 2014;134(5):1175‐1186. [DOI] [PMC free article] [PubMed] [Google Scholar]
- 37. Rothenberg ME, Hogan SP. The eosinophil. Annu Rev Immunol. 2006;24:147‐174. [DOI] [PubMed] [Google Scholar]
- 38. Couper KN, Blount DG, Riley EM. IL‐10: the master regulator of immunity to infection. J Immunol. 2008;180(9):5771‐5777. [DOI] [PubMed] [Google Scholar]
Associated Data
This section collects any data citations, data availability statements, or supplementary materials included in this article.
Supplementary Materials
Appendix S1
Appendix S2
Data Availability Statement
The datasets generated and/or analysed during the current study are available from the corresponding author upon request.