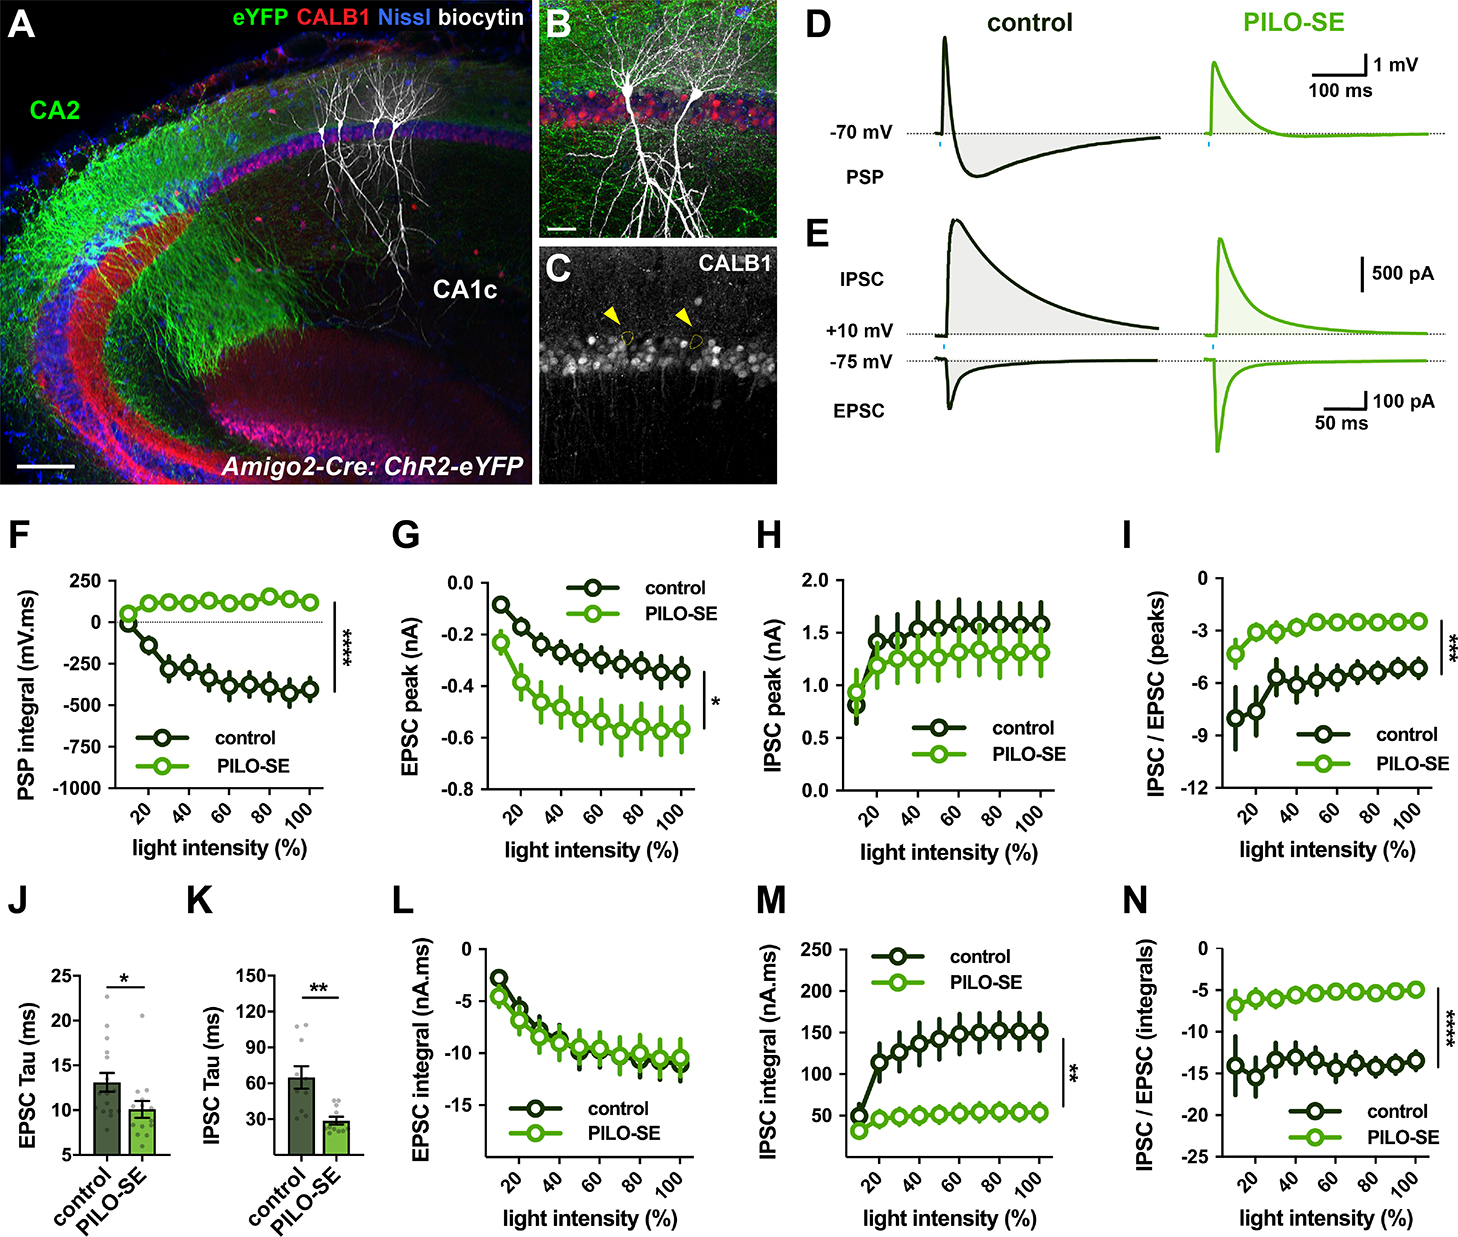
Figure 5. PILO-SE strengthened CA2 excitation of CA1.

(A - C) A hippocampal slice with biocytin-filled CA1c PCs (white) located in the deep sublayer of SP, adjacent to SO. ChR2-eYFP-expressing CA2 PC dendrites and axonal projections (green) visible throughout SR and SO. Neuronal somata labeled with Nissl stain (blue); Calbindin-1 stain (CALB1, red) delineates superficial CA1 PCs (Lee et al., 2014). Scale bars, 150 μm in A and 40 μm in B. (D) Representative averaged light-evoked PSPs from deep CA1c PCs in slices from control (left, dark green) and PILO-SE (right, bright green) mice. (E) Representative averaged light-evoked EPSCs and IPSCs from control and PILO-SE CA1c PCs. (F) The integral of the light-evoked PSP was significantly more positive in CA1 PCs from PILO-SE mice. (G - I) Input-output curves of the light-evoked EPSC amplitude, IPSC amplitude, and the ratio of the IPSC and EPSC peak amplitudes. (J, K) The time constants of the light-evoked EPSC and IPSC were significantly shorter in cells from PILO-SE mice. (L - N) Input-output curves of the integral of the light-evoked EPSC, the integral of the IPSC, and the ratio of the IPSC and EPSC integrals.
