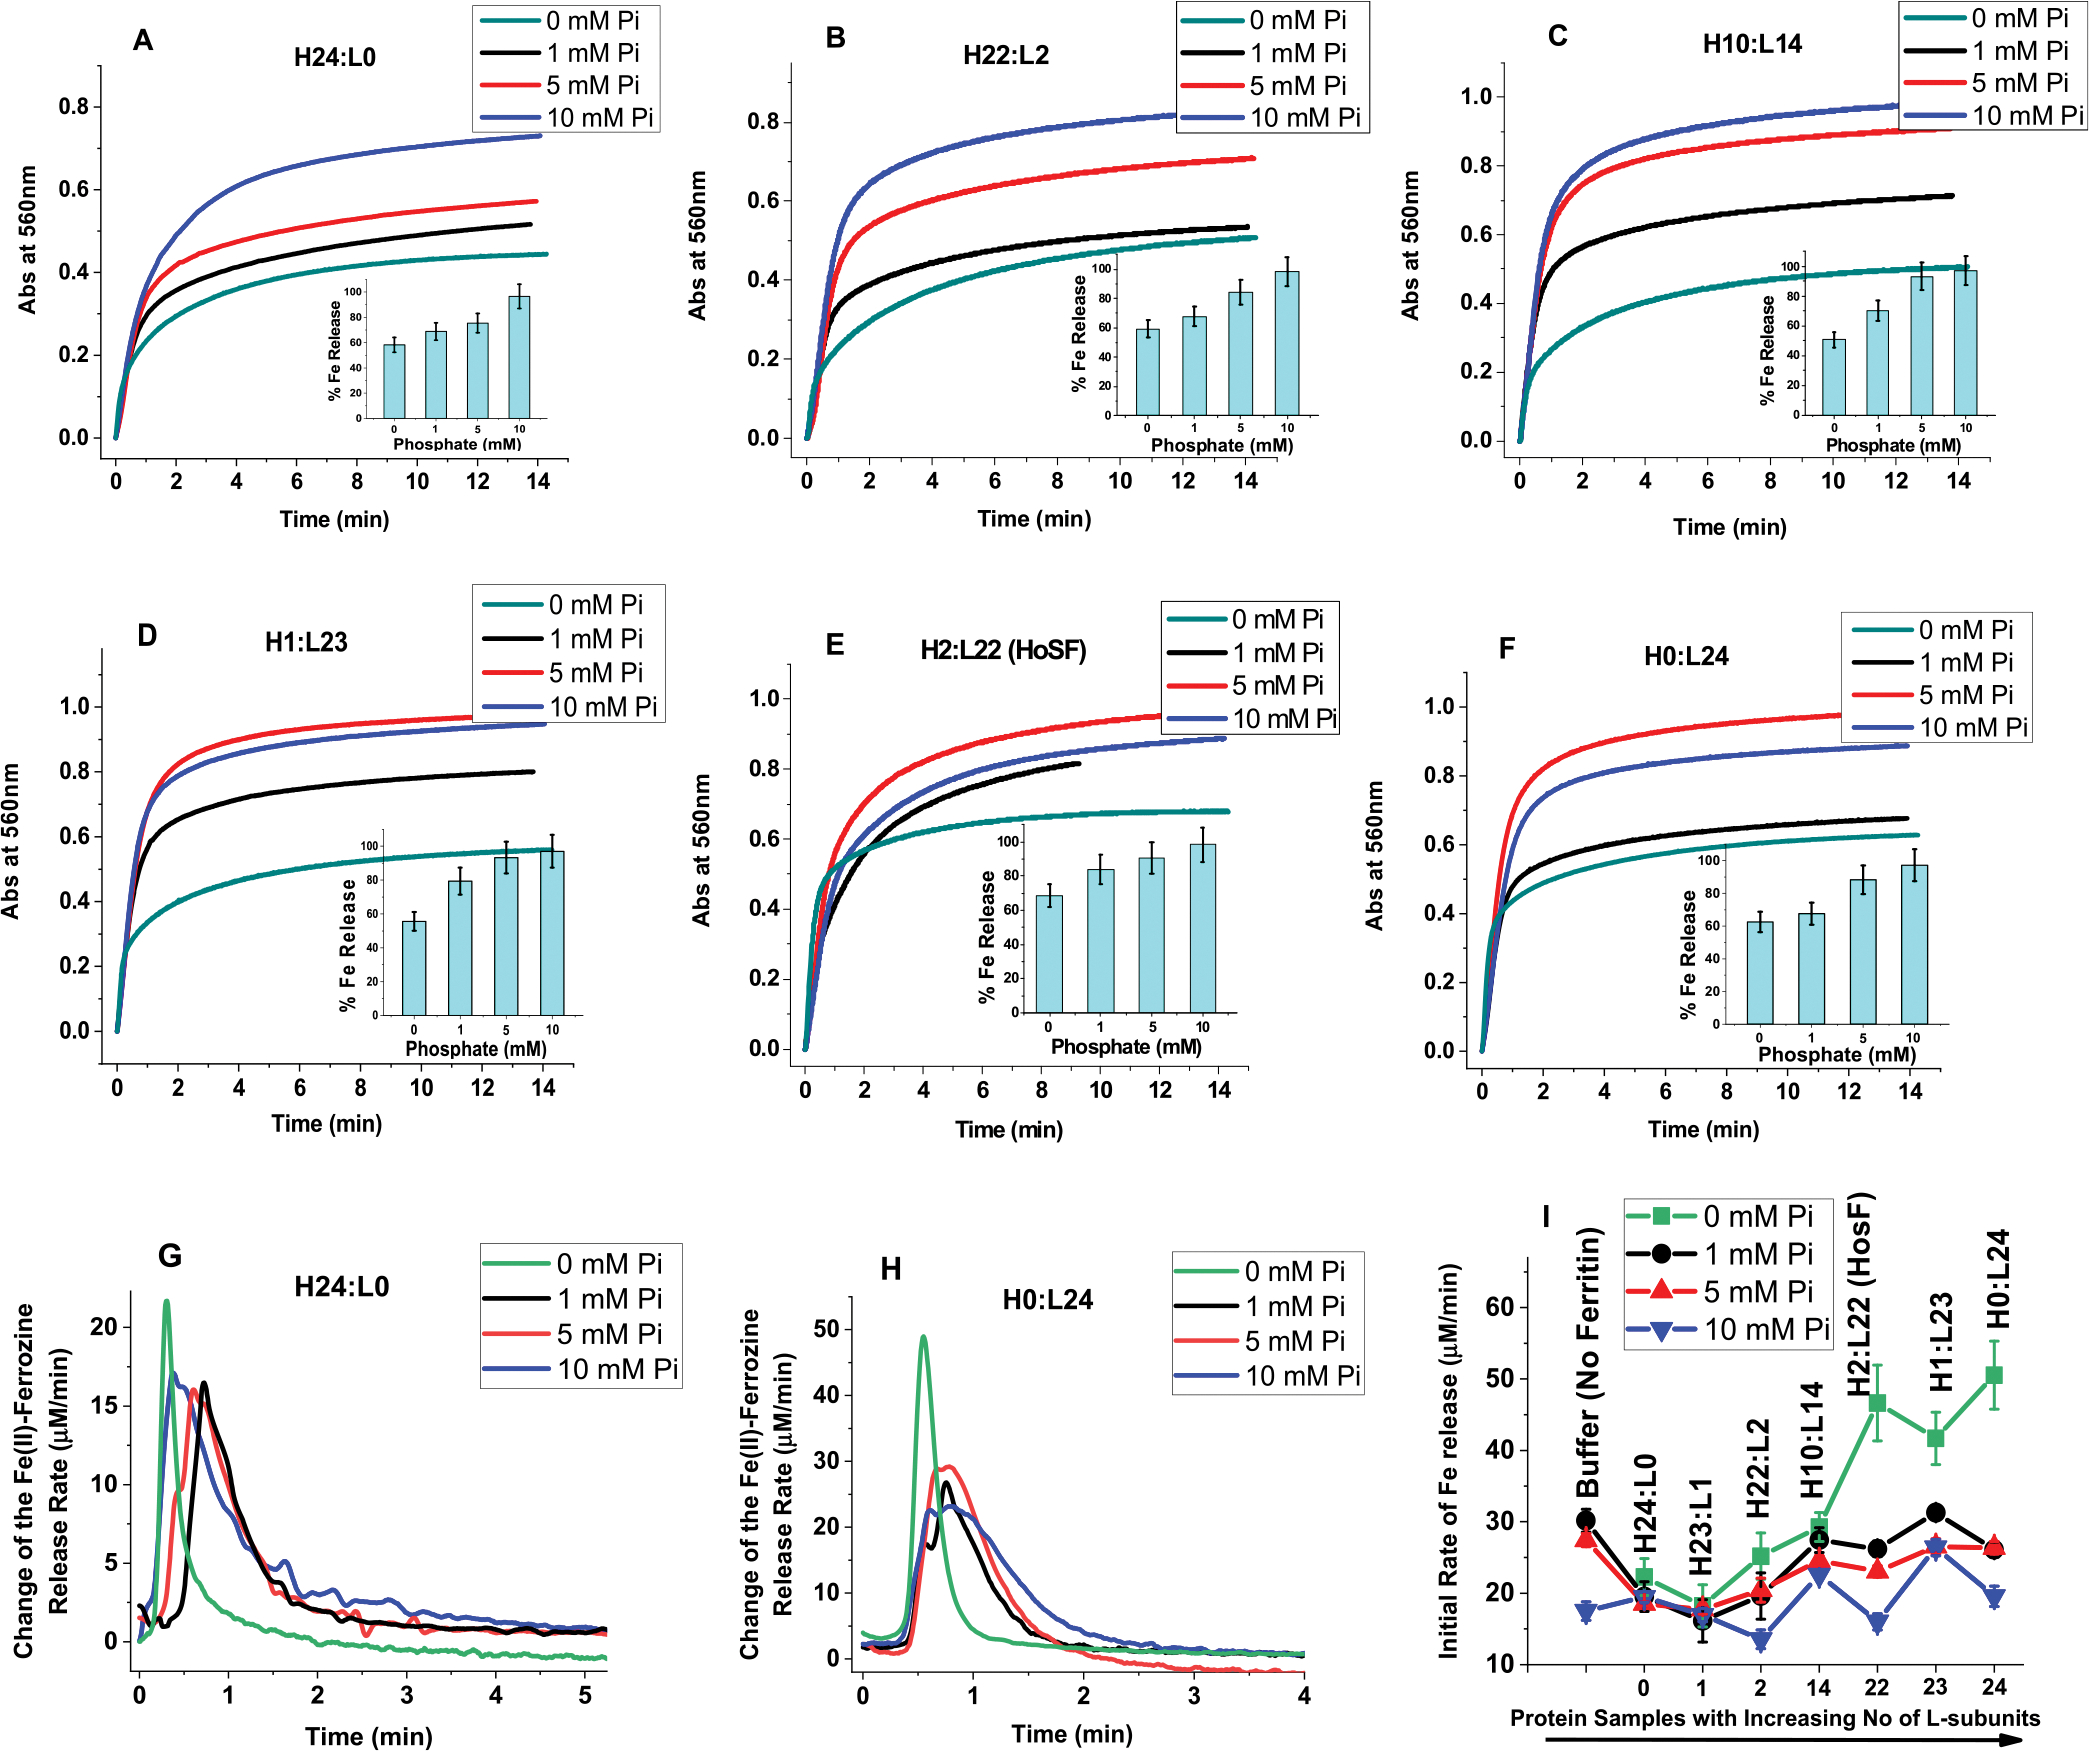
Figure 6.

Effect of phosphate on the reductive mobilization of iron from human ferritin. (A–F) Kinetics of iron release from different ferritins with the insets representing percent of iron released as a function of phosphate concentration. (G,H) Change of the Fe(II)-ferrozine release rate vs time shown only for H- and L-homopolymers (H24:L0 and H0:L24) to illustrate the major differences between H and H-rich ferritins and L or L-rich ferritins. (I) Initial rate of iron release (calculated for the first 30 s of reaction) as a function of increasing ferritin L-subunit content. Conditions: 0.067 μM ferritin, 132 mM Tris pH 7.4 at 25.0 °C, 5 mM FMN, 0.5 mM ferrozine, 5 mM NADH, 13.4 μM Fe(II) freshly added (or 200 Fe/shell), and 0–10 mM phosphate as indicated on each panel. The ferritins samples used in these experiments are those of Figure 1, after 3-fold dilution, and thus, the total amount of iron present in each sample is 26.8 μM (i.e., freshly added 13.4 μM Fe(II) + an average of 13.4 μM Fe(III) already present in the purified ferritin; see M&M for more details). The control experiment was performed under the exact same conditions but in the absence of ferritin using 26.8 μM Fe(II) to account for the total amount of Fe(II) present in ferritin. In all cases, the iron mobilization kinetics were performed with freshly prepared samples, and no differences were observed when the kinetics are performed (or repeated) using 1 or 2 week-old sample storage in the fridge at 4 °C.
