

Abstract
The interaction of dimethyl sulfoxide with water has been investigated by Fourier-transform microwave spectroscopy of the 1:1 complex and its isotopologues, complemented with quantum chemical calculations. The rotational spectra of 34S and 13C isotopologues in natural abundance and the H218O and deuterated water enriched isotopologues have been measured, allowing a partial structure determination and establishing the position of water in the complex. In the most stable conformation water was found to be the donor of a primary OH···OS bond to the oxygen atom of dimethyl sulfoxide and acceptor of two weak CH···OH bonds with the methyl hydrogen atoms of dimethyl sulfoxide. From the structural determination confirmed by quantum chemical calculations, the water molecule lies in the symmetry plane of dimethyl sulfoxide, and the complex has an overall Cs symmetry. The experimental findings are supported by atoms in molecules and symmetry-adapted perturbation theories, which allowed for determining the hydrogen bond and intermolecular interaction energies, respectively.
Introduction
Dimethyl sulfoxide ((CH3)2SO, DMSO) is an important substance commonly used as a polar aprotic solvent, antifreeze fluid, and cryo-protectant owing to its beneficial properties including low toxicity and environmental compatibility.1 The DMSO/water system is well-known for exhibiting a strongly nonideal mixing behavior. The nonideal behavior of the DMSO/water system, reflected in a number of physical properties, such as the density,2 excess mixing volume,3 viscosity,4 and translational and rotational diffusion constants,5 has been a very active field of research for many decades. Insights into how DMSO interacts with water are essential in explaining ice-blocking mechanisms and biological toxicity.6
Unique attributes of the DMSO/water system have previously been investigated using various methods, such as molecular dynamics (MD) simulations,7−9 neutron diffraction,10,11 Rydberg electron-transfer spectroscopy,12 high-pressure spectroscopic probing,13 FTIR spectroscopy,14,15 and Raman spectroscopy.16 Kirchner et al. described the stable conformations of DMSO-(water)n (n = 1, 2, 3, and 4) complexes by MD simulations and calculated the interaction energies of the hydrogen bond (HB) in the stable conformations with different methods.17 Mrázková and Hobza studied the conformations of DMSO-(water)n (n = 1, 3, 6, 16, and 32) using MD simulations and reoptimized DMSO-(water)n (n = 1, 2, and 3) at the ab initio level. They found that the hydration of DMSO leads to an elongation of the S=O bond and a contraction of methyl C–H bonds.9 Li et al. studied the cooperativity between O–H···O=S HB and C–H···Ow HB in the DMSO aqueous solutions by FTIR spectroscopy and conformations DMSO-(water)n (n = 1, 2, and 3) by theoretical calculations.14 Oh et al. proved singly hydrogen-bonded conformations (DMSO-water and (DMSO)2-water) and a doubly hydrogen-bonded conformation (DMSO-(water)2) in DMSO/water binary mixture solutions using FTIR spectroscopy combined with theoretical calculations.15 They reported that DMSO disrupts the donor/acceptor balance in water by accepting up to two HBs through its oxygen lone pairs. However, despite this extensive research, HB formation preferences in the complex of DMSO with water are not completely understood.
A bottom-up approach to the problem of solvation can be achieved by the study of small molecular clusters by high resolution spectroscopy, in particular rotational spectroscopy,18 but also electronic spectroscopy19,20 performed in the gas phase. Rotational spectroscopy in particular is highly sensitive to atomic mass distribution, so it can be used to study conformational equilibria and isotopic species. The combination of rotational spectroscopy analysis and theoretical calculations provides a synergistic method for studying the structure and internal dynamics of isolated molecules21 and weakly bound complexes.22
Herein, we investigate the rotational spectrum of the 1:1 complex of DMSO with water (DMSO-W) and its isotopologues by rotational spectroscopy in the 6–18 GHz region supported by quantum chemical calculations with the aim of determining its structure and the driving forces of the interaction between DMSO and water.
Methods
The measurement of the rotational spectrum was carried out in a COBRA-type23 pulsed jet Fourier-transform microwave (PJ-FTMW) spectrometer24 previously described.25,26 The sample of DMSO was acquired from Sigma-Aldrich (purity > 99%), while those of H218O and D2O were purchased from Cambridge Isotopes Inc. (purity > 99.9%) and used without further purification. Samples of DMSO and water were prepared in two separate containers and cooled to 273 K. Helium at a stagnation pressure of about 0.3 MPa was flowed over the samples, resulting in about a 1% mixture of both DMSO and water. The molecular beam was then expanded through a solenoid valve (General Valve, Series 9, nozzle diameter of 0.5 mm) into a Fabry–Pérot cavity. During the expansion, the molecules and their complexes can reach quite low rotational and vibrational temperatures (a few degrees K and less than 100 K, respectively), and the most stable forms can be trapped at their energy minimum when certain conditions are satisfied. The spectral line positions were determined after Fourier transformation of the time-domain signal with 8000 data points, recorded at a sampling interval of 100 ns. The analysis of the spectral data was performed with the SPFIT program of Pickett.27
The theoretical search for the stable geometries was performed with the CREST (conformer-rotamer ensemble sampling tool) software,28,29 an efficient scheme by the meta-dynamics algorithm combined with semiempirical tight-binding methods. The resulting conformers were optimized using MP2/aug-cc-pVTZ basis sets with the Gaussian 16 program.30 The noncovalent interactions between DMSO and water were analyzed with Johnson’s NCI method,31 which can visualize and quantify the noncovalent interactions based on a reduced gradient of the electronic density (RDG), atoms in molecules,32 and symmetry-adapted perturbation theories.33
Results and Discussion
For the DMSO molecule, extensive research has already been done using rotational spectroscopy performed in the gas phase.34−39 The dipole moment and r0 structure,38rs structure,35 centrifugal distortion constants,34,37 and the methyl internal rotation barrier V3 of DMSO36 were previously determined. In terms of chemical structure, the molecule has idealized Cs symmetry and a trigonal pyramidal molecular geometry.
The possible structures of the 1:1 complexes of DMSO with water were predicted using the CREST software28,29 obtaining seven nonequivalent species. All of them were optimized at the MP2/aug-cc-pVTZ level of theory obtaining only three stable conformers, as shown in Figure 1. All three conformers were confirmed to be local minima by performing harmonic vibrational calculations. Distinct conformers of DMSO-W have been labeled Conf1, Conf2, or Conf3 based on their increasing relative energy. The theoretical spectroscopic parameters and relative energies are reported in Table 1, while the Cartesian coordinates of the optimized structures are available in the Supporting Information.
Figure 1.
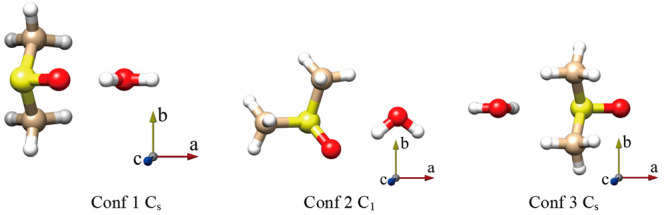
Sketch and principal axis of the three conformers of DMSO-W.
Table 1. Theoretical (MP2/aug-cc-pVTZ) Spectroscopic Parameters and Relative Energies of the Three Conformers of DMSO-W.
| Conf1 | Conf2 | Conf3 | |
|---|---|---|---|
| A [MHz] | 4261 | 6785 | 5172 |
| B [MHz] | 2479 | 2072 | 2075 |
| C [MHz] | 2459 | 1739 | 1904 |
| |μa| [D] | 1.5 | 3.2 | 4.1 |
| |μb| [D] | 0.0 | 1.6 | 0.0 |
| |μc| [D] | 2.3 | 0.2 | 0.9 |
| Paa [u Å2]a | 145.4 | 230.0 | 205.6 |
| Pbb [u Å2] | 60.1 | 60.6 | 59.8 |
| Pcc [u Å2] | 58.5 | 13.9 | 37.9 |
| ΔE [kJ mol–1] | 0.0 | 6.9 | 25.1 |
The planar moments of inertia Pgg = Σimigi2 (g = a, b, c)
In the most stable conformer (Conf1), the hydrogen of water forms a OH···OS HB with the DMSO oxygen atom, and the water oxygen lone pairs participate in two CH···OH secondary interactions, involving two methyl groups. The structure has a Cs symmetry where the plane of symmetry corresponds to the ac inertial plane with the water and the SO group located on it, thus the value of the electric dipole moment component μb is null. Conformer 2 (Conf2) is located 6.9 kJ mol–1 higher than Conf1. In this case, the water molecule lies in the heavy atom plane of DMSO, forming a six-membered ring-like structure where the water hydrogen forms a HB with the DMSO oxygen, and the oxygen atom of water is involved in a HB with a DMSO hydrogen atom. The two lower energy structures exhibit a stronger OH···OS hydrogen bond and one (Conf2) or two (Conf1) weak CH···OS HBs. The hydroxyl group of water is acting as a proton donor for the OH···OS interaction and as a proton acceptor for the CH···OH interaction. In conformer 3 (Conf3), the water lies again in the DMSO symmetry plane and exhibits a OH···SO and two CH···OH interactions. This structure is located 25.1 kJ mol–1 higher than Conf1.
We started our experiment searching for the rotational transitions of Conf1. The initial spectral scan has covered a frequency range where the J: 2 ←1 μa-type R transitions were expected to be found. Using this prediction, some intense rotational transitions have been assigned. Following the rotational pattern, many other μa-type transitions have been recorded and later some μc-type transitions for a total of 17 pure rotational transitions. The lack of μb-type lines confirms the assignment of Conf1 to a structure with an ac plane of symmetry.
In the DMSO monomer, due to the hindered internal rotation of its two equivalent methyl rotors and the Cs symmetry frame, an effective triplet spectral splitting pattern labeled AA, AE (or EA), and EE occurs where A and E are the high-barrier methyl torsional state symmetry labels.39,40 Nevertheless, in the case of the observed transitions of Conf1 in our frequency range, no splitting was observed. To verify the different behavior between monomer and complex, the potential energy surface of the methyl torsion around the CS bond in both DMSO and Conf1 was calculated by changing the dihedral angle τ = HCSC in steps of Δτ = 10°, while all of the other parameters were freely optimized. The obtained potential energy curves are compared in Figure 2. The calculated data reported in black triangles and red circles, respectively, are well reproduced with the 3-fold function, V(τ) = 1/2V3[1 + cos(3τ)], which is shown as a green line for DMSO and a blue line for Conf1 of DMSO-W. The maximum value (11.5 kJ mol–1 for DMSO and 12.5 kJ mol–1 for Conf1) represents the theoretical barrier hindering the methyl group internal rotation, not accounting for zero-point energy contribution. It can be noted that the value of Conf1 is larger (about 12.3%) than the value obtained for DMSO. The increased barrier to methyl rotation in the complex might be related to the interactions between the water oxygen and DMSO hydrogens, and it causes the splitting of the rotational transitions to be below the resolving power of our instrument as they were already very small in the monomer.39 The calculated barrier for DMSO is smaller than the experimentally determined one (V3 = 12.3(3) kJ mol–1);39 nevertheless, we acknowledge the consistency of the increased value of the internal rotation barrier in going from monomer to complex and the non-observation of the internal rotation splitting in the spectra of the complex.
Figure 2.

Ab initio (MP2/aug-cc-pVTZ) and fitted potential energy surface for methyl internal rotational of DMSO and DMSO-W (Conf1).
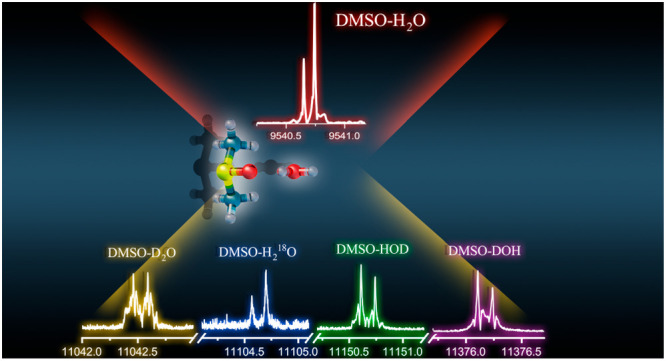
Trial rotational constants for the isotopologues were estimated considering their theoretical values and the differences between the experimental and theoretical rotational constants of the parent species. Using this approach, the rotational spectrum of the isotopologues 34S and 13C were easily identified, measured, and analyzed in natural abundance (4.2% and 2%, respectively). As an example of the observations, the 20,2 ← 10,1 transition for the parent species, 34S and 13C isotopologues, is shown in Figure 3 where the relative intensity in natural abundance can be inferred.
Figure 3.

20,2 ← 10,1 transition of parent DMSO-W and 34S and 13C isotopologues observed in natural abundance. The transition intensity of parent species is 50 au. Each line appears as a doublet due to the instrumental Doppler effect.
Using 18O and deuterium enriched water samples in the experiment, we could also observe the spectra of DMSO-H218O and three water deuterated isotopologues. As an example, in Figure 4, we show the corresponding 21,1 ← 10,1 transition for the observed water isotopologues.
Figure 4.

21,1 ← 10,1 transitions of enriched H218O and three enriched deuterated species of DMSO-W.
The rotational constants of all observed species are summarized in Table 2, while the observed transition frequencies are provided in the Supporting Information (Tables S1–S4). A splitting pattern caused by quadrupole coupling was observed in the spectrum of the deuterated species due to the coupling of the deuterium nuclear quadrupole moment to the overall rotation, as shown in Figure 4. Considering that the splitting pattern is very narrow, some values of the quadrupole coupling constants for the deuterated species (DOH and D2O) in Table 2 were fixed to the predicted ones.
Table 2. Experimental Spectroscopic Parameters of DMSO-W (Conf1).
| fitted | parent | 34S | 13C | H218O | DOH | HOD | D2O |
|---|---|---|---|---|---|---|---|
| A [MHz] | 4282.940(4)a | 4276.711(5) | 4194.447(5) | 4277.763(4) | 4275.679(4) | 4280.106(3) | 4272.832(2) |
| B [MHz] | 2405.027(1) | 2383.597(2) | 2396.269(2) | 2275.665(9) | 2366.876(1) | 2290.2285(7) | 2256.6064(6) |
| C [MHz] | 2365.748(1) | 2346.902(1) | 2339.577(1) | 2241.907(1) | 2330.8156(9) | 2254.6339(6) | 2223.8261(5) |
| DJ [kHz] | 2.79(4) | 2.7(5) | 2.68(5) | 2.59(4) | 2.66(4) | 2.50(2) | 2.40(2) |
| DJK [kHz] | 8.4(5) | 7.8(8) | 8.8(8) | 8.1(2) | 7.1(4) | 7.4(3) | 7.8(2) |
| DK [kHz] | –10.3(7) | –9(1) | –10(1) | –9.9(8) | 7.7(8) | –8.6(6) | –9.5(5) |
| 3/2χaa [MHz] | [0.0828]b | 0.36(1) | [0.0828], [0.36]c | ||||
| (χbb – χcc)/4 [MHz] | –0.050(3) | –0.024(3) | [−0.050], [−0.024] | ||||
| σd [kHz] | 1.60 | 1.54 | 3.64 | 2.14 | 5.8 | 7.2 | 8.6 |
| Ne | 15 | 11 | 11 | 16 | 27 | 37 | 51 |
| Derived | |||||||
| Paa [u Å2] | 152.8798(2) | 154.5962(2) | 153.2139(2) | 164.6813(2) | 156.0741(1) | 163.3712(1) | 166.4673(1) |
| Pbb [u Å2] | 60.7435(2) | 60.7426(2) | 62.7991(2) | 60.7425(2) | 60.7508(1) | 60.7799(1) | 60.7893(1) |
| Pcc [u Å2] | 57.2546(2) | 57.4275(2) | 57.6886(2) | 57.3985(2) | 57.4477(1) | 57.2963(1) | 57.4880(1) |
| χaa [MHz] | [0.055]b | 0.245(9) | |||||
| χbb [MHz] | –0.127(9) | –0.170(9) | |||||
| χcc [MHz] | 0.072(9) | –0.075(9) | |||||
Error in parentheses in units of the last digit.
The data in brackets were fixed to the predicted values.
The two values correspond to the quadrupole coupling constants for the hydrogen bonded and free deuterium atoms, respectively.
Standard deviation of the fit.
Number of lines in the fit.
From the rotational constants of the observed isotopologues, it has been possible to determine the rs substitution coordinates using Kraitchman’s equations.41 They are compared to the ab initio equilibrium coordinates (re) in Table 3. Since the atom coordinates in Kraitchman’s equations appear as their squares, their signs cannot be unambiguously determined but must be compared to the calculated ones.42 Using this procedure, the b substitution coordinates for the water hydrogen atoms are not equal to zero (as predicted by the theoretical calculations) but have a very small value. This can be ascribed to large amplitude motions involving such atoms that are not taken into account in the calculations, since the latter describe the equilibrium structure while the experiment measures the rotational constants in the vibrational ground state. The experimental value of the planar inertia moment along the b axis (Pbb = ∑i=1Nmibi2) for the observed conformer is Pbb = 60.7435(2)uÅ2, which is consistent with the corresponding value of the monomer, Paa = 60.5498(1) uÅ,2,31 confirming that the water molecule and the SO group lie in the symmetry plane of DMSO (the ac plane). The constant value of Pbb upon isotopic substitution of these atoms confirms this statement. In the case of the water hydrogen atoms, the previously cited large amplitude vibrations also cause the larger deviation of Pbb. The results are in agreement with the MP2/aug-cc-pVTZ calculation for the structure of the complex, and the determined values of the rotational constants are actually reproduced by this theoretical method within 4%.
Table 3. Experimental Substitution Coordinates (rs) and Theoretical MP2/aug-cc-pVTZ Equilibrium Coordinates (re) of DMSO-W.
| C | S | Owater | Hwater,free | Hwater,HB | |
|---|---|---|---|---|---|
| |as| [Å] | 0.5722(1)a | 0.93612(4) | 2.44993(1) | 3.24446(2) | 1.78910(3) |
| |bs| [Å] | 1.34878(6) | i 0.022(2)b | i 0.024(1) | 0.2005(3) | 0.0845(7) |
| |cs| [Å] | 0.8348(1) | –0.2999(1) | 0.2869(1) | 0.2167(3) | 0.4481(1) |
| ae [Å] | 0.5523 | 0.9337 | –2.3888 | –3.2643 | –1.7625 |
| be [Å] | –1.3425 | 0.0000 | 0.0000 | 0.0000 | 0.0000 |
| ce [Å] | 0.8471 | –0.2922 | 0.2848 | –0.1106 | –0.4690 |
Error in parentheses in units of the last digit.
In a few cases, the square of the coordinate has been determined to be small and negative, leading to an imaginary value of the coordinate.
After measuring all possible transitions of Conf1 (reported in Table S1), the recorded spectrum was extended to search for the rotational transitions of Conf2. Taking into consideration the relative energy, the values of the dipole moment components and the temperature prior to the expansion, the most intense μa lines of Conf2 were predicted to be 26% of the most intense ones of Conf1, which should make them observable given the overall intensity of the spectrum. However, the rotational transitions of Conf2 were not observed, and this can be attributed to a possible relaxation of the population of this conformation onto that of the global minimum during adiabatic expansion. In order to confirm this, the relaxed potential energy surface was calculated for the torsion of the water molecule around the S=O axis in steps of 5°, as shown in Figure 5. The global minimum corresponds to Conf1, and the two relative equivalent minima correspond to Conf2. The extremely small interconversion barrier between Conf2 and Conf1 suggests that the lack of observation is likely due to a relaxation process of the higher energy form onto the global minimum43 or to the absence of any vibrational state inside the potential energy well.
Figure 5.
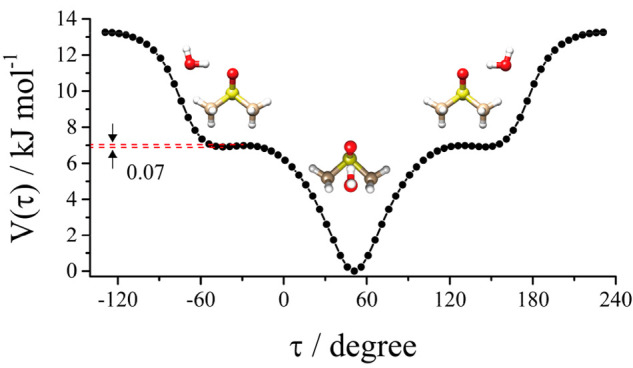
Ab initio (MP2/aug-cc-pVTZ) relaxed potential energy surface for the torsion of the water around the S=O axis. This motion interconverts Conf1 (absolute minimum) with Conf2 (two relative equivalent minima).
In order to get a better visualization of the noncovalent interactions between the molecules, the analysis of the HBs in the three stable conformers was performed using Johnson’s NCI method.31 The NCI method considers the distribution of the electron density (ρ), its gradient (s), and the three eigenvalues (λ1, λ2, λ3) of the electron density Hessian (second derivative) matrix. A comprehensive picture can be drawn using different plots of these quantities. According to the color code reported on the graphics, the gradient isosurfaces (s = 0.5 au) visible in the NCI plots represent the area for attractive (negative sign(λ2)ρ, blue), repulsive (positive sign(λ2)ρ, orange), and weak (green) interactions. The comparison among conformers 1, 2, and 3 is shown in Figure 6a–c. A strong OH···OS HB and two weak CH···OH HBs were observed in Conf1. A similar OH···OS and only one CH···OH HB are seen in Conf2, while three weaker OH···SO and CH···OH interactions are present in Conf3.
Figure 6.
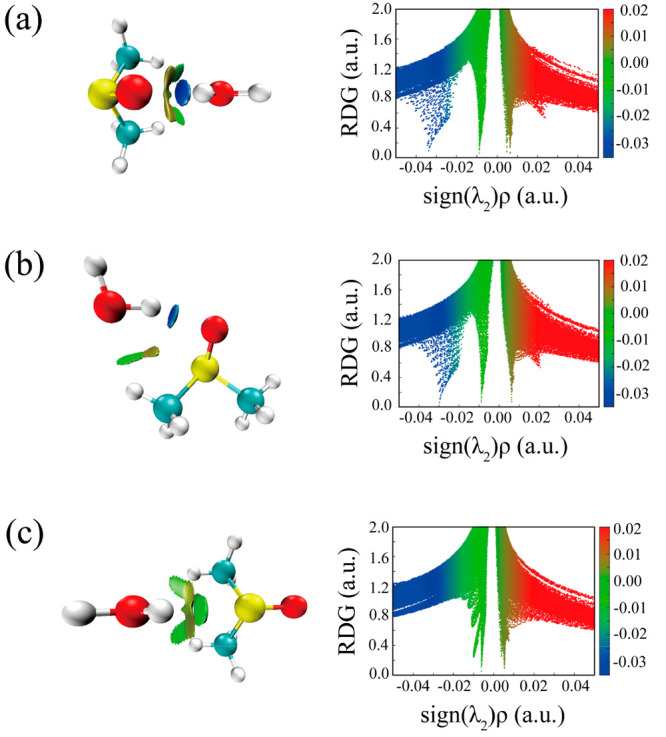
NCI plots from the ab initio (MP2/aug-cc-pVTZ) outputs for three conformers: (a) Conf1, (b) Conf2, and (c) Conf3. Left panel: gradient isosurfaces according to the sign(λ2)ρ (−0.04–0.04 au). Color coding is blue (strong attractive interactions), green (weak attractive interactions), and orange-red (repulsive interaction). Right panel: The RDG versus sign(λ2)ρ. Positive sign(λ2)ρ indicates repulsive interactions, and negative sign(λ2)ρ indicates attractive interactions.
In order to quantify and rank those interactions, a Bader’s Quantum Theory Atoms in Molecules (QTAIM)44 analysis has been performed on the MP2/aug-cc-pVTZ wave functions by using the Multiwfn program.45 This analysis allows the determination of the bond critical points (BCPs), which are saddle points in the electron density space function that identify the covalent and noncovalent interactions in a molecular or supramolecular system. The BCPs related to the previously visualized interactions have been identified for all conformers. They are reported in Figure 7 together with the corresponding electron density and bond length values. In the same figure, there is evidence of ring-like structure formation characterized by ring critical points (RCP).
Figure 7.
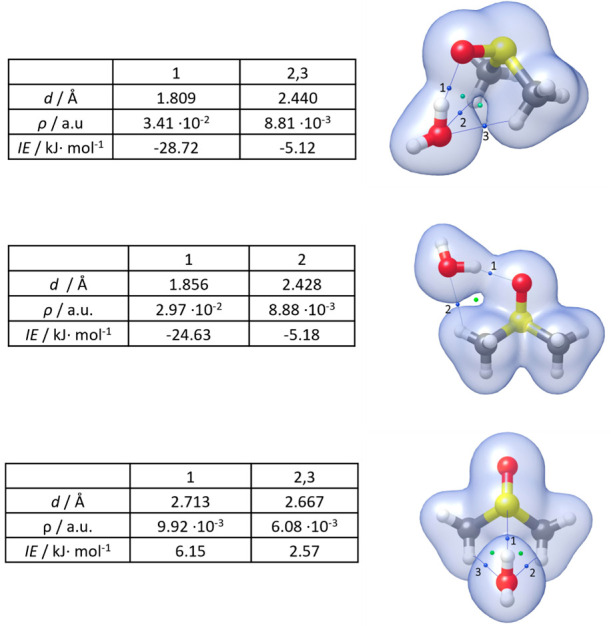
Electron density surface (in blue, isovalue 0.01 au); BCPs and RCPs (in blue and green, respectively) of Conf1, Conf2, and Conf3 of DMSO-W (MP2/aug-cc-pVTZ geometry).
The electron density at a certain BCP is intuitively an indication of the strength of the corresponding interaction. In 2019, the following equation to derive the interaction energy (IE) of an HB in neutral complexes from the density at the corresponding BCP was proposed by Emamian and co-workers:46
| 1 |
The IEBCP for each noncovalent interaction of the investigated complexes is reported in kJ·mol–1 in Figure 7, while the sums of the IEBCP are reported in Table 4, where they are compared to the total IEs derived by the application of the supramolecular approach and the symmetry-adapted perturbation theory (SAPT) approach.33 By a supramolecular approach, we mean the estimation of the binding energy by subtracting from the energy of the complex those of the isolated monomers. We computed energies at the MP2/aug-cc-pVTZ level in two ways:
Table 4. Theoretical Intermolecular Binding and Interaction Energies (kJ·mol–1) for DMSO-W.
| Conf1 | Conf2 | Conf3 | |
|---|---|---|---|
| IEBCP | –38.95 | –29.81 | –11.29 |
| BEΔ | –44.43 | –37.53 | –19.35 |
| IEΔ | –45.99 | –38.71 | –19.67 |
| IESAPT | –44.98 | –38.46 | –17.34 |
| electrostatic | –74.42 | –58.61 | –23.12 |
| exchange-repulsion | 85.24 | 63.76 | 25.70 |
| induction | –27.43 | –21.53 | –5.07 |
| dispersion | –28.36 | –22.08 | –14.85 |
•As the difference between the energy of the binary molecular complex (A–B) and the energy of the two constituting units (A and B) in their minimum configuration
| 4 |
•As the difference between the energy of the molecular complex and the energy of the isolated monomers at the geometry within the complex (A* and B*)
| 5 |
SAPT is a perturbative approach used to compute the IE as a perturbation to the Hamiltonian of the individual monomers. It allows not only the estimation of the total IE but also the decomposition of it into electrostatic, exchange, induction, and dispersion components. In this work, we applied a high order SAPT approach (DF-SAPT2+(3)δMP2/aug-cc-pVTZ) implemented in the Psi4 package.47 The BE and IE values obtained are reported in Table 4 together with the SAPT contributions.
All methods predicted Conf1 as the highest binding energy species, followed by Conf2 and Conf3, in agreement with the observed conformational preference. By inspecting the results, we can notice that, first, the two supramolecular approaches give similar results, suggesting that the geometry rearrangement contribution to the total BE is negligible and, second, that the supramolecular and SAPT approaches agree, whereas the values derived as the sum of the BCPs’ contributions are smaller. The underestimation can be ascribed both to the nonapplicability of formula 1 to large complexes with multiple and highly nondirectional HBs and to there possibly being more to be taken into account besides the IE at the BCPs.
Conclusions
The rotational spectrum of the 1:1 DMSO-W has been assigned in the frequency range 6–18 GHz with PJ-FTMW spectroscopy, and the observed conformation determined to have the water molecule is located within the symmetry plane of DMSO (the ac plane of the complex). This is proved by the value of the planar inertia moment Pbb, which is consistent with the Paa of the DMSO monomer. The hypothesis is also supported by the fact that transitions involving μb were not observed. The observations of the isotopologues of DMSO (34S and 13C) in natural abundance and the enriched water isotopologues (H218O and deuterated species) allowed the determination of the experimental rs coordinates for the S and C atoms of DMSO and the O and H atoms of water. A primary OH···OS HB exists between the water hydrogen and the DMSO oxygen where the water acts as the proton donor and the DMSO as a proton acceptor, and two weak interactions exist between the terminal CH groups and the water oxygen where the DMSO acts as the proton donor and the water as a proton acceptor.
The observed structure of the 1:1 complex shows a very high interaction energy (about 45 kJ mol–1) primarily due to the OH···OS HB, which accounts for more than 70% of the total energy mainly attributed to the electrostatic contribution. This high stability of small clusters has been proposed to be responsible for the unusually low melting point observed in DMSO water mixtures.17
Acknowledgments
We acknowledge the CINECA award under the ISCRA initiative, for the availability of high-performance computing resources and support. D.L. and W.S. thank the China Scholarship Council (CSC) for financial support. This work was supported by the Italian MIUR (Attività Base di Ricerca) and the University of Bologna (Ricerca Fondamentale Orientata).
Supporting Information Available
The Supporting Information is available free of charge at https://pubs.acs.org/doi/10.1021/acs.jpca.2c04599.
Experimental transition frequencies of observed species of DMSO-W, MP2/aug-cc-pVTZ geometries, and atom numbering adopted for DMSO-Water (Conf1) (PDF)
The authors declare no competing financial interest.
Special Issue
Published as part of The Journal of Physical Chemistry virtual special issue “Vincenzo Barone Festschrift”.
Supplementary Material
References
- Akkök Ç. A.; Liseth K.; Hervig T.; Ryningen A.; Bruserud Ø.; Ersvær E. Use of Different DMSO Concentrations for Cryopreservation of Autologous Peripheral Blood Stem Cell Grafts Does Not Have Any Major Impact on Levels of Leukocyte-and Platelet-Derived Soluble Mediators. Cytotherapy 2009, 11 (6), 749–760. 10.3109/14653240902980443. [DOI] [PubMed] [Google Scholar]
- LeBel R. G.; Goring D. A. I. Density, Viscosity, Refractive Index, and Hygroscopicity of Mixtures of Water and Dimethyl Sulfoxide. J. Chem. Eng. Data 1962, 7 (1), 100–101. 10.1021/je60012a032. [DOI] [Google Scholar]
- Catalán J.; Diaz C.; García-Blanco F. Characterization of Binary Solvent Mixtures of DMSO with Water and Other Cosolvents. J. Org. Chem. 2001, 66 (17), 5846–5852. 10.1021/jo010415i. [DOI] [PubMed] [Google Scholar]
- Cowie J. M. G.; Toporowski P. M. Association in the Binary Liquid System Dimethyl Sulfoxide-Water. Can. J. Chem. 1961, 39 (11), 2240–2243. 10.1139/v61-296. [DOI] [Google Scholar]
- Packer K. J.; Tomlinson D. J. Nuclear Spin Relaxation and Self-Diffusion in the Binary System, Dimethylsulfoxide (DMSO)+ Water. Trans. Faraday Soc. 1971, 67, 1302–1314. 10.1039/tf9716701302. [DOI] [Google Scholar]
- Fahy G. M. Cryoprotectant Toxicity Neutralization. Cryobiology 2010, 60 (3), S45–S53. 10.1016/j.cryobiol.2009.05.005. [DOI] [PubMed] [Google Scholar]
- Lei Y.; Li H.; Han S. An All-Atom Simulation Study on Intermolecular Interaction of DMSO-Water System. Chem. Phys. Lett. 2003, 380 (5), 542–548. 10.1016/j.cplett.2003.09.064. [DOI] [Google Scholar]
- Kirchner B.; Reiher M. The Secret of Dimethyl Sulfoxide- Water Mixtures. A Quantum Chemical Study of 1DMSO- n Water Clusters. J. Am. Chem. Soc. 2002, 124 (21), 6206–6215. 10.1021/ja017703g. [DOI] [PubMed] [Google Scholar]
- Mrázková E.; Hobza P. Hydration of Sulfo and Methyl Groups in Dimethyl Sulfoxide Is Accompanied by the Formation of Red-Shifted Hydrogen Bonds and Improper Blue-Shifted Hydrogen Bonds: An Ab Initio Quantum Chemical Study. J. Phys. Chem. A 2003, 107 (7), 1032–1039. 10.1021/jp026895e. [DOI] [Google Scholar]
- Soper A. K.; Luzar A. A Neutron Diffraction Study of Dimethyl Sulfoxide-Water Mixtures. J. Chem. Phys. 1992, 97 (2), 1320–1331. 10.1063/1.463259. [DOI] [Google Scholar]
- Soper A. K.; Luzar A. Orientation of Water Molecules around Small Polar and Nonpolar Groups in Solution: A Neutron Diffraction and Computer Simulation Study. J. Phys. Chem. 1996, 100 (4), 1357–1367. 10.1021/jp951783r. [DOI] [Google Scholar]
- Carles S.; Desfrançois C.; Schermann J. P.; Bergès J.; Houée-Levin C. Rydberg Electron-Transfer Spectroscopy and Ab Initio Studies of Dimethylsulfoxide-Water Neutral and Anion Dimers. Int. J. Mass Spectrom. 2001, 205 (1–3), 227–232. 10.1016/S1387-3806(00)00266-9. [DOI] [Google Scholar]
- Chang H.; Jiang J.; Feng C.; Yang Y.; Su C.; Chang P.; Lin S. High-Pressure Spectroscopic Probe of Hydrophobic Hydration of the Methyl Groups in Dimethyl Sulfoxide. J. Chem. Phys. 2003, 118 (4), 1802–1807. 10.1063/1.1532347. [DOI] [Google Scholar]
- Li Q.; An X.; Gong B.; Cheng J. Spectroscopic and Theoretical Evidence for the Cooperativity between Red-Shift Hydrogen Bond and Blue-Shift Hydrogen Bond in DMSO Aqueous Solutions. Spectrochim. Acta, Part A 2008, 69 (1), 211–215. 10.1016/j.saa.2007.03.034. [DOI] [PubMed] [Google Scholar]
- Oh K. I.; Rajesh K.; Stanton J. F.; Baiz C. R. Quantifying Hydrogen-Bond Populations in Dimethyl Sulfoxide/Water Mixtures. Angew. Chem. 2017, 129 (38), 11533–11537. 10.1002/ange.201704162. [DOI] [PubMed] [Google Scholar]
- Yang B.; Cao X.; Wang C.; Wang S.; Sun C. Investigation of Hydrogen Bonding in Water/DMSO Binary Mixtures by Raman Spectroscopy. Spectrochim. Acta, Part A 2020, 228, 117704. 10.1016/j.saa.2019.117704. [DOI] [PubMed] [Google Scholar]
- Kirchner B.; Reiher M. The Secret of Dimethyl Sulfoxide- Water Mixtures. A Quantum Chemical Study of 1DMSO- n Water Clusters. J. Am. Chem. Soc. 2002, 124 (21), 6206–6215. 10.1021/ja017703g. [DOI] [PubMed] [Google Scholar]
- Becucci M.; Melandri S. High-Resolution Spectroscopic Studies of Complexes Formed by Medium-Size Organic Molecules. Chem. Rev. 2016, 116 (9), 5014–5037. 10.1021/acs.chemrev.5b00512. [DOI] [PubMed] [Google Scholar]
- Piani G.; Pasquini M.; Pietraperzia G.; Becucci M.; Armentano A.; Castellucci E. The Anisole-Ammonia Complex: Marks of the Intermolecular Interactions. Chem. Phys. Lett. 2007, 434 (1–3), 25–30. 10.1016/j.cplett.2006.11.110. [DOI] [Google Scholar]
- Biczysko M.; Piani G.; Pasquini M.; Schiccheri N.; Pietraperzia G.; Becucci M.; Pavone M.; Barone V. On the Properties of Microsolvated Molecules in the Ground (S0) and Excited (S1) States: The Anisole-Ammonia 1:1 Complex. J. Chem. Phys. 2007, 127 (14), 144303. 10.1063/1.2767265. [DOI] [PubMed] [Google Scholar]
- Melandri S.; Evangelisti L.; Maris A.; Caminati W.; Giuliano B. M.; Feyer V.; Prince K. C.; Coreno M. Rotational and Core Level Spectroscopies as Complementary Techniques in Tautomeric/Conformational Studies: The Case of 2-Mercaptopyridine. J. Am. Chem. Soc. 2010, 132 (30), 10269–10271. 10.1021/ja104484b. [DOI] [PubMed] [Google Scholar]
- Favero L. B.; Giuliano B. M.; Maris A.; Melandri S.; Ottaviani P.; Velino B.; Caminati W. Features of the C-H···N Weak Hydrogen Bond and Internal Dynamics in Pyridine-CHF3. Chemistry 2010, 16 (6), 1761–1764. 10.1002/chem.200902852. [DOI] [PubMed] [Google Scholar]
- Grabow J. U.; Stahl W.; Dreizler H. A Multioctave Coaxially Oriented Beam-Resonator Arrangement Fourier-Transform Microwave Spectrometer. Rev. Sci. Instrum. 1996, 67 (12), 4072–4084. 10.1063/1.1147553. [DOI] [Google Scholar]
- Balle T. J.; Flygare W. H. Fabry-Perot Cavity Pulsed Fourier Transform Microwave Spectrometer with a Pulsed Nozzle Particle Source. Rev. Sci. Instrum. 1981, 52 (1), 33–45. 10.1063/1.1136443. [DOI] [Google Scholar]
- Caminati W.; Millemaggi A.; Alonso J. L.; Lesarri A.; López J. C.; Mata S. Molecular Beam Fourier Transform Microwave Spectrum of the Dimethylether-Xenon Complex: Tunnelling Splitting and 131Xe Quadrupole Coupling Constants. Chem. Phys. Lett. 2004, 392 (1–3), 1–6. 10.1016/j.cplett.2004.05.038. [DOI] [Google Scholar]
- Caminati W.; Evangelisti L.; Feng G.; Giuliano B. M.; Gou Q.; Melandri S.; Grabow J. U. On the Cl. . .C Halogen Bond: A Rotational Study of CF3Cl. . .CO. Phys. Chem. Chem. Phys. 2016, 18 (27), 17851–17855. 10.1039/C6CP01059H. [DOI] [PubMed] [Google Scholar]
- Pickett H. M. The Fitting and Prediction of Vibration-Rotation Spectra with Spin Interactions. J. Mol. Spectrosc. 1991, 148 (2), 371–377. 10.1016/0022-2852(91)90393-O. [DOI] [Google Scholar]
- Grimme S. Exploration of Chemical Compound, Conformer, and Reaction Space with Meta-Dynamics Simulations Based on Tight-Binding Quantum Chemical Calculations. J. Chem. Theory. Comput. 2019, 15 (5), 2847–2862. 10.1021/acs.jctc.9b00143. [DOI] [PubMed] [Google Scholar]
- Pracht P.; Bohle F.; Grimme S. Automated Exploration of the Low-Energy Chemical Space with Fast Quantum Chemical Methods. Phys. Chem. Chem. Phys. 2020, 22 (14), 7169–7192. 10.1039/C9CP06869D. [DOI] [PubMed] [Google Scholar]
- Frisch M. J.; Trucks G. W.; Schlegel H. B.; Scuseria G. E.; Robb M. A.; Cheeseman J. R.; Scalmani G.; Barone V.; Petersson G. A.; Nakatsuji H.; et al. Gaussian 16, revision B. 01; Gaussian, Inc.: Wallingford, CT, 2016. [Google Scholar]
- Johnson E. R.; Keinan S.; Mori-Sánchez P.; Contreras-García J.; Cohen A. J.; Yang W. Revealing Noncovalent Interactions. J. Am. Chem. Soc. 2010, 132 (18), 6498–6506. 10.1021/ja100936w. [DOI] [PMC free article] [PubMed] [Google Scholar]
- Bader R. F. W.. Atoms in Molecules: A Quantum Theory; Oxford University Press: Oxford, UK, 1990. [Google Scholar]
- Jeziorski B.; Moszynski R.; Szalewicz K. Perturbation Theory Approach to Intermolecular Potential Energy Surfaces of van der Waals Complexes. Chem. Rev. 1994, 94 (7), 1887–1930. 10.1021/cr00031a008. [DOI] [Google Scholar]
- Fliege E.; Dreizler H.; Typke V. Centrifugal Distortion and Ground State Internal Rotation Analysis of the Microwave Spectrum of Dimethylsulfoxide. Zeitschrift für Naturforschung A 1983, 38 (6), 668–675. 10.1515/zna-1983-0608. [DOI] [Google Scholar]
- Feder W.; Dreizler H.; Rudolph H. D.; Typke V. Rs-Struktur von Dimethylsulfoxid Im Vergleich Zur R0-Struktur. Zeitschrift für Naturforschung A 1969, 24 (2), 266–278. 10.1515/zna-1969-0215. [DOI] [Google Scholar]
- Dreizler H.; Dendl G. Bestimmung Des Hinderungspotentials Der Internen Rotation Aus Dem Mikrowellenspektrum von Dimethylsulfoxyd. Zeitschrift für Naturforschung A 1965, 20 (2), 1431–1440. 10.1515/zna-1965-1108. [DOI] [Google Scholar]
- Dreizler H.; Dendl G. Erfahrungen Bei Der Analyse Der Zentrifugalaufweitung in Rotationsspektren I. Dimethylsulfoxyd. Zeitschrift für Naturforschung A 1965, 20 (2), 30–37. 10.1515/zna-1965-0108. [DOI] [Google Scholar]
- Dreizler H.; Dendl G. Rotationsspektruni, R0-Struktur Und Dipolmoment von Diniethvlsulfoxyd. Zeitschrift für Naturforschung A 1964, 19 (23), 512–514. 10.1515/zna-1964-0418. [DOI] [Google Scholar]
- Maris A.; Favero L. B.; Song W.; Lv D.; Evangelisti L.; Melandri S. Searching for Biosignatures by Their Rotational Spectrum: Global Fit and Methyl Group Internal Rotation Features of Dimethylsulfoxide up to 116 GHz. Int. J. Astrobiol. 2022, 1–18. 10.1017/S1473550422000271. [DOI] [Google Scholar]
- Vigorito A.; Paoloni L.; Calabrese C.; Evangelisti L.; Favero L. B.; Melandri S.; Maris A. Structure and Dynamics of Cyclic Amides: The Rotational Spectrum of 1, 3-Dimethyl-2-Imidazolidinone. J. Mol. Spectrosc. 2017, 342, 38–44. 10.1016/j.jms.2017.04.014. [DOI] [Google Scholar]
- Kraitchman J. Determination of Molecular Structure from Microwave Spectroscopic Data. Am. J. Phys. 1953, 21 (1), 17–24. 10.1119/1.1933338. [DOI] [Google Scholar]
- Evangelisti L.; Perez C.; Seifert N. A.; Pate B. H.; Dehghany M.; Moazzen-Ahmadi N.; McKellar A. R. W. Theory vs. Experiment for Molecular Clusters: Spectra of OCS Trimers and Tetramers. J. Chem. Phys. 2015, 142 (10), 104309. 10.1063/1.4914323. [DOI] [PubMed] [Google Scholar]
- Ruoff R. S.; Klots T. D.; Emilsson T.; Gutowsky H. S. Relaxation of Conformers and Isomers in Seeded Supersonic Jets of Inert Gases. J. Chem. Phys. 1990, 93 (5), 3142–3150. 10.1063/1.458848. [DOI] [Google Scholar]
- Bader R. F. W. A Quantum Theory of Molecular Structure and Its Applications. Chem. Rev. 1991, 91 (5), 893–928. 10.1021/cr00005a013. [DOI] [Google Scholar]
- Lu T.; Chen F. Multiwfn: A Multifunctional Wavefunction Analyzer. J. Comput. Chem. 2012, 33 (5), 580–592. 10.1002/jcc.22885. [DOI] [PubMed] [Google Scholar]
- Emamian S.; Lu T.; Kruse H.; Emamian H. Exploring Nature and Predicting Strength of Hydrogen Bonds: A Correlation Analysis Between Atoms-in-Molecules Descriptors, Binding Energies, and Energy. J. Comput. Chem. 2019, 40 (32), 2868–2881. 10.1002/jcc.26068. [DOI] [PubMed] [Google Scholar]
- Parrish R. M.; Burns L. A.; Smith D. G. A.; Simmonett A. C.; DePrince A. E.; Hohenstein E. G.; Bozkaya U.; Sokolov A. Y.; di Remigio R.; Richard R. M.; et al. Psi4 1.1: An Open-Source Electronic Structure Program Emphasizing Automation, Advanced Libraries, and Interoperability. J. Chem. Theory Comput. 2017, 13 (7), 3185–3197. 10.1021/acs.jctc.7b00174. [DOI] [PMC free article] [PubMed] [Google Scholar]
Associated Data
This section collects any data citations, data availability statements, or supplementary materials included in this article.