Abstract
Chest X-ray (CXR) images are considered useful to monitor and investigate a variety of pulmonary disorders such as COVID-19, Pneumonia, and Tuberculosis (TB). With recent technological advancements, such diseases may now be recognized more precisely using computer-assisted diagnostics. Without compromising the classification accuracy and better feature extraction, deep learning (DL) model to predict four different categories is proposed in this study. The proposed model is validated with publicly available datasets of 7132 chest x-ray (CXR) images. Furthermore, results are interpreted and explained using Gradient-weighted Class Activation Mapping (Grad-CAM), Local Interpretable Modelagnostic Explanation (LIME), and SHapley Additive exPlanation (SHAP) for better understandably. Initially, convolution features are extracted to collect high-level object-based information. Next, shapely values from SHAP, predictability results from LIME, and heatmap from Grad-CAM are used to explore the black-box approach of the DL model, achieving average test accuracy of 94.31 ± 1.01% and validation accuracy of 94.54 ± 1.33 for 10-fold cross validation. Finally, in order to validate the model and qualify medical risk, medical sensations of classification are taken to consolidate the explanations generated from the eXplainable Artificial Intelligence (XAI) framework. The results suggest that XAI and DL models give clinicians/medical professionals persuasive and coherent conclusions related to the detection and categorization of COVID-19, Pneumonia, and TB.
Keywords: eXplainable AI, Deep learning, COVID-19, Pneumonia, Tuberculosis, SHAP, LIME, Grad-CAM
1. Introduction
Millions of people are being infected and dying each year with pulmonary diseases such as COVID-19, Pneumonia, and Tuberculosis (TB). The ratio is supposed to increase every year [1], [2]. COVID-19 has been a severe pandemic and the exponential growth of COVID-19 cases has made tremendous pressure on the healthcare system around the globe. Similarly, Pneumonia and TB are also life-threatening diseases [3], [4]. As a result, accurate and timely detection of such diseases is critical for appropriate treatment and saving lives [5], [6].
In recent years, due to incredible strides of deep learning (DL) in various domains such as computer vision [7], image classification [8], satellite image analysis [9], neural network optimization [10], [11], natural language processing [12], their applications in biomedical analysis such as brain tumor [13], alzheimer’s disease [14], pulmonary disease [15] detection and many more have been investigated. Though early systems were restricted due to low sensitivity of large false positive rate [16], DL-based neural networks have made significant progress in feature learning and representations [17]. They have created an opportunity for developing an intelligent and automated framework for image-based health care solutions [18]. For instance, multiple DL models in medical image analysis [15], [19], [20], [21] have been proposed to learn powerful image features for the diagnosis of diseases thereby preventing severe sickness. Despite magnetic resonance imaging (MRI) and computerized tomography (CT) scan being more efficient in producing clear pictures, they are very expensive and contain radiation exposure. Consequently, the CXR images are the preferred option for the detection of pulmonary diseases [22], [23], [24]. On the other side, for connecting the orthopedic dots better as a future paradigm, translational medicine based on three-dimensional simulation and bio-markers are also in practice to improve the accuracy and precisions [25], [26].
DL-based methods have achieved high accuracy in CXR image classification [19]. However, these methods have three major limitations. Firstly, the DL-based methods that use the pre-trained model have many parameters which take more resources for model training and validation. Secondly, the light weight DL models which are trained from scratch lack result interpretation ability. Finally, the existing DL models for CXR image classification are primarily focused on increasing accuracy, ignoring the aided interpretation of the model’s output. Thereby, there is always a medical risk in utilizing such a model by medical professionals [27]. To address these limitations, we propose an XAI-based DL architecture to detect and classify COVID-19, Pneumonia and TB with CXR images. Our proposed model is light weight and has fewer parameters (in millions) which can be deployed in low resource computing platforms. Next, the proposed model is explained with three widely used XAI algorithms: Shapley additive explanation (SHAP), local interpretable model-agnostic explanation (LIME), and Gradient-weighted Class Activation Mapping (Grad-CAM), to detect the infected region of CXR image. Furthermore, model explanations were validated along with the medical expert’s opinion. The main contributions of the proposed work are summarized in what follows:
-
(i)
We propose a light weight convolution neural network (CNN) for lung diseases (COVID-19, Pneumonia, and TB) detection on chest X-ray (CXR) images.
-
(ii)
We achieve a highly noticeable interpretation of the model’s output on CXR images using XAI algorithms when validated with medical radiology experts without compromising the accuracy of the model.
-
(ii)
We also compare the performance of our proposed CNN model with recent methods and show that our model has outperformed the existing methods while classifying the CXR images into COVID-19, Pneumonia, TB and Normal.
Continuing further, the section “Related Works” details the existing works on CXR image classification using DL and XAI. Section “Material and methods” describes the data collection and proposed methods. Experiments are discussed in the section “Result and discussion”. Section “Medical sensation” provides the medical professional advice on the model’s output and explainability. The paper is concluded with future recommendations in “Conclusion and future Works”.
2. Related work
Several recent works on medical image analysis show that machine learning (ML) and deep learning (DL) models boost the computer-aided medical diagnosis for CXR images and CT image-based disease detection such as COVID-19, Pneumonia and TB. Here, we summarize the recent works on the diagnosis of COVID-19, Pneumonia, and TB using medical image analysis, focusing on CXR images.
According to Sitaula et al. [28], the resolution of CXR images varies in real applications and the single-scale bag of deep visual words (BoDVW)-based features are insufficient to capture the detailed semantic information of the infected regions in the lungs. They use three distinct kernels 1 × 1, 2 × 2, and 3 × 3 to conduct the convolution with max pooling operation over the fourth pooling layer for multi-scale bags of deep visual words-based features. Their strategy achieved a noteworthy classification accuracy of 84.37%, 88.88%, 90.29%, and 83.65% for four public CXR datasets after assessing the suggested features with the Support Vector Machine (SVM) classification algorithm. In [29], authors predicted the number of COVID-19 infections over the next seven days. They created a cloud-based machine learning short-term forecasting model for Bangladesh. The model used a variety of regression-based machine learning models to analyze infected case data. By using sample data from the previous 25 days that were recorded on the web application, the method was able to predict the number of infected cases with accuracy. The results can be used to create and evaluate preventative methods and pinpoint the elements that influence the spread of the COVID-19 virus in Bangladesh the most.
DL model with nine hidden layers was proposed by Mahbub et al. [19] for CXR image classification. With the DL model trained from scratch, six different datasets derived from publicly available CXR images were employed for the binary classification of three disease classes: COVID-19, TB and Pneumonia. The model yielded 99.87% accuracy on COVID-19, 99.55% on Pneumonia, 99.76% on TB, 98.89% on COVID-19 vs Pneumonia, 98.99% on COVID-19 vs TB, and 100% on Pneumonia vs TB. Although the model can categorize the disease classes with high accuracy, it was evaluated separately on six datasets, each of which had only two classes. In addition, the study did not implement any XAI, which makes their model more of a black-box. Similarly, Qaqos et al. [30], used stochastic gradient descent to train the DL model with 6587 CXR images. Proceeding with 128 × 128 images and 100 epochs, the model was able to achieve 94.53% accuracy while classifying CXR images into four classes (COVID-19, Pneumonia and TB). However, No XAI algorithms were implemented.
Transfer learning with VGG16 was implemented for TB identification on CXR images by Mostofa et al. [31]. They used 1324 CXR images to fine-tune the model which yielded an accuracy of 80.0% while classifying CXR images into TB and healthy categories. Shastri et al. [32] employed a pre-trained DCNN-based Inception-V3 model with transfer learning. A total of 3532 CXR images in the collected dataset were enhanced, and each image was resized to 299 × 299 × 3. The model had a 93% accuracy rate. The study, however, did not classify TB in CXR images. Likewise, Rahimzadeh et al. [33] proposed a parallel deep feature extraction implementing Xception and ResNet50V2. The concatenated feature vector of both Xception and ResNet50V2 aided the network to learn classification. With five folds for training and each fold for 8 phases, the study showed an accuracy of 91.4%. Despite its performance, the study holds no evidence of TB classification or XAI’s existence. Colombo et al. [34], observed the performance of three different pre-trained CNN models: Alexnet, GoogleNet and ResNet on pulmonary TB detection. Combining images from Montgomery, Shenzhen and PadChest datasets of 1092 total samples, GoogleNet achieved maximum accuracy of 75%. Similarly, Shelke et al. [35] linked three pre-trained DL-based CNN models, each of which was in charge of a different classification. Taking 64 × 64 × 1 CXR datasets as input, VGG-16 was used to classify, Pneumonia, and TB. DenseNet-161 was used to further classify Pneumonia and COVID-19 using the previously classified Pneumonia images. Finally, the COVID-19 images were fed into ResNet-18, which classifies them into mild, medium and severe. The accuracy of the VGG-16, DenseNet-161, and ResNet-18 models was 95.9%, 98.9%, and 76%, respectively. No XAI implementation was found in the study. Al-Timemy et al. [36] used 14 pre-trained CNN models for the feature extraction followed by 5-fold cross-validation. Trained over a dataset of 2186 CXR images the study claimed 91.6% detection accuracy. To increase the effectiveness and precision of computer-aided diagnostic systems’ (CADs) diagnostic performance, authors in [37] developed a deep learning method employing a transfer learning methodology to categorize lung illnesses on CXR pictures. A deep learning network (EfficientNet v2-M) was used to directly input CXR pictures and extract the characteristics that would be useful for classifying diseases. They tested on three classes of the U.S. National Institutes of Health (NIH) dataset: normal, pneumonia, and pneumothorax, and obtained validation performances of loss = 0.6933, accuracy = 82.15%, sensitivity = 81.40%, and specificity = 91.65%. The capsule neural network model was used to categorize CXR pictures that demonstrated a COVID-19 infection by authors [38]. The model was trained using 6310 chest X-ray images divided into three categories: normal, pneumonia, and COVID-19. Comparing CapsNet to traditional convolutional neural network (CNN) models, some advantages include viewpoint invariance, fewer parameters, and better generalization. During the model’s training, the suggested model had an accuracy of more than 95%.
Along with transfer learning, Sitaula et al. [15], used an attention mechanism with VGG16 to classify CXR images. Methods were evaluated for three CXR image datasets with the highest accuracy reported as 87.49% while classifying CXR images into five classes: COVID-19, Normal, no_findings, Pneumonia bacteria, and Pneumonia Viral. The extracted region on CXR images by VGG16 and attention model were visualized with Grad-CAM [39]. Ashan et al. [21] study was conducted to detect COVID 19 patients from CXR and CT images and implement six deep CNN learning models, including VGG16, MobileNetV2, InceptionResNetV2, ResNet50, ResNet101, and VGG19 using 400 CXR and 400 CT images. Achieving an average accuracy of 82.94% on a dataset with CT images and 93.94% on a dataset with CXR images, MobileNetV2 outweigh NasNetMobile. The overall prediction was explained by applying the heatmap of class activation and analyzing the feature extraction implementing LIME. Manjurul et al. [40] achieved high performance on VGG16 model (98.5 ± 1.19%) among six different Deep CNN models: VGG16, MobileNetV2, InceptionResNetV2, ResNet50, ResNet101 and VGG19 with mixed dataset of CT and X-ray images to classify COVID-19 patients. Results were further explained with LIME. Chetoui et al. [41] fine-tuned the EfficientNet-B5 pre-trained with Imagenet [42] for both multi-class and binary CXR classification. The DeepCCXR-Multi for multi-class classification (COVID-19, Pneumonia and Normal) and DeepCCXR-Bin for binary classification (COVID-19 and Normal). Employed with a total of nine datasets with more than 3200 COVID-19 CXR images, the classification accuracy of DeepCCXR-Multi and DeepCCXR-Bin was 95.62% and 92.99%, respectively. Furthermore, individual testing of nine datasets was conducted, yielding DeepCCXR-Bin classification accuracy from 91% to 98% and DeepCCXR-Multi classification accuracy ranges from 70% to 93%. To explain the gradient output of the CNN models for the target class, Grad-CAM [39] based visualization for both true positive and true negative cases was performed.
Besides CXR image analysis, CT image-based identification of TB, COVID, and Pneumonia has been investigated in the recent past using DL models. For instance, Li et al. [43], used ResNet50 pre-trained model to distinguish COVID-19 and Pneumonia in CT images. They trained the DL model with 4356 CT samples and obtain 95% accuracy and visualized significant regions in the CT images using Grad-CAM towards explainability of the model. However, the heat-maps are not abundant to identify the unique features used by the model for prediction.
3. Material and methods
3.1. Data collection and pre-processing
CXR images of four categories: COVID-19, Pneumonia, TB, and normal were collected from three publicly available datasets [44], [45], [46], with a total of 7132 CXR images belonging to four classes. Table 1 shows the total statistics of CXR images used to build an explanatory DL model from chest radiographs.
Table 1.
CXR images collection statistics from three publicly available datasets.
Since the images from various datasets were not uniform in size, images were resized into 180 × 180 × 3. A horizontal flip operation was performed to augment the samples on the fly. Finally, each image pixel was rescaled into the range [0,1] to normalize the images. Sample CXR images for individual categories, extracted from the CXR dataset are shown in Fig. 2. Though the dataset is class imbalanced with small COVID-19 and TB data, no larger penalties were associated with the misclassification. Stratified data sampling was used to obtain an equal number of samples for each class in every training batch.
Fig. 2.
Sample images abstracted from the CXR images dataset. Note that (a), (b), (c) and (d) denote “COVID-19”, “Normal”, “Pneumonia” and “TB”, classes respectively.
3.2. Proposed method
The proposed DL-XAI method for CXR image classification consists of two main components : CNN model for CXR classification and XAI-based explanation generations framework. The overall architecture of the proposed method is represented in Fig. 1.
Fig. 1.
The proposed explanatory DL-XAI model to classify CXR images into COVID-19, Pneumonia and TB.
3.2.1. CNN model
CNN, a well-known approach for computer vision applications, is typically used to evaluate visual imagery. From visual image and video recognition, the DL architectures like Fig. 3, dominates in recognizing objects, patterns, and textures. Therefore, in this work, a light weight CNN model for CXR classification using 2D-convolution, max-pooling, dropout, flatten and dense layers is designed. It consists of five convolutions layers, each followed by a dropout and max-pooling layer, except the convolution layer next to the input layer. Flatten layer converts 2D-features into 1D-features and feeds into a dense layer followed by a dropout layer. Finally, soft-max activation is used for classification. Each convolution layer is supplemented with the rectified linear unit (ReLU) as an activation function. CNN parameters such as kernel size, stride and filters for convolutions layers, dropout value for dropout layers and pool-size for max-pooling layers are supplied explicitly. A kernel size of 3 × 3 is selected as a small kernel size can capture the deteriorated region on CXR image more efficiently [15], [28]. Authors in [28] suggested keeping stride as 1, because a higher stride could miss the discriminating semantic regions. Similarly, dropouts are applied throughout the neural network levels (from input to convolution layers to fully connected layers) to preserve the network from over-fitting. Furthermore, the learnable parameters of our proposed CNN model are reported in Table 2 which illustrates the light weight nature of our model.
Fig. 3.
Detail architecture of proposed CNN model for CXR classification.
Table 2.
Learnable parameters of the proposed DL model. Note that (F,K,S) denotes the number of filters, kernel size and stride used in the respective convolution layer.
| S.N. | Layer type | (F,K,S) | output shape | parameters |
|---|---|---|---|---|
| 1 | Input | – | (180,180,3) | 0 |
| 2 | Conv2D + relu | (3,3,1) | (178, 178, 3) | 84 |
| 3 | Conv2D + relu | (32,3,1) | (176, 176, 32) | 896 |
| 4 | MaxPool2D (2) | – | (88, 88, 32) | 0 |
| 5 | dropout (0.05) | – | (88, 88, 32) | 0 |
| 6 | Conv2D + relu | (96,3,1) | (86, 86, 96) | 27744 |
| 7 | MaxPool2D (3) | – | (28, 28, 96) | 0 |
| 8 | dropout (0.2) | – | (28, 28, 96) | 0 |
| 8 | Conv2D + relu | (128,3,1) | (26, 26, 128) | 110720 |
| 9 | MaxPool2D (2) | – | (13,13,128) | 0 |
| 10 | dropout(0.1) | – | (13, 13, 128) | 0 |
| 11 | Conv2D + relu | (256,3,1) | (11, 11, 256) | 295168 |
| 12 | MaxPool2D (2) | – | (5,5,256) | 0 |
| 13 | dropout(0.1) | (5, 5, 256) | 0 | |
| 14 | Flatten | – | 6400 | |
| 15 | Dense + relu | – | 512 | 3277312 |
| 16 | dropout(0.45) | – | 512 | 0 |
| 17 | Dense + softmax | – | 4 | 2052 |
| Total parameters | 3,713,976 | |||
3.2.2. Explainable AI
The demand for explainability of deep learning-based approaches develops as the number of such methods grows, especially in high-stakes decision-making fields like medical image analysis [47]. The results from the DL model are further interpreted and explained for better readability to medical professionals which can help them in fast and accurate diagnosis of COVID-19, TB, and pneumonia diseases [27]. For this, widely used XAI algorithms: SHAP, LIME and Grad-CAM are imposed in this work.
SHAP uses the concept of Shapley values to score model feature influence by averaging the marginal contributions of feature values. For each pixel on a predicted image, the scores show its contribution and can be used to explain classification. All conceivable combinations of features from pulmonary illnesses are used to calculate the Shapley value. After pixelating the Shapley values, red pixels enhance the likelihood of predicting a class, whereas blue pixels lower the likelihood of predicting a class [48]. Shapley values are calculated using Eq. (1).
| (1) |
Where for particular feature i, fx is the change of output incorporated by shapely values. With the exception of feature i, S is the subset of all features from feature N. The weighting factor counts the number of ways the subset S can be permuted. Given the features subset S, the predicted result is denoted by fx(S) is calculated from Eq. (2).
| (2) |
In place of each original characteristic (xi), SHAP substitutes a binary variable (zi’) that denotes whether xi is present or not as shown in Eq. (3)
| (3) |
In Eq. (3), g(z ’ ) is the local surrogate model of original model f(x). The amount that the existence of feature i contributes to the final result, and i aids in our understanding of the original model.
For explainable interpretation of the original representation of an instance being explained (x d) using LIME, a binary vector (x’ {0,1}d’) denoting the “presence” or “absence” of a continuous patch of super-pixel was used. For our model g G having domain {0,1}d’ to present the visual artifacts, g acted over absence/presence of the interpretable components. It was observed that every component of g G was not enough to interpret the explanation, as a result, (g) was used to measure of complexity of the explanation.
For our model f : d , f(x) being the probability of to belong in any of four classes, x(z) was used as a proximity measure between an instance z to x, to define locality around x. The fidelity function, (f,g, x) was used as measure of how unfaithful g was in approximating f in the locality defined by x. Making (g) as lowest as possible to increase the interpretations, fidelity function was also minimized. The explanation generated by LIME can be summarized as Eq. (4).
| (4) |
Grad-CAM calculates the gradient of a differentiable output, such as class score, in relation to the convolutional features of a selected layer. Grad-CAM is most commonly employed for image classification tasks, but may also be utilized for semantic segmentation. The softmax layer of the proposed model outputs a score for each class for each pixel to aid in semantic segmentation. For a particular class C with N number of pixels and AK as a feature map, Grad-CAM mapping is explained in Eq. (5) [39].
| (5) |
| (6) |
3.3. Implementation
The proposed DL model and XAI algorithms were implemented using Keras [49] in python [50]. Experiments were executed on Google Colab [51] with NVIDIA K80 graphical processing unit of 12 GB RAM provided by Google. The run time platform of Google Colab consists of Python (version 3.7) as a programming language, Keras (version 2.5.0) which works with TensorFlow (version 2.5.0) framework.
We split the CXR images dataset into the train and test sets with a ratio 90:10 per category. Ten different random train/test splits of the CXR dataset were used to report the final averaged performance. To prevent the model from over-fitting during training, we set 10% of the training data for validation and early stopping callbacks were used with the patience of 3 epochs.
4. Evaluation metrics
Conventional statistical measures such as precision (7), recall (8), f-score (9) and accuracy (10) were used to measure the classification performance of model.
| (7) |
| (8) |
| (9) |
| (10) |
where , , , and represent true positive, true negative, false positive, and false negative, respectively. Furthermore, the sensitivity and specificity of the model are measured along with Receiver operating curve-area under the curve (ROC-AUC) curve. The confusion matrix is used for class-wise performance evaluations.
5. Results and discussion
5.1. Model explanation with CNN
The traditional statistical result validation parameters like model loss and accuracy for training, validation and test set, precision, F1-score and recall are considered.
We set the epoch of 50 for model training along with early stopping criteria. Fig. 4 shows the model loss and accuracy of the 10th fold with good-fit curve. The proposed CNN achieved an average percentage of training accuracy (95.76 ± 1.15), and validation accuracy (94.54 ± 1.33) over the 10-fold of CXR dataset (refer to Table 3).
Fig. 4.
Training and validation tenth fold’s result of CNN. (a) shows 97.09% training accuracy and 96.78% validation accuracy. (b) shows 0.0858 of training loss and 0.122 of validation loss.
Table 3.
10-Fold Training and validation performance (after 50 epochs, in %): Training Accuracy (TA), Validation Accuracy (VA), Training Loss (TL), Validation Loss (VL), Test Accuracy (TsA) and Test Loss (TsL).
| K1 | K2 | K3 | K4 | K5 | K6 | K7 | K8 | K9 | K10 | Avg | |
|---|---|---|---|---|---|---|---|---|---|---|---|
| TA | 96.46 | 96.15 | 95.41 | 97.44 | 96.69 | 94.17 | 93.89 | 94.74 | 95.62 | 97.09 | 95.76 ± 1.15 |
| TL | 0.099 | 0.1089 | 0.1258 | 0.0712 | 0.0923 | 0.1630 | 0.1726 | 0.1931 | 0.1257 | 0.0858 | 0.12 ± 0.04 |
| VA | 95.66 | 94.54 | 95.24 | 94.54 | 95.10 | 91.74 | 93.00 | 93.98 | 94.82 | 96.78 | 94.54 ± 1.33 |
| VL | 0.1078 | 0.1499 | 0.1293 | 0.1682 | 0.1399 | 0.2114 | 0.1813 | 0.1606 | 0.1437 | 0.1222 | 0.15 ± 0.03 |
| TsA | 95.23 | 94.67 | 94.81 | 95.23 | 94.39 | 92.43 | 92.43 | 94.11 | 94.39 | 95.37 | 94.31 ± 1.01 |
| TsL | 0.9618 | 0.1621 | 0.1625 | 0.9153 | 0.1089 | 0.2153 | 0.2041 | 0.1778 | 0.1784 | 0.1490 | 0.32 ± 0.31 |
The model is further evaluated on test sets which were not shown to the model while training. The proposed CNN model achieved an average test accuracy of (94.31 ± 1.01%) and test loss of (0.32 ± 0.31%) within 10 fold of CXR datasets (refer to Table 3). Receiver Operating Curve-Area Under Curve (ROC-AUC) of the tenth fold is shown in Fig. 5. As AUC for COVID-19, pneumonia and TB is 1.00, the model is able to distinguish between all positive and negative class points flawlessly whereas for Normal class, AUC values is 0.99. This shows that the proposed model is more consistent and robust for all classes even if they have non-uniform sample distribution.
Fig. 5.
AUC-ROC result of CNN shows AUC score of 0.99 for normal and pneumonia where as 1.00 for COVID-19 and TB.
5.2. Model explanation with XAI
5.2.1. SHAP
Direct interpretation of the CNN model’s mathematical behavior is difficult, XAI algorithms are imposed on the model. For all individual categories, the SHAP result explains four outputs (COVID-19, Normal, pneumonia, and TB). On the left, input images are displayed, with virtually translucent gray backings behind each explanation. In Fig. 6, red pixels are seen in the first explanation image to increase probability of predicting as COVID-19. Normal and pneumonia explanations hold no red or blue pixels whereas the last image holds the blue pixels, decreasing the probability of the input image being TB. In Fig. 7, the absence of red pixels in COVID-19 and TB explanations; and a large number of blue pixels in pneumonia and red pixel concentration in Normal explanation explain the image as Normal. Likewise, Fig. 8 shows the pneumonia’s features and Fig. 9 shows the tubercular infection.
Fig. 6.
Based on the high SHAP value displayed in first explanation image (second column), we can say the CXR image is diagnosed with COVID-19.
Fig. 7.
Based on the high SHAP value displayed in second explanation image (third column), we can say that the CXR image is Normal.
Fig. 8.
Based on the high SHAP value displayed in third explanation images (fourth column) we can say that the CXR image is diagnosed with pneumonia.
Fig. 9.
Based on the high SHAP value displayed in fourth explanation image (fifth column), we can say that the CXR image is diagnosed with TB.
5.2.2. LIME
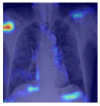
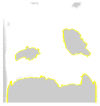
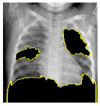
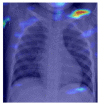
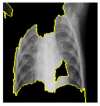
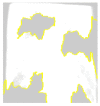
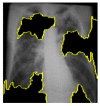
Random ones and zeros are created and put into a matrix with a split ratio of 0.2, 150 perturbations serving as rows, and superpixels acting as columns, with a kernel size of 3 × 3 and a maximum distance of 100 units. According to the averages and standard deviation in the training data, the matrix was perturbed for the top 20 numerical characteristics by sampling from a normal(0,1) and performing the inverse operations of mean-centering and scaling. When creating categorical features, perturb used training distribution-based sampling to create a binary feature that is 1 when the value matches the case being described. Original test images for individual categories in the second column of Table 4 are are resulted with a mask as defined in the third column of Table 4. The segmented image portion defined from the mask, shows LIME results as shown in the fourth column of Table 4.
Table 4.
Explainable AI Result Interpretation by LIME and Grad-CAM.
| Category | CXR Image | Mask | LIME(Segmented) | Grad-CAM |
|---|---|---|---|---|
| COVID-19 |  |
 |
 |
 |
| Normal | 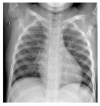 |
 |
 |
 |
| Pneumonia | 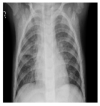 |
 |
 |
 |
| TB | 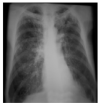 |
 |
 |
 |
5.2.3. Grad-CAM
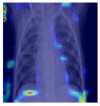
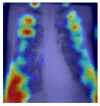
Grad-CAM was utilized to identify the sections of CXR images which were significant for classification decisions by utilizing the spatial information saved by convolutional layers. Individual CXR samples from all categories were considered from the set-aside data for visual explanation analysis and presented the heatmap to visually assess the quality of heatmaps created by the introduced visual explanation methods.
For COVID-19, heatmap results more infection in the left lobes however right lobe is also infected on the upper right part (first-row fifth column in Table 4). Result for Normal shows no any patches of color codes with the chest region(second-row fifth column in Table 4). Likewise, scattered interstitial opacities noted scattered in the bilateral peripheral lungs for pneumonia and result show that right lung is infected by TB.
5.3. Class-wise study of proposed CNN model
Class-wise study was performed to understand our proposed model’s performance for each disease class and measured each class’s precision, recall, f-score, specificity and sensitivity from 10 fold results (refer to Table 5). While looking at Table 5, we notice that the proposed DL model achieved precision within the range (89.51 ± 4.89–97.26 ± 1.23), recall (91.19 ± 4.65–96.56 ± 3.58), f-score (91.65 ± 1.89–96.56 ± 0.95), specificity (90.37 ± 4.84–96.15 ± 3.70) and sensitivity (95.50 ± 1.72–99.53 ± 0.36). The proposed model achieved the highest f-score (96.53 ± 0.95) for class Pneumonia which shows that the model is highly effective in detecting and identifying the Pneumonia diseases from CXR images. Furthermore, the confusion matrix, showing the correct and incorrect classification produced by our model for 10th fold is shown in Fig. 10.
Table 5.
10-Fold Performance (after 50 epochs, in %): Specificity (Spec), Sensitivity (Sen), Precision (Pre), F1 score (Fsc), and Recall (Rec).
| K1 | K2 | K3 | K4 | K5 | K6 | K7 | K8 | K9 | K10 | Avg | ||
|---|---|---|---|---|---|---|---|---|---|---|---|---|
| Spec | COVID-19 | 95.00 | 97.10 | 94.20 | 98.55 | 100.0 | 86.95 | 98.55 | 94.20 | 97.10 | 100.0 | 96.15 ± 3.70 |
| Normal | 92.72 | 94.83 | 92.25 | 96.77 | 87.74 | 93.54 | 83.22 | 94.83 | 91.61 | 94.19 | 92.17 ± 3.76 | |
| Pneumonia | 96.47 | 95.03 | 96.92 | 94.32 | 96.92 | 93.14 | 97.16 | 93.85 | 96.45 | 97.63 | 95.71 ± 1.55 | |
| TB | 98.41 | 88.05 | 92.53 | 86.56 | 95.52 | 83.58 | 83.00 | 92.53 | 89.55 | 94.02 | 90.37 ± 4.84 | |
| Sen | COVID-19 | 99.38 | 98.75 | 99.53 | 98.29 | 99.22 | 98.29 | 97.05 | 99.06 | 98.91 | 98.91 | 98.74 ± 0.68 |
| Normal | 97.99 | 96.42 | 98.03 | 96.42 | 98.21 | 94.63 | 98.56 | 96.24 | 97.85 | 98.56 | 97.29 ± 1.23 | |
| Pneumonia | 95.83 | 96.96 | 94.84 | 97.93 | 93.47 | 93.81 | 92.78 | 96.90 | 94.84 | 97.59 | 95.50 ± 1.72 | |
| TB | 99.38 | 99.84 | 99.22 | 99.69 | 99.84 | 100.00 | 99.00 | 98.91 | 99.53 | 99.84 | 99.53 ± 0.36 | |
| Pre | COVID-19 | 93.23 | 89.03 | 96.01 | 86.20 | 93.00 | 85.21 | 78.14 | 92.19 | 91.04 | 91.11 | 89.51 ± 4.89 |
| Normal | 93.32 | 88.30 | 93.10 | 88.20 | 93.22 | 83.09 | 94.45 | 88.50 | 92.31 | 95.13 | 90.96 ± 3.59 | |
| Pneumonia | 97.00 | 98.13 | 96.18 | 99.24 | 96.22 | 96.35 | 95.33 | 98.27 | 96.72 | 98.81 | 97.26 ± 1.23 | |
| TB | 94.67 | 98.43 | 93.34 | 97.12 | 98.73 | 100.00 | 97.67 | 90.48 | 95.19 | 98.91 | 96.45 ± 2.82 | |
| Fsc | COVID-19 | 94.03 | 93.01 | 95.42 | 92.56 | 97.53 | 86.52 | 87.29 | 93.78 | 94.34 | 95.21 | 92.97 ± 3.30 |
| Normal | 93.70 | 91.77 | 93.07 | 92.98 | 90.61 | 88.32 | 88.50 | 91.29 | 92.23 | 94.00 | 91.65 ± 1.89 | |
| Pneumonia | 97.25 | 96.91 | 97.14 | 96.96 | 96.07 | 94.25 | 96.26 | 96.42 | 96.05 | 98.01 | 96.53 ± 0.95 | |
| TB | 96.01 | 93.93 | 93.52 | 91.59 | 97.34 | 91.34 | 90.04 | 91.57 | 92.98 | 96.88 | 93.52 ± 2.38 | |
| Rec | COVID-19 | 95.59 | 97.21 | 94.92 | 99.68 | 100.00 | 87.68 | 99.09 | 94.20 | 97.22 | 100.00 | 96.56 ± 3.58 |
| Normal | 93.48 | 95.82 | 92.70 | 97.11 | 88.09 | 94.47 | 83.78 | 95.94 | 92.52 | 94.84 | 92.87 ± 3.85 | |
| Pneumonia | 96.26 | 95.00 | 97.70 | 94.88 | 97.14 | 93.09 | 97.76 | 94.75 | 96.74 | 98.59 | 96.19 ± 1.62 | |
| TB | 98.85 | 88.86 | 93.14 | 87.88 | 96.18 | 84.19 | 84.21 | 93.10 | 90.94 | 94.59 | 91.19 ± 4.65 | |
Fig. 10.
Confusion matrix for test split of 10th fold.
5.4. Statistical test
For the statistical test, we employed the Adjusted R2 test on the confusion matrix of every fold using Eq. (11) and the results are shown in Table 6. The adjusted R-squared increases when the new term improves the model more than would be expected by chance. It falls off when a predictor makes a less than anticipated difference in the model. This suggests that even with a variable of 94.54%, the model can generally categorize the four separate groups.
| (11) |
where, = number of records in the dataset, p = number of independent variables and R2 is computed by dividing the entire sum of the squared errors from the actual results by the total sum of the squared residuals from the prediction of the model, and then subtracting the result from 1.The model’s adjusted R-squared comes out to be 0.992, indicating that the model is stable.
Table 6.
Adjusted R2 test on the results of 10-fold CXR dataset. Note: k1, k2, k3... k10 etc. represent the ten folds of CXR dataset respectively.
| K1 | K2 | K3 | K4 | K5 | K6 | K7 | K8 | K9 | K10 | Avg | |
|---|---|---|---|---|---|---|---|---|---|---|---|
| Adjusted R2 | 0.997 | 0.992 | 0.995 | 0.991 | 0.992 | 0.984 | 0.988 | 0.990 | 0.994 | 0.997 | 0.992 ± 0.003 |
5.5. Comparison with the state-of-the-art methods
We compared the classification performance of our CNN model with other state-of-the-art methods as shown in Table 7. To make the performance more coherent and relevant, we selected the existing models based on CXR image classification for detecting Tuberculosis and/or pneumonia and/or COVID-19 using deep learning methods. Altogether, we choose seven existing DL methods as a comparison cohort. This comparison cohort also includes both kinds of DL methods: Custom-CNN implemented and trained from scratch and DL model implemented with transfer learning. Among these seven existing methods, five models ([15], [20], [32], [33], [36] are based on transfer learning and two models ([30], [52] are based on custom-designed CNN. For instance, Liu et al. [20] method is based on transfer learning with AlexNet and GoogLeNet for CXR classification into TB and Normal. Likewise, Rahimzadesh et al. [33] is based on ResNet50 and Xception to classify CXR images into Normal, COVID-19, and pneumonia. Whereas, Qaqos et al. [30] and Khan et al. [52] trained custom CNN for CXR image classification.
Table 7.
Comparison of our model with the state-of-the-art methods. Note that “PneumoniaV” and “PneumoniaB” denote the disease “Viral Pneumonia” and “Bacterial Pneumonia” respectively.
| Ref | Cases | Classes | Method | Accuracy (%) | XAI | Params. (in Millions) |
|---|---|---|---|---|---|---|
| [20] | TB = 4248 Normal = 453 |
2 | Transfer learning with AlexNet and GoogLeNet | 85.68 | No | AlexNet = 61 GoogleNet = 7 |
| [33] | Normal = 8851 Covid19 = 180 Pneumonia = 6054 |
3 | Ensemble of Xception and ResNet50 | 91.40 | No | Xception Net = 22 ResNet = 11 |
| [52] | Normal = 310 PneumoniaB = 330 PneumoniaV = 327 COVID-19 = 284 |
4 | CNN-based CoroNet | 89.60 | No | CNN = 33.97 |
| [30] | Normal = 1583 COVID-19 = 576 Pneumonia = 4273 TB = 155 |
4 | Custom CNN | 94.53 | No | CNN = 34.73 |
| [15] | Normal = 310 PneumoniaB = 330 PneumoniaV = 327 COVID-19 = 284 |
4 | Attention based VGG | 85.43 | No | VGG-16 = 18 VGG-19 = 21.2 |
| [32] | Normal = 1341 COVID-19 = 864 Pneumonia = 1345 |
3 | Inception V3 with Transfer learning | 93.00 | Yes | Binary Class = 23.8 Multiclass = 23.8 |
| [36] | Normal = 439 COVID-19 = 435 PneumoniaB = 439 PneumoniaV = 439 TB = 434 |
5 | Transfer learning with Resnet18 | 91.60 | No | Resnet18 = 11 |
| Ours | Normal = 1583 Covid19 = 576 Pneumonia = 4273 TB = 700 |
4 | Custom CNN | 95.94 | Yes | CNN = 3.7 |
Referring to Table 7, the least performing method proposed by [15] has an accuracy of 85.43% which is 8.88% lower than the classification accuracy of proposed model (94.31%). Similarly, the best performing method among the existing methods has a classification accuracy of 94.53% by Qaqos et al. [30] which is not significantly higher (0.22%) compared to the accuracy of the proposed model. Even though, the proposed model has competitive performance with the model by Qaqos [30], it is complemented with the XAI framework, which will help the model’s output more trust-able and understandable to the end-user, which is not available with Qaqos et al. [30] model. Furthermore, the Qaqos et al. [30] model has 34.73 millions of learnable parameters whereas the proposed model has only 3.7 million parameter which shows that our model is significantly lighter than its counterparts. Among the compared methods, only the model by Shastri et al. [32] has attempted to include the XAI for CXR image classification, which has achieved only 93% accuracy, which is 1.31% less than the accuracy of our model.
The transfer learning based methods such as Sitaula et al. [15] and Rahimzadeh et al. [33] are more profound and heavy-weight (learnable parameters in the range of millions) compared to other methods. However, it is interesting to notice that our CNN, having the fewer parameters, has achieved significantly better performance than those deeper models (VGG, and Resnet50).
6. Medical sensation
To validate and verify the model medically, information was gathered from the medical experts for all four categories and tabulated in Table 8. Impression generated by the XAI-DL model and details from the medical experts shows that the proposed framework can effectively be utilized to identify patients’ pulmonary status. As a result, our model can assist medical teams in making more informed judgments.
Table 8.
Medical sensation: Findings and impressions.
| CXR image | Medical findings | Sensational impressions |
|---|---|---|
| Fig. 2(a) | Bilateral air space opacities observed in periphery; Osseous structures are normal. Normal costophrenic angles | Projected to COVID-19 |
| Fig. 2(b) | Normal bilateral lung fields; Mediastinum and hilar shadow appears normal; Normal costophrenic angles; Normal osseous structures | Normal CXR findings |
| Fig. 2(c) | Scattered interstitial opacities noted scattered in the bilateral peripheral lungs; Mediastinum and hilar shadow appears normal; Normal costophrenic angles; Normal osseous structures. | Features are suggestive of interstitial pneumonitis in the bilateral lungs |
| Fig. 2(d) | Multiple thin to intermediate walled cavitary lesions along with adjacent air space opacities noted in the right upper and middle zone left lower and peripheral zone; Mediastinum and hilar shadow appears normal; Normal costophrenic angles; Normal osseous structures. | Features are suggestive of active tubercular infection in the right lung. |
7. Conclusion and future work
In this paper, we proposed a novel lightweight single CNN model for CXR image classification into COVID-19, pneumonia, and Tuberculosis, complemented with an explanation generation (XAI) framework. Using such XAI-based single CNN model for detecting COVID-19, Pneumonia, and Tuberculosis diseases resulted in 95.76 ± 1.15% training accuracy, 94.31 ± 1.01% test accuracy and 94.54 ± 1.33% validation accuracy. The explanation generated with widely used XAI algorithms: SHAP, LIME and GradCam were further validated by medical experts. With such high classification accuracy of the model and validated by medical experts, the proposed model indicates that XAI and CNN models can provide convincing and coherent results for lung disease identification and categorization. Compared with the state-of-the-art methods, our proposed model has lightweight architecture and has a better accuracy while classifying the CXR images along with XAI. Given such unique features of our model, it has great potential to be adopted by clinicians/medical professionals as an aided tool for making a more informed decision in the future.
The model was only trained on a small number of datasets. Hence its performance on more extensive datasets is not tested. Other sophisticated offline data augmentation approaches, such as the Generative Adversarial Network, might help improve the model’s performance. A mix of characteristics derived from multiple deep learning models can be investigated for better classification performance complemented with XAI frameworks. On the other side, the model ignores patients’ medical history, experiential gaps, and other bodily symptoms in population data, some human oversight is still necessary.
CRediT authorship contribution statement
Mohan Bhandari: Conceptualisation, Writing – original draft, Resource collection, Methodology, Coding, Result analysis, Validation, Revision. Tej Bahadur Shahi: Methodology, Coding, Result analysis, Validation, Writing, Revision, Final draft. Birat Siku: Writing – original draft. Arjun Neupane: Project administration, Final draft.
Declaration of Competing Interest
The authors declare that they have no known competing financial interests or personal relationships that could have appeared to influence the work reported in this paper.
Acknowledgments
We express our thankful words to Dr. Dosti Regmi (MBBS/MD; Consultant Radiologist, Kanti Children’s Hospital, Nepal) and Dr. Devendra Bhandari (MBBS; House Officer, ICU Manmohan Memorial Medical College and Teaching Hospital, Nepal) for their valuable feedback as a medical expert in medical imaging to validate and verify our XAI results. Both are registered doctors in Nepal Medical Council. Dr. Dosti Regmi(License Number — 13060) has 10 years whereas Dr. Devendra Bhandari (License Number — 26504) has 3 years of experience in the related field.
References
- 1.Disease G. Independently Published; 2021. Pocket Guide to Copd Diagnosis, Management and Prevention: A Guide for Healthcare Professsionals. [Google Scholar]
- 2.Visca D., Ong C., Tiberi S., Centis R., D’Ambrosio L., Chen B., Mueller J., Mueller P., Duarte R., Dalcolmo M., Sotgiu G., Migliori G.B., Goletti D. Tuberculosis and COVID-19 interaction: A review of biological, clinical and public health effects. Pulmonology. 2021;27 doi: 10.1016/j.pulmoe.2020.12.012. [DOI] [PMC free article] [PubMed] [Google Scholar]
- 3.Islam S.R., Maity S.P., Ray A.K., Mandal M. Deep learning on compressed sensing measurements in pneumonia detection. Int. J. Imaging Syst. Technol. 2022 [Google Scholar]
- 4.van’t Hoog A.H., Meme H.K., Laserson K.F., Agaya J.A., Muchiri B.G., Githui W.A., Odeny L.O., Marston B.J., Borgdorff M.W. Screening strategies for tuberculosis prevalence surveys: the value of chest radiography and symptoms. PLoS One. 2012;7(7) doi: 10.1371/journal.pone.0038691. [DOI] [PMC free article] [PubMed] [Google Scholar]
- 5.Kallander K., Burgess D.H., Qazi S.A. Early identification and treatment of pneumonia: a call to action. Lancet. Glob. Health. 2016;4(1) doi: 10.1016/S2214-109X(15)00272-7. [DOI] [PMC free article] [PubMed] [Google Scholar]
- 6.Asif H.M., Hashmi H.A.S. Early detection of COVID-19. Front. Med. 2020 doi: 10.3389/fmed.2020.00311. [DOI] [PMC free article] [PubMed] [Google Scholar]
- 7.Voulodimos A., Doulamis N., Doulamis A., Protopapadakis E. Deep learning for computer vision: A brief review. Comput. Intell. Neurosci. 2018;2018 doi: 10.1155/2018/7068349. [DOI] [PMC free article] [PubMed] [Google Scholar]
- 8.Shahi T.B., Sitaula C., Neupane A., Guo W. Fruit classification using attention-based MobileNetV2 for industrial applications. Plos One. 2022;17(2) doi: 10.1371/journal.pone.0264586. [DOI] [PMC free article] [PubMed] [Google Scholar]
- 9.Mishra B., Shahi T.B. Deep learning-based framework for spatiotemporal data fusion: an instance of Landsat 8 and Sentinel 2 NDVI. J. Appl. Remote Sens. 2021;15(3) [Google Scholar]
- 10.Bhandari M., Parajuli P., Chapagain P., Gaur L. In: Recent Trends in Image Processing and Pattern Recognition. Santosh K., Hegadi R., Pal U., editors. Springer International Publishing; Cham: 2022. Evaluating performance of adam optimization by proposing energy index; pp. 156–168. [Google Scholar]
- 11.Gaur L., Bhandari M., Razdan T. Taylor and Francis; 2022. Development of Image Translating Model to Counter Adversarial Attacks. [Google Scholar]
- 12.Sitaula C., Basnet A., Mainali A., Shahi T. Deep learning-based methods for sentiment analysis on nepali COVID-19-related tweets. Comput. Intell. Neurosci. 2021;2021 doi: 10.1155/2021/2158184. [DOI] [PMC free article] [PubMed] [Google Scholar]
- 13.Mohsen H., El-Dahshan E.-S.A., El-Horbaty E.-S.M., Salem A.-B.M. Classification using deep learning neural networks for brain tumors. Future Comput. Inform. J. 2018;3(1):68–71. [Google Scholar]
- 14.Gaur L., Bhandari M., Shikhar B.S., Nz J., Shorfuzzaman M., Masud M. Explanation-driven HCI model to examine the mini-mental state for alzheimer’s disease. ACM Trans. Multimedia Comput. Commun. Appl. 2022 doi: 10.1145/3527174. [DOI] [Google Scholar]
- 15.Sitaula C., Hossain M.B. Attention-based VGG-16 model for COVID-19 chest X-ray image classification. Appl. Intell. 2021;51(5):2850–2863. doi: 10.1007/s10489-020-02055-x. [DOI] [PMC free article] [PubMed] [Google Scholar]
- 16.Homayounieh F., Digumarthy S., Ebrahimian S., Rueckel J., Hoppe B.F., Sabel B.O., Conjeti S., Ridder K., Sistermanns M., Wang L., Preuhs A., Ghesu F., Mansoor A., Moghbel M., Botwin A., Singh R., Cartmell S., Patti J., Huemmer C., Fieselmann A., Joerger C., Mirshahzadeh N., Muse V., Kalra M. An artificial intelligence–based chest X-ray model on human nodule detection accuracy from a multicenter study. JAMA Netw. Open. 2021;4(12) doi: 10.1001/jamanetworkopen.2021.41096. e2141096. [DOI] [PMC free article] [PubMed] [Google Scholar]
- 17.Hinton G.E., Salakhutdinov R.R. Reducing the dimensionality of data with neural networks. Science. 2006;313(5786):504–507. doi: 10.1126/science.1127647. [DOI] [PubMed] [Google Scholar]
- 18.Gu J., Wang Z., Kuen J., Ma L., Shahroudy A., Shuai B., Liu T., Wang X., Wang G., Cai J., et al. Recent advances in convolutional neural networks. Pattern Recognit. 2018;77:354–377. [Google Scholar]
- 19.Mahbub M.K., Biswas M., Gaur L., Alenezi F., Santosh K. Deep features to detect pulmonary abnormalities in chest X-rays due to infectious diseasex: Covid-19, pneumonia, and tuberculosis. Inform. Sci. 2022;592:389–401. doi: 10.1016/j.ins.2022.01.062. [DOI] [PMC free article] [PubMed] [Google Scholar]
- 20.Liu C., Cao Y., Alcantara M., Liu B., Brunette M., Peinado J., Curioso W. TX-CNN: Detecting tuberculosis in chest X-ray images using convolutional neural network. 2017 IEEE International Conference on Image Processing; ICIP; 2017. pp. 2314–2318. [DOI] [Google Scholar]
- 21.Ahsan M.M., Gupta K.D., Islam M.M., Sen S., Rahman M., Shakhawat Hossain M., et al. Covid-19 symptoms detection based on nasnetmobile with explainable ai using various imaging modalities. Mach. Learn. Knowl. Extr. 2020;2(4):490–504. [Google Scholar]
- 22.Abbas A., Abdelsamea M.M., Gaber M.M. Classification of COVID-19 in chest X-ray images using DeTraC deep convolutional neural network. Appl. Intell. 2021;51(2):854–864. doi: 10.1007/s10489-020-01829-7. [DOI] [PMC free article] [PubMed] [Google Scholar]
- 23.Pasa F., Golkov V., Pfeiffer F., Cremers D., Pfeiffer D. Efficient deep network architectures for fast chest X-ray tuberculosis screening and visualization. Sci. Rep. 2019;9(1):1–9. doi: 10.1038/s41598-019-42557-4. [DOI] [PMC free article] [PubMed] [Google Scholar]
- 24.Rahman T., Chowdhury M.E., Khandakar A., Islam K.R., Islam K.F., Mahbub Z.B., Kadir M.A., Kashem S. Transfer learning with deep convolutional neural network (CNN) for pneumonia detection using chest X-ray. Appl. Sci. 2020;10(9):3233. [Google Scholar]
- 25.Mediouni M., Schlatterer D.R., Madry H., Cucchiarini M., Rai B. A review of translational medicine. The future paradigm: how can we connect the orthopedic dots better? Curr. Med. Res. Opin. 2018;34(7):1217–1229. doi: 10.1080/03007995.2017.1385450. PMID: 28952378. [DOI] [PubMed] [Google Scholar]
- 26.Mediouni M., Madiouni R., Gardner M., Vaughan N. Translational medicine: challenges and new orthopaedic vision (mediouni-model) Curr. Orthop. Pract. 2020;31(2):196–200. [Google Scholar]
- 27.Antoniadi A.M., Du Y., Guendouz Y., Wei L., Mazo C., Becker B.A., Mooney C. Current challenges and future opportunities for XAI in machine learning-based clinical decision support systems: A systematic review. Appl. Sci. 2021;11(11) URL https://www.mdpi.com/2076-3417/11/11/5088. [Google Scholar]
- 28.Sitaula C., Shahi T., Aryal S., Marzbanrad F. Fusion of multi-scale bag of deep visual words features of chest X-ray images to detect COVID-19 infection. Sci. Rep. 2021;11 doi: 10.1038/s41598-021-03287-8. [DOI] [PMC free article] [PubMed] [Google Scholar]
- 29.Satu M.S., Howlader K.C., Mahmud M., Kaiser M.S., Shariful Islam S.M., Quinn J.M.W., Alyami S.A., Moni M.A. Short-term prediction of COVID-19 cases using machine learning models. Appl. Sci. 2021;11(9) URL https://www.mdpi.com/2076-3417/11/9/4266. [Google Scholar]
- 30.Qaqos N.N., Kareem O.S. Covid-19 diagnosis from chest x-ray images using deep learning approach. 2020 International Conference on Advanced Science and Engineering; ICOASE; IEEE; 2020. pp. 110–116. [Google Scholar]
- 31.Ahsan M., Gomes R., Denton A. Application of a convolutional neural network using transfer learning for tuberculosis detection. 2019 IEEE International Conference on Electro Information Technology; EIT; 2019. pp. 427–433. [DOI] [Google Scholar]
- 32.Shastri S., Kansal I., Kumar S., Singh K., Popli R., Mansotra V. Cheximagenet: a novel architecture for accurate classification of Covid-19 with chest x-ray digital images using deep convolutional neural networks. Health Technol. 2022:1–12. doi: 10.1007/s12553-021-00630-x. [DOI] [PMC free article] [PubMed] [Google Scholar]
- 33.Rahimzadeh M., Attar A. A modified deep convolutional neural network for detecting COVID-19 and pneumonia from chest X-ray images based on the concatenation of xception and ResNet50V2. Inf. Med. Unlocked. 2020;19 doi: 10.1016/j.imu.2020.100360. [DOI] [PMC free article] [PubMed] [Google Scholar]
- 34.Colombo Filho M.E., Mello Galliez R., Andrade Bernardi F., Oliveira L.L.d., Kritski A., Koenigkam Santos M., Alves D. International Conference on Computational Science. Springer; 2020. Preliminary results on pulmonary tuberculosis detection in chest x-ray using convolutional neural networks; pp. 563–576. [Google Scholar]
- 35.Shelke A., Inamdar M., Shah V., Tiwari A., Hussain A., Chafekar T., Mehendale N. Chest X-ray classification using deep learning for automated COVID-19 screening. SN Comput. Sci. 2021;2(4):1–9. doi: 10.1007/s42979-021-00695-5. [DOI] [PMC free article] [PubMed] [Google Scholar]
- 36.Al-Timemy A.H., Khushaba R.N., Mosa Z.M., Escudero J. Artificial Intelligence for COVID-19. Springer; 2021. An efficient mixture of deep and machine learning models for covid-19 and tuberculosis detection using x-ray images in resource limited settings; pp. 77–100. [Google Scholar]
- 37.Kim S., Rim B., Choi S., Lee A., Min S., Hong M. Deep learning in multi-class lung diseases; classification on chest X-ray images. Diagnostics. 2022;12(4) doi: 10.3390/diagnostics12040915. URL https://www.mdpi.com/2075-4418/12/4/915. [DOI] [PMC free article] [PubMed] [Google Scholar]
- 38.Ragab M., Alshehri S., Alhakamy N., Mansour R., Koundal D. Multiclass classification of chest X-Ray images for the prediction of COVID-19 using capsule network. Comput. Intell. Neurosci. 2022;2022:1–8. doi: 10.1155/2022/6185013. [DOI] [PMC free article] [PubMed] [Google Scholar] [Retracted]
- 39.R.R. Selvaraju, M. Cogswell, A. Das, R. Vedantam, D. Parikh, D. Batra, Grad-cam: Visual explanations from deep networks via gradient-based localization, in: Proceedings of the IEEE International Conference on Computer Vision, 2017, pp. 618–626.
- 40.Ahsan M.M., Nazim R., Siddique Z., Huebner P. Detection of COVID-19 patients from CT scan and chest X-ray data using modified MobileNetV2 and LIME. Healthcare. 2021;9(9) doi: 10.3390/healthcare9091099. URL https://www.mdpi.com/2227-9032/9/9/1099. [DOI] [PMC free article] [PubMed] [Google Scholar]
- 41.Chetoui M., Akhloufi M.A., Yousefi B., Bouattane E.M. Explainable COVID-19 detection on chest X-rays using an end-to-end deep convolutional neural network architecture. Big Data Cogn. Comput. 2021;5(4):73. [Google Scholar]
- 42.J. Deng, A large-scale hierarchical image database, in: Proc. of IEEE Computer Vision and Pattern Recognition, 2009, 2009.
- 43.Li L., Qin L., Xu Z., Yin Y., Wang X., Kong B., Bai J., Lu Y., Fang Z., Song Q., et al. Artificial intelligence distinguishes COVID-19 from community acquired pneumonia on chest CT. Radiology. 2020 doi: 10.1148/radiol.2020200905. [DOI] [PMC free article] [PubMed] [Google Scholar]
- 44.Kermany D., Zhang K., Goldbaum M. Large dataset of labeled optical coherence tomography (OCT) and chest X-Ray images. Cell. 2018 [Google Scholar]
- 45.Rahman T., Khandakar A., Kadir M.A., Islam K.R., Islam K.F., Mazhar R., Hamid T., Islam M.T., Kashem S., Mahbub Z.B., Ayari M.A., Chowdhury M.E.H. Reliable tuberculosis detection using chest X-Ray with deep learning, segmentation and visualization. IEEE Access. 2020;8:191586–191601. [Google Scholar]
- 46.Patel P. Chest X-ray (Covid-19 and pneumonia) Kaggle. 2020 URL https://www.kaggle.com/datasets/prashant268/chest-xray-covid19-pneumonia. [Google Scholar]
- 47.van der Velden B.H., Kuijf H.J., Gilhuijs K.G., Viergever M.A. Explainable artificial intelligence (XAI) in deep learning-based medical image analysis. Med. Image Anal. 2022;79 doi: 10.1016/j.media.2022.102470. [DOI] [PubMed] [Google Scholar]
- 48.Lundberg S.M., Lee S.-I. In: Advances in Neural Information Processing Systems 30. Guyon I., Luxburg U.V., Bengio S., Wallach H., Fergus R., Vishwanathan S., Garnett R., editors. Curran Associates, Inc.; 2017. A unified approach to interpreting model predictions; pp. 4765–4774. URL http://papers.nips.cc/paper/7062-a-unified-approach-to-interpreting-model-predictions.pdf. [Google Scholar]
- 49.Chollet F., et al. 2015. Keras. URL https://github.com/fchollet/keras. [Google Scholar]
- 50.Van Rossum G., Drake F.L. CreateSpace; Scotts Valley, CA: 2009. Python 3 Reference Manual. [Google Scholar]
- 51.Carneiro T., Medeiros Da NóBrega R.V., Nepomuceno T., Bian G.-B., De Albuquerque V.H.C., Filho P.P.R. Performance analysis of google colaboratory as a tool for accelerating deep learning applications. IEEE Access. 2018;6:61677–61685. [Google Scholar]
- 52.Khan A.I., Shah J.L., Bhat M.M. Coronet: A deep neural network for detection and diagnosis of COVID-19 from chest x-ray images. Comput. Methods Programs Biomed. 2020;196 doi: 10.1016/j.cmpb.2020.105581. [DOI] [PMC free article] [PubMed] [Google Scholar]


