eLife logoLink to eLife
. 2022 Oct 10;11:e77608. doi: 10.7554/eLife.77608

Unrestrained growth of correctly oriented microtubules instructs axonal microtubule orientation

Maximilian AH Jakobs 1,2,, Assaf Zemel 3, Kristian Franze 1,4,5,
Editors: Kang Shen6, Anna Akhmanova7
PMCID: PMC9550224  PMID: 36214669

Abstract

In many eukaryotic cells, directed molecular transport occurs along microtubules. Within neuronal axons, transport over vast distances particularly relies on uniformly oriented microtubules, whose plus-ends point towards the distal axon tip (anterogradely polymerizing, or plus-end-out). However, axonal microtubules initially have mixed orientations, and how they orient during development is not yet fully understood. Using live imaging of primary Drosophila melanogaster neurons, we found that, in the distal part of the axon, catastrophe rates of plus-end-out microtubules were significantly reduced compared to those of minus-end-out microtubules. Physical modelling revealed that plus-end-out microtubules should therefore exhibit persistent long-term growth, while growth of minus-end-out microtubules should be limited, leading to a bias in overall axonal microtubule orientation. Using chemical and physical perturbations of microtubule growth and genetic perturbations of the anti -catastrophe factor p150, which was enriched in the distal axon tip, we confirmed that the enhanced growth of plus-end-out microtubules is critical for achieving uniform microtubule orientation. Computer simulations of axon development integrating the enhanced plus-end-out microtubule growth identified here with previously suggested mechanisms, that is, dynein-based microtubule sliding and augmin-mediated templating, correctly predicted the long-term evolution of axonal microtubule orientation as found in our experiments. Our study thus leads to a holistic explanation of how axonal microtubules orient uniformly, a prerequisite for efficient long-range transport essential for neuronal functioning.

Research organism: D. melanogaster

eLife digest

For humans to be able to wiggle their toes, messages need to travel from the brain to the foot, a distance well over a meter in many adults. This is made possible by neurons, the cells that form the nervous system, which transmit electrical signals along long extensions called ‘axons’. Axons can only transmit signals if all the required molecules, which are produced in a part of the neuron known as the cell body, are ferried to the ends of the axons. This ferrying around of molecules is carried out by long, filamentous molecules called microtubules, which act as a directed carrier system, shuttling molecules along the axon, either towards or away from the cell body.

Microtubules can be thought of as asymmetrical rods. One end – known as the plus end – is dynamic and can undergo growth or shrinkage, while the other end – called the minus end – is stable. For transport along the axon to happen efficiently, microtubules in the neuron need to be oriented with their plus end pointing towards the ends of the axon. Microtubules in growing neurons develop this orientation, but how that is achieved is not fully understood.

To understand the basis of this cellular phenomenon, Jakobs, Zemel and Franze examined the behaviour of microtubules in developing neurons from fruit fly larvae. A fluorescent protein, which emits light when the microtubules are growing, helped the researchers visualise the plus end of microtubules, the microtubule orientation, and their growth in developing axons. This experiment showed that microtubules that had their plus end pointing towards the axon end shrank more slowly than those with the opposite orientation, leading them to grow longer. This resulted in a higher proportion of the correctly-oriented microtubules in the axon.

Treating the neurons with Nocodazole, a chemical that disrupts microtubule growth, or with sodium chloride, which changes the osmotic pressure, caused the microtubules that were oriented with their plus end towards the axon to grow less, and disrupted the uniform orientation of the microtubules in the axon.

The next step was to determine whether specific axonal proteins such as p150 – a protein that is enriched at the tip of the axon and decreases microtubule shrinkage rates – are involved in this process. Reducing the levels of p150 in fruit flies using molecular and genetic methods resulted in microtubules with their plus end pointing towards the axon tip shrinking faster, reducing the proportion of microtubules with this orientation in the axon. This role of proteins enriched in the axonal tip, along with previously discovered mechanisms, explains how microtubules align unidirectionally in axons.

These findings open new avenues of research into neurodegenerative diseases like Alzheimer’s and Parkinson’s, which might manifest due to a breakdown of transport along microtubules in neurons.

Introduction

Symmetry breaking is critical for many biological systems. An organism starts off as a single round cell that divides and differentiates into many cells, tissues, and organ systems. The neuron, with its branched dendrites and sometimes exceedingly long axon, is one of the least symmetric cells found in animals. Axons connect neurons with distant targets and thus enable long-distance signal transmission throughout the body at high speed.

The enormous length of axons, which can extend over several meters in some vertebrate species, poses substantial logistical challenges. RNA, proteins, and organelles originating in the cell body need to be actively transported down the axon. Transport occurs along microtubules (MTs), which are long, polarized polymers that undergo stochastic cycles of growth and shrinkage (Figure 1A). Motor proteins transport cargo either towards a MT’s dynamic (i.e., growing and shrinking) plus-end or the more stable minus-end (Jiang et al., 2018; Jiang et al., 2014).

Figure 1. Axonal microtubule (MT) orientation increases over time and MT growth is enhanced at axon tips.

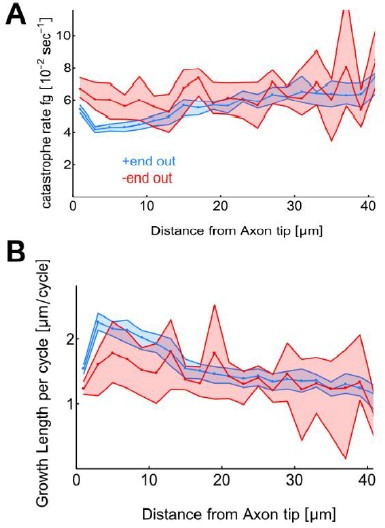
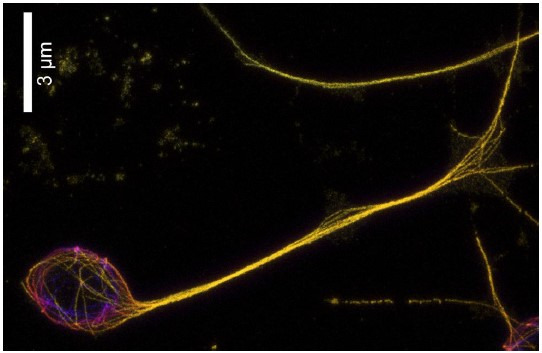
(A) Schematic depicting the MT growth and shrinkage cycle. MTs grow until they undergo a catastrophe, which initiates MT shrinkage, and they start growing again after a rescue event. During growth (but not during shrinkage), EB1 localizes to MT tips. (B) First frame of a live cell imaging movie of axonal EB1-GFP dynamics. Bright dots represent individual EB1-GFP puncta, which label growing MT plus-ends. (C) Maximum intensity projection of a 200-s-long movie depicting EB1-GFP dynamics in a Drosophila melanogaster axon. EB1-GFP density is increased towards the tip. (D) Schematic showing how EB1-GFP live imaging movies were visualized and analysed using kymographs. The growing tips of plus-end-out MTs (blue) and minus-end-out MTs (red) were fluorescently labelled with EB1-GFP (green tear drop shaped ‘comets’). The same axon is shown at three different time points; MTs grow at their plus-end, where EB1-GFP is located. The axonal intensity profiles of all time points are plotted underneath each other, resulting in a space-time grid called ‘kymograph’. Connecting puncta between consecutive kymograph lines with blue/red lines yields the overall displacement dg for individual MT growth events. Note that the red minus-end-out MT stops growing in the second frame and shrinks in the third frame (E) Kymograph of an axon 24 hr post plating showing EB1-GFP dynamics analysed with KymoButler (Jakobs et al., 2019). Lines with a positive slope (blue, left to right upwards) are MTs growing with their plus-end towards the axon tip, lines with a negative slope (red, left to right downwards) are MTs growing away from the tip. Horizontal bars indicate the growth lengths (dg) for individual MT growth cycles. (F) Kymographs of axonal processes expressing EB1-GFP analysed with KymoButler 4 hr post plating (G) MT orientation as a function of axon length. Longer axons exhibit a more pronounced plus-end-out MT orientation (p<10–5, Kruskal-Wallis test, **p<0.01, ***p<0.001 for pairwise comparisons, Dunn-Sidak post hoc test). (H) MT orientation at 4 and 24 hiv (hours in vitro). MT orientation increased with time (p<10–4, Wilcoxon rank sum test). (I) EB1-GFP comet density as a function of the distance from the axon tip. Most MT polymerization occurred near the advancing axon tip. (N Axons = 353, 20 biological replicates from 20 different experiment days, p<10–20, Kruskal-Wallis test, p<10–7 for pairwise comparisons between bins 1–2, 3, and 4, Dunn-Sidak post hoc test). Shown are median±95% confidence interval. (J) Added length per MT growth cycle dg as a function of distance from the axon tip. MTs grew longer in the vicinity of the axon tip (p<10–20, Kruskal-Wallis test, p<10–7 for pairwise comparisons of either bin 1 or 2 with any other bin, Dunn-Sidak post hoc test). (K) dg for plus-end-out (blue) and minus-end-out (red) MTs grouped for growth in the distalmost 10 µm of the axon tip, and further away than 10 µm from the axon tip. Each dot represents the average of one axon in the respective region, grey lines indicate median values. With dg 2.11 [2.04, 2.16] µm/cycle (bootstrapped median [95% confidence interval]), plus-end-out MTs near the axon tip grew significantly longer than minus-end-out MTs (dg = 1.39 [1.27, 1.50] µm/cycle) and MTs located further away from the tip (dg = 1.53 [1.47, 1.59] µm/cycle, plus-end-out, dg = 1.16 [1.03, 1.33] µm/cycle, minus-end-out) (N=346 (plus-end-out close to tip), 343 (plus-end-out away from tip), 177 (minus-end-out close to tip), 194 (minus-end-out away from tip) axons), 20 biological replicates; p<10–30, Kruskal-Wallis test followed by Dunn-Sidak post hoc test; ***p<10–4. Scale bars: 3 µm.

Figure 1.

Figure 1—figure supplement 1. EB1 dynamics as a function of the distance from the axon tip.

Figure 1—figure supplement 1.

(A–C) Microtubule (MT) growth. (A) Added MT length per growth cycle, dg, (B) Catastrophe frequency, fg = 1/tg, and (C) growth velocity, vg, for plus-end-out (blue) and minus-end-out (red) MTs. While MT growth velocities are largely independent of MT orientation and localization along the axon (p<0.003; Kruskal-Wallis test, only bins 1 and 4 of plus-end-out growth velocities are significantly different) (C), plus-end-out MTs near the axon tip undergo catastrophes less frequently than minus-end-out MTs and MTs further away from the tip (p<10–37; Kruskal-Wallis test) (B). The resulting longer growth times tg lead to enhanced growth of these MTs in each growth cycle (p<10–37; Kruskal-Wallis test) (A). (D) Median MT orientation as a function of distance from the axon tip. Lines represent 30–70% quantiles (all 1). No changes are observed along the axon. (E) Median EB1-GFP fluorescence intensity normalized by median fluorescence as a function of distance from the axon tip. EB1 fluorescence decreases towards the axon tip. Lines represent median±95% confidence interval. All bins are significantly different and median fluorescence increases away from the axon tip (p<10–100; Kruskal-Wallis test, ***: p<0.001). (F) Median EB1 comet length as a function of the distance from the axon tip (p=0.25; Kruskal-Wallis test) ***: p<0.001. EB1 comets have similar lengths along the axon.

In immature axons, MT orientation is mixed, with 50–80% of all MTs pointing with their plus-end-out (del Castillo et al., 2015; Yau et al., 2016). During early neuronal development, the fraction of plus-end-out axonal MTs increases (del Castillo et al., 2015; Yau et al., 2016). In mature axons, ~95% of all MTs point in the same direction (plus-end-out) (Baas et al., 1989; Heidemann et al., 1981), enabling polarized transport (Millecamps and Julien, 2013). Deficits in polarized transport have been associated with human neurodegenerative diseases, such as Alzheimer’s and Parkinson’s diseases (Millecamps and Julien, 2013). Despite the importance of polarized transport in neuronal axons, the mechanisms that establish and maintain MT orientation are still not fully understood (Baas and Lin, 2011; Conde and Cáceres, 2009; Kapitein and Hoogenraad, 2011).

MTs in post-mitotic neurons are not attached to the centrosome (Kuijpers and Hoogenraad, 2011). Nucleation of new MTs occurs from MT organizing centres (MTOCs) such as somatic Golgi (Mukherjee et al., 2011) through elongation of severed pieces (Yu et al., 2008) or de novo polymerization alongside existing MTs (Nguyen et al., 2014; Sánchez-Huertas et al., 2016). These newly formed MTs often orient in the same direction as existing ones, enforcing any pre-existing orientation bias (Mattie et al., 2010; Mukherjee et al., 2020). Pre-existing biases are furthermore enhanced by selective stabilization of MTs through TRIM46-mediated parallel bundling (van Beuningen et al., 2015). However, without pre-existing biases these mechanisms by themselves cannot explain the robust plus-end-out orientation of MTs in mature axons.

Furthermore, in axons, short MTs pointing with their minus-end away from the cell body can be transported towards the cell body (i.e., away from the tip) by cytoplasmic dynein (del Castillo et al., 2015; Rao et al., 2017), thus potentially clearing the axon of minus-end-out MTs. To test whether this mechanism is sufficient to establish uniform MT orientation in axons, we previously designed computer simulations of dynein-mediated MT sliding in neurons. However, while MTs in the distal axon were oriented mostly with their plus-end away from the cell body (Jakobs et al., 2020; Jakobs et al., 2015), our simulations failed to explain the longer-term plus-end-out orientation of MTs in the proximal axon and the gradual establishment of a uniform plus-end-out MT orientation throughout the axon seen in experiments (Yau et al., 2016). Thus, our simulations suggested that additional mechanisms are needed to establish the uniform plus-end-out orientation of MTs in neuronal axons.

Here, we investigated MT growth behaviours along D. melanogaster axons and discovered increased plus-end polymerization of plus-end-out MTs near the advancing axon tip, which depended on the presence of MT anti-catastrophe protein gradients in the distal axon. A stochastic model of MT dynamics suggested that this growth bias leads to unbounded growth of these MTs, while minus-end-out MTs exhibit bounded growth and remain short. Experiments and computer simulations confirmed that this selective MT growth bias is critical for uniform axonal MT orientation. Integrating previously identified mechanisms with the decreased plus-end-out MT catastrophe rate discovered here led to a model explaining how uniform MT orientation is achieved in developing neuronal axons.

Results

Correctly oriented MTs add more length per growth cycle

To investigate how MT orientation in neuronal axons becomes biased, we first cultured acutely dissociated neurons from the D. melanogaster larval CNS (Egger et al., 2013) and quantified MT growth in axons. We used Drosophila lines expressing the fusion protein EB1-GFP, which labels growing MT plus-ends with bright ‘comets’ (Figure 1A–C; Sánchez-Soriano et al., 2010; Stepanova et al., 2003). The distance over which a comet moves in the axon is equal to the overall length dg that is added to an MT between the start of its growth cycle and the growth cycle’s end (Figure 1A), at which usually a ‘catastrophe’ occurred, leading to MT shrinkage (Figure 2). The direction of growth reveals whether an MT is oriented with its plus-end away from (plus-end-out) or towards (minus-end-out) the cell body. Time-lapse movies of EB1-GFP comets were converted into kymographs and analysed using KymoButler (Jakobs et al., 2019; Figure 1D–F).

Figure 2. Microtubule (MT) length depends on added length per growth cycle.

Figure 2.

(A) Schematic highlighting the assumptions of our two-state master equation model. MTs were assumed to occupy either a growing or shrinking state. During a growth cycle, the average MT length increases by dg, during a shrinkage cycle, the MT length decreases by ds. Additionally, MTs were able to stochastically switch between the two states as shown in Figure 1A. (B–D) Kymographs from a Drosophila melanogaster axon that expressed (B) EB1-GFP (green) and (C) Jupiter-mCherry, a tubulin label (magenta). Individual MT shrinkage events, visible as (C) fluorescent edges and (D) dashed white lines in the kymograph, yielded MT shrinkage lengths per cycle ds. Yellow and blue arrow heads in (B) and (C) indicate start and end points of an individual shrinkage event, respectively, and the inset in (D) highlights an individual shrinkage event. Scale bars: 3 µm. (E) Average ds values for N=47 axons (3 biological replicates; median: 2.03 [1.80, 2.26] µm) (bootstrapped median [95% confidence]). (F) Plot of the estimated overall MT length lMT as a function of dg. The two solid black curves indicate the lower and upper bounds of the average MT lengths for a given dg with ds = 1.80 or 2.26 µm. One can separate two regimes, ‘unbounded’ and ‘bounded’ growth, separated by the dashed grey line. (G) Plot of dg as a function of MT orientation and localization showing median and 95% confidence intervals. Plus-end-out MTs close to the tip were considerably more likely to exhibit unbounded growth than plus-end-out MTs further away from the tip and minus-end-out MTs.

The fraction of plus-end-out MTs increased over time and with increasing axonal length (Figure 1G–H), confirming that MT orientation increases during development (del Castillo et al., 2015; Yau et al., 2016). Most MT growth events (~66%) were found within the first 20 µm from the advancing axon tip (Figure 1A and J). MT growth lengths per cycle, dg were significantly higher near the axon tip compared to further away from it (Figure 1K). Furthermore, plus-end-out MTs added significantly more length per growth cycle than minus-end-out MTs, with the highest difference between plus-end-out and minus-end-out MTs (~0.5 µm/cycle) found within the first 10 µm from the axon tip (dg (plus-end-out)=2.11 [2.04, 2.16] µm/cycle and dg (minus-end-out)=1.39 [1.27, 1.50] µm, bootstrapped median [95% confidence interval]) (Figure 1L).

Increases in MT growth lengths during a polymerization cycle dg=vgfg could either arise from an increased polymerization velocity vg or a decreased catastrophe frequency fg (or both). In Drosophila neurons, MT growth velocities vg were similar in all MTs irrespective of their orientation and position within the axon (~5 µm/min; Figure 1—figure supplement 1C). Additionally, EB1-GFP, which affects MT polymerization velocities, was not enriched at the axon tip ( Figure 1—figure supplement 1E), and EB1-GFP comet lengths, which have previously been linked to MT polymerization speeds (Hahn et al., 2021), did not show significant variations along the axon (Figure 1—figure supplement 1F). However, catastrophe rates fg=1/tg were significantly lower (and thus polymerization times tg significantly longer) in plus-end-out MTs near the axon tip (fg+4102s1 vs. fg6102s1 ; Figure 1—figure supplement 1B), suggesting that these MTs grew longer because of a decrease in their catastrophe frequencies.

Overall, the orientation of MTs that added more length per growth cycle (i.e., plus-end-out MTs) becomes the dominant MT orientation in developing axons, indicating a possible link between increased plus-end-out MT growth and the fraction of plus-end-out MTs in axons.

Enhanced growth of plus-end-out MTs leads to unbounded growth

On long time scales, differences in MT growth length per growth cycle accumulate and thus affect the average MT length lMT. To estimate whether the rather small differences in dg of ~0.5 µm/cycle might lead to biologically meaningful differences in the average expected MT lengths between plus-end-out and minus-end-out oriented MTs, we used a two-state master equation model of MT growth and shrinkage (see Dogterom and Leibler, 1993 and supplemental methods for details). The model distinguishes two regimes (Figure 2A)

lMT={dgds/(dsdg)ds>dg(‘bounded’ growth)dsdg(‘unbounded’ growth) (1)

where ds = lost length per shrinkage cycle.

When dsdg, the average length added to the MT exceeds the average shrinkage length per cycle so that an MT will exhibit net growth and elongate if physically possible in its confined environment (called ‘unbounded’ growth, as the function describing MT growth in this regime goes towards infinity). For ds > dg, however, growth is ‘bounded’ (i.e., the end points of this function are finite), and average MT lengths follow an exponential distribution with a mean of dsdg/(ds−dg). In practice, this means that MTs with dg ≥ ds would grow until encountering a physical barrier (e.g., the distal end of the axon tip), while MTs with ds > dg remain finite (e.g., approximately 2 µm with ds = 2 µm and dg = 1.5 µm).

We determined the MT shrinkage per cycle ds by co-expressing a Jupiter-mCherry fusion protein (a tubulin marker) together with EB1-GFP in D. melanogaster axons of larval primary neurons. MTs stopped growing when the GFP signal disappeared from their plus-end, indicating a catastrophe or pause event. Subsequent MT shrinkage was visualized by simultaneously imaging tubulin (Jupiter-mCherry) and quantified by tracing tubulin edges resulting from the shrinkage in the dual colour kymographs (Figure 2B–D). Axonal MT shrinkage lengths were ds = 2.03 [1.80, 2.26] µm/cycle (bootstrapped median [95% confidence interval], Figure 2E).

With this value for ds, our model predicted the divergence of lMT (i.e., the change from bounded/finite growth to unbounded/infinite growth) at dg = 2.03 µm. This value dg corresponded to the lower end of the measured 95% confidence interval for the median dg = [2.04, 2.16] µm/cycle of plus-end-out MTs near the axon tip, but it was well above the 95% confidence interval for the median dg = [1.39, 1.48] µm/cycle of all other MTs (Figure 2F). The measured values of dg and ds hence suggested that plus-end-out-oriented MTs exhibit mostly unbounded growth within 10 µm from the axon tip while minus-end-out MTs within that range and any MT further away from the tip do not (Figure 2F). The decreased catastrophe frequency of plus-end-out MTs near the axon tip (Figure 1—figure supplement 1A-C) implied a higher chance of survival for plus-end-out MTs while leaving minus-end-out MTs labile, thereby establishing a bias for plus-end-out MT orientation.

Enhanced growth of plus-end-out MTs is required for uniform plus-end-out MT orientation

To test if enhanced MT growth is indeed involved in biasing MT orientation, we first chemically decreased MT growth using nocodazole, a drug that disrupts MT polymerization. Nocodazole treatment led to decreased MT growth velocities vg (Figure 4—figure supplement 3). Alternatively, we also physically decreased MT growth by increasing the osmolarity of the cell culture medium through addition of NaCl (Bray et al., 1991; Molines et al., 2020). Here, MT catastrophe rates fg were significantly increased (Figure 4—figure supplement 3).

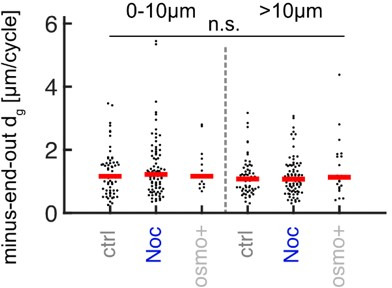
Both treatments led to significantly decreased plus-end-out MT growth dg=vg/fg at the axon tip (<10 µm), with dg < 1.71 µm/cycle < ds (upper 95% confidence bound of median) (Figure 3A–E). Our model predicted that this change in dg should lead to a switch from previously unbounded to bounded growth of plus-end-out MTs near the axon tip (Figure 3D), thus reducing the bias towards plus-end-out MTs and decreasing MT orientation. In agreement, MTs within treated axons were overall significantly less uniformly oriented (Figure 3D–E), confirming an important role of the enhanced growth lengths per cycle of plus-end-out MTs in establishing axonal MT orientation.

Figure 3. Decreasing microtubule (MT) growth leads to decreased axonal MT orientation.

Figure 3.

(A–C) Representative kymographs analysed with KymoButler (Jakobs et al., 2019) from axonal processes treated with (A) 0.025% DMSO (control) for 8 hr, (B) 5 µM nocodazole for 8 hr, (C) medium with increased osmolarity (‘osmo+’) for 22 hr. Growth of plus-end-out MTs is shown as blue lines, minus-end MTs are red. Scale bars = 3 µm. (D) Added MT lengths per growth cycle dg of plus-end-out MTs at the distalmost 10 µm from the axon tip and further away for control (N=107 axons from 5 biological replicates), nocodazole-treated axons (N=116 axons from 3 biological replicates), and axons cultured in osmo+medium (N=30, 2 biological replicates). At the axon tip, MT lengths increased significantly less per growth cycle in axons treated with nocodazole or osmo+media than controls (p<10–4, Kruskal-Wallis test, **p<0.01 for pairwise comparisons, Dunn-Sidak post hoc test). (E) The fraction of plus-end-out MTs in the different groups. MT orientation was calculated by counting all MTs that grew away from the cell body (blue lines in kymographs) and dividing them by all growing MTs (blue and red) along the whole axons. This way, a kymograph with only blue lines gives a value of 1 while an equal number of blue and red lines yield a value of 0.5. MTs in axons treated with nocodazole or osmo+media were significantly less uniformly oriented than those in the control group, that is, they contained a larger fraction of MTs pointing with their plus-ends toward the cell body (red lines in (A–C)) (p<10–4, Kruskal-Wallis test, **p<10–2 for pairwise comparisons, Dunn-Sidak post hoc test).

p150 protein gradient in axon tips promotes plus-end-out MT stabilization

However, why do plus-end-out MTs grow longer in the vicinity of the axon tip? Local gradients of MT growth-promoting factors could lead to an increase in plus-end MT growth in that region. Axon tips contain a multitude of different proteins and are highly compartmentalized (Lowery and Van Vactor, 2009). Locally enriched MT growth-promoting factors (of which there are many in the axon tip Voelzmann et al., 2016) include proteins stabilizing MTs, such as p150 by decreasing MT catastrophe rates (Lazarus et al., 2013; Moughamian and Holzbaur, 2012), CRMP-2 via promoting MT polymerization (Fukata et al., 2002; Inagaki et al., 2001), and TRIM46 by cross-linking MTs (Rao et al., 2017; van Beuningen et al., 2015), as well as free tubulin required for MT polymerization and others (Eng et al., 1999).

The MT stabilizing protein p150, for example, affects MT catastrophe rates fg and nucleation rates but not growth velocities vg (Lazarus et al., 2013). As we observed decreased MT catastrophe rates but constant growth velocities of plus-end-out MTs towards axon tips (Figure 1—figure supplement 1B,C), we hypothesized that p150 is one of the key proteins involved. Drosophila has a p150 homologue which, similar as in murine neurons (Moughamian and Holzbaur, 2012), we found to be enriched in axonal but not in dendritic tips (i.e., tips of immature ‘dendritic’ processes), whose MT orientation is mixed and thus resembles that of vertebrate and immature Drosophila dendrites (Hill et al., 2012; Figure 4A and C and Figure 4—figure supplement 1). Accordingly, plus-end-out MT growth lengths per cycle dg and catastrophe rates fg were significantly higher in axons than in dendritic processes (Figure 4—figure supplement 2E,G), where dg = 1.42 [1.37, 1.39] µm/cycle remained smaller than ds = 2.03 [1.80, 2.26] µm/cycle. In agreement with our model, which predicted unbounded growth of plus-end-out MTs in axons but bounded growth in dendritic processes (Figure 2), dendritic processes exhibited mixed (50% plus-end-out) MT orientations (Figure 4—figure supplement 2D, Hill et al., 2012), corroborating a link between MT stabilizing protein gradients in the tip of axons, reduced MT catastrophe rates, unbounded growth, and overall MT orientation.

Figure 4. Abrogation of p150 function decreases microtubule (MT) growth and axonal MT orientation.

(A–B) Tubulin (top) and normalized p150 (bottom) immunostaining of cultured Drosophila melanogaster larvae axonal processes of (A) controls and (B) neurons expressing elav-gal4 UAS-driven p150-RNAi. Large p150 puncta were found clustered around the axon tip (arrow) in controls (A) but not in p150-RNAi axons (B). Scale bars = 2 µm (C) Normalized p150 fluorescence intensity as a function of distance from the axon tip for wild-type axons (N=83, 2 biological replicates) and p150-RNAi axons (N=111, 2 biological replicates). Lines represent median±95% confidence intervals for wild-type (grey) and p150-RNAi (magenta). p150 fluorescence intensities changed along the axon (p<10–70; Kruskal-Wallis test). In wild-type axons, p150 was enriched at the axon tip (*p<0.05 between bin 1 and bin 3 or 4; pairwise comparisons with Dunn-Sidak post hoc test), but not in p150-RNAi expressing axons (p>0.05 for all pairwise comparisons). Overall, p150 expression levels were diminished in p150-RNAi axons compared to wild-type (***p<10–7 for any pairwise comparison between conditions). (D–F) KymoButler output for kymographs of EB1-GFP expressed in (D) a wild-type axon, (E) an axon expressing p150-RNAi, and (F) an axon in a p1501/+ mutant background. Scale bars = 3 µm. Blue/red lines represent MTs with plus/minus-end-out orientation, respectively. (G) Plus-end-out MT added length per growth cycle dg for wild-type (N=85, 9 biological replicates), p150-RNAi (N=34, 3 biological replicates), and p1501/+ (N=83, 6 biological replicates). At the axon tip, MT growth lengths were significantly decreased in both p150-RNAi and p1501 conditions compared to controls (p<10–9, Kruskal-Wallis test, ***p<0.001, *p<0.05, Dunn-Sidak post hoc test). (H) MT orientation along the whole axon for wild-type, p150-RNAi, and p1501/+. MTs were less uniformly oriented in both p150-RNAi and p1501 axons (p<10–9, Kruskal-Wallis test, ***p<10–5 for pairwise comparisons with Dunn-Sidak post hoc test). Overall, axonal MT orientation was decreased after chemical, physical, and genetic perturbations of MT growth.

Figure 4.

Figure 4—figure supplement 1. Normalized p150 immunostaining in axonal and dendritic processes.

Figure 4—figure supplement 1.

(A) Representative fluorescence image of a neuron stained for tubulin (green) and normalized p150 (magenta). (B and C) Enlarged images of (B) the axonal tip and (C) the dendritic tip found in the regions defined by the dashed regions in (A). The dendritic process exhibits comparably low levels of p150 if compared to the axonal tip. Scale bars = 5 µm.
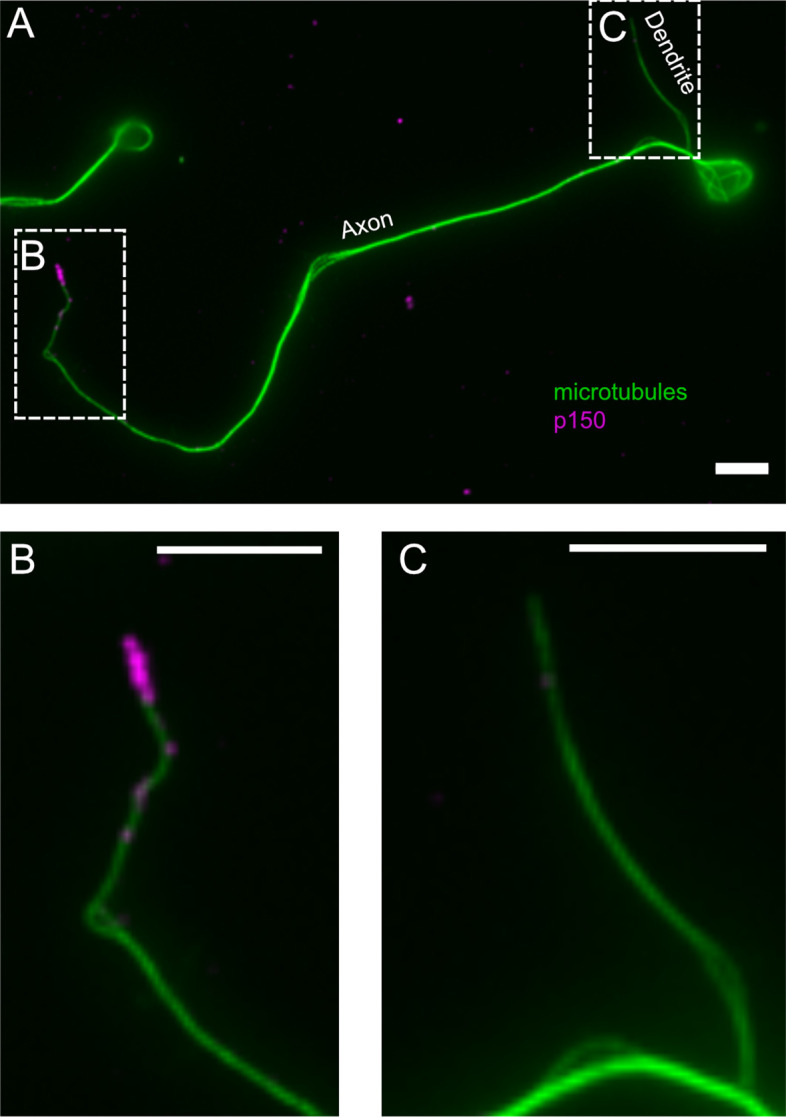
Figure 4—figure supplement 2. Microtubule (MT) growth and orientation is decreased in dendritic processes.

Figure 4—figure supplement 2.

(A, B) Kymographs for (A) the axonal and (B) the dendritic process shown in (C). (C) Drosophila melanogaster larva neuron expressing EB1-GFP with an axonal and several dendritic processes. White arrows represent the stationary paths for the kymographs shown in (A–B). (D) MT orientation, that is, the fraction of plus-end-out MTs, for axonal and dendritic processes. Most MTs in axonal but not in dendritic processes have their plus-ends oriented away from the cell body (N=69, 20 biological replicates; p<10–15, Wilcoxon rank sum test). (E) Growth length per cycle dg for plus-end-out MTs at the distalmost 10 µm of the axonal or dendritic tips. Black dots: averages for one cell; only cells possessing at least one axonal and one dendritic process (one randomized dendritic process was selected per neuron) were analysed. MTs in axonal processes grew longer than those in dendritic processes (p<10–8, Wilcoxon rank sum test). (F) MT growth velocities vg in the distalmost 10 µm of the axonal or dendritic tips (p<10–8, Wilcoxon rank sum test). (G) MT catastrophe frequencies fg in the distalmost 10 µm of the axonal or dendritic tips. Catastrophe frequencies are increased in dendritic processes compared to axonal ones (p<10–8, Wilcoxon rank sum test). Scale bars: 3 µm.
Figure 4—figure supplement 3. Microtubule (MT) growth parameters for nocodazole and osmo+ treatments (A, B) and p150 knockdown (C, D).

Figure 4—figure supplement 3.

Plots show growth velocities vg (A,C) and catastrophe frequencies fg (B,D) for plus-end-out MTs within 10 µm of the axon tip and further away for the experiments shown in Figure 3 (***=p < 0.001, *=p < 0.05, Dunn-Sidak post hoc).
Figure 4—figure supplement 4. The relationship between p150 protein concentration and the added length per microtubule (MT) growth cycle.

Figure 4—figure supplement 4.

Dots with error bars: experimental data of added length per MT growth cycle dg as a function of distance from the axon tip is shown in blue (plus-end-out) and red (minus-end-out) (median±95% confidence, same plot as in Figure 4—figure supplement 1A). Dashed lines: analytic model (see Supplemental methods: ‘Analytic model for MT growth as a function of p150 fluorescence’ for details), which assumes that dg(x)=A p150(x)α and dg plus-end-out, (x) = 0.5(dg(−dg(x)+x)+dg(x)) and dgminus-end-out, (x) = 0.5(dg(dg(x)+x)+dg(x)). The model thus results in one equation describing the average growth length per cycle, dg, for plus-end-out MTs, and in another equation describing dg for minus-end-out MTs. Both equations depend on A, α, and the measured p150 fluorescence intensity profile. We simultaneously fitted the predicted dg’s for plus-end-out and minus-end-out MTs to the experimentally determined values by varying A and α. The resulting pair of parameters was: A=0.86 and α=3.62. Our model returned a clear bifurcation between plus-end-out and minus-end-out MT growth towards the axon tip, resembling the experimental data and thus suggesting that the observed p150 gradient at the axon tip is strong enough to alter catastrophe frequencies in MTs depending on their orientation.
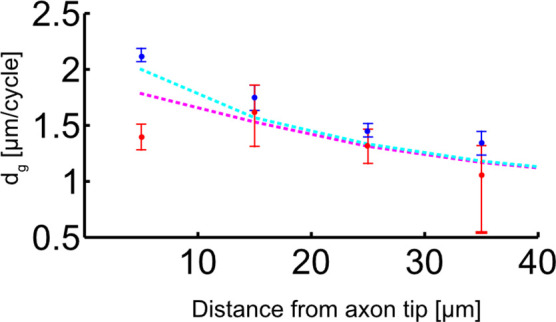
Figure 4—figure supplement 5. Downregulation of dynein heavy chain expression decreases microtubule (MT) orientation and plus-end-out MT growth at axon tips.

Figure 4—figure supplement 5.

(A) MT orientation (fraction of plus-end-out MTs) for wild-type (N=111, 8 biological replicates) and dhc-RNAi (N=168, 8 biological replicates). MT orientation was significantly decreased in dhc-RNAi axons (p<10–18, Wilcoxon rank sum test, ***p<0.001). (B) Plus-end-out MT growth in wild-type and dhc-RNAi. MT growth in axons expressing dhc-RNAi was significantly decreased at the distalmost 10 µm of the axon compared to control cells and increased further away towards the cell body (p<10–8, Kruskal-Wallis test, **=p < 0.01, *=p < 0.05, Dunn-Sidak post hoc). (C) Growth velocities vg of plus-end-out MTs. No significant differences were observed between different MTs. (D) Growth time per cycle tg for plus-end-out MTs (p<10–12, Kruskal-Wallis test, ***=p < 0.001, *=p < 0.05, Dunn-Sidak post hoc). Changes in dg were caused by changes in fg.
Figure 4—figure supplement 6. Disruption of kinesin 1 function reduces p150 concentration at axon tips and decreases microtubule (MT) orientation.

Figure 4—figure supplement 6.

(A–B) Tubulin (top) and normalized p150 (bottom) immunostainings of cultured Drosophila melanogaster larvae axonal processes. The distal axon tip is pointing left. p150 puncta were more densely clustered around the axon tip in control cells (A) compared to axonal processes that expressed UAS-driven khc-RNAi (B). (C–D) Kymographs of EB1-GFP-expressing axons of (C) wild-type and (D) khc-RNAi-treated neurons. (E) Normalized p150 protein fluorescence as a function of distance from the axon tip for wild-type axons (N=162, 5 biological replicates, black line) and khc-RNAi axons (N=68, 2 biological replicates, green line). Lines represent median±95% confidence interval. p150 protein was less enriched in khc-RNAi axon tips (p<10–16, Kruskal-Wallis test, 25% downregulation for 0–10 µm: **p<0.01, Dunn-Sidak post hoc test). (F) Plus-end-out MT growth in wild-type (N=167, 7 biological replicates) and khc-RNAi neurons (N=91, 2 biological replicates). MT growth in axons expressing khc-RNAi was significantly decreased at the distalmost 10 µm of the axon compared to control cells. Additionally, plus-end-out MT growth of MTs further away from the tip than 10 µm was increased in khc-RNAi compared to control cells (p<10–9, Kruskal-Wallis test, ***=p < 0.001, Dunn-Sidak post hoc). We can only speculate why the distance grown by MTs further way from the axon tip was increased. It seems rather unlikely that this phenomenon can be explained by impaired dynein-based MT sliding. It is conceivable, however, that the lack of concentrated p150 in the growth cone frees up a pool of tubulin, which is now available for polymerization further away in the axon. (G) MT orientation (fraction of plus-end-out MTs) for wild-type and khc-RNAi neurons. MT orientation was significantly decreased in khc-RNAi axons (p<10–9, Kruskal-Wallis test, p<10–5, ***p<0.001, Dunn-Sidak post hoc test). (H) Minus-end-out MT lengths per cycle (p<0.05, Kruskal-Wallis test). (I) Plus-end-out MT growth velocities (p<10–23, Kruskal-Wallis test, ***=p < 0.001, Dunn-Sidak post hoc). (J) Plus-end-out MT growth times in wild-type (N=167, 7 biological replicates) and khc-RNAi neurons (N=91, 2 biological replicates) (p<10–22, Kruskal-Wallis test, ***=p < 0.001, *=p < 0.05, Dunn-Sidak post hoc). All scale bars: 2 µm.
Figure 4—figure supplement 7. Example calculation of a single axons’ p150 profile.

Figure 4—figure supplement 7.

(A) Drosophila melanogaster neurons were stained for tubulin, p150, and exposed to CellTracker before fixation. Scale bar: 2 µm. (A–B) We then drew a line along the axon from the cell body (right) to the axon tip (left) and extracted intensity profiles for each channel. Typically, we observed a decrease of tubulin and an increase of p150 towards axon tips. Furthermore, all three channels exhibited increased fluorescence towards the cell body. (C) We then divided the tubulin and p150 profiles by the CellTracker profile to control for increased fluorescence due to larger cell volumes. CellTracker begins fluorescing after permeating the cell membrane and is thereby a good measure for how much cytosol is found at a given location. (D) Finally, we binned the data, calculated the mean for each bin, and divided each bin by the average bin value for the corresponding control experiment. The plot in Figure 4C then shows the bootstrapped median of all bins of all axons of the given condition.

We next tested whether the observed p150 gradient is strong enough to lead to different MT growth lengths (via modulation of catastrophe rates, dg~1/fg) for plus-end-out and minus-end-out MTs within 10 µm from the axon tip, the region where we observed the largest differences in fg (Figure 1—figure supplement 1C). We assumed that MT growth lengths per cycle at a distance x from the axon tip can be described by a power law function dg (x)=A*p150(x)α of the p150 fluorescence intensity profile. A simultaneous fit to both plus-end-out and minus-end-out MTs demonstrated that the observed gradient is, in theory, indeed strong enough to cause different growth behaviours for plus-end-out and minus-end-out MTs in axonal tips (Figure 4—figure supplement 4).

To test this prediction further, we assessed MT dynamics in wild-type, p150-RNAi expressing larval neurons, and in heterozygous mutant larval neurons from p1501/+ flies (Figure 4). p1501 (also known as Gl1) mutants express a truncated p150-RNA transcript, which results in a dominant negative phenotype (Plough and Ives, 1935). Expressing p150-RNAi led to decreased p150 protein in axons (Figure 4A–C). Both the expression of p150-RNAi and of dominant negative p1501/+ led to a significant increase in plus-end-out MT catastrophe rates (Figure 4—figure supplement 3) and thereby to a decrease (14–20%) in plus-end-out MT growth within 10 µm from the axon tip (Figure 4G). In agreement with our model, the overall axonal MT orientation was significantly decreased in both p150-RNAi and p1501/+ axons compared to controls (Figure 4H). p150 is known to interact with dynein (Karki and Holzbaur, 1995). Expressing an RNAi against dynein heavy chain also led to decreased plus-end-out MT growth at the axon tip (25%) and decreased MT organization, resembling the results of p150 removal (Figure 4—figure supplement 3). Together, these data indicated that MT stabilizing or growth-promoting protein gradients at the axon tip do indeed have an important role in regulating the overall orientation of the axonal MT network.

Kinesin 1 is required to establish p150 gradient

Previous work showed that p150 accumulation at axon tips depends on the activity of the MT-specific molecular motor protein kinesin 1 (Moughamian and Holzbaur, 2012; Twelvetrees et al., 2016), which preferentially enters axons over dendrites (Tas et al., 2017). Accordingly, disruption of kinesin 1 function with an RNAi treatment led to a 25% decrease in p150 fluorescence within 10 µm from the axon tip (Figure 4—figure supplement 6A-D). Again, the absence of a p150 gradient in these neurons led to a significant increase in MT catastrophe rates and decreased plus-end-out MT growth near the axon tip, and hence to an overall decrease in axonal MT orientation (Figure 4—figure supplement 6E-I), suggesting that gradients of MT stabilizing proteins at the tips of developing axons are critical for biasing axonal MT orientations.

Uniform axonal MT orientation is established through a combination of MT sliding, templating, and unbounded growth

Our experiments suggested that a gradient of an MT growth-promoting factor localized at the axon tip is required for establishing uniform plus-end-out MT orientation in axons. To investigate the significance of the locally biased MT growth in more detailed, we modelled the evolution of overall MT polarity along the axon using computer simulations. We extended our previously described simulations of MT-MT sliding, which led to sorting of MTs based on their orientation (Jakobs et al., 2020), to include two additional effects on axonal MTs: (1) enhanced stabilization of MTs at axon tips as found in this study and (2) a local biasing of MT nucleation (MT templating) that could originate from augmin (Nguyen et al., 2014; Sánchez-Huertas et al., 2016) or TRIM46 (Rao et al., 2017).

The simulation is detailed in the Materials and methods section and a schematic can be found in Figure 5A. Briefly, a cylindrical bundle of MTs is generated, and dynein motors are assumed to cross-link adjacent MTs. The orientation of each MT is randomly chosen. Force-velocity relationships are used to predict the exerted sliding velocities of the MTs, which are then used to calculate new MT positions iteratively. MTs were confined in the axon with a solid boundary at the axon tip and a semi-permeable boundary at the cell body. New MTs were added randomly along the bundle axis at a determined frequency. To mimic the effect of a concentration gradient of a catastrophe-inhibiting protein (such as p150) at the axon tip, we assumed that the frequency of newly added MTs is sampled from an exponential distribution that peaks at the axon tip. To account for augmin or TRIM46-induced local biases of MT nucleation, we assumed that the orientation of an added MT is dictated by the mean MT orientation in the region to which it is added.

Figure 5. Biased stabilization of plus-end-out microtubules (MTs) is required to establish uniform axonal MT orientation.

(A) Schematic showing the MT sliding simulation and its relevant parameters. (B–C) Simulation results of MT dynamics. (B) Snapshot of a simulated axon with dynein-based sliding of MTs minus-end-out MTs accumulated within the proximal axon. (C) Snapshot of an axon simulated with sliding, augmin templating (new MTs were likely oriented into the same direction as their surrounding ones), and biased nucleation of plus-end-out MTs at the tip. Much like in real axons, most MTs were oriented with their plus-end-out throughout the axon. (D) Experimental profiles of MT orientation along the (normalized) axon length for axons that were cultured 4 hr in vitro (4hiv), separated into less than 20 µm or more than 20 µm long, and 24 hr in culture (24hiv). Lines represent bootstrapped medians and 95% confidence intervals. (E–F) Simulation profiles of MT orientation along the axon. (E) Profiles obtained from simulations with dynein-mediated sliding only at three different simulation time points. MT orientation was graded along the axon but, unlike in the experimental profiles shown in (D), the proximal axon remained enriched with minus-end-out MTs. (F) MT orientation profiles obtained from simulations with sliding, templating, and biased nucleation of plus-end-out MTs at the axon tip. The observed gradual development of MT orientation along the axon is in excellent agreement with our experimental data (D). (G) Summary of proposed mechanism for establishing MT orientation in axons. Red and blue lines represent minus-end-out and plus-end-out MTs, respectively. Green drop shapes indicate unbounded MT growth into the axon tip for plus-end-out MTs. Kinesin 1 deposits MT growth-promoting proteins, such as p150, at axon tips (Figure 4—figure supplement 4), leading to local unbounded growth of plus-end-out MTs. Augmin templating and cell body-directed sliding of minus-end-out MTs further amplifies this bias. All three mechanisms together lead to a plus-end-out MT cytoskeleton.

Figure 5.

Figure 5—figure supplement 1. Detailed results of computer simulations for different microtubule (MT) sorting models.

Figure 5—figure supplement 1.

Evolution of the MT orientation profile along the normalized axon length (middle), and of the axon length (right), for different MT sorting models (left). Colours represent simulation time (0–55 hr). (A) Dynein-mediated sliding alone. Minus-end-out MTs were transported towards the cell body and plus-end-out MTs towards the axon tip. The resulting MT orientation profile was graded along the axon with plus-end-out MTs enriched towards the tip; within approximately 14 hr, the orientation profile became stationary where a fixed fraction of the proximal axon remained enriched with minus-end-out MTs. (B) Local bias of MT nucleation (templating) alone. To mimic this situation, the directional movement of dynein motors on the MTs was eliminated by randomly choosing their gliding direction in each MT overlap. As the MT templating mechanism augmented the randomly chosen orientation of the initial MTs in the axon, individually grown axons were either enriched with plus-end-out MTs or with minus-end-out MTs but there was no bias towards either orientation. Consequently, when averaged over many axons, the resulting mean fraction of plus-end-out MTs was ~50% uniformly. (C) Unbounded growth alone. Here, a bias towards nucleation of plus-end-out MTs at the advancing tip of the axon was implemented and calculated from experimental data but motor-induced MT sliding was non-directional as in (B). The resulting MT orientation was stationary along the axon and roughly 55% plus-end-out. The reason for the small effect on overall MT orientation is that the MT growth-promoting factor is concentrated in a small region close to the axon tip, and its range of action thus diminishes in comparison to the axon length when the axon extends. In other words, as the axon extends, a growing portion of its length continues to accumulate ill-oriented MTs. Dynein-mediated sliding is therefore essential for clearing out the generated minus-end-out MTs, and this occurs much more efficiently in the presence of a bias at the growing tip that continually maintains the fraction of minus-end-out MTs small during growth, as can be understood from the comparison between panels (A) and (E). (D) Dynein-mediated sliding with local bias of MT nucleation (templating). The fraction of plus-end-out MTs increased along the axon length, and over time, because the biased nucleation resulted in less minus-end-out MTs. However, occasionally in these simulations the dominating MT polarity in the axon was inverted due to 'erroneous' initial nucleation of minus-end-out MTs, which then amplified during growth. (E) Sliding with unbounded growth of plus-end-out MTs at the tip. The position and orientation of new MTs was chosen at random, but their successful nucleation depended on their likelihood to exhibit unbounded growth as per Figure 2. This led to more plus-end-out MTs appearing in the system but not enough to render the axon fully plus-end-out. Furthermore, axon growth ceased to be linear because longer axons were less likely to nucleate new MTs as the region of unbounded growth at the tip did not increase over time. (F) Unbounded growth in combination with sliding and templating. New MT positions were sampled from a uniform distribution but with an orientation that depended on the local orientation of nearby MTs. MTs were only added to the simulation if they nucleated as calculated in (C). The fraction of plus-end-out MTs monotonically increased towards the axon tip and the orientation profile gradually become uniform over time, resembling the evolution observed in our experimentally determined profiles in Figure 5B.

Simulations incorporating dynein-induced MT sliding but lacking mechanisms (1) and (2) mentioned above resulted in steadily growing axons whose MT orientation profile was graded along their length, being enriched with plus-end-out MTs at the distal end and with minus-end-out MTs at the proximal (cell body) end (Figure 5A, B and E and Figure 5—figure supplement 1). The proximal domain of minus-end-out MTs grew in proportion to the axon length, as minus-end-out MTs from across the growing axon continually accumulated in that region despite their withdrawal into the cell body by dynein motors. Those simulations thus failed to reproduce the experimental observation of an enrichment of the proximal axon with plus-end-out MTs over time, which eventually leads to uniformly oriented axonal MTs (Yau et al., 2016; Figure 5D).

Similarly, the increased growth of plus-end-out MTs or templating alone, or any combination of two out of these three mechanisms, were also insufficient for establishing high fractions of plus-end-out MTs at the proximal axon as observed experimentally (Figure 5—figure supplement 1).

However, when we integrated sliding, templating, and biased MT growth at the axon tip in the simulation (assuming that the likelihood of exhibiting unbounded growth corresponds to a successful nucleation event), MTs gradually oriented uniformly plus-end-out across the entire length of the axon, recapitulating our experimental results (Figure 5C, D and F and Figure 5—figure supplement 1). Thus, our data suggest that multiple mechanisms – including biased growth of plus-end-out MTs near the axon tip identified in this study – need to work in unison to establish and maintain uniform axonal MT orientation.

Discussion

We here found that MT growth is an important factor in the regulation of overall MT organization in the axon. Our experiments and modelling suggest that an enrichment of MT stabilizing/growth-promoting proteins at the advancing axon tip leads to a transition of MT growth from a bounded to an unbounded state for plus-end-out MTs. This growth transition is important for establishing uniform plus-end-out MT orientation from the cell body to the axon tip as found in mature axons. While previous studies suggested that MT dynamics are temporally and spatially constant during early axon formation (Seetapun and Odde, 2010), our results suggest that, at later stages of axon maturation, MT dynamics are heterogeneous (Figure 1).

Our chemical and physical perturbations of MT growth affected different aspects of MT dynamics. Nocodazole treatment decreased MT growth velocities while not affecting catastrophe frequencies; hyperosmotic solutions increased MT catastrophe frequencies but did not alter growth velocities (Figure 4—figure supplement 3). The effect of the hyperosmotic solution might potentially arise from a decrease in the available space in the distal axon for MTs to polymerize into (Dogterom and Yurke, 1997; Franze, 2020). However, NaCl can be toxic for neurons, so that the effect on MT growth could also be due to a general stress response (Morland et al., 2016). Either way, both treatments led to a decrease of the MT length added during each growth cycle, dg, so that dg<ds, switching plus-end-out MT dynamics from unbounded to bounded growth, thus leading to a loss of uniform MT polarization along the axon (Figure 3).

The axon tip is highly enriched with growth-promoting factors such as p150 (Lazarus et al., 2013; Moughamian and Holzbaur, 2012), CRMP-2 (Fukata et al., 2002; Inagaki et al., 2001), TRIM46 (Rao et al., 2017; van Beuningen et al., 2015), and EB1 (Ma et al., 2004; Morrison et al., 2002). The anti-catastrophe protein p150, which we investigated here as an example, was concentrated at axon tips but was not enriched at dendritic tips (Figure 4—figure supplement 1). Enhanced stabilization of plus-end-out MTs, leading to reduced catastrophe rates and thus unbounded growth essential for establishing uniform MT orientation, was only observed near axonal but not near dendritic tips (Figure 4—figure supplement 2), confirming that differences in the localization of MT growth-promoting proteins correlate with differences in MT growth. Perturbations of p150 led to increased catastrophe rates and decreased plus-end-out MT growth in the axon tip, and thus to decreased overall MT order in the axon (Figure 3). Interestingly, MT growth (dg) scaled with the fourth power of the p150 concentration (Figure 4—figure supplement 4). This non-linear dependence could result from the requirement of several p150 proteins to form a complex to affect MT catastrophe rates, as previously hypothesized (Lazarus et al., 2013).

While p150 is mainly known for its role in the dynactin complex, which is an important cargo adapter protein complex for the molecular motor protein dynein (Gill et al., 1991), it also acts as a dynein-independent MT anti-catastrophe factor (Lazarus et al., 2013). Since p150 and dynein are functionally related, it is difficult to separate their individual contributions to stabilizing plus-end-out MT growth in the axon tip and cell body-directed sliding of minus-end-out MTs along the axon. However, it remains unclear whether p150 is required for dynein-mediated MT sliding (Ahmad et al., 1998; Tan et al., 2018; Waterman-Storer et al., 1997), and the D. melanogaster oocyte also contains an ordered MT cytoskeleton whose orientation is, presumably, maintained by p150 (Nieuwburg et al., 2017). Hence, while p150 is unlikely to induce unbounded MT growth alone, it emerges as a key contributor to the establishment of MT orientation.

In addition to its contribution to setting up the p150 gradient in axon tips (Figure 4—figure supplement 6), kinesin 1 is also thought to slide MTs with their minus-end leading (del Castillo et al., 2015) and to be involved in dynein function (Pilling et al., 2006; Rao et al., 2017). Kinesin knockdown could thus not only prevent the accumulation of MT growth-promoting factors at the axon tip but also decrease kinesin 1-mediated minus-end-out MTs sliding into the distal axon (thereby increasing the fraction of plus-end-out MTs) and/or prevent retrograde dynein-mediated sliding of minus-end-out MTs (decreasing the fraction of plus-end-out MTs). We observed that disruption of kinesin 1 function led to a decrease in the fraction of plus-end-out MTs in the axon (Figure 4—figure supplement 6), suggesting that kinesin 1 does not contribute to the overall MT orientation via direct sliding but that it rather affects MT orientation mainly via localizing MT growth or nucleation-promoting proteins to axonal tips and/or via interactions with dynein-mediated sliding.

Finally, both kinesin 1 and p150/dynactin perturbations could potentially also affect MTOC localization in neurons. p150 was enriched at the tips of axonal but not of dendritic processes (Figure 4—figure supplement 1). In Caenorhabditis elegans neurons, MTOCs may be located to the tips of dendritic processes (Liang et al., 2020). Removal of dynactin, which initiates cell body-directed transport from axonal tips (Moughamian and Holzbaur, 2012), could lead to an increased number of MTOCs also at axon tips, thereby promoting growth and nucleation of MTs. However, our results showed a decrease in MT growth dynamics at axon tips after dynactin removal (Figure 3), indicating that the observed decrease in MT orientation was mostly due to decreased rather than promoted growth of axonal MTs in the axon tip.

Our simulations revealed that the uniform MT orientation along the axon cannot be understood solely based on dynein-mediated MT sliding: as axons extended, an increasing number of minus-end-out MTs from across the axonal shaft accumulated at the proximal axon. Additional mechanisms were needed to dilute the fraction of minus-end-out MTs. Amongst those, MT-templating (e.g., by augmin or TRIM46) and the biased MT growth mechanism identified in the present study both improved the MT orientation profile along the axonal shaft. Our experimental findings were best matched when all three mechanisms worked in concert (Figure 5—figure supplement 1).

We propose the following model explaining the spontaneous establishment of MT orientation in developing axons. Growth-promoting proteins accumulate at the axon tip due to MT plus-end-directed transport by kinesin motors (Figure 4—figure supplement 6). The resulting protein gradient leads to a local bias in MT growth (Figure 1, Figure 3), rendering plus-end-out MT growth into the axon tip unbounded (Figure 2). In theory, a finite pool of tubulin at axon tips would further contribute to this bias in plus-end-out MT growth by diminishing the amount of free tubulin available for MTs that polymerize towards the cell body. In contrast, short minus-end-out MTs are more prone to depolymerization and/or transport away from the tip by dynein-mediated cell body-directed sliding (del Castillo et al., 2015; Rao et al., 2017), thus contributing to the orientation bias of MTs in the axon. The orientation bias is further enhanced by augmin-mediated templating or TRIM46-mediated parallel bundling of newly formed MTs to establish and maintain a fully organized MT cytoskeleton (see Figure 5E for a schematic summary). Together with cell process length-dependent MT accumulation (Seetapun and Odde, 2010), these mechanisms cooperate to build the uniformly oriented MT network that enables efficient long-range transport in neuronal axons. Future work will reveal whether other cellular systems use similar mechanisms to organize their cytoskeleton.

Materials and methods

Key resources table.

Reagent type (species) or resource Designation Source or reference Identifiers Additional information
Strain (Drosophila melanogaster) EB1-GFP Bulgakova et al., 2012 N/A Flyline used to express EB1-GFP
Strain (Drosophila melanogaster) Ubi EB1-GFP Shimada et al., 2006 N/A Complementary Flyline used to express EB1-GFP
Strain (Drosophila melanogaster) Jupiter-mCherry Bergstralh et al., 2015 N/A Flyline used to label microtubules
Strain (Drosophila melanogaster) P1501 Bloomington RRID:BDSC_504 p150 heterozygous mutant
Strain (Drosophila melanogaster) P150-RNAi Bloomington RRID:BDSC_3785
Strain (Drosophila melanogaster) khc-RNAi Bloomington RRID:BDSC_35770
Strain (Drosophila melanogaster) Elav-gal4 Bloomington RRID:BDSC_458 RNAi driver in neuronal cells
Antibody Rb anti-p150 (rabbit polyclonal) Nieuwburg et al., 2017 N/A 1:500
Antibody Ms anti-alpha-tubulin (mouse monoclonal) Abcam Cat#: ab7291
RRID:AB_2241126
1:1000
Recombinant DNA reagent CellTracker Invitrogen Cat#: C2925 ×1
Antibody CF633 anti-Rb (donkey anti-rabbit polyclonal) Cambridge Bioscience Cat#: BT20125 1:500
Antibody AF405 anti-Ms (donkey anti-mouse polyclonal) Thermo Fisher Scientific Cat#: ab175658 RRID:AB_2687445 1:500
Software, algorithm MATLAB Mathworks RRID:SCR_001622
Software, algorithm Mathematica Wolfram RRID:SCR_014448
Software, algorithm KymoButler Jakobs et al., 2019 https://githlab.com/deepmirror/kymobutler; deepMirror, 2019
Software, algorithm ImageJ Schindelin et al., 2012 RRID:SCR_003070
Software, algorithm Neurite Tracer Pool et al., 2008 RRID:SCR_016566

Fly stocks

MT plus-end dynamics were visualized with a transgenic fly line expressing EB1-GFP heterozygously under its endogenous promoter (wh;+;eb1-gfp/tm6b, gift from the Brown laboratory in Cambridge) (Bulgakova et al., 2013) or a fly expressing EB1-GFP under a ubiquitin promotor (ubi:eb1-gfp;+;+, gift from the St Johnston laboratory in Cambridge) (Shimada et al., 2006). Whole MTs were labelled with Jupiter-mCherry (wh;if/cyo;Jupiter-mcherry, gift from the St Johnston laboratory in Cambridge) (Bergstralh et al., 2015). Other stocks used: p1501 (Bloomington # 504), uas:p150-RNAi (Vienna Drosophila Stock Center # 3785), uas:khc-RNAi (Bloomington # 35770), khc27 (Bloomington # 67409), khc17 (gift from the St Johnston laboratory in Cambridge). uas constructs were driven by elav-gal4 (Bloom# 458, elav is a neuron-specific promotor that ensures the construct is only expressed in the CNS; Yannoni and White, 1997) and transgenic lines were generated through standard balancer crossing procedures.

Primary cell culture

Third instar larvae were picked 5–8 days post fertilization, and their CNS dissected similarly to Egger et al., 2013; Sánchez-Soriano et al., 2010. As described in Egger et al., 2013, the resulting primary culture comprised a mixture of terminally differentiated larvae neurons such as peripheral neurons alongside precursors cells and immature neurons of the adult fly brain. Thereby, the larval CNS lends itself to the study of a heterogenous population of neurons. The CNS tissue was homogenized and dissociated in 100 μl of Dispersion medium (Hank’s Balanced Salt Solution [×1 HBSS, Life Technologies, 14170088] supplemented with Phenylthiourea (Sigma-Aldrich P7629, 0.05 mg/ml), Dispase (Roche 049404942078001, 4 mg/ml), and Collagenase (Worthington Biochem. LS004214, 1 mg/ml)) for 5 min at 37°C. The media was topped up with 200 μl of Cell Culture Medium (Schneider’s Medium, Thermo Fisher Scientific 21720024) supplemented with insulin (2 μg/ml Sigma I0516) and fetal bovine serum (1:5 Thermo Fisher Scientific A3160801) and cells were spun down for 6 min at 650 rcf. The pellet was resuspended in Cell Culture Medium at 5 brains/120 μl. Cells were grown at 26°C for 1.5 hr in a droplet of 30 µl Cell Culture Medium in a glass bottom dish between a Concanavalin A-coated glass slide and an uncoated glass slide on top. Initially the cells were cultured with the coated coverslip facing down. After 1.5 hr the chambers were flipped so that cells that did not attach floated off to the opposite (uncoated) side. Culture times were: 4–26 hr (for measuring MT orientation profiles in short and long axons), 22–26 hr (for measuring MT dynamics, both Patronin-YFP and EB1-GFP), and 22–48 hr (for measuring MT dynamics in dendritic processes).

To measure the effect nocodazole has on MT orientation in axons, the medium was supplemented with 5 µM of nocodazole (dissolved in DMSO, Sigma-Aldrich M1404-2MG) approximately 12 hr post plating and 12 hr before measuring MT dynamics. The control cells were treated with 0.025% DMSO in culture medium. Treatment and corresponding controls were always run in parallel, and when possible, from the same fly stock. Uas-driven overexpression was controlled with a fly expressing both elav::gal4 and eb1-gfp to control for the expression of gal4 protein.

To measure the effects of osmolarity changes in the surrounding medium, we increased the osmolarity of the culture medium by approximately 100 mOsm (from ~360 to ~460 mOsm, see also https://www.sigmaaldrich.com/GB/en/product/sigma/s9895) by adding 4 mg of NaCl to 1 ml culture medium. Cells were first cultured in normal media for 1.5 hr. Subsequently, the media was removed and replaced with either fresh media (control) or media supplemented with 4 g NaCl. Cells were again imaged after 22–26 hr post plating.

Live imaging of MTs

All live imaging movies were acquired on a Leica DMi8 inverted microscope with a ×63 objective (oil immersion, NA = 1.4, Hamamatsu Orca Flash 2.0 camera) and at room temperature (22–25°C). To reduce autofluorescence during imaging, the culture medium was replaced with Live Imaging Solution (Thermo Fisher Scientific A14291DJ). Culture media was not replaced for imaging cells in nocodazole, DMSO, and osmo+ to enable measurement of MT dynamics in the chosen media. For EB1-GFP imaging, an image (exposure time 500 ms) was taken every 2 s for 70–150 frames depending on sample bleaching. When imaging both EB1-GFP and Jupiter-mCherry simultaneously, one image was taken every 3 s for 100 frames (exposure 500 ms). Lamp intensity was set to the lowest level that enabled visual identification of labels.

p150 antibody staining

Twenty-four hr after plating, the cells were treated with 5 μM of CellTracker (Invitrogen C2925) dye for 30 min to label cells in green. Subsequently, cells were fixed in pre-warmed 4% paraformaldehyde (pH 7.2, 26°C) for 50 min. Post fixation, the cells were washed in PBS once and then incubated with mouse alpha-tubulin 1:1000 (Abcam ab7291) and rabbit glued/p150 antibody 1:500 (gift from the St Johnston laboratory, Nieuwburg et al., 2017) diluted in PBST (×2 phosphate-buffered saline (PBS, Oxoid BR0014G) tablets in 400 ml H2O+1.2 ml Triton X-100)+0.01 g/ml bovine serum albumin at 4°C overnight (~14 hr). After two quick washes in PBS, the cells were incubated with the secondary antibodies Alexa Fluor 647 (far-red, Thermo Fisher Scientific A-21236) and 405 (blue, Thermo Fisher Scientific A-31556) for 1.5 hr at room temperature. After another two quick PBS washes, the cells were mounted in Fluoromount (Thermo Fisher Scientific 00-4958-02) and imaged.

Images were analysed by drawing a line along axon processes from the base of the axon to its tip in the tubulin channel. The intensity profiles for all three channels (p150, tubulin, and CellTracker) were extracted and normalized by their respective median values, and the p150 channel was subsequently divided by the normalized CellTracker channel and the data binned in bins of 10 μm. Finally, the resulting binned p150-RNAi p150 profiles were normalized by the mean fluorescence of the respective wild-type control p150 fluorescence. The resulting profiles (per axon) were then pooled over all biological replicates and plotted in Mathematica. See Figure 4—figure supplement 7 for a single cell workflow example.

EB1-GFP dynamics

Kymographs of EB1-GFP tracks in D. melanogaster axons were generated by first using the Neurite Tracer plugin in ImageJ to draw lines along axons or dendrites from the centre of the cell body to the farthest EB1-GFP comet signal, that is, the distalmost growth event (Pool et al., 2008). Subsequently a custom Mathematica (https://wolfram.com) algorithm automatically generated kymographs from these lines by plotting the average pixel intensity of three adjacent pixels into rows of an image for each frame. The resulting image was then smoothed with a Gaussian kernel of size 3 and wavelet filtered to remove noise. Kymographs were analyzed with KymoButler and subsequently post-processed in MATLAB (https://mathworks.com). Tracks were removed in case: (1) they displaced less than two pixels along the x-axis, (2) they were slower than 1.5 µm/min, (3) they were faster than 20 µm/min, and (4) they were visible for less than four frames. Additionally, control experiments and their corresponding treatment condition were discarded if the control axons exhibited a mean orientation below 0.8 or average growth velocities below 2 µm/min. To account for outlier comets, the distance from the axon tip was calculated as the distance from the 0.95 quantile EB1-GFP comet.

MT minus-end polymerization is much slower than plus-end polymerization (Strothman et al., 2019). Since we observed similar growth velocities of cell body-directed and tip-directed MT growth, we are confident that we measured plus-end-out MT growth events in both directions rather than minus-end growth.

Note that, mature D. melanogaster dendrites in vivo exhibit a mixed MT orientation (Stone et al., 2008). However, we cultured neurons only up to 48 hr which might be too short to form fully developed dendrites and our minimal cell culture medium is likely lacking growth factors that would enable further differentiation to form fully minus-end-out dendrites. Additionally, vertebrate dendrites also appear to acquire their characteristic orientation over time (Baas et al., 1989).

Jupiter-mCherry and EB1-GFP

Kymographs were prepared as for imaging EB1-GFP only (i.e., using Neurite Tracer). Individual shrinkage events were extracted by hand from the resulting kymographs using the ROI tool in ImageJ (https://imagej.net). The tracks were then analysed and plotted with MATLAB and Mathematica. Measuring MT shrinkage dynamics was only possible in regions of low tubulin content, for example, near the axon tip. We implicitly assumed that MT shrinkage depends neither on MT orientation nor on its position along the axon. However, experimental evidence suggests that a decrease in MT growth length correlates with an increase in shrinkage length (Vasquez et al., 2017), indicating that we likely overestimated MT lengths further away from the axon tip, therefore underestimating the difference between plus-end-out MTs at the tip and those further away from it.

Statistics

For comparing two groups, the Wilcoxon rank sum test was used as implemented in MATLAB (https://www.mathworks.com/help/stats/ranksum.html). The standard error of the mean (s.e.m.) was calculated as s.e.m.=σ/n. Here, σ is the standard deviation of the sample and n is the number of samples. The 95% confidence interval was calculated by median bootstrapping with 10,000 random samples from the distribution. Biological replicates are experiments conducted on different days with different larvae and reagents. We used the Kruskal-Wallis test (https://uk.mathworks.com/help/stats/kruskalwallis.html) to compare several samples, followed by a Dunn-Sidak post hoc test.

Solution of the two-state master equation

We assumed that MTs can either grow or shrink, and each of these two states (g and s in short) has a probability distribution that depends on MT length l and time t (pgl,t and psl,t). MTs can furthermore stop growing and start shrinking with rate fg=1/tg (tg being the average MT growth time) and stop shrinking to start growing with rate fs=1/ts (ts being the average MT shrinkage time). Furthermore, MTs are assumed to grow with velocity vg and shrink with velocity vs , while they are in the growing or shrinking state, respectively. Writing this as a master equation yields:

ddtpsl,t=fgpgl,t-fspsl,t
ddtpgl,t=fspsl,t-fgpgl,t

This equation is a two-state master equation that equates the rate change of a probability to be in one state (i.e., dps/dt) to the outflow (−fsps, i.e., the likelihood of a shrinking MT to start growing) and the inflow (fgpg, i.e., the likelihood of a growing MT to start shrinking) into that state. With dp/dt=l/tp/l=vp/l, we can write:

tps(l,t)=fgpg(l,t)fsps(l,t)+vslps(l,t)
tpg(l,t)=fsps(l,t)fgpg(l,t)vglpg(l,t)

To solve this set of partial differential equations, consider the following Fourier transformation of psl,t and pg(l,t) :

ps,g(l,t)=dkdωeiωtiklps,g(ω,k)

Substituting in the two-state master equation yields:

0=dkdωeiωtikx[(iω+fgikvg)pg(ω,k)fsps(ω,k)]
0=dkdωeiωtikx[(iω+fs+ikvs)ps(ω,k)fgpg(ω,k)]

which can be written as a matrix equation:

0=(iω+fgikvgfsfgiω+fs+ikvs)(pg(ω,k)ps(ω,k))

This equation only has non-zero solutions for p~g and ps if the matrix determinant is equal to zero:

0=detiω+fg-ikvg-fs-fgiω+fs+ikvs=iω+fg-ikvgiω+fs+ikvs+fgfs

This equation can be written as a dispersion relation:

ω(k)=(fsfs+fgvgfgfs+fgvs)=v¯k+ifsfg(vg+vs)2(fg+fs)3=D¯k2+O(k3)=v¯k+iD¯k2+O(k3)

For large times t both ω and k are small so that we can drop terms of the order of k3 . The dispersion relation is then the same as for a diffusion advection process with drift velocity v´ and diffusion coefficient D´ . For v´>0 the system will evolve like a diffusion advection process in which MTs would have no average length so that they will become as long as the system allows, that is, their growth is ‘unbounded’.

For v´<0, MTs will exhibit an average length that depends on their dynamic parameters which can be calculated as follows: For large times, the overall probability to find an MT with length l at time t (pl,t=pgl,t+psl,t) can be approximated by a modified diffusion-advection equation:

tp(l,t)=D´2l2p(l,t)+v´lp(l,t)

The stationary state tpl,t=0 is thus found by:

0=2l2p(l)+|v´|D´lp(l)

The general solution to this partial differential equation is:

p(l)=|v¯|D¯ev¯D¯l

For pl,t to be normalizable: C2=0 and C1=v´D´2. So that:

 p(l)=|ν¯|D¯eν¯D¯l

This equation is a two-state master equation that equates the rate change of a probability to be in one state (i.e., dps/dt) to the outflow (−fsps, i.e., the likelihood of a shrinking MT to start growing) and the inflow (fgpg, i.e., the likelihood of a growing MT to start shrinking) into that state. With dp/dt=l/tp/l=vp/l, we can write:

tps(l,t)=fgpg(l,t)fsps(l,t)+vslps(l,t)
tpg(l,t)=fsps(l,t)fgpg(l,t)vglpg(l,t)

Finally, one can calculate the average MT length lMT as the expectation value of the length:

lMTl=0dllpl=D´v´=fsfgvg+vs2fg+fs2vsfg-vgfs

For vsvg1, fsfg1, and d=v/f the quadratic terms can be Taylor expanded to yield:

lMTvgvsvsfg-vgfs=dgdsds-dg

Analytical fit to estimate MT growth per cycle based on immunostainings

The p150 fluorescence profiles were calculated as described in the section on ‘p150 antibody staining’. Subsequently, an exponential function, p150(x)=b+es(xx0), was fitted to the first 12 bins of the data (corresponds to up until 120 µm from the tip). Here, b, s, and x0 are fitting parameters with units: [b]=AU, [s]=1/µm, [x0]=µm. Next, we assumed that dg(x)=Ap150(x)α, that is, MT growth per cycle is a simple power law in the p150 fluorescence intensity. A and α are fitting parameters and their values are shown in Figure 4—figure supplement 4 The expected growth length per cycle for an MT that starts growing at position x towards (1) or away (–1) from the cell body can be approximated as:

dgx,sign=0.5dgsigndgx+x+dgx

Here, we assumed that the average length added to an MT during growth is the mean between the average expected growth length at start and end position of the MT plus-end. This function was subsequently fitted to the growth length data presented in Figure 1F. To do so, the experimental data was first binned in bins of size 10 µm (like the staining data). Then, we calculated the integral of dgx,sign over each bin for each direction of growth and minimized the squared difference to the experimental results by varying A and α. Note that we assumed that MTs that grow way from the tip have to be at least 4 µm away from it (average MT length; Yu and Baas, 1994) and that MTs that grow into the tip may penetrate it by 2 µm.

MT sliding simulations

Details of the simulation can be found in Jakobs et al., 2020. We here present a brief description that focusses on the novel way in which new MTs are added during the simulation. MTs were arranged with their long axis along the x-axis of a Cartesian coordinate system and their centres on a hexagonal lattice in the y-z plane. For simplicity all MTs were assumed to have the same length, lMT = 4 µm. The inter-MT spacing in the y-z plane (∼30 nm) was assumed to allow individual molecular motors (here, cytoplasmic dynein) to intervene between adjacent filaments and cross-link them with their respective ‘cargo’ or ‘walking’ domains. The simulation was initialized with 10 randomly oriented MTs that were randomly distributed on a hexagonal lattice of length 6 µm. New MTs were added to the system depending on the chosen nucleation model:

  1. Sliding only: MTs were added at random locations with random orientation every 1100 s (~18 min). The time was optimized to yield axons of approximately the same length as cultured ones.

  2. Sliding and templating: MTs were added at random locations every 1100 s. The likelihood of being plus-end-out was calculated by counting the number and orientation of MTs at the location (the centre of the MT) in which the MT is added. Then, the number of plus-end-out MTs was divided by the total number of MTs to calculate the probability of getting a plus-end-out MT. Finally, a random number is drawn between 0 and 1 to determine the orientation of the added MT.

  3. Templating only: Same as above except that the directionality of the movement of molecular motors along the MTs was eliminated. When MT overlaps became occupied with motors, the motors’ gliding direction towards the plus-end or the –end of the MTs was chosen at random. Note that this is a highly artificial setting that solely removes the sorting effect of MT sliding.

  4. Sliding and unbounded growth: A random location along the axon was chosen and a random MT orientation (50/50 plus-end-out/minus-end-out) introduced every 435 s. As not every MT nucleated in this model, the rate of influx was selected to be higher to enable the same axon growth behaviour. Subsequently, we calculated the likelihood of exhibiting unbounded growth for an MT with the randomly selected orientation and location. To do so, we first calculated the average added length per growth cycle in 10 µm bins (distance from the axon tip and separately for plus-end-out and minus-end-out MTs) for each axon in the dataset presented in Figure 1A–G. For each bin we then queried whether growth was bounded (added length below 2.2 µm) or unbounded. The likelihood of unbounded growth was calculated for each bin by counting the number of axons that exhibited unbounded growth in the bin and dividing that number by all axons. Subsequently, two exponential functions were fitted to the plus-end-out and minus-end-out MT data respectively to determine a function that gives the likelihood of unbounded growth for plus-end-out and minus-end-out MTs as a function of distance from the axon tip. Finally, the random location and the predetermined orientation were used to look up the likelihood of unbounded growth and the MT was assumed to have nucleated successfully when a randomly drawn number [0,1] was smaller than that likelihood.

  5. Unbounded growth only: Same as above but molecular motors were again assumed to not have a preferred direction as in 3.

  6. Sliding, templating, and unbounded growth: A random location along the axon was chosen every 435 s and its orientation likelihood calculated as in 2. Subsequently, the unbounded growth likelihood was calculated as in 3. MTs only successfully entered the system if exhibiting unbounded growth.

MTs that were neighbours on the y-z plane and overlapping along the x-axis were cross-linked by cytoplasmic dynein. For simplicity and due to the tight packing of MTs in the bundle, only motion in parallel to the x-axis was considered. MT velocities were determined by solving a set of force balance equations that characterize dynein interaction with the MTs, as detailed in Jakobs et al., 2020. Furthermore, the left boundary was a leaky spring; MTs that moved into the left boundary were subject to a force of 50 pN/µm and were able to leave the axon with a fixed rate per MT (0.00024/s). The rate was adjusted to lead to axons of 50 µm in length after approximately 24 hr simulation time. The right boundary was a constant force of 50 pN as described in Jakobs et al., 2020.

Axons were simulated for 50,001 iterations (~28 hr) and all results averaged over 50 separate simulations. Simulation parameters were as follows:

Symbol Description Value Reasoning
χ Fraction of overlapping MTs that are cross linked 1 We previously explored how changing χ affects MT sliding (Jakobs et al., 2020; Jakobs et al., 2015). In this manuscript we simply wanted to explore the effect of different MT addition models on MT orientation in which we fixed the value at 1.
λ Number of motors bound in an overlapping region (#/µm) 5 We quantified (by eye) the number of MT cross-links in EM images of axons (Hirokawa et al., 2010) which was approximately 5 per 1000 nm.
IMT MT lengths (µm) 4 µm Average MT lengths in axons measured in Yu and Baas, 1994.
ξ Drag coefficient of the axoplasm 1 pN s/µm2 Same coefficient used in Oelz et al., 2018.
f s Dynein stall force 1.4 pN Same coefficient used in Oelz et al., 2018.
v 0 Dynein free velocity 0.86 µm/s Same coefficient used in Oelz et al., 2018.
dt Simulation timestep per iteration 2 s As we showed previously (Jakobs et al., 2020; Jakobs et al., 2015), this value is a good choice to ensure smooth movements of MTs during the simulation.

Acknowledgements

We would like to thank Eva Pillai, Dennis Bray, Michael Takla, Kevin Chalut, and Melissa Rolls for inspiring discussions and proofreading, Andreas Prokop and Cristina Melero for teaching Drosophila dissection techniques, and Sarah Bray, Dmitry Nashchekin, Daniel St Johnston, and Nick Brown for providing Drosophila strains, laboratory space and a great atmosphere to work in. The authors acknowledge funding from the Wellcome Trust (PhD studentship 109145/Z/15/Z to MAHJ), the UK Biotechnology and Biological Sciences Research Council (Research Grant BB/N006402/1 to KF), the European Research Council (Consolidator Award 772426 to KF), and the Alexander von Humboldt Foundation (Alexander von Humboldt Professorship to KF).

Funding Statement

The funders had no role in study design, data collection and interpretation, or the decision to submit the work for publication. For the purpose of Open Access, the authors have applied a CC BY public copyright license to any Author Accepted Manuscript version arising from this submission.

Contributor Information

Maximilian AH Jakobs, Email: max@deepmirror.ai.

Kristian Franze, Email: kf284@cam.ac.uk.

Kang Shen, Howard Hughes Medical Institute, Stanford University, United States.

Anna Akhmanova, Utrecht University, Netherlands.

Funding Information

This paper was supported by the following grants:

  • Wellcome Trust PhD studentship 109145/Z/15/Z to Maximilian AH Jakobs.

  • Biotechnology and Biological Sciences Research Council Research Grant BB/N006402/1 to Kristian Franze.

  • European Research Council Consolidator Award 772426 to Kristian Franze.

  • Alexander von Humboldt-Stiftung Alexander von Humboldt Professorship to Kristian Franze.

Additional information

Competing interests

MAHJ and KF are shareholders of deepMirror (https://deepmirror.ai), a company that, amongst other products, sells custom3 interfaces of the freeware KymoButler.

No competing interests declared.

KF is shareholders of deepMirror (https://deepmirror.ai), a company that, amongst other products, sells custom interfaces of the freeware KymoButler used in this study.

Author contributions

Conceptualization, Data curation, Software, Formal analysis, Funding acquisition, Investigation, Visualization, Methodology, Writing – original draft, Writing – review and editing.

Resources, Software, Supervision, Methodology, Writing – review and editing.

Conceptualization, Supervision, Funding acquisition, Visualization, Writing – original draft, Writing – review and editing.

Additional files

Transparent reporting form

Data availability

The software used in this study is freely available, a Gitlab link is provided in the manuscript. Data files can be found on biostudies and accessed via: https://www.ebi.ac.uk/biostudies/studies/S-BIAD547.

The following dataset was generated:

Franze K. 2022. Drosophila primary neuron microtubule imaging data. EMBL-EBI. S-BIAD547

References

  1. Ahmad FJ, Echeverri CJ, Vallee RB, Baas PW. Cytoplasmic dynein and dynactin are required for the transport of microtubules into the axon. The Journal of Cell Biology. 1998;140:391–401. doi: 10.1083/jcb.140.2.391. [DOI] [PMC free article] [PubMed] [Google Scholar]
  2. Baas PW, Black MM, Banker GA. Changes in microtubule polarity orientation during the development of hippocampal neurons in culture. The Journal of Cell Biology. 1989;109:3085–3094. doi: 10.1083/jcb.109.6.3085. [DOI] [PMC free article] [PubMed] [Google Scholar]
  3. Baas PW, Lin S. Hooks and comets: the story of microtubule polarity orientation in the neuron. Developmental Neurobiology. 2011;71:403–418. doi: 10.1002/dneu.20818. [DOI] [PMC free article] [PubMed] [Google Scholar]
  4. Bergstralh DT, Lovegrove HE, St Johnston D. Lateral adhesion drives reintegration of misplaced cells into epithelial monolayers. Nature Cell Biology. 2015;17:1497–1503. doi: 10.1038/ncb3248. [DOI] [PMC free article] [PubMed] [Google Scholar]
  5. Bray D, Money NP, Harold FM, Bamburg JR. Responses of growth cones to changes in osmolality of the surrounding medium. Journal of Cell Science. 1991;98 (Pt 4):507–515. doi: 10.1242/jcs.98.4.507. [DOI] [PubMed] [Google Scholar]
  6. Bulgakova NA, Klapholz B, Brown NH. Cell adhesion in Drosophila: versatility of cadherin and integrin complexes during development. Current Opinion in Cell Biology. 2012;24:702–712. doi: 10.1016/j.ceb.2012.07.006. [DOI] [PMC free article] [PubMed] [Google Scholar]
  7. Bulgakova NA, Grigoriev I, Yap AS, Akhmanova A, Brown NH. Dynamic microtubules produce an asymmetric E-cadherin-bazooka complex to maintain segment boundaries. The Journal of Cell Biology. 2013;201:887–901. doi: 10.1083/jcb.201211159. [DOI] [PMC free article] [PubMed] [Google Scholar]
  8. Conde C, Cáceres A. Microtubule assembly, organization and dynamics in axons and dendrites. Nature Reviews. Neuroscience. 2009;10:319–332. doi: 10.1038/nrn2631. [DOI] [PubMed] [Google Scholar]
  9. deepMirror KymoButler. 795a6c13GitLab. 2019 https://gitlab.com/deepmirror/kymobutler
  10. del Castillo U, Winding M, Lu W, Gelfand VI. Interplay between kinesin-1 and cortical dynein during axonal outgrowth and microtubule organization in Drosophila neurons. eLife. 2015;4:e10140. doi: 10.7554/eLife.10140. [DOI] [PMC free article] [PubMed] [Google Scholar]
  11. Dogterom M, Leibler S. Physical aspects of the growth and regulation of microtubule structures. Physical Review Letters. 1993;70:1347–1350. doi: 10.1103/PhysRevLett.70.1347. [DOI] [PubMed] [Google Scholar]
  12. Dogterom M, Yurke B. Measurement of the force-velocity relation for growing microtubules. Science. 1997;278:856–860. doi: 10.1126/science.278.5339.856. [DOI] [PubMed] [Google Scholar]
  13. Egger B, van Giesen L, Moraru M, Sprecher SG. In vitro imaging of primary neural cell culture from Drosophila. Nature Protocols. 2013;8:958–965. doi: 10.1038/nprot.2013.052. [DOI] [PubMed] [Google Scholar]
  14. Eng H, Lund K, Campenot RB. Synthesis of beta-tubulin, actin, and other proteins in axons of sympathetic neurons in compartmented cultures. The Journal of Neuroscience. 1999;19:1–9. doi: 10.1523/JNEUROSCI.19-01-00001.1999. [DOI] [PMC free article] [PubMed] [Google Scholar]
  15. Franze K. Integrating chemistry and mechanics: the forces driving axon growth. Annual Review of Cell and Developmental Biology. 2020;36:61–83. doi: 10.1146/annurev-cellbio-100818-125157. [DOI] [PubMed] [Google Scholar]
  16. Fukata Y, Itoh TJ, Kimura T, Ménager C, Nishimura T, Shiromizu T, Watanabe H, Inagaki N, Iwamatsu A, Hotani H, Kaibuchi K. CRMP-2 binds to tubulin heterodimers to promote microtubule assembly. Nature Cell Biology. 2002;4:583–591. doi: 10.1038/ncb825. [DOI] [PubMed] [Google Scholar]
  17. Gill SR, Schroer TA, Szilak I, Steuer ER, Sheetz MP, Cleveland DW. Dynactin, a conserved, ubiquitously expressed component of an activator of vesicle motility mediated by cytoplasmic dynein. The Journal of Cell Biology. 1991;115:1639–1650. doi: 10.1083/jcb.115.6.1639. [DOI] [PMC free article] [PubMed] [Google Scholar]
  18. Hahn I, Voelzmann A, Parkin J, Fülle JB, Slater PG, Lowery LA, Sanchez-Soriano N, Prokop A. Tau, XMAP215/msps and eb1 co-operate interdependently to regulate microtubule polymerisation and bundle formation in axons. PLOS Genetics. 2021;17:e1009647. doi: 10.1371/journal.pgen.1009647. [DOI] [PMC free article] [PubMed] [Google Scholar]
  19. Heidemann SR, Landers JM, Hamborg MA. Polarity orientation of axonal microtubules. The Journal of Cell Biology. 1981;91:661–665. doi: 10.1083/jcb.91.3.661. [DOI] [PMC free article] [PubMed] [Google Scholar]
  20. Hill SE, Parmar M, Gheres KW, Guignet MA, Huang Y, Jackson FR, Rolls MM. Development of dendrite polarity in Drosophila neurons. Neural Development. 2012;7:34. doi: 10.1186/1749-8104-7-34. [DOI] [PMC free article] [PubMed] [Google Scholar]
  21. Hirokawa N, Niwa S, Tanaka Y. Molecular motors in neurons: transport mechanisms and roles in brain function, development, and disease. Neuron. 2010;68:610–638. doi: 10.1016/j.neuron.2010.09.039. [DOI] [PubMed] [Google Scholar]
  22. Inagaki N, Chihara K, Arimura N, Ménager C, Kawano Y, Matsuo N, Nishimura T, Amano M, Kaibuchi K. CRMP-2 induces axons in cultured hippocampal neurons. Nature Neuroscience. 2001;4:781–782. doi: 10.1038/90476. [DOI] [PubMed] [Google Scholar]
  23. Jakobs M, Franze K, Zemel A. Force generation by molecular-motor-powered microtubule bundles; implications for neuronal polarization and growth. Frontiers in Cellular Neuroscience. 2015;9:441. doi: 10.3389/fncel.2015.00441. [DOI] [PMC free article] [PubMed] [Google Scholar]
  24. Jakobs MA, Dimitracopoulos A, Franze K. KymoButler, a deep learning software for automated kymograph analysis. eLife. 2019;8:e42288. doi: 10.7554/eLife.42288. [DOI] [PMC free article] [PubMed] [Google Scholar]
  25. Jakobs MAH, Franze K, Zemel A. Mechanical regulation of neurite polarization and growth: A computational study. Biophysical Journal. 2020;118:1914–1920. doi: 10.1016/j.bpj.2020.02.031. [DOI] [PMC free article] [PubMed] [Google Scholar]
  26. Jiang K, Hua S, Mohan R, Grigoriev I, Yau KW, Liu Q, Katrukha EA, Altelaar AFM, Heck AJR, Hoogenraad CC, Akhmanova A. Microtubule minus-end stabilization by polymerization-driven CAMSAP deposition. Developmental Cell. 2014;28:295–309. doi: 10.1016/j.devcel.2014.01.001. [DOI] [PubMed] [Google Scholar]
  27. Jiang K, Faltova L, Hua S, Capitani G, Prota AE, Landgraf C, Volkmer R, Kammerer RA, Steinmetz MO, Akhmanova A. Structural basis of formation of the microtubule minus-end-regulating CAMSAP-katanin complex. Structure. 2018;26:375–382. doi: 10.1016/j.str.2017.12.017. [DOI] [PubMed] [Google Scholar]
  28. Kapitein LC, Hoogenraad CC. Which way to go? cytoskeletal organization and polarized transport in neurons. Molecular and Cellular Neurosciences. 2011;46:9–20. doi: 10.1016/j.mcn.2010.08.015. [DOI] [PubMed] [Google Scholar]
  29. Karki S, Holzbaur EL. Affinity chromatography demonstrates a direct binding between cytoplasmic dynein and the dynactin complex. The Journal of Biological Chemistry. 1995;270:28806–28811. doi: 10.1074/jbc.270.48.28806. [DOI] [PubMed] [Google Scholar]
  30. Kuijpers M, Hoogenraad CC. Centrosomes, microtubules and neuronal development. Molecular and Cellular Neurosciences. 2011;48:349–358. doi: 10.1016/j.mcn.2011.05.004. [DOI] [PubMed] [Google Scholar]
  31. Lazarus JE, Moughamian AJ, Tokito MK, Holzbaur ELF. Dynactin subunit p150(glued) is a neuron-specific anti-catastrophe factor. PLOS Biology. 2013;11:e1001611. doi: 10.1371/journal.pbio.1001611. [DOI] [PMC free article] [PubMed] [Google Scholar]
  32. Liang X, Kokes M, Fetter RD, Sallee MD, Moore AW, Feldman JL, Shen K. Growth cone-localized microtubule organizing center establishes microtubule orientation in dendrites. eLife. 2020;9:e56547. doi: 10.7554/eLife.56547. [DOI] [PMC free article] [PubMed] [Google Scholar]
  33. Lowery LA, Van Vactor D. The trip of the tip: understanding the growth cone machinery. Nature Reviews. Molecular Cell Biology. 2009;10:332–343. doi: 10.1038/nrm2679. [DOI] [PMC free article] [PubMed] [Google Scholar]
  34. Ma Y, Shakiryanova D, Vardya I, Popov SV. Quantitative analysis of microtubule transport in growing nerve processes. Current Biology. 2004;14:725–730. doi: 10.1016/j.cub.2004.03.061. [DOI] [PubMed] [Google Scholar]
  35. Mattie FJ, Stackpole MM, Stone MC, Clippard JR, Rudnick DA, Qiu Y, Tao J, Allender DL, Parmar M, Rolls MM. Directed microtubule growth, +tips, and kinesin-2 are required for uniform microtubule polarity in dendrites. Current Biology. 2010;20:2169–2177. doi: 10.1016/j.cub.2010.11.050. [DOI] [PMC free article] [PubMed] [Google Scholar]
  36. Millecamps S, Julien JP. Axonal transport deficits and neurodegenerative diseases. Nature Reviews. Neuroscience. 2013;14:161–176. doi: 10.1038/nrn3380. [DOI] [PubMed] [Google Scholar]
  37. Molines AT, Lemière J, Edrington CH, Hsu CT, Steinmark IE, Suhling K, Goshima G, Holt LJ, Brouhard GJ, Chang F. Physical Properties of the Cytoplasm Modulate the Rates of Microtubule Growth and Shrinkage. bioRxiv. 2020 doi: 10.1101/2020.10.27.352716. [DOI] [PMC free article] [PubMed]
  38. Morland C, Pettersen MN, Hassel B. Hyperosmolar sodium chloride is toxic to cultured neurons and causes reduction of glucose metabolism and ATP levels, an increase in glutamate uptake, and a reduction in cytosolic calcium. Neurotoxicology. 2016;54:34–43. doi: 10.1016/j.neuro.2016.03.005. [DOI] [PubMed] [Google Scholar]
  39. Morrison EE, Moncur PM, Askham JM. EB1 identifies sites of microtubule polymerisation during neurite development. Brain Research. Molecular Brain Research. 2002;98:145–152. doi: 10.1016/s0169-328x(01)00290-x. [DOI] [PubMed] [Google Scholar]
  40. Moughamian AJ, Holzbaur ELF. Dynactin is required for transport initiation from the distal axon. Neuron. 2012;74:331–343. doi: 10.1016/j.neuron.2012.02.025. [DOI] [PMC free article] [PubMed] [Google Scholar]
  41. Mukherjee A, Jenkins B, Fang C, Radke RJ, Banker G, Roysam B. Automated kymograph analysis for profiling axonal transport of secretory granules. Medical Image Analysis. 2011;15:354–367. doi: 10.1016/j.media.2010.12.005. [DOI] [PubMed] [Google Scholar]
  42. Mukherjee A, Brooks PS, Bernard F, Guichet A, Conduit PT. Microtubules originate asymmetrically at the somatic golgi and are guided via kinesin2 to maintain polarity within neurons. eLife. 2020;9:e58943. doi: 10.7554/eLife.58943. [DOI] [PMC free article] [PubMed] [Google Scholar]
  43. Nguyen MM, McCracken CJ, Milner ES, Goetschius DJ, Weiner AT, Long MK, Michael NL, Munro S, Rolls MM. Γ-tubulin controls neuronal microtubule polarity independently of golgi outposts. Molecular Biology of the Cell. 2014;25:2039–2050. doi: 10.1091/mbc.E13-09-0515. [DOI] [PMC free article] [PubMed] [Google Scholar]
  44. Nieuwburg R, Nashchekin D, Jakobs M, Carter AP, Khuc Trong P, Goldstein RE, St Johnston D. Localised dynactin protects growing microtubules to deliver oskar mrna to the posterior cortex of the Drosophila oocyte. eLife. 2017;6:e27237. doi: 10.7554/eLife.27237. [DOI] [PMC free article] [PubMed] [Google Scholar]
  45. Oelz DB, Del Castillo U, Gelfand VI, Mogilner A. Microtubule dynamics, kinesin-1 sliding, and dynein action drive growth of cell processes. Biophysical Journal. 2018;115:1614–1624. doi: 10.1016/j.bpj.2018.08.046. [DOI] [PMC free article] [PubMed] [Google Scholar]
  46. Pilling AD, Horiuchi D, Lively CM, Saxton WM. Kinesin-1 and dynein are the primary motors for fast transport of mitochondria in Drosophila motor axons. Molecular Biology of the Cell. 2006;17:2057–2068. doi: 10.1091/mbc.e05-06-0526. [DOI] [PMC free article] [PubMed] [Google Scholar]
  47. Plough HH, Ives PT. Induction of mutations by high temperature in Drosophila. Genetics. 1935;20:42–69. doi: 10.1093/genetics/20.1.42. [DOI] [PMC free article] [PubMed] [Google Scholar]
  48. Pool M, Thiemann J, Bar-Or A, Fournier AE. NeuriteTracer: a novel imagej plugin for automated quantification of neurite outgrowth. Journal of Neuroscience Methods. 2008;168:134–139. doi: 10.1016/j.jneumeth.2007.08.029. [DOI] [PubMed] [Google Scholar]
  49. Rao AN, Patil A, Black MM, Craig EM, Myers KA, Yeung HT, Baas PW. Cytoplasmic dynein transports axonal microtubules in a polarity-sorting manner. Cell Reports. 2017;19:2210–2219. doi: 10.1016/j.celrep.2017.05.064. [DOI] [PMC free article] [PubMed] [Google Scholar]
  50. Sánchez-Huertas C, Freixo F, Viais R, Lacasa C, Soriano E, Lüders J. Non-centrosomal nucleation mediated by augmin organizes microtubules in post-mitotic neurons and controls axonal microtubule polarity. Nature Communications. 2016;7:12187. doi: 10.1038/ncomms12187. [DOI] [PMC free article] [PubMed] [Google Scholar]
  51. Sánchez-Soriano N, Gonçalves-Pimentel C, Beaven R, Haessler U, Ofner-Ziegenfuss L, Ballestrem C, Prokop A. Drosophila growth cones: A genetically tractable platform for the analysis of axonal growth dynamics. Developmental Neurobiology. 2010;70:58–71. doi: 10.1002/dneu.20762. [DOI] [PubMed] [Google Scholar]
  52. Schindelin J, Arganda-Carreras I, Frise E, Kaynig V, Longair M, Pietzsch T, Preibisch S, Rueden C, Saalfeld S, Schmid B, Tinevez J-Y, White DJ, Hartenstein V, Eliceiri K, Tomancak P, Cardona A. Fiji: an open-source platform for biological-image analysis. Nature Methods. 2012;9:676–682. doi: 10.1038/nmeth.2019. [DOI] [PMC free article] [PubMed] [Google Scholar]
  53. Seetapun D, Odde DJ. Cell-length-dependent microtubule accumulation during polarization. Current Biology. 2010;20:979–988. doi: 10.1016/j.cub.2010.04.040. [DOI] [PubMed] [Google Scholar]
  54. Shimada Y, Yonemura S, Ohkura H, Strutt D, Uemura T. Polarized transport of frizzled along the planar microtubule arrays in Drosophila wing epithelium. Developmental Cell. 2006;10:209–222. doi: 10.1016/j.devcel.2005.11.016. [DOI] [PubMed] [Google Scholar]
  55. Stepanova T, Slemmer J, Hoogenraad CC, Lansbergen G, Dortland B, De Zeeuw CI, Grosveld F, van Cappellen G, Akhmanova A, Galjart N. Visualization of microtubule growth in cultured neurons via the use of EB3-GFP (end-binding protein 3-green fluorescent protein) The Journal of Neuroscience. 2003;23:2655–2664. doi: 10.1523/JNEUROSCI.23-07-02655.2003. [DOI] [PMC free article] [PubMed] [Google Scholar]
  56. Stone MC, Roegiers F, Rolls MM. Microtubules have opposite orientation in axons and dendrites of Drosophila neurons. Molecular Biology of the Cell. 2008;19:4122–4129. doi: 10.1091/mbc.E07-10-1079. [DOI] [PMC free article] [PubMed] [Google Scholar]
  57. Strothman C, Farmer V, Arpağ G, Rodgers N, Podolski M, Norris S, Ohi R, Zanic M. Microtubule minus-end stability is dictated by the tubulin off-rate. The Journal of Cell Biology. 2019;218:2841–2853. doi: 10.1083/jcb.201905019. [DOI] [PMC free article] [PubMed] [Google Scholar]
  58. Tan R, Foster PJ, Needleman DJ, McKenney RJ. Cooperative accumulation of dynein-dynactin at microtubule minus-ends drives microtubule network reorganization. Developmental Cell. 2018;44:233–247. doi: 10.1016/j.devcel.2017.12.023. [DOI] [PMC free article] [PubMed] [Google Scholar]
  59. Tas RP, Chazeau A, Cloin BMC, Lambers MLA, Hoogenraad CC, Kapitein LC. Differentiation between oppositely oriented microtubules controls polarized neuronal transport. Neuron. 2017;96:1264–1271. doi: 10.1016/j.neuron.2017.11.018. [DOI] [PMC free article] [PubMed] [Google Scholar]
  60. Twelvetrees AE, Pernigo S, Sanger A, Guedes-Dias P, Schiavo G, Steiner RA, Dodding MP, Holzbaur ELF. The dynamic localization of cytoplasmic dynein in neurons is driven by kinesin-1. Neuron. 2016;90:1000–1015. doi: 10.1016/j.neuron.2016.04.046. [DOI] [PMC free article] [PubMed] [Google Scholar]
  61. van Beuningen SFB, Will L, Harterink M, Chazeau A, van Battum EY, Frias CP, Franker MAM, Katrukha EA, Stucchi R, Vocking K, Antunes AT, Slenders L, Doulkeridou S, Sillevis Smitt P, Altelaar AFM, Post JA, Akhmanova A, Pasterkamp RJ, Kapitein LC, de Graaff E, Hoogenraad CC. TRIM46 controls neuronal polarity and axon specification by driving the formation of parallel microtubule arrays. Neuron. 2015;88:1208–1226. doi: 10.1016/j.neuron.2015.11.012. [DOI] [PubMed] [Google Scholar]
  62. Vasquez RJ, Howell B, Yvon AM, Wadsworth P, Cassimeris L. Nanomolar concentrations of nocodazole alter microtubule dynamic instability in vivo and in vitro. Molecular Biology of the Cell. 2017;8:973–985. doi: 10.1091/mbc.8.6.973. [DOI] [PMC free article] [PubMed] [Google Scholar]
  63. Voelzmann A, Hahn I, Pearce SP, Sánchez-Soriano N, Prokop A. A conceptual view at microtubule plus end dynamics in neuronal axons. Brain Research Bulletin. 2016;126:226–237. doi: 10.1016/j.brainresbull.2016.08.006. [DOI] [PMC free article] [PubMed] [Google Scholar]
  64. Waterman-Storer CM, Karki SB, Kuznetsov SA, Tabb JS, Weiss DG, Langford GM, Holzbaur EL. The interaction between cytoplasmic dynein and dynactin is required for fast axonal transport. PNAS. 1997;94:12180–12185. doi: 10.1073/pnas.94.22.12180. [DOI] [PMC free article] [PubMed] [Google Scholar]
  65. Yannoni YM, White K. Association of the neuron-specific RNA binding domain-containing protein ELAV with the coiled body in Drosophila neurons. Chromosoma. 1997;105:332–341. doi: 10.1007/BF02529748. [DOI] [PubMed] [Google Scholar]
  66. Yau KW, Schätzle P, Tortosa E, Pagès S, Holtmaat A, Kapitein LC, Hoogenraad CC. Dendrites in vitro and in vivo contain microtubules of opposite polarity and axon formation correlates with uniform plus-end-out microtubule orientation. The Journal of Neuroscience. 2016;36:1071–1085. doi: 10.1523/JNEUROSCI.2430-15.2016. [DOI] [PMC free article] [PubMed] [Google Scholar]
  67. Yu W, Baas PW. Changes in microtubule number and length during axon differentiation. The Journal of Neuroscience. 1994;14:2818–2829. doi: 10.1523/JNEUROSCI.14-05-02818.1994. [DOI] [PMC free article] [PubMed] [Google Scholar]
  68. Yu W, Qiang L, Solowska JM, Karabay A, Korulu S, Baas PW. The microtubule-severing proteins spastin and katanin participate differently in the formation of axonal branches. Molecular Biology of the Cell. 2008;19:1485–1498. doi: 10.1091/mbc.E07-09-0878. [DOI] [PMC free article] [PubMed] [Google Scholar]

Editor's evaluation

Kang Shen 1

How axons form and maintain uniformly plus-end-out microtubules is an essential question in neuronal cell biology. Franze and colleagues used solid imaging and modeling approaches to provide important insights into the mechanisms controlling microtubule polarity in cultured Drosophila axons. They conclude that reduced catastrophe of the plus-end-out microtubules in the axon tip is critical for preferential plus-end-out microtubule growth and establishing the uniform microtubule polarity.

Decision letter

Editor: Kang Shen1
Reviewed by: Andreas Prokop2

In the interests of transparency, eLife publishes the most substantive revision requests and the accompanying author responses.

Decision letter after peer review:

[Editors’ note: the authors submitted for reconsideration following the decision after peer review. What follows is the decision letter after the first round of review.]

Thank you for submitting the paper "Unrestrained growth of correctly oriented microtubules instructs axonal microtubule orientation" for consideration by eLife. Your article has been reviewed by 3 peer reviewers, and the evaluation has been overseen by a Reviewing Editor and a Senior Editor. The following individual involved in review of your submission has agreed to reveal their identity: Andreas Prokop (Reviewer #1).

Comments to the Authors:

We are sorry to say that, after consultation with the reviewers, we have decided that this work will not be considered further for publication by eLife.

While all the reviewers found the proposed concepts and the model interesting and potentially a good addition to the field, two out of three reviewers thought that the experimental part of the manuscript is too preliminary and the model requires more experiments to be properly tested. Such additional experiments would go beyond the scope of what we normally ask for in an eLife revision, and therefore, we return the paper to you. However, if you would able to thoroughly address all the reviewer comments, in particular by providing additional experimental data to strengthen your conclusions, we will be prepared to consider a new submission of this manuscript which we will try to send to the same reviewers.

Reviewer #1 (Recommendations for the authors):

In this manuscript the authors address potential mechanisms through which microtubules in developing axons gradually achieve uniform plus end-out orientation. Combining cell biological experiments and computational modelling they propose a combinatorial model in which (1) anterograde transport generates a gradient of polymerisation-promoting factors at the axon tip, thus biassing +end elongation near growth cones, (2) dynein-mediated retrograde transport removes 'wrongly' oriented microtubules, and (3) further bias is generated by directional nucleation of new microtubules in the axon shaft.

The ideas proposed in this manuscript are attractive and some of the experiments, such as the double-labelling of Eb1::GFP with Jupiter::mCherry, are exciting. The dynein-related functions provide new explanations for reported phenotypes that loss of Dhc causes polarity effects in axons. However, the conclusions are not sufficiently supported by data. More experiments should have been provided to support claims, especially when considering that the fly neurons used are highly amenable to efficient experimentation. Key experiments would have been to use loss of dynein heavy chain to confirm the p150 link to retrograde transport in this context, to use loss of Grip/augmin proteins (http://www.ncbi.nlm.nih.gov/pubmed/23132930) to test the importance of directional nucleation in the axon shaft, and direct tests of the intensities of polymerisation-relevant proteins (e.g. Eb1 or Msps; https://doi.org/10.1371/journal.pgen.1009647) which would be expected to be weaker in proximal than distal axons. The use of p150 is not suitable to this end because, as the authors state, it is "mainly known for its role in the dynactin complex" (l.208); the claim "we here found that an enrichment of microtubule growth-promoting proteins at the advancing axon tip leads to a transition of microtubule growth from a bounded to an unbounded state" (l.193) is therefore not supported by the data. Also, in their model dynein is mainly suggested to be involved in retrograde transport of minus end-out microtubules not in polymerisation. As a further possibility to support the key claim, velocity of Eb1 comets could have been provided as another measure of polymerisation efficiency that relates to amounts of Eb1 at plus ends (https://doi.org/10.7554/eLife.51992). Finally, the manuscript has not made clear to me why retrograde polymerisation events in certain axon segments are shorter than anterograde events based on the model provided; the authors should have given some potential explanations. Can they exclude that these are minus end polymerisation events which get increasingly toned down through minus end stabilisation? These points would need to be discussed.

l.37. 'RNAs, proteins and organelles'.

l.42-45: slightly confusing; rearrange and assign references clearly.

l.49: MT symmetry is not an ideal term and misleading; 'mixed orientation' might be clearer?

l.57ff. dynein has been shown to affect axonal polarity (https://doi.org/10.1038/ncb1777), and the pioneer work by Peter Baas and colleagues to explain such a phenomenon should be mentioned here.

l.57ff. A further polarity factor is Shot: http://doi.org/10.1242/dev.00319 further discussed here: http://doi.org/10.1016/j.semcdb.2017.05.019

End of Intro: It would be great to have a concluding sentence that leads over to the results.

l.68: Stepanova used EB3; it might be better to cite (one of) the first Drosophila papers using Eb1 in culture and also providing info on directionality: https://doi.org/10.1002/dneu.20762

l.72: since the assumption is that Eb1 comets mark only +ends, it would be better to rename '-end out' into '+end in' which would be easier to grasp.

l.71ff. the idea of minus end polymerisation cannot be excluded and needs to be incorporated into the thinking. What if minus ends become more stable over time? Furthermore, polymerisation velocity is a function of Eb1 amounts (https://doi.org/10.7554/eLife.51992, https://doi.org/10.1371/journal.pgen.1009647) and has not been considered.

l.79: you mean density not lifetime here?

l.81: replace 'growth' by 'polymerisation' and reserve 'growth' for axon growth?

l.83ff. This statement requires data that plot lifetime as a function of directionality and age, which is not provided; Figure 1H needs to be cited but, only provides positional correlation.

l.106: 'catastrophe or pause events'.

l.106ff/Figure 2: beautiful experiment. It would be helpful to see polymerisation as well as shrinkage plotted for + end-out and -in MTs, rather than one integrated plot in E.

l.133: also have a look at https://doi.org/10.1371/journal.pgen.1009647 for relevant factors.

l.138ff. The localisation of p150 is not what I would expect of dynein in axons; since p150 is a CAP-Gly protein that can track + tips (https://doi.org/10.1038/nrm2369), I wonder whether the dots along the axon are at polymerising plus ends? Where is that prominent accumulation of p150 localised in GCs relative to MTs? It reminds of similar accumulations seen for CLIP170/190 (https://doi.org/10.1091/mbc.E14-06-108). Higher resolution images would be very important here.

l.141: Based on what property of p150 do you build the model and make the claim that it should influence MT orientation? I cannot follow your reasoning here. Is this a dynein-related function? I assume so when considering the model proposed below. If so, independent experiments with loss of dynein heavy chain would be very important.

l.174: Here it would be easy to validate your computational findings with real experimental data using Grip/augmin genes for which adequate tools are available (http://www.ncbi.nlm.nih.gov/pubmed/23132930).

l.189: see this review of mechanisms regulating MT polymerisation: http://doi.org/10.1016/j.brainresbull.2016.08.006

l.208ff.: the link to dynein should have been explored experimentally.

l.240: here the work by Peter Baas should be cited who was (one of) the first to propose the idea of selective minus end-out MT transport as a mechanism to maintain polarity.

l.488: remove Viki Allan as last author.

Reviewer #2 (Recommendations for the authors):

This manuscript explores how microtubule orientation in axons transitions from slightly biased towards plus-end out to almost completely plus-end out. By measuring microtubule growth episodes in axons of cultured fly neurons, the authors demonstrate that growth events are longer near the axon tip. The authors then hypothesized that these longer events might tip the balance from bounded growth to unbounded growth, which would explain why axonal microtubules become increasingly oriented plus-end out as the axon develops further and grows longer. To test this, the authors measured shrinkage lengths and demonstrate that growth indeed only exceeds shrinkage in the case of plus-end out growing microtubules near the axon tip. Consistently, after changing the balance between growth and shrinkage using nocodazole axons no longer became exclusively plus-end out.

The authors then searched for factors that could promote microtubule growth near axon tips. They focused on p150, a microtubule binder that is enriched at the axon tip, and found that experimental manipulations of p150 resulted in altered microtubule orientations. Finally, the authors developed a numerical simulations that examine how various microtubule orienting and sorting approaches (i.e. templated nucleation, motor-based sliding and tip-promoted growth) can result in uniform microtubule orientations along the axonal length.

The key innovation in this manuscript is the careful measurement of both microtubule growth and shrinkages event in cultured fly axons. Through this, the authors could conclude that plus-end out oriented microtubules close to the axon tip are in the unbounded growth regime, whereas other microtubules are not. This selective advantage will ensure an increasingly uniform orientation as the axon growth longer. This is an interesting and important insight into the establishment of oriented microtubule arrays. Although the exact mechanism of this local growth promotion awaits further exploration, the author's proposal that tip-enriched microtubule regulators could establish this provides interesting leads for further research.

Comments:

– In Supplementary Figure 4, the authors fit their growth data to a model that included the experimentally observed distribution of p150. It should be emphasized that they added two free fitting parameters to achieve this (A and \α), which, by their definition as amplitude and power, should be able to stretch any exponential decay function into another. It would be helpful if the authors could also report the values of A and \α that were found in the fitting procedure. This could give more insights into the estimated spatial range of p150 activity in comparison to its distribution. Furthermore, it would be nice if the authors could explain how they think that p150 mediates growth enhancement while being tip localized. Do they think p150 is anchored or soluble? If anchored, how can it promote growth?

– The choice to focus on p150 is somewhat enigmatic and could be better introduced. The Mouhamiam paper cited focused on a role from p150 in transport initiation. The fact that p150 disruption or kinesin-1 knockdown result in altered microtubule organization does not provide direct support for their model, given the direct roles of dynein and kinesin-1 in microtubule organization through sliding that have been proposed. The authors discuss these points in the discussion, but it would be nice if they could elaborate a bit on how they think p150 promotes microtubule growth at the axon tip.

– It is unclear how the authors model the interaction between microtubules and the plasma membrane. Often microtubules that grow against a barrier undergo catastrophes and that would counteract the promoted growth of plus-end out oriented microtubules. The methods section has a statement about forces at the ends of the axon, but this point was not entirely clear and should be discussed.

– The discussion on TRIM46 appears inaccurate in several places. For example, as far as I know there is no evidence TRIM46 is locally synthesized at axon tips, as suggested in line 136. Furthermore, TRIM46 likely plays a role in a fourth mechanism contributing to uniform polarity, namely the selective stabilization of properly oriented microtubules through selective parallel bundling. This would need to be discussed.

– In principle, the finite pool of tubulin dimers could also help in diluting out the minus-end out oriented microtubules if the growth of plus-end out microtubules is specifically promoted. Modeling this would be a new effort, but the authors could at least discuss this.Reviewer #3 (Recommendations for the authors):

Summary

Jacobs et al. explore the question of how axons develop a nearly uniform array of microtubules (MTs) that point with their plus ends towards the growth cone during development. Using experimental analysis of Drosophila CNS larval neurons grown in vitro, they document that, like N2A and Xenopus neurons, there is a higher density of Eb1 approaching the growth cone. Additionally, they report that along axons, MTs that point with their plus ends toward the growth cone have a longer growth length than MTs points to the cell body. Using Jupiter-mcherry to track MT growth and shrinkage, they find the average length of shrinkage is 2.2 μm and use this as input, along with the growth lengths, in a mathematical model that estimates average MT length based on these parameters. To test the model, neurons are treated with nocodazole and a high concentration of NaCl to perturb microtubule assembly and cellular osmolarity. Both treatments lead to a significant decrease in the growth length of MTs and a decrease in the percentage of MTs pointing towards the growth cone. Building on the prior observation that p150glued promotes MT assembly in neurons, they confirm a gradient in p150 localization along axons and that p150-RNAi decreases the concentration of p150 in growth cones. Analyzing the effects on MT assembly, they report that reducing p150 levels leads to decreases in microtubule growth length and organization. Using the experimental data, they create what they call an unbound growth model. The core idea is that MTs that grow longer distances than they shrink will have lengths that approach infinity over time, i.e., growth is unbounded. In contrast, MTs that shrink more than the growth distance (but never wholly depolarize) will have a finite length (i.e., bounded growth). Bringing these experimental observations together with prior models describing how uniform arrays of MTs are generated in axons, they construct a computational model. The model suggests that combining the effects of dynein mediated MT sliding, unbounded growth, and augmin based MT templating leads to highly organized arrays of MT where MTs along the length of the axon essentially all point towards the growth cone.

Major strengths and weaknesses:

The major strength of the manuscript is consideration of how differences in MT assembly as function of position along the axon and MT orientation might contribute to the generation of a uniform array of MTs in the axon.

There are three main weaknesses. The first is whether ‘unbounded’ MT growth occurs in axons needs to be clarified. The second is whether the difference in MT assembly as a function of orientation is ‘real’ or an artifact. And finally, the modelling seems to set up MT sliding as a strawman to make a case for the importance of differential MT assembly. Nonetheless, I think these points can be addressed by reanalyzing data, extending the modelling analysis, and a more careful discussion of the results.

Appraisal of work

A significant point of the manuscript is that MTs oriented with their plus ends towards the growth cone in the last ten microns of the axon undergo ‘unbounded’ growth because the distance they polymerize is greater than the distance they depolymerize. In contrast, MTs in the axon and those pointing to the cell body have bounded growth because the reverse occurs. Nonetheless, the data indicates the length of MT shrinkage is greater than MT growth in all cases. If MTs only undergo bounded growth, please rewrite sections of the manuscript that suggest otherwise. Alternatively, explain how unbound growth might be occurring in the context of the model.

There is a concern that the difference in MT growth length as a function of MT orientation may be an artifact of how growth length was measured. To start, it is assumed that MT growth increases toward the growth cone. Thus, one would expect some difference, be it large or small, in MT growth across a ten-micron section (i.e., the distance assessed in the experiments). In general, I would assume that MTs growing towards the growth cone will tend to have their plus ends, on average, in the front half of the ten-micron section, and MTs growing towards the cell body will have the opposite distribution. This raises the concern that the growth rate of MTs going opposite directions may be a function where the MTs plus ends are located, on average, in the ten-micron section; instead of their orientation. This concern could be addressed by systematically reducing the bin size to determine if the difference in growth length disappears or converges to some finite non-zero value as the bin size becomes small. If there are other ways to address this, please do so.

Some may view the modelling of the effects on MT sliding as presenting a strawman argument to claim that MT sliding is insufficient to explain the clearance of MTs pointing +end towards the cell body. To clarify, the computational model is founded on a simulation where MT sliding contributes to the attainment of a uniform MT distribution along the axon. With the model as presented, the parameters for MTs directed towards the cell body at the axon/cell body boundary have been set such that these MTs accumulate in the axon instead of moving into the cell body. Based on a prior manuscript, one would expect that a minor adjustment to one parameter describing the behavior at the boundary will lead to a situation where MT sliding generates axonal arrays of MT that point almost uniformly towards the growth cone. Thus, it seems artificial to suggest the sliding model fails, and ‘unbounded growth’ is needed to generate a uniform array of MTs. On this point, the modelling section would be improved if the effects of each aspect (i.e., ‘unbounded growth,’ MT templating, and MT sliding) were first addressed separately and then combined into a unified model.

[Editors’ note: further revisions were suggested prior to acceptance, as described below.]

Thank you for resubmitting your work entitled “Unrestrained growth of correctly oriented microtubules instructs axonal microtubule orientation” for further consideration by eLife. Your revised article has been evaluated by Anna Akhmanova (Senior Editor) and a Reviewing Editor.

The manuscript has been improved but there are some remaining issues that need to be addressed, as outlined below. We encourage you to consider these points when you submit a revised manuscript. The editors will make decisions about your revised manuscript without sending it back to the reviewers.

Reviewer #1 (Recommendations for the authors):

The paper has now become much clearer, and the change in terminology has had a huge impact on getting the point across. I strongly recommend its publication.

I read the manuscript very carefully and have a number of comments to strengthen the final publication and avoid unnecessary criticism. All aspects concern changes to the text, and only my comment on l.160 (Noc, osmo+) might trigger the addition of some data which might be readily available anyway.

Detailed comments:

Abstract: in my view, the abstract could be simplified along the lines of “we found that anterogradely polymerising MTs prevail through a mechanism that protects their +ends from catastrophes whereas retrograde MTs are unprotected and show limited growth.” Then the p150-dependent mechanisms could be explained. Also, it would be good to name the three mechanisms that constitute the final model.

l. 45: Can we say that the minus end is stabilised? If anchored to γ-tub this might be true, but minus ends of most axonal MTs regulated by CAMSAP-katanin seem to be in a dynamic steady-state (http://doi.org/10.1016/j.devcel.2014.01.001 and http://doi.org/10.1016/j.str.2017.12.017)

l.71/73: format error of references.

l.93: is growth necessarily ended through catastrophe? I envisage pauses that turn into plus end stabilisation through, for example, CLASP (http://doi.org/10.1101/gad.17015911) – see further comments below.

l.101-103.: Just a thought: throughout the manuscript, it might be better to spell out plus end and minus end? the symbols are easily missed, and the minus looks sometimes like a hyphen. In general the +end out/-end out nomenclature is confusing: in the example in lines 101/2 you leave open as to whether you speak about plus or minus end polymerisation in the case of minus end out MTs. In line 103 it is not clear whether you speak of retrograde plus tips within the 10micron distal stretch. -- It might help to come up with a clearer nomenclature. Suggestion: "plus ends of anterograde MTs added significantly more …. than plus ends of retrograde MTs." The term antero/retrograde orientation of MTs is currently not used, but could be introduced here to make description of this phenomenon easier in the future. If not happy with this solution speak at least of plus end-in/out rather than minus end-out and plus end-out. In Figure 1, this could also be clarified by drawing blue/red arrows into the axon. Note that Figure 1L should be changed to 1K.

l.108. capitalise Drosophila.

l.112: add our recent paper showing the Eb1 amount/velocity correlation also in axons (https://doi.org/10.1371/journal.pgen.1009647)

l.113. In figure 1 you cannot yet speak about catastrophe rates, since you do not know whether MTs pause or depolymerise. You can only speak about the length of polymerisation bouts. This is different from Figure 2 onwards. If in experiments underpinning Figure 2 you never see pauses, this would be an argument to 'assume' that catastrophe is causing termination of polymerisation.

p.7/8: for the non-mathematical trained reader it might be helpful to define the un-/bounded terms a bit better. I understand the principal idea but wonder why you set the boundary between un-/bounded at 2 micron which looks a bit arbitrary/artificial unless there is a mathematical rationale. Is it necessary to introduce the un-/bounded terms? Can one not simply speak of smaller/larger average distance of polymerisation?

l.137: … in axons of larval primary neurons?

l.148: Does "any MT further away from the tip" refer to both antero- and retrograde MTs? This would mean that the statements "a higher chance of survival for +end out MTs" in line 150 would have to add "within 10 micron distance from the tip"

l.160. In my naive non-mathematician view, the interpretation of the experiment with Noc and osmo+ only makes sense if the effect is stronger on anterograde than on retrograde. Are there no/negligible effects on retrograde MTs? No data are shown for retrograde MTs.

l.173: please, differentiate the molecular function through which stabilisation is achieved: p150 is an anti-collapse factor, CRMP a promoter of polymerisation and TRIM46 a MT cross-linker. Why tubulin heterodimers are mentioned here is not clear to me, and TRIM46 is enriched at the AIS rather than axon tip, but it has been shown to promote polarity (see also my comments on line 234).

l.182: fly neurons in culture rarely display dendrites, and larval cultures usually fail to differentiate into synaptic maturity (see section 4.1 in http://dx.doi.org/10.1007/978-1-61779-830-6_10), which would have to be checked with synaptic markers in your culture system. From the simplicity of the projection, I doubt that the side branch shown is a dendrite, which would also be expected to arise from the cell body (https://doi.org/10.1016/j.ydbio.2005.09.026). Furthermore, it is well-established that MTs in invertebrate dendrites are almost completely plus end-in (Melissa Rolls' reviews). Overall, I do not think that the dendrite aspect is important for your manuscript and should better be left out?

l.187. You would have to specify that your prediction concerns vertebrate dendrites, whereas Drosophila dendrites have polar MTs in their majority/all pointing towards the cell body (Melissa Rolls' reviews)

l.200. Did you do fly or larval cultures? heterozygous mutant Drosophila larvae?

l.232: please, briefly provide the key parameters on which the 2020 model is built: was it bases on MT sliding? Please, also refer to the model by Rao et al. (https://doi.org/10.1016/j.celrep.2017.05.064) highlighting potential deviations (might be an issue also for the discussion)

l.234ff. The van Beuningen reference is inadequate here since their model is more based on AIS-dependent functions of TRIM46 through unknown mechanisms potentially involving selective transport. The better reference might be Rao et al. (https://doi.org/10.1016/j.celrep.2017.05.064) who propose directional stabilisation of polar MTs through TRIM46 versus unhindered retrograde transport.

To my knowledge the closest fly homologue to TRIM46 is TRIM9 (although not convincingly close) which stabilises polymerisation in an orientation-dependent fashion in fly dendrites (https://doi.org/10.1242/jcs.258437) – also present in sensory axons (https://doi.org/10.1016/j.jcg.2010.12.004)

l.243/245: correct to 'catastrophe-inhibiting protein'

l.291: as pointed out earlier, TRIM46 is enriched proximally, and there is, to my knowledge, no obvious bias for distal Eb1 enrichment apart from the fact that there might be more polymerisation events in growth cones. Better examples would be Tau which has long been known to enrich distally.

l.293. As argued earlier, the dendrite data are very shaky and should better be taken out.

Discussion: a summary image illustrating the various mechanism and how they contribute would be very helpful to reach a wider audience.

Reviewer #2 (Recommendations for the authors):

The revised manuscript by Jacobs et al., entitled "Unrestrained growth of correctly oriented microtubules instructs axonal microtubule orientation" is improved, yet important concerns remain.

The main point of the manuscript is to understand how axons acquire a uniform MT orientation. From the title and abstract, the main conclusion would appear to be that unrestrained MT growth plays a vital role in this process. Nonetheless, the modeling in the current version of the manuscript suggests that unbounded growth makes a minor contribution to the establishment of axonal MT polarity (e.g., Sup Figure 8C). This disconnect between what is claimed (e.g., "we confirmed that the enhanced growth of +end out microtubules is critical for achieving uniform microtubule orientation.") and what is demonstrated by the experimental data and modeling is problematic. Additionally, the manipulations used to perturb MT dynamics (i.e., p150, kinesin, and nocodazole) are also known to alter dynein activity. Since it is well accepted that dynein plays a role in establishing MT orientation, much of the data can be viewed as confirmation that dynein is essential for establishing axonal microtubule orientation.

The following paragraphs summarize the main findings in the manuscript, point out issues with the current version, and suggest approaches the authors could consider in terms of aligning the data and modeling to improve the manuscript.

The key experimental findings and issues are:

1. +end out microtubules are less likely to undergo catastrophe near the advancing axon tip, leading to unbounded MT growth.

The critical issue here is that the modeling, as it stands, suggests unbounded growth is not very important for establishing a uniform microtubule array. Thus, while this is an interesting result, its importance for establishing MT orientation is unclear.

2. Decreasing MT growth with NOC or osm+ disrupts MT orientation

While this could be interpreted to mean that modulating MT dynamics alters MT orientation, because nocodazole is known to disrupt dynein, the effect of nocodazole on MT orientation could be occurring through a change in dynein activity rather than a change in MT assembly.

3. Disrupting p150 function reduces MT growth (dg um/cycle) in the last 10 μm of the axon and reduces MT orientation.

As noted in the previous review, p150 influences dynein activity. Thus, the effects on MT orientation could be occurring through a change in dynein activity rather than MT dynamics.

4. Disruption of dynein disrupts MT orientation, decreases MT growth (i.e., dg) in the last ten microns of the axon, but increases dg along the axon.

The observation that disruption of dynein alters MT dynamics is interesting. Still, the observation that dg decreases near the growth cone and rises along the axon makes it challenging to interpret the results.

5. Disruption of kinesin (khc-RNAi) reduces p150 levels in the growth cone, disrupts MT orientation, decreases MT growth (i.e., dg) in the last ten microns of the axon, but increases MT growth along the axon.

Disruption of khc is known to disrupt dynein function in Drosophila neurons (Pilling et al., 2006, paper out of Saxton's lab). While the effects may be occurring by reducing p150 levels in the growth cone, a more straightforward explanation is that the disruption in MT orientation is occurring because disruption of kinesin disrupts dynein. Additionally, the decrease in dg near the growth cone and increase in dg along the axon is hard to interpret (Sup Figure 7F).

6. Based on these observations and previous studies, the manuscript proposes a model for how axons achieve a uniform MT orientation. The modeling suggests that unbounded MT assembly works with MT sliding and templating to establish a uniform MT array.

There are multiple issues with the modeling. The first is that the extent of rapid Stop and Go MT sliding in the experimental data set is not analyzed. From studies in Xenopus neurons from Popov's group (Ma et al., 2004 Cur Bio) and fly neurons (Gelfand's group) rapid sliding of MTs is exceedingly rare after neurite initiation. Based on this data, it seems likely that if the velocity distribution of comet motion were examined, essentially none of the comets would be moving at the rate of dynein/kinesin motors (i.e., ~ 1 um/sec). In turn, it follows a careful analysis of the Jupiter mcherry data might reveal that only tiny fraction, if any, of the MTs move via rapid MT sliding. I would suggest carefully looking at the experimental data and updating the model so it accurately reflects the observed extent of MT sliding.

Sup Figure 8C suggests that unbounded MT growth alone does not contribute to microtubule orientation. Comparison of 8A, 8C, and 8E suggests unbounded growth modestly increases MT orientation in the proximal axon when sliding is included in the model. If one takes the model's output at face value, the verbal arguments in the manuscript claiming unbounded growth is essential for establishing MT orientation are undermined. I would suggest either accepting that the model indicates unbounded growth is relatively unimportant for establishing MT orientation or rethinking the model.

It's unclear why augmin is given such a prominent role in the model and the discussion. I found this distracting.

In conclusion, there are two significant issues. The first is that manipulations designed to alter MT dynamics, either directly or by reducing the localization of p150 to the growth cone (i.e., p150, noc, kinesin), also disrupt dynein, which is well established in being essential for establishing MT orientation. As a result, the experimental data do not appear to show a definitive role for MT dynamics separate from dynein activity. The second is that the modeling suggests MT dynamics make a relatively minor contribution towards establishing MT orientation. In light of this, approaches that could be used to strengthen the manuscript would be to conduct experiments that more directly demonstrate the importance of MT dynamics in this process and to revise the model as outlined above.

Reviewer #3 (Recommendations for the authors):

The authors have made additional efforts to address the comments raised by the reviewers, which has led to various improvements of their manuscript.

In Supplemental Figure 5, the authors now report the fitted values and found a value for \α of 3.62. Given that d_g(x)=A*p150(x)^\α, this indicates that the gradient of microtubule behavior has a 4x steeper spatial decay than the gradient of p150. This could be the case, but it is not apparent from the stainings and profile plots of p150 they show in Figure 4C and S7. Based on Supplementary Figure 2, it seems that the p150 gradient is actually steeper. Furthermore, I had hoped that the authors would have added some reflection on how a gradient of p150 can result in a gradient of MT dynamics with a 4-fold different length scale. To me this is not entirely evident, but it could be due to a non-linear response of MT dynamics to p150 concentration.

Unfortunately, the authors didn't try to address the dynamics of p150 to assess to which extent was diffuse versus anchored (e.g. using FRAP), and therefore the exact interplay between p150 and MTs at the axon tip remains unclear. Nonetheless, the manuscript does provide a more coarser insight into how uniform MT arrays could be established by local modulation of MT dynamics.

eLife. 2022 Oct 10;11:e77608. doi: 10.7554/eLife.77608.sa2

Author response


[Editors’ note: the authors resubmitted a revised version of the paper for consideration. What follows is the authors’ response to the first round of review.]

Reviewer #1 (Recommendations for the authors):

In this manuscript the authors address potential mechanisms through which microtubules in developing axons gradually achieve uniform plus end-out orientation. Combining cell biological experiments and computational modelling they propose a combinatorial model in which (1) anterograde transport generates a gradient of polymerisation-promoting factors at the axon tip, thus biassing +end elongation near growth cones, (2) dynein-mediated retrograde transport removes 'wrongly' oriented microtubules, and (3) further bias is generated by directional nucleation of new microtubules in the axon shaft.

The ideas proposed in this manuscript are attractive and some of the experiments, such as the double-labelling of Eb1::GFP with Jupiter::mCherry, are exciting. The dynein-related functions provide new explanations for reported phenotypes that loss of Dhc causes polarity effects in axons.

We would like to thank the reviewer for this positive assessment of our study.

However, the conclusions are not sufficiently supported by data. More experiments should have been provided to support claims, especially when considering that the fly neurons used are highly amenable to efficient experimentation. Key experiments would have been to use loss of dynein heavy chain to confirm the p150 link to retrograde transport in this context.

We added new experimental results on dynein downregulation in Figure S6 as suggested by the reviewer, highlighting similarities between p150 and dynein downregulation.

To use loss of Grip/augmin proteins (http://www.ncbi.nlm.nih.gov/pubmed/23132930) to test the importance of directional nucleation in the axon shaft.

While we agree with the reviewer that this is an interesting experiment, we would like to refer to recent studies investigating the role of augmin in regulating microtubule orientation (Nguyen et al., 2014; Sánchez-Huertas et al., 2016). We have added more detailed information about these experiments to the revised version of our manuscript (l.57ff).

And direct tests of the intensities of polymerisation-relevant proteins (e.g. Eb1 or Msps; https://doi.org/10.1371/journal.pgen.1009647) which would be expected to be weaker in proximal than distal axons.

In the revised manuscript, we directly measured the intensity of EB1-GFP fluorescence as a function of position within the axon. In contrast to the reviewer’s expectation, EB1-GFP fluorescence is slightly lower at the axon tip (i.e., distally) compared to the rest of the axon (data shown in the new Figure S1E). Additionally, we would like to highlight that microtubule growth speeds were uniform along the axon, while catastrophe frequencies decreased towards the axon tip (new Figure S1A-C), indicating that catastrophe but not polymerisation is affected by protein gradients at the axon tip.

The use of p150 is not suitable to this end because, as the authors state, it is "mainly known for its role in the dynactin complex" (l.208); the claim "we here found that an enrichment of microtubule growth-promoting proteins at the advancing axon tip leads to a transition of microtubule growth from a bounded to an unbounded state" (l.193) is therefore not supported by the data.

In the revised manuscript, we directly measured the intensity of EB1-GFP fluorescence as a function of position within the axon. In contrast to the reviewer’s expectation, EB1-GFP fluorescence is slightly lower at the axon tip (i.e., distally) compared to the rest of the axon (data shown in the new Figure S1E). Additionally, we would like to highlight that microtubule growth speeds were uniform along the axon, while catastrophe frequencies decreased towards the axon tip (new Figure S1A-C), indicating that catastrophe but not polymerisation is affected by protein gradients at the axon tip.

Also, in their model dynein is mainly suggested to be involved in retrograde transport of minus end-out microtubules not in polymerisation.

We agree that dynein is mostly involved in microtubule sliding and not in MT polymerisation. However, we here focused on dynactin rather on dynein, which contains p150. As stated above, p150 is a microtubule anti-catastrophe factor independently of the dynactin complex. Of course, dynactin may also bind to dynein. As shown in the new figure S6, dynein downregulation affects MT catastrophe rates (and microtubule orientation) as well, likely at least partly due to its interactions with dynactin.

As a further possibility to support the key claim, velocity of Eb1 comets could have been provided as another measure of polymerisation efficiency that relates to amounts of Eb1 at plus ends (https://doi.org/10.7554/eLife.51992).

We added Eb1 velocities to Figures S1, S3, S4, S6, and S7 as suggested by the reviewer. As shown in these figures, MT polymerisation velocities are constant along the axon. We would like to emphasize that we did not mean to state that MT polymerisation changes along the axon. Instead, catastrophe rates are affected, which then leads to increases in the average microtubule growth lengths per growth cycle.

Finally, the manuscript has not made clear to me why retrograde polymerisation events in certain axon segments are shorter than anterograde events based on the model provided; the authors should have given some potential explanations. Can they exclude that these are minus end polymerisation events which get increasingly toned down through minus end stabilisation? These points would need to be discussed.

A microtubule that grows towards a gradient of microtubule growth promoting protein / anti catastrophe factor will grow longer than a microtubule that grows away from that gradient. We demonstrated this by calculating the differences in microtubule growth lengths per cycle for +end out and -end out microtubules in a growth promoting protein gradient as shown in Figure S5 of the original manuscript. The calculation showed that the observed gradient is steep enough to induce different growth behaviours for +end out and -end out microtubules.

While we cannot fully exclude -end polymerisation events, we would like to point out that microtubule -end polymerisation is several orders of magnitude slower than +end polymerisation (Strothman et al., 2019). Our data shows that both cell body-directed and axon tip-directed polymerisation events exhibit similar speeds along the axon, strongly suggesting that all polymerisation events observed are +end polymerisation events (new Figure S1c). To address this point, we now explain our simulation in more detail, and we discuss end polymerisation (l.434ff)

l.37. 'RNAs, proteins and organelles'.

Changed as suggested.

l.42-45: slightly confusing; rearrange and assign references clearly.

Rearranged and added references to first sentence of paragraph.

l.49: MT symmetry is not an ideal term and misleading; 'mixed orientation' might be clearer?

Changed as suggested.

l.57ff. dynein has been shown to affect axonal polarity (https://doi.org/10.1038/ncb1777), and the pioneer work by Peter Baas and colleagues to explain such a phenomenon should be mentioned here.

We had already mentioned the effect of dynein on axonal polarity at the end of the paragraph in the original manuscript and cited Peter Baas. We now cite the reference earlier for clarity (l.65).

l.57ff. A further polarity factor is Shot: http://doi.org/10.1242/dev.00319 further discussed here: http://doi.org/10.1016/j.semcdb.2017.05.019

Shot is a microtubule/actin cytoskeletal linker protein and a neuronal polarity factor, as mentioned by the reviewer. However, while neuronal polarity and microtubule orientation are certainly related, Shot has, to the best of our knowledge, not been shown to regulate microtubule orientation. Hence, we would prefer not to mention it in l.54ff of the revised manuscript, were we discuss microtubule orientation.

End of Intro: It would be great to have a concluding sentence that leads over to the results.

We changed the concluding sentence as suggested.

l.68: Stepanova used EB3; it might be better to cite (one of) the first Drosophila papers using Eb1 in culture and also providing info on directionality: https://doi.org/10.1002/dneu.20762

We thank the reviewer for the citation, which we added to the manuscript (l.89).

l.72: since the assumption is that Eb1 comets mark only +ends, it would be better to rename '-end out' into '+end in' which would be easier to grasp.

As most previous publications appear to use the expressions +end out and -end out (e.g., (Stone et al., 2008; Wang et al., 2019)), we would prefer to keep this notation.

l.71ff. the idea of minus end polymerisation cannot be excluded and needs to be incorporated into the thinking. What if minus ends become more stable over time?

-end microtubule polymerisation is much slower than +end polymerisation (Strothman et al., 2019). Thus, it is very unlikely that retrograde polymerisation events observed in our study correspond to -end polymerisation. Furthermore, MT -ends in Drosophila have been shown to be capped by Patronin (del Castillo et al., 2015), a Drosophila homologue of CAMSAP3, which has been shown to prevent polymerisation (Hendershott and Vale, 2014). It is thus unlikely that -ends polymerise much. Exploring -end stability during development is certainly an interesting avenue for further research, but it is beyond the scope of the current study.

Furthermore, polymerisation velocity is a function of Eb1 amounts (https://doi.org/10.7554/eLife.51992, https://doi.org/10.1371/journal.pgen.1009647) and has not been considered.

As we now show, polymerisation velocities are uniform along the axon (Figure S1C), and EB1 comet lengths are unchanged as well (Figure S1F), suggesting that polymerisation velocities of MTs do not contribute to the different growth behaviours of +end out and -end out microtubules observed in our study.

l.79: you mean density not lifetime here?

We are not sure which sentence the reviewer refers to. We did not use the word ‘lifetime’ anywhere in the manuscript.

l.81: replace 'growth' by 'polymerisation' and reserve 'growth' for axon growth?

We were careful to not use ‘polymerisation’ as it is often used to describe growth velocity. As this manuscript mostly uses the added length per growth cycle as a parameter, “growth” actually describes better what we want to say. We use polymerisation only when talking about polymerisation velocities. To address this concern, we rephrased some statements to be clear which parameters we refer to.

l.83ff. This statement requires data that plot lifetime as a function of directionality and age, which is not provided; Figure 1H needs to be cited but, only provides positional correlation.

We thank the reviewer for the comment and reworded the statement to indicate a positional correlation (l.104ff).

l.106: 'catastrophe or pause events'.

Done.

l.106ff/Figure 2: beautiful experiment. It would be helpful to see polymerisation as well as shrinkage plotted for + end-out and -in MTs, rather than one integrated plot in E.

We thank the reviewer for his positive assessment of this experiment, which unfortunately was a very low throughput experiment. Of all the 47 axons in which we could identify shrinkage events, only two exhibited events for -end out microtubules. In total, there were 6 events of which 5 came from a single axon. Hence, our data were statistically not robust enough to separate +end out and -end out shrinkage. However, separating the existing data on +end out and -end out growth yielded very similar ds(+end out) = 2.03 [1.80, 2.26] µm/cycle and ds(-end out) = 2.05 [0.61, 3.50] µm/cycle (medians and 95% confidence intervals), suggesting that pooling the data is reasonable.

l.133: also have a look at https://doi.org/10.1371/journal.pgen.1009647 for relevant factors.

This paper shows that XMAP215/Msps promotes microtubule polymerisation. However, to the best of our knowledge, there is no data showing an enrichment of this polymerase at axon tips. Since the paragraph the reviewer is referring to focuses on the enrichment of proteins at axon tips, we would prefer not to mention it here.

l.138ff. The localisation of p150 is not what I would expect of dynein in axons; since p150 is a CAP-Gly protein that can track + tips (https://doi.org/10.1038/nrm2369), I wonder whether the dots along the axon are at polymerising plus ends? Where is that prominent accumulation of p150 localised in GCs relative to MTs? It reminds of similar accumulations seen for CLIP170/190 (https://doi.org/10.1091/mbc.E14-06-108). Higher resolution images would be very important here.

The fixation protocol that was required to stain p150 did not conserve microtubule tips. Therefore, we were unable to perform colocalization studies. However, as the reviewer pointed out, there is substantial evidence in the literature that p150 does track +tips, and overexpression of fluorescently tagged p150 leads to similar “comet” like structures as EB1GFP overexpression.

l.141: Based on what property of p150 do you build the model and make the claim that it should influence MT orientation? I cannot follow your reasoning here. Is this a dynein-related function? I assume so when considering the model proposed below. If so, independent experiments with loss of dynein heavy chain would be very important.

This seems to be a misunderstanding. p150 is a known anti-catastrophe factor, which is why we explored it here in more detail. This function is not dynein-related (Lazarus et al., 2013). To address this important point and avoid confusion, we now explain our motivation to look at p150 in more detail in the Results part (l.167ff), we added plots of catastrophe rates to all experiments, and we extended the description of our model (l.325ff), in which gradients of microtubule anti-catastrophe factors accumulate at axon tips, thus promoting growth of +end out microtubules growing into the gradient but not of -end out microtubules growing out of the gradients.

l.174: Here it would be easy to validate your computational findings with real experimental data using Grip/augmin genes for which adequate tools are available (http://www.ncbi.nlm.nih.gov/pubmed/23132930).

The importance of augmin for uniform plus end-out orientation of MTs has already been shown in the literature (Nguyen et al., 2014; Sánchez-Huertas et al., 2016). However, how augmin contributes to MT sorting is still unclear. Our simulations suggest that, while augmin is required to establish MT polarity, neither augmin-based nucleation alone nor in conjunction with dynein-based MT sliding lead to the experimentally observed uniform MT orientation along axons. We feel that perturbing augmin expression as in the publications mentioned above would, while being easy to do, not directly test the model and thus not lead to further insights.

l.189: see this review of mechanisms regulating MT polymerisation: http://doi.org/10.1016/j.brainresbull.2016.08.006

We thank the reviewer for this review article, which we now cite in l.171.

l.208ff.: the link to dynein should have been explored experimentally.

We have added experimental perturbations of dynein as suggested. Our new data show how dynein downregulation leads to similar effects on microtubule growth as p150 downregulation, in line with our model (Figure S6).

l.240: here the work by Peter Baas should be cited who was (one of) the first to propose the idea of selective minus end-out MT transport as a mechanism to maintain polarity.

We thank the reviewer for spotting this and added the relevant reference in l.333.

l.488: remove Viki Allan as last author.

Done.

Reviewer #2 (Recommendations for the authors):

This manuscript explores how microtubule orientation in axons transitions from slightly biased towards plus-end out to almost completely plus-end out. By measuring microtubule growth episodes in axons of cultured fly neurons, the authors demonstrate that growth events are longer near the axon tip. The authors then hypothesized that these longer events might tip the balance from bounded growth to unbounded growth, which would explain why axonal microtubules become increasingly oriented plus-end out as the axon develops further and grows longer. To test this, the authors measured shrinkage lengths and demonstrate that growth indeed only exceeds shrinkage in the case of plus-end out growing microtubules near the axon tip. Consistently, after changing the balance between growth and shrinkage using nocodazole axons no longer became exclusively plus-end out.

The authors then searched for factors that could promote microtubule growth near axon tips. They focused on p150, a microtubule binder that is enriched at the axon tip, and found that experimental manipulations of p150 resulted in altered microtubule orientations. Finally, the authors developed a numerical simulations that examine how various microtubule orienting and sorting approaches (i.e. templated nucleation, motor-based sliding and tip-promoted growth) can result in uniform microtubule orientations along the axonal length.

The key innovation in this manuscript is the careful measurement of both microtubule growth and shrinkages event in cultured fly axons. Through this, the authors could conclude that plus-end out oriented microtubules close to the axon tip are in the unbounded growth regime, whereas other microtubules are not. This selective advantage will ensure an increasingly uniform orientation as the axon growth longer. This is an interesting and important insight into the establishment of oriented microtubule arrays. Although the exact mechanism of this local growth promotion awaits further exploration, the author's proposal that tip-enriched microtubule regulators could establish this provides interesting leads for further research.

We would like to thank the reviewer for this positive assessment of our study.

Comments:

– In Supplementary Figure 4, the authors fit their growth data to a model that included the experimentally observed distribution of p150. It should be emphasized that they added two free fitting parameters to achieve this (A and \α), which, by their definition as amplitude and power, should be able to stretch any exponential decay function into another. It would be helpful if the authors could also report the values of A and \α that were found in the fitting procedure. This could give more insights into the estimated spatial range of p150 activity in comparison to its distribution.

We thank the reviewer for raising this excellent point. As the reviewer pointed out, we used an exponential model which assumed that the average growth length during a given growth cycle is proportional to A*p150^α. It is important to highlight that we simultaneously fitted this function to both the microtubules growing away from the cell body and those growing towards it. Hence, we found a single pair of A = 0.9 and α = 3.6 which led to similar differences in MT growth as observed experimentally. This was only possible because the experimentally observed p150 gradient was strong enough to lead to differences in the average growth length of a microtubule. We added this discussion and the values to the legend of Figure S5 of the revised manuscript.

Furthermore, it would be nice if the authors could explain how they think that p150 mediates growth enhancement while being tip localized. Do they think p150 is anchored or soluble? If anchored, how can it promote growth?

As explained above and in much more detail in the revised manuscript, p150 mediates MT growth enhancement through decreasing catastrophe rates. The mechanism by which p150 promotes growth is subject of ongoing research, and at this point we can only speculate whether p150 is soluble or anchored. Previous work assumed p150 to be soluble and suggested that it uses its CAP-Gly domains to hold tubulin subunits in close vicinity of each other, thus making the growing microtubule tip more stable and preventing catastrophes (Lazarus et al., 2013).

– The choice to focus on p150 is somewhat enigmatic and could be better introduced. The Mouhamiam paper cited focused on a role from p150 in transport initiation. The fact that p150 disruption or kinesin-1 knockdown result in altered microtubule organization does not provide direct support for their model, given the direct roles of dynein and kinesin-1 in microtubule organization through sliding that have been proposed. The authors discuss these points in the discussion, but it would be nice if they could elaborate a bit on how they think p150 promotes microtubule growth at the axon tip.

As mentioned in our response to reviewer 1, p150 is a known microtubule anti-catastrophe factor, which is why we explored it here in more detail. This function is not dynein-related (Lazarus et al., 2013). To address this important point, we now explain our motivation to look at p150 in more detail in the Results part (l.167ff), we show plots of catastrophe rates for all experiments, and we extended the description of our model, in which gradients of microtubule anti-catastrophe factors accumulate at axon tips, thus promoting growth of +end out microtubules growing into the gradient but not of -end out microtubules growing out of the gradients.

– It is unclear how the authors model the interaction between microtubules and the plasma membrane. Often microtubules that grow against a barrier undergo catastrophes and that would counteract the promoted growth of plus-end out oriented microtubules. The methods section has a statement about forces at the ends of the axon, but this point was not entirely clear and should be discussed.

Elegant work by Marileen Dogterom and others has shown that, in vitro, catastrophe frequencies are increased when MTs polymerize into an obstacle. We see a similar effect in Drosophila neurons. As shown in Author response image 1, MTs do exhibit decreased growth lengths and increased catastrophe frequencies in the very distal region of the axon when growing into the tip (which is counter-balanced by higher concentrations of anti-catastrophe factors such as p150). We did not explicitly model the interaction between MTs and the plasma membrane, which results in higher catastrophe rates for MTs at the tip. However, since our simulation directly utilises the experimentally measured growth lengths, we indirectly account for decreased growth into the tip.

Author response image 1. Growth length per cycle and catastrophe frequency vs distance from axon tip.

Author response image 1.

Here we replotted the data shown in SFigure 1A-B with a bin size of 2µm instead of 10µm. Differences in dg and fg exists also at smaller bin sizes.

– The discussion on TRIM46 appears inaccurate in several places. For example, as far as I know there is no evidence TRIM46 is locally synthesized at axon tips, as suggested in line 136. Furthermore, TRIM46 likely plays a role in a fourth mechanism contributing to uniform polarity, namely the selective stabilization of properly oriented microtubules through selective parallel bundling. This would need to be discussed.

We apologise for the confusion cause by our wording. We phrased the discussion about TRIM46 more carefully now, clarified its known functions in l.59ff of the revised manuscript, and highlighted the simulation results that pertain to that function (l.334ff).

– In principle, the finite pool of tubulin dimers could also help in diluting out the minus-end out oriented microtubules if the growth of plus-end out microtubules is specifically promoted. Modeling this would be a new effort, but the authors could at least discuss this.

We thank the reviewer for this intriguing thought, which we added it to the discussion (l.329ff).

Reviewer #3 ( (Recommendations for the authors)):

[...]

There are three main weaknesses. The first is whether ‘unbounded’ MT growth occurs in axons needs to be clarified. The second is whether the difference in MT assembly as a function of orientation is ‘real’ or an artifact. And finally, the modelling seems to set up MT sliding as a strawman to make a case for the importance of differential MT assembly. Nonetheless, I think these points can be addressed by reanalyzing data, extending the modelling analysis, and a more careful discussion of the results.

We thank the reviewer for the critical reading of our manuscript and would like to refer to our detailed responses to these concerns below.

Appraisal of work

A significant point of the manuscript is that MTs oriented with their plus ends towards the growth cone in the last ten microns of the axon undergo ‘unbounded’ growth because the distance they polymerize is greater than the distance they depolymerize. In contrast, MTs in the axon and those pointing to the cell body have bounded growth because the reverse occurs. Nonetheless, the data indicates the length of MT shrinkage is greater than MT growth in all cases. If MTs only undergo bounded growth, please rewrite sections of the manuscript that suggest otherwise. Alternatively, explain how unbound growth might be occurring in the context of the model.

In the old Figure 2F the reviewer is referring to, we showed median ± lower and upper quantiles for +end out and -end out MTs. Only a fraction of +end out MTs near the growth cone entered the regime of unbounded growth. We would like to point out that, even if the median growth length is shorter than the median shrinkage length (averaged over many axons), many microtubules will still exhibit unbounded growth even though the average microtubule does not. Those are the ones that survive in the long term and give rise to the uniform MT orientation in the axon.

However, we understand how the plot we showed could be misleading. In order to avoid confusion, we now use bootstrapped median values and their 95% confidence intervals as the reviewer suggested further below and replotted our data accordingly. Our new Figure 2 is more intuitive and demonstrates more clearly that (only) +end out MT growth lies above the threshold for unbounded growth.

There is a concern that the difference in MT growth length as a function of MT orientation may be an artifact of how growth length was measured. To start, it is assumed that MT growth increases toward the growth cone. Thus, one would expect some difference, be it large or small, in MT growth across a ten-micron section (i.e., the distance assessed in the experiments). In general, I would assume that MTs growing towards the growth cone will tend to have their plus ends, on average, in the front half of the ten-micron section, and MTs growing towards the cell body will have the opposite distribution. This raises the concern that the growth rate of MTs going opposite directions may be a function where the MTs plus ends are located, on average, in the ten-micron section; instead of their orientation. This concern could be addressed by systematically reducing the bin size to determine if the difference in growth length disappears or converges to some finite non-zero value as the bin size becomes small. If there are other ways to address this, please do so.

We thank the reviewer for this insightful comment. We now added a supplementary figure that highlights the distribution of growth displacements at bin size 10 µm (Figure S1). Also, please find a plot with bin size 2 µm in Author response image 1 (bootstrapped medians +/- 95% confidence intervals). As seen in that plot, even for small bin sizes of 2 µm, oppositely oriented MTs still exhibit growth differences within 4 µm from the axon tip, making it unlikely that the observed differences in dg and fg arose solely from the location of microtubules within a bin.

Some may view the modelling of the effects on MT sliding as presenting a strawman argument to claim that MT sliding is insufficient to explain the clearance of MTs pointing +end towards the cell body. To clarify, the computational model is founded on a simulation where MT sliding contributes to the attainment of a uniform MT distribution along the axon. With the model as presented, the parameters for MTs directed towards the cell body at the axon/cell body boundary have been set such that these MTs accumulate in the axon instead of moving into the cell body. Based on a prior manuscript, one would expect that a minor adjustment to one parameter describing the behavior at the boundary will lead to a situation where MT sliding generates axonal arrays of MT that point almost uniformly towards the growth cone. Thus, it seems artificial to suggest the sliding model fails, and ‘unbounded growth’ is needed to generate a uniform array of MTs.

We thank the reviewer for giving us the opportunity to address this seeming contradiction. We now clarified where the deficiency of the “sliding only” mechanism lies and how the biased growth mechanism contributes to the establishment of uniform MT orientation along the axon. First, we added a new panel to Figure 5 (5D) showing experimental plots of the MT orientation profile along the axon as a function of developmental time. In agreement with previous literature, young axons exhibited a graded MT orientation profile, with an increasing number of -end out microtubules towards the soma. This orientation profile became flatter for axons that grew longer, and microtubules were oriented uniformly along the entire length of the axon within 24 hours.

In our simulations which included dynein-mediated sliding of MTs only, we also obtained a graded MT orientation profile with dominating -end out orientation in the proximal axon. The failure of this model was that the scaled MT orientation profile (x-axis scaled by the axon length) attained a steady–state shape in which a fixed fraction of the axon remained with mixed MT orientation. This means that the size of the proximal region with mixed MT orientation continued to increase in proportion to the length of the growing axon. The reason for this observation was that, as the axon became longer, more numerous –end-out MTs accumulated at the axon entry from across the axon. In our previous paper we have shown that one can reduce the extent of this region by applying a stronger load on the bundle or by reducing the motor connectivity to the MTs, however, we could not eliminate the mixed region entirely while preserving the ability of the axons to grow. Thus, the sliding-only mechanism failed to explain the long-term polarization of the axon.

While working on our previous manuscript, we also tried to increase the “permeability” of the boundary. However, when more MTs left the axon and disappeared, MT bundles did not grow any longer and collapsed, suggesting that some boundary is required to build up stable MT bundles. And even if there was no boundary between axon and soma, MTs would not just disappear in the soma but rather continue growing and sliding. In fact, MT bundles in Drosophila neurons tend to continue towards the other side of the cell body, which in itself presents an impenetrable boundary (Author response image 2). Either way, MTs encounter a boundary, and the location of this boundary will only determine at which side of the soma the region with mixed MT orientations starts. This region would always span a significant fraction of the proximal axon, particularly for longer axons, if sliding was the only mechanism employed to bias MT orientations.

Author response image 2. Expansion microscopy image of D. melanogaster neuron.

Author response image 2.

We stained α-tubulin (yellow) and expanded the sample ~5x. Individual microtubule bundles enter the cell body from the axon and continue to the other side, suggesting that -end out microtubules leaving the axon do not disappear but rather move until hitting a boundary at the opposite side of the soma.

The two other mechanisms incorporated in our current simulation, namely, the localized bias of MT nucleation (templating), and our newly found mechanism of biased +end MT growth at the axon tip, both significantly improved the long-term behaviour of the MT orientation profile. However, when only the templating mechanism was added, there was the “risk” that axons with an inverted (-end out) MT orientation would form if incidentally the initial fraction of –end out MTs in the axon was higher. When simulating axons with templating only (SI Figure 8B), or with sliding+templating only (SI Figure 8D), we thus occasionally obtained bundles with inverted polarity. Biased growth of +end out MTs at the tip seems crucial to prevent this situation. Finally, when combining the three mechanisms, we obtained MT orientation profiles that closely resembled our experimental data (see new Figure 5). We have added this information to our discussion of the simulation results in the main text and the supplementary information.

On this point, the modelling section would be improved if the effects of each aspect (i.e., ‘unbounded growth,’ MT templating, and MT sliding) were first addressed separately and then combined into a unified model.

The new Figure S8 now contains simulations of templating and unbounded growth alone.

[Editors’ note: what follows is the authors’ response to the second round of review.]

Reviewer #1 (Recommendations for the authors):

The paper has now become much clearer, and the change in terminology has had a huge impact on getting the point across. I strongly recommend its publication.

We thank the reviewer for this very positive evaluation of our revised manuscript.

I read the manuscript very carefully and have a number of comments to strengthen the final publication and avoid unnecessary criticism. All aspects concern changes to the text, and only my comment on l.160 (Noc, osmo+) might trigger the addition of some data which might be readily available anyway.

Detailed comments:

Abstract: in my view, the abstract could be simplified along the lines of “we found that anterogradely polymerising MTs prevail through a mechanism that protects their +ends from catastrophes whereas retrograde MTs are unprotected and show limited growth.” Then the p150-dependent mechanisms could be explained. Also, it would be good to name the three mechanisms that constitute the final model.

We changed the abstract to reflect the reviewer’s suggestions.

l. 45: Can we say that the minus end is stabilised? If anchored to γ-tub this might be true, but minus ends of most axonal MTs regulated by CAMSAP-katanin seem to be in a dynamic steady-state (http://doi.org/10.1016/j.devcel.2014.01.001 and http://doi.org/10.1016/j.str.2017.12.017)

This is a good point. Changed to: “more stable”.

l.71/73: format error of references.

We apologise for this oversight. Reference format corrected.

l.93: is growth necessarily ended through catastrophe? I envisage pauses that turn into plus end stabilisation through, for example, CLASP (http://doi.org/10.1101/gad.17015911) – see further comments below.

We added a reference to Figure 2 to this section, in which we show that most MTs indeed started shrinking after EB1-GFP disappearance, indicating that our approximation is reasonable.

l.101-103.: Just a thought: throughout the manuscript, it might be better to spell out plus end and minus end? the symbols are easily missed, and the minus looks sometimes like a hyphen. In general the +end out/-end out nomenclature is confusing: in the example in lines 101/2 you leave open as to whether you speak about plus or minus end polymerisation in the case of minus end out MTs. In line 103 it is not clear whether you speak of retrograde plus tips within the 10micron distal stretch. -- It might help to come up with a clearer nomenclature. Suggestion: "plus ends of anterograde MTs added significantly more …. than plus ends of retrograde MTs." The term antero/retrograde orientation of MTs is currently not used, but could be introduced here to make description of this phenomenon easier in the future. If not happy with this solution speak at least of plus end-in/out rather than minus end-out and plus end-out. In Figure 1, this could also be clarified by drawing blue/red arrows into the axon. Note that Figure 1L should be changed to 1K.

We thank the reviewer for this helpful suggestion. In line with other published work (Akhmanova and Steinmetz, 2019; del Castillo et al., 2015), we changed +end out to plus-end-out throughout the manuscript. Additionally, we clarified the nomenclature in lines 76ff of the revised manuscript and added arrows to Figure 1.

l.112: add our recent paper showing the Eb1 amount/velocity correlation also in axons (https://doi.org/10.1371/journal.pgen.1009647)

Done (l.114).

l.113. In figure 1 you cannot yet speak about catastrophe rates, since you do not know whether MTs pause or depolymerise. You can only speak about the length of polymerisation bouts. This is different from Figure 2 onwards. If in experiments underpinning Figure 2 you never see pauses, this would be an argument to 'assume' that catastrophe is causing termination of polymerisation.

This is a good point. We added a sentence referencing Figure 2B-D in lines l.93ff of the revised manuscript, which states that most MTs in our experiments underwent catastrophes after EB1-GFP labelled polymerisation bouts.

p.7/8: for the non-mathematical trained reader it might be helpful to define the un-/bounded terms a bit better. I understand the principal idea but wonder why you set the boundary between un-/bounded at 2 micron which looks a bit arbitrary/artificial unless there is a mathematical rationale. Is it necessary to introduce the un-/bounded terms? Can one not simply speak of smaller/larger average distance of polymerisation?

Bounded and unbounded are standard terms used to describe functions: bounded means that the endpoints of a function are finite numbers, while functions are unbounded if the endpoint goes to infinity. To make this important point clear, we added a definition to the text (lines 133ff.).

The threshold is not arbitrary/artificial but based on our experimental data. As discussed in lines 146ff of the revised manuscript, MT growth is bounded when dg<ds due to equation (1). As shown in Figure 2E, ds=2.03 µm, so that the boundary between unbounded and bounded growth lies at approximately 2 µm

l.137: … in axons of larval primary neurons?

Yes. Changed as suggested.

l.148: Does "any MT further away from the tip" refer to both antero- and retrograde MTs? This would mean that the statements "a higher chance of survival for +end out MTs" in line 150 would have to add "within 10 micron distance from the tip"

The reviewer correctly pointed out that any MT further away from the tip than 10um exhibits similar growth to minus-end-out microtubules close to the axon tip, while only plus-end-out microtubules within 10 microns from the tip have a higher chance of unbounded growth. However, this still means that, on average, +end out MTs have a higher chance of survival. Thus, we would rather keep the statement as it is.

l.160. In my naive non-mathematician view, the interpretation of the experiment with Noc and osmo+ only makes sense if the effect is stonger on anterograde than on retrograde. Are there no/negligible effects on retrograde MTs? No data are shown for retrograde MTs.

The effect of both osmo+ and Noc on +end out MTs >10um from the tip was insignificant (Figure 3D). Similarly, the effect on -end out MTs was also insignificant (see Author response image 3). Thus, it appears as if both treatments have a baseline-dependent effect on MT growth, i.e., a stronger effect on MTs that exhibit higher growth and lower catastrophe frequencies.

Author response image 3. Added MT lengths per growth cycle dg of minus-end-out MTs at the distalmost 10µm from the axon tip and further away for control (N = 107 axons from 5 biological replicates), nocodazole-treated axons (N = 116 axons from 3 biological replicates), and axons cultured in osmo+ medium (N = 30, 2 biological replicates).

Author response image 3.

No significant differences were observed (p < 0.47 Kruskal Wallis test).

l.173: please, differentiate the molecular function through which stabilisation is achieved: p150 is an anti-collapse factor, CRMP a promoter of polymerisation and TRIM46 a MT cross-linker. Why tubulin heterodimers are mentioned here is not clear to me, and TRIM46 is enriched at the AIS rather than axon tip, but it has been shown to promote polarity (see also my comments on line 234).

We added further clarification to lines 179ff to highlight the functions through which stabilisation is achieved. We previously added tubulin heterodimers to our manuscript following a suggestion by reviewer #3. We liked this suggestion and would prefer to leave the reference in the manuscript, as a surplus of free tubulin may facilitate MT growth. As noted in lines 299ff of the revised manuscript, TRIM46 has been shown to accumulate at axon tips as well (Rao et al., 2017).

l.182: fly neurons in culture rarely display dendrites, and larval cultures usually fail to differentiate into synaptic maturity (see section 4.1 in http://dx.doi.org/10.1007/978-1-61779-830-6_10), which would have to be checked with synaptic markers in your culture system. From the simplicity of the projection, I doubt that the side branch shown is a dendrite, which would also be expected to arise from the cell body (https://doi.org/10.1016/j.ydbio.2005.09.026). Furthermore, it is well-established that MTs in invertebrate dendrites are almost completely plus end-in (Melissa Rolls' reviews). Overall, I do not think that the dendrite aspect is important for your manuscript and should better be left out?

We agree with the reviewer that the minor processes exhibited by fly neurons in our cultures are likely not yet fully functional dendrites as they do not exhibit the characteristic minus-end-out MT orientation observed in mature invertebrate dendrites in vivo. This, however, is the reason why we called them dendritic processes (rather than dendrites) throughout the paper, as they resembled dendrites and exhibited non-axonal MT orientation, i.e., mixed MT orientation. We now explicitly introduce them as such in l.189ff of the revised manuscript: ‘tips of immature ‘dendritic’ processes, whose MT orientation is mixed and thus resembles that of vertebrate and immature Drosophila dendrites (Hill et al. 2012)’. We feel that the data presented for these dendritic processes support our main finding – that selective stabilisation of +end out MTs near the axon tip is crucial for the development of a uniform +end out orientation of MTs in axons – and would thus prefer to keep the data.

l.187. You would have to specify that your prediction concerns vertebrate dendrites, whereas Drosophila dendrites have polar MTs in their majority/all pointing towards the cell body (Melissa Rolls' reviews)

MTs in the dendritic processes investigated in the present study are similar to those in vertebrate dendrites (as now clarified, l.189ff). They exhibit lower growth in the periphery and mixed overall orientation, thus corroborating an important connection between MT growth and orientation, which is what we intended to show in lines 189ff.

l.200. Did you do fly or larval cultures? heterozygous mutant Drosophila larvae?

Yes, we used heterozygous mutant larval neurons. We added missing information accordingly.

l.232: please, briefly provide the key parameters on which the 2020 model is built: was it bases on MT sliding? Please, also refer to the model by Rao et al. (https://doi.org/10.1016/j.celrep.2017.05.064) highlighting potential deviations (might be an issue also for the discussion)

We added further information on our previous model in lines 247ff. To keep our manuscript comprehensible, however, we would rather not want to discuss the model in the context of other models, which we already did extensively in our 2020 paper anyway. Additionally, the paper by Rao et al. (Rao et al., 2017) does not simulate MT-MT sliding but rather MT sliding along cortically attached dynein, and it also only calculates sliding velocities but not microtubule orientation. Hence, it would be a rather inadequate comparison in this part of the manuscript and the discussion.

l.234ff. The van Beuningen reference is inadequate here since their model is more based on AIS-dependent functions of TRIM46 through unknown mechanisms potentially involving selective transport. The better reference might be Rao et al. (https://doi.org/10.1016/j.celrep.2017.05.064) who propose directional stabilisation of polar MTs through TRIM46 versus unhindered retrograde transport.

To my knowledge the closest fly homologue to TRIM46 is TRIM9 (although not convincingly close) which stabilises polymerisation in an orientation-dependent fashion in fly dendrites (https://doi.org/10.1242/jcs.258437) – also present in sensory axons (https://doi.org/10.1016/j.jcg.2010.12.004)

We thank the reviewer for this insightful comment and changed the references accordingly line 246.

l.243/245: correct to 'catastrophe-inhibiting protein'.

Done.

l.291: as pointed out earlier, TRIM46 is enriched proximally, and there is, to my knowledge, no obvious bias for distal Eb1 enrichment apart from the fact that there might be more polymerisation events in growth cones. Better examples would be Tau which has long been known to enrich distally.

As mentioned above and in the manuscript, (Rao et al., 2017) demonstrated that TRIM46 accumulates at axon tips (Figure 5A-B in the paper). Additionally, we cited two references which demonstrated that EB1-GFP is enriched at axonal tips (Ma et al., 2004; Morrison et al., 2002).

l.293. As argued earlier, the dendrite data are very shaky and should better be taken out.

We would like to reiterate that we do not think that these processes are real dendrites; we also don’t think that our data are shaky. In contrast, MTs in the dendritic processes exhibited reduced MT growth and mixed MT orientation, thus supporting our argument that MT growth is important for MT orientation.

Discussion: a summary image illustrating the various mechanism and how they contribute would be very helpful to reach a wider audience.

A summary of all discussed mechanisms is provided in Figure 5G.

Reviewer #2 (Recommendations for the authors):

The revised manuscript by Jacobs et al., entitled "Unrestrained growth of correctly oriented microtubules instructs axonal microtubule orientation" is improved, yet important concerns remain.

The main point of the manuscript is to understand how axons acquire a uniform MT orientation. From the title and abstract, the main conclusion would appear to be that unrestrained MT growth plays a vital role in this process. Nonetheless, the modeling in the current version of the manuscript suggests that unbounded growth makes a minor contribution to the establishment of axonal MT polarity (e.g., Sup Figure 8C). This disconnect between what is claimed (e.g., "we confirmed that the enhanced growth of +end out microtubules is critical for achieving uniform microtubule orientation.") and what is demonstrated by the experimental data and modeling is problematic.

Indeed, the results shown in Suppl. Figure 8C suggest that biased growth alone has a small effect on the orientation of MTs along the axon. Nevertheless, panels 8E and 8F show that, when this mechanism works in concert with dynein-mediated MT sliding and MT templating, its effect becomes significant enough to explain the gradual enrichment of the proximal axon with plus-end-out MTs, and the consequent development of a uniform MT orientation across the axon’s entire length.

This behaviour at the proximal end could not be explained by MT sliding alone (Suppl. Figure 8A) because the rate at which minus-end-out MTs accumulated in the proximal axon exceeded the rate at which these MTs got absorbed into the cell body. Both MT templating and biased growth of plus-end-out MTs at the axon tip are processes that dilute minus-end-out MTs in the axonal shaft, and thereby allow the MT array to eventually be cleared out from those minus-end-MTs by dynein-mediated sliding.

The reason for the small effect seen in Suppl. Figure 8C is that the MT growth-promoting factor is concentrated in a small region close to the axon tip, and its range of action thus diminishes in comparison to the axon length when the axon extends. That is, as the axon extends, a growing portion of its length continues to accumulate ill-oriented MTs. Sliding is therefore essential for clearing out the generated minus-end-out MTs, and this occurs much more efficiently in the presence of a bias at the growing tip that continually maintains the fraction of minus-end-out MTs small during growth.

Sliding alone, however, turns out to be insufficient for clearing the axonal shaft from accumulating ill-oriented MTs (only a graded polarity profile is formed as seen in Suppl. Figure 8A). The reason is that the longer the axon extends, the larger is the number of minus-end-out MTs generated across its length per unit time. This enlargement in the number of ill-oriented MTs is prevented by the biased MT polymerization at the axon tip. Consequently, the synergistic action of both mechanisms (or of the three mechanisms) significantly improves the resulting polarity of the axonal MT array.

Finally, we would like to note that our current simulations likely underestimate the effect of a growth promoting factor at the tip. The reason is that in our current simulations the actual polymerization dynamics of the MTs were not accounted for explicitly. Had these dynamics been taken into account, minus-end-out MTs would likely be shorter than plus-end-out ones and would thus be expelled from the axon much more quickly than they currently do. However, since appropriate modelling of the length distribution of MTs in the context of a growing axon requires many mechanisms to be accounted for (including MT polymerization / depolymerization dynamics, MT nucleation, MT severing, and the regulation of these processes by accessory proteins), we leave this challenge for a separate systematic investigation.

Additionally, the manipulations used to perturb MT dynamics (i.e., p150, kinesin, and nocodazole) are also known to alter dynein activity. Since it is well accepted that dynein plays a role in establishing MT orientation, much of the data can be viewed as confirmation that dynein is essential for establishing axonal microtubule orientation.

We respectfully disagree with the reviewer. According to literature (del Castillo et al., 2015; Rao et al., 2017), dynein contributes to microtubule orientation mostly through sliding. To the best of our knowledge, it remains unclear whether p150 is required for MT sliding, as mentioned in our discussion (see for example (Waterman-Storer et al., 1997) and (Tan et al., 2018)). Furthermore, we are not aware of any direct effect of Nocodazole on dynein-based MT sliding. In the literature, Nocodazole appears to disrupt dynein function mainly through dynein mislocalisation because of Nocodazole-mediated MT depolymerisation (Gerlitz et al., 2013). In our experiments, however, we used low Nocodazole doses and microtubules still polymerised (see Figure 3), so that it is unlikely that most of the dynein present becomes mislocalised, thus suggesting little effects on dynein function. Finally, while there might be some crosstalk between different mechanisms contributing to establishing uniform MT orientation in axons, our physical models (Figures 2 and S5) and simulations (Figures 5 and S8) clearly demonstrate a critical role of unbounded MT growth in orienting MTs – independent of the effect of dynein.

In the revised version of our manuscript, we extended the discussion of potential additional effects of our perturbations on dynein function and explain why it is a key contributor to the overall uniform axonal MT orientation (l.312ff). We furthermore extended our discussion explaining why dynein-based MT sliding is not sufficient to generate axons with uniformly oriented MTs.

The following paragraphs summarize the main findings in the manuscript, point out issues with the current version, and suggest approaches the authors could consider in terms of aligning the data and modeling to improve the manuscript.

The key experimental findings and issues are:

1. +end out microtubules are less likely to undergo catastrophe near the advancing axon tip, leading to unbounded MT growth.

The critical issue here is that the modeling, as it stands, suggests unbounded growth is not very important for establishing a uniform microtubule array. Thus, while this is an interesting result, its importance for establishing MT orientation is unclear.

We strongly disagree with the reviewer, please see our comments above. Without unbounded growth, our simulations yielded a graded distribution of MTs along the axon with minus-end-out MTs in the proximal axon, see Figure S8A. Our modelling and experimental data together demonstrate that unbounded growth of +end out MTs near the axon tip is important for achieving a uniform plus-end-out out orientation of MTs along the entire length of the axon, irrespective of the magnitude of the effect of its isolated perturbation shown in Figure S8C. We extended the discussion to clarify this very important point (l.343ff).

2. Decreasing MT growth with NOC or osm+ disrupts MT orientation

While this could be interpreted to mean that modulating MT dynamics alters MT orientation, because nocodazole is known to disrupt dynein, the effect of nocodazole on MT orientation could be occurring through a change in dynein activity rather than a change in MT assembly.

As mentioned above, we are not aware of any direct effect of Nocodazole on dynein-based MT sliding. In the literature, Nocodazole appears to disrupt dynein function mainly through dynein mislocalisation because of Nocodazole-mediated MT depolymerisation (Gerlitz et al., 2013). In our experiments, however, microtubules still polymerised (see Figure 3), so that it is unlikely that most of the dynein present becomes mislocalised. Furthermore, we are not aware of any direct effect of osmotic pressure on dynein activity. As we show a direct effect of both treatments on MT dynamics and orientation, and our modelling and simulation data strongly indicate that MT dynamics is important for achieving uniform MT orientation, our interpretation of the data seems much more plausible.

3. Disrupting p150 function reduces MT growth (dg um/cycle) in the last 10 μm of the axon and reduces MT orientation.

As noted in the previous review, p150 influences dynein activity. Thus, the effects on MT orientation could be occurring through a change in dynein activity rather than MT dynamics.

As stated above and in our manuscript, to the best of our knowledge, it remains unclear whether p150 is required for MT-MT sliding. Furthermore, we provide direct evidence that perturbations of p150 significantly impact MT polymerisation dynamics, which our modelling and simulation data show to be important for setting up the uniform MT orientation in axons.

4. Disruption of dynein disrupts MT orientation, decreases MT growth (i.e., dg) in the last ten microns of the axon, but increases dg along the axon.

The observation that disruption of dynein alters MT dynamics is interesting. Still, the observation that dg decreases near the growth cone and rises along the axon makes it challenging to interpret the results.

We agree with the reviewer that it is not straight-forward to interpret the rise of MT growth away from the axon tip. As dynein is required for the localisation of p150 to axon tips (Lazarus et al., 2013), dynein removal could lead to a more even distribution of p150 along the axon. The accompanying increase of p150 concentration away from the axon tip could potentially explain the observed increase of MT growth along the axon shaft.

5. Disruption of kinesin (khc-RNAi) reduces p150 levels in the growth cone, disrupts MT orientation, decreases MT growth (i.e., dg) in the last ten microns of the axon, but increases MT growth along the axon.

Disruption of khc is known to disrupt dynein function in Drosophila neurons (Pilling et al., 2006, paper out of Saxton's lab). While the effects may be occurring by reducing p150 levels in the growth cone, a more straightforward explanation is that the disruption in MT orientation is occurring because disruption of kinesin disrupts dynein. Additionally, the decrease in dg near the growth cone and increase in dg along the axon is hard to interpret (Sup Figure 7F).

As the reviewer pointed out, kinesin is thought to transport dynein to MT +ends. Hence, it cannot be ruled out that kinesin knockdown affects microtubule sliding, which we already acknowledged in l.322ff. However, we fail to see why this should be the only effect of kinesin knockdown. Our data strongly suggest that also its effect on p150 accumulation in the growth cone, which is required for unbounded growth of plus-end-out MTs in that region, is significantly contributing to the perturbation of overall MT orientation.

6. Based on these observations and previous studies, the manuscript proposes a model for how axons achieve a uniform MT orientation. The modeling suggests that unbounded MT assembly works with MT sliding and templating to establish a uniform MT array.

There are multiple issues with the modeling. The first is that the extent of rapid Stop and Go MT sliding in the experimental data set is not analyzed. From studies in Xenopus neurons from Popov's group (Ma et al., 2004 Cur Bio) and fly neurons (Gelfand's group) rapid sliding of MTs is exceedingly rare after neurite initiation. Based on this data, it seems likely that if the velocity distribution of comet motion were examined, essentially none of the comets would be moving at the rate of dynein/kinesin motors (i.e., ~ 1 um/sec). In turn, it follows a careful analysis of the Jupiter mcherry data might reveal that only tiny fraction, if any, of the MTs move via rapid MT sliding. I would suggest carefully looking at the experimental data and updating the model so it accurately reflects the observed extent of MT sliding.

This is an excellent point, which is in line with our data. We did not suggest that all MTs in the simulation undergo rapid transport, which, as the reviewer pointed out, has been shown to be exceedingly rare. In fact, we found no evidence of rapid movements in either the EB1-GFP data or the Jupiter mcherry data. In our simulations, most MTs moved with the growth velocity of the axon and showed zero relative velocity between themselves (as has been discussed in (Jakobs et al., 2015), see Figure 5B). This is consistent with a recent study by the Suter and Miller groups (Athamneh et al., 2017), which demonstrated that axonal MTs move as bulk with the growing velocity of the axon.

Sup Figure 8C suggests that unbounded MT growth alone does not contribute to microtubule orientation. Comparison of 8A, 8C, and 8E suggests unbounded growth modestly increases MT orientation in the proximal axon when sliding is included in the model. If one takes the model's output at face value, the verbal arguments in the manuscript claiming unbounded growth is essential for establishing MT orientation are undermined. I would suggest either accepting that the model indicates unbounded growth is relatively unimportant for establishing MT orientation or rethinking the model.

Please see our discussion above.

It's unclear why augmin is given such a prominent role in the model and the discussion. I found this distracting.

Our simulations demonstrated that augmin- mediated MT templating is essential for +end out MT orientation. It is as much required to achieve a uniform MT orientation in axons as dynein-based MT sliding and unbounded growth of plus-end-out MTs identified in the current study. Hence, we gave augmin a prominent role in the discussion as well.

In conclusion, there are two significant issues. The first is that manipulations designed to alter MT dynamics, either directly or by reducing the localization of p150 to the growth cone (i.e., p150, noc, kinesin), also disrupt dynein, which is well established in being essential for establishing MT orientation. As a result, the experimental data do not appear to show a definitive role for MT dynamics separate from dynein activity. The second is that the modeling suggests MT dynamics make a relatively minor contribution towards establishing MT orientation. In light of this, approaches that could be used to strengthen the manuscript would be to conduct experiments that more directly demonstrate the importance of MT dynamics in this process and to revise the model as outlined above.

We hope that our answers to the reviewer’s concerns above fully address these concerns. We have extended our discussion to avoid misunderstandings and confusion. All our experimental perturbations led to a change in MT dynamics and orientation, and our model and simulations show an important effect of MT dynamics on overall MT orientation in axons, leading to the first coherent model of how uniform MT orientation in axons arises.

Reviewer #3 (Recommendations for the authors):

The authors have made additional efforts to address the comments raised by the reviewers, which has led to various improvements of their manuscript.

We would like to thank the reviewer for this positive statement.

In Supplemental Figure 5, the authors now report the fitted values and found a value for \α of 3.62. Given that d_g(x)=A*p150(x)^\α, this indicates that the gradient of microtubule behavior has a 4x steeper spatial decay than the gradient of p150. This could be the case, but it is not apparent from the stainings and profile plots of p150 they show in Figure 4C and S7. Based on Supplementary Figure 2, it seems that the p150 gradient is actually steeper.

We agree with the reviewer, the fitted data indicate that the spatial decay of dg is approximately 4x steeper than the p150 fluorescence profile. The exponent was found by fitting the equation in l.548 to the experimentally observed dg and p150 profiles from Figures 4C and S7. Figure 4—figure supplement 1 and Figure 4—figure supplement 7 show example profiles, with S2 exhibiting (as the reviewer pointed out) a steeper gradient than S9. If averaging over many profiles one arrives at Figure 4C

Furthermore, I had hoped that the authors would have added some reflection on how a gradient of p150 can result in a gradient of MT dynamics with a 4-fold different length scale. To me this is not entirely evident, but it could be due to a non-linear response of MT dynamics to p150 concentration.

We apologise for not addressing this apparent mismatch before. This non-linear dependence could result from the requirement of several p150 proteins to form a complex to affect MT catastrophe rates, as previously hypothesised (Lazarus et al., 2013). We added this interpretation to the discussion in line 308ff.

Unfortunately, the authors didn't try to address the dynamics of p150 to assess to which extent was diffuse versus anchored (e.g. using FRAP), and therefore the exact interplay between p150 and MTs at the axon tip remains unclear.

We agree that FRAP experiments to elucidate the diffusive or non-diffusive nature of p150 at axon tips would be interesting. We tried to address this point by expressing endogenously tagged p150 in our primary neuron culture system. Unfortunately, we were unable to obtain sufficient fluorescence intensity to do FRAP experiments. Since the question whether p150 is diffusive is not strictly relevant for our present manuscript, we decided to address this question in a future study.

Nonetheless, the manuscript does provide a more coarser insight into how uniform MT arrays could be established by local modulation of MT dynamics.

We thank the reviewer for appreciating a role of MT dynamics in setting up the uniform MT polarity found in axons.

References

Akhmanova, A., and Steinmetz, M.O. (2019). Microtubule minus-end regulation at a glance. J Cell Sci 132.

Athamneh, A.I.M., He, Y., Lamoureux, P., Fix, L., Suter, D.M., and Miller, K.E. (2017). Neurite elongation is highly correlated with bulk forward translocation of microtubules. Scientific Reports 7, 1–13.

del Castillo, U., Winding, M., Lu, W., Gelfand, V.I., and Allan, V. (2015). Interplay between kinesin-1 and cortical dynein during axonal outgrowth and microtubule organization in Drosophila neurons. eLife Sciences 4, e10140.

Gerlitz, G., Reiner, O., and Bustin, M. (2013). Microtubule dynamics alter the interphase nucleus. Cell. Mol. Life Sci. 70, 1255–1268.

Jakobs, M., Franze, K., and Zemel, A. (2015). Force Generation by Molecular-Motor-Powered Microtubule Bundles; Implications for Neuronal Polarization and Growth. Front Cell Neurosci 9, 441.

Lazarus, J.E., Moughamian, A.J., Tokito, M.K., and Holzbaur, E.L.F. (2013). Dynactin subunit p150(Glued) is a neuron-specific anti-catastrophe factor. PLoS Biol. 11, e1001611.

Ma, Y., Shakiryanova, D., Vardya, I., and Popov, S.V. (2004). Quantitative Analysis of Microtubule Transport in Growing Nerve Processes. Current Biology 14, 725–730.

Morrison, E.E., Moncur, P.M., and Askham, J.M. (2002). EB1 identifies sites of microtubule polymerisation during neurite development. Brain Res Mol Brain Res 98, 145–152.

Rao, A.N., Patil, A., Black, M.M., Craig, E.M., Myers, K.A., Yeung, H.T., and Baas, P.W. (2017). Cytoplasmic Dynein Transports Axonal Microtubules in a Polarity-Sorting Manner. Cell Rep 19, 2210–2219.

Tan, R., Foster, P.J., Needleman, D.J., and McKenney, R.J. (2018). Cooperative Accumulation of Dynein-Dynactin at Microtubule Minus-Ends Drives Microtubule Network Reorganization. Dev. Cell 44, 233–247.e234.

Waterman-Storer, C.M., Karki, S.B., Kuznetsov, S.A., Tabb, J.S., Weiss, D.G., Langford, G.M., and Holzbaur, E.L. (1997). The interaction between cytoplasmic dynein and dynactin is required for fast axonal transport. Pnas 94, 12180–12185.

Associated Data

    This section collects any data citations, data availability statements, or supplementary materials included in this article.

    Data Citations

    1. Franze K. 2022. Drosophila primary neuron microtubule imaging data. EMBL-EBI. S-BIAD547

    Supplementary Materials

    Transparent reporting form

    Data Availability Statement

    The software used in this study is freely available, a Gitlab link is provided in the manuscript. Data files can be found on biostudies and accessed via: https://www.ebi.ac.uk/biostudies/studies/S-BIAD547.

    The following dataset was generated:

    Franze K. 2022. Drosophila primary neuron microtubule imaging data. EMBL-EBI. S-BIAD547


    Articles from eLife are provided here courtesy of eLife Sciences Publications, Ltd

    RESOURCES