Abstract
Oxytocin (OT), a hypothalamic neuropeptide that acts as a neuromodulator in the brain, orchestrates a variety of animal behaviors. However, the relationship between brain OT dynamics and complex animal behaviors remains largely elusive, partly because of the lack of a suitable technique for its real-time recording in vivo. Here, we describe MTRIAOT, a G-protein-coupled receptor-based green fluorescent OT sensor that has a large dynamic range, suitable affinity, ligand specificity for OT orthologs, minimal effects on downstream signaling and long-term fluorescence stability. By combining viral gene delivery and fiber photometry-mediated fluorescence measurements, we demonstrate the utility of MTRIAOT for real-time detection of brain OT dynamics in living mice. MTRIAOT-mediated measurements indicate variability of OT dynamics depending on the behavioral context and physical condition of an animal. MTRIAOT will likely enable the analysis of OT dynamics in a variety of physiological and pathological processes.
Subject terms: Synaptic transmission, Neurophysiology, Mouse, Fluorescent proteins
A fluorescent sensor for oxytocin called MTRIAOT has been developed. The sensor’s capabilities are demonstrated in fiber photometry measurements in freely behaving mice.
Main
OT, a neuropeptide produced by neurons in the paraventricular nucleus (PVN) and supraoptic nucleus of the hypothalamus, regulates many physiological processes in both peripheral tissues and the central nervous system. OT neurons primarily send axons to the posterior pituitary, where OT is released into the peripheral circulation as a peripheral hormone that promotes childbirth and lactation. In addition, axons of OT neurons project to numerous other brain regions, where they release OT to regulate diverse physiological functions, such as sensory processing, feeding control, social cognition and emotion1. Impairment of OT signaling in the brain may underlie cognitive and emotional dysfunction associated with neurodevelopmental disorders (for example, autism spectrum disorders and schizophrenia) and brain aging2,3. Given that the timescales of OT-related physiological and pathological phenomena are diverse (from seconds, minutes, hours and days to potentially much longer periods), the dynamics of OT in the brain may be variable depending on behavioral patterns, types of stimuli and physical conditions of animals.
In addition to its roles as an endogenous ligand, OT has emerged as a potential therapeutic agent for psychiatric disorders based on the finding that administration of exogenous OT enhances positive emotions in humans4. Therefore, OT administered peripherally, such as via intranasal or intravenous routes, was originally believed to reach the brain and exert therapeutic effects. However, the potency of exogenous OT administration is contraversial5–7, and a recent study in humans mostly invalidated initial observations of the effects of exogenous OT administration8. Therefore, whether OT administered via a peripheral route can efficiently reach the brain through the nose–brain pathway and/or blood–brain barrier remains unclear5.
In this context, techniques permitting detection of brain OT dynamics are needed. However, currently available methods, such as microdialysis9–11 and a reporter gene-based assay (that is, iTango)12, have limitations, especially in terms of temporal resolution. Recently, fluorescent sensors consisting of a G-protein-coupled receptor (GPCR) with a fluorescent protein replacing the amino acids in its third intracellular loop (IL3), have been engineered as promising tools for real-time detection of neurotransmitters and neuromodulators such as dopamine, acetylcholine, norepinephrine and adenosine13–18. Inspired by these strategies, we developed a sensitive fluorescent OT sensor named MTRIAOT, which is composed of a medaka OT receptor (OTR) and a circularly permutated green fluorescent protein (cpGFP)-based fluorescent module named MTRIA (Modular fluorescence unit fused with TRansmembrane region-to-IntrAcellular loop linkers). Using fiber photometry-mediated fluorescence recording, we demonstrate that MTRIAOT can report a variety of OT dynamics in the mouse brain, including artificially evoked OT signals, endogenous OT responses during natural behaviors and altered endogenous OT dynamics by chemical and physical perturbations.
Results
Development of a sensitive fluorescent oxytocin sensor
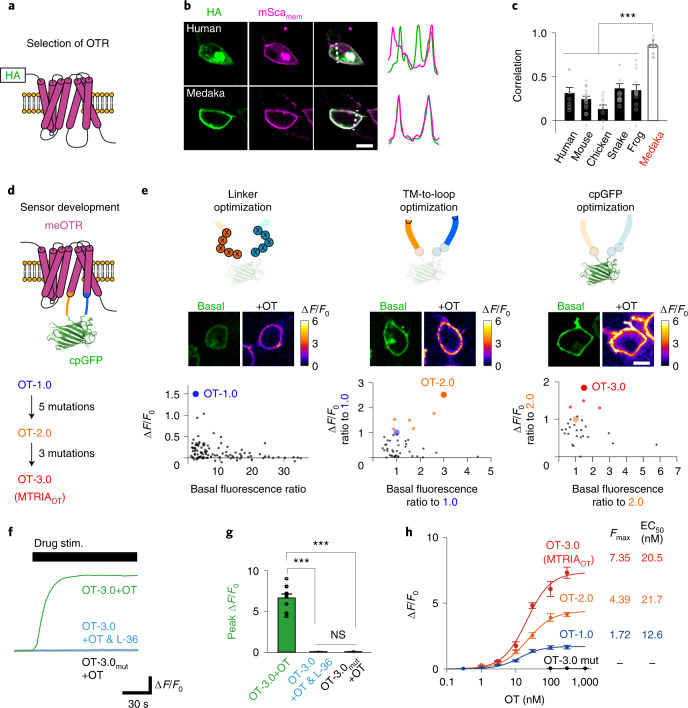
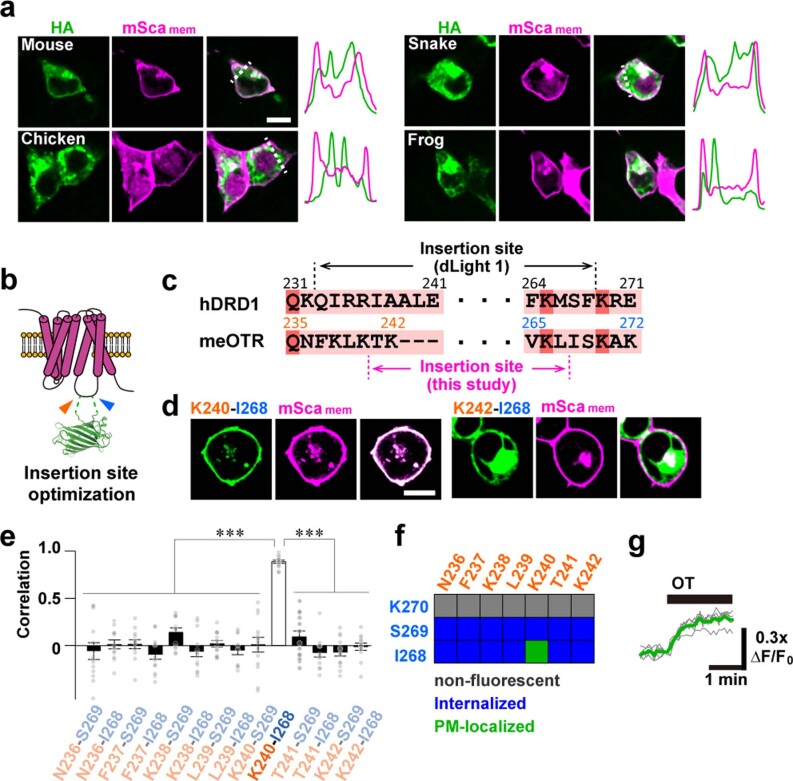
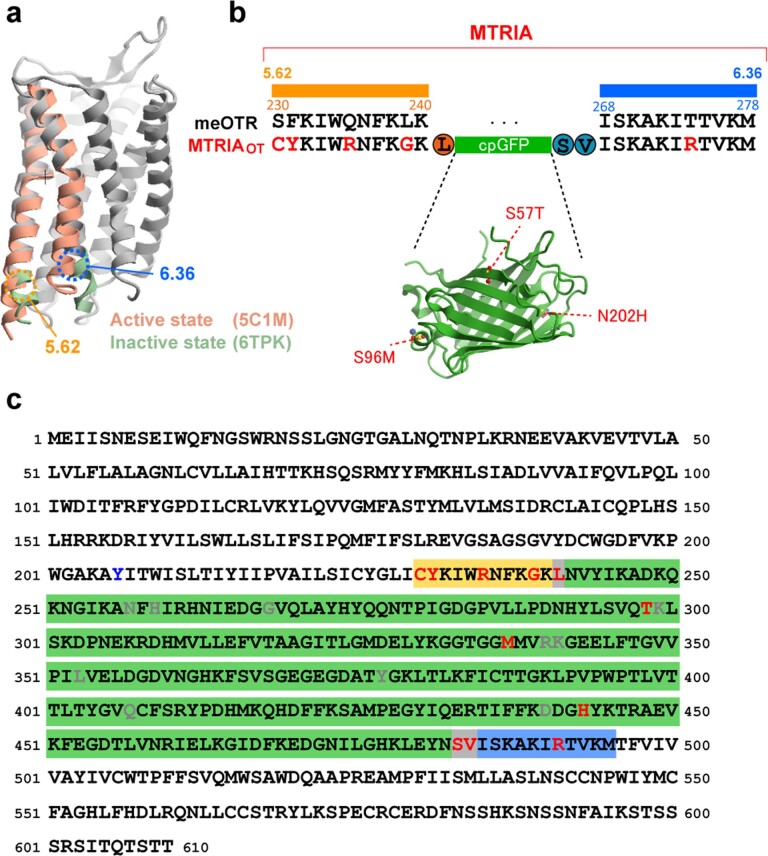
We initially conducted a preliminary screen for an OTR that showed good targeting to the plasma membrane (PM), a key property for PM-targeted fluorescent sensors15,19,20. We chose medaka OTR (meOTR) as a scaffold for our fluorescent sensor because this receptor showed the best targeting to the PM among candidate OTRs from six vertebrate species (human, mouse, chicken, snake, frog and medaka) in human embryonic kidney 293T (HEK293T) cells (Fig. 1a–c and Extended Data Fig. 1a). After optimization of the insertion site of cpGFP in the IL3 of meOTR (Extended Data Fig. 1b–g and Supplementary Note 1), we screened the mutant sensors in HEK293T cells using the following three steps (Fig. 1d and Supplementary Note 1). We sequentially performed mutagenesis in linkers in the N-terminal and C-terminal regions surrounding the cpGFP, neighboring regions of the linkers ranging from the transmembrane helix to the intracellular loops (TM-to-loop) and residues in cpGFP (Fig. 1e). Through these three screening steps, we obtained OT-1.0, OT-2.0 and OT-3.0, respectively. OT-3.0, the final product of the screening, had an approximately 720% ΔF/F0 fluorescence response upon stimulation with 100 nM OT, which was suppressed by the OTR antagonist L-368,899 (L-36) (Fig. 1f,g). We also generated an OT-insensitive sensor (OT-3.0-mut) that contained the Y206A mutation, which abolished its ligand-binding capacity21 (Fig. 1f,g). Characterization of the dose-dependent fluorescence responses of OT-1.0 to OT-3.0 in HEK293T cells (Fig. 1h) showed that our screening improved the dynamic range of fluorescence responses (Fmax) with little change to the half-maximal effective concentration (EC50) value. We designated the fluorescent module of OT-3.0 as MTRIA (Extended Data Fig. 2) and renamed OT-3.0 as MTRIAOT.
Fig. 1. Development of a fluorescent oxytocin sensor.
a, Schematic of a PM-localized OTR conjugated with an HA-tag at the N terminus. b, Images of HEK293T cells coexpressing an HA-tagged OTR (HA, green) and PM-targeted mScarlet (mScamem, magenta). Traces on right compare the normalized fluorescence intensities of HA and mScamem signals along the dotted lines. c, Summary of Pearson correlation coefficients of fluorescence signals in b (n = 8, 17, 10, 10, 12 and 17 cells for human, mouse, chicken, snake, frog and medaka, respectively). Statistics used were one-way analysis of variance (ANOVA; F5,68 = 2.35, P = 4.9 × 10⁻¹⁹) with Bonferroni post hoc test (P = 3.3 × 10⁻⁹, human versus medaka; P = 8.9 × 10⁻⁹, mouse versus medaka; P = 5.4 × 10⁻¹⁴, chicken versus medaka; P = 2.4 × 10⁻¹⁹, snake versus medaka; P = 2.3 × 10⁻⁸, frog versus medaka). d, Schematic of the sensor architecture. e, Development of a sensitive fluorescent OT sensor over a three-step screening; optimization of linker regions, TM-to-loop region and cpGFP moiety. Schematics of mutagenesis (top), basal fluorescence images and heat maps depicting responses to 100 nM OT (middle), and scatterplots describing the relationship between basal brightness and the fluorescence response to 100 nM OT (bottom). f, Representative traces of fluorescence responses upon simulation with the indicated drug (green, OT-3.0-expressing cells upon stimulation with OT; cyan, OT-3.0-expressing cells upon stimulation with a mixture of OT and L-36; gray, OT-3.0-mut-expressing cells upon stimulation with OT). g, Summary of peak ΔF/F0 values (n = 10 cells per group). Statistics used were one-way ANOVA (F2,27 = 3.35, P = 5.7 × 10⁻¹⁶) with Bonferroni post hoc test (P = 4.3 × 10⁻¹⁰, left versus middle; P = 4.3 × 10⁻¹⁰, left versus right; P = 1, middle versus right). h, Dose–response curves of sensors (n = 10 cells per point). Fmax and EC50 values are summarized on the right. Scale bars, 10 µm (b and e). Graphs represent the mean ± s.e.m. (c, g and h). ***P < 0.001, NS, not significant (c and g).
Extended Data Fig. 1. Optimization of a fluorescent OT sensor.
a, Representative images of HEK293T cells co-expressing an HA-tagged OTR (green) and a mScamem (magenta). Normalized fluorescence intensities on the dotted lines are shown on the right. b, Schematic representation of cpGFP insertion into the IL3 of OTR. c, Sequence alignment of regions of the IL3 of human dopamine receptor D1 (hDRD1), a scaffold of a dopamine sensor (dLight1), and meOTR. d, Representative images of HEK293T cells co-expressing the indicated meOTR-cpGFP chimera (green) and mScamem (magenta). e, Pearson correlation coefficients comparing meOTR-cpGFP chimeras and mScamem are summarized as mean ± SEM (n = 13, 12, 12, 13, 12, 13, 13, 11, 13, 13, 13, 12, 13, and 12 cells; left to right). Statistics: one-way ANOVA (F13,167 = 1.78, P = 5.5 × 10⁻³²) with Bonferroni post-hoc test (P = 5.1 × 10⁻⁹: N236–S269, P = 7.9 × 10⁻¹⁴: N236–I268, P = 1.2 × 10⁻¹³: F237–S269, P = 4.1 × 10⁻¹⁴: F237–I268, P = 3.1 × 10⁻¹²: K238–S269, P = 4.9 × 10⁻¹⁴: K238–I268, P = 1.6 × 10⁻¹⁶: L239–S269, P = 2.9 × 10⁻¹⁴: L239–I268, P = 1.2 × 10⁻⁹: K240–S269, P = 9.6 × 10⁻¹¹: T241–S269, P = 5.4 × 10⁻¹⁵: T241–I268, P = 2.7 × 10⁻¹⁶: K242–S269, P = 2.0 × 10⁻¹⁶: K242–I268, compared with K240–I268). ***P < 0.001. f, Summary of insertion site-dependent characteristics of meOTR-cpGFP chimeras. g, Traces showing fluorescence responses of the K240–I268 meOTR-cpGFP chimera upon stimulation with 100 nM OT. Scale bars, 10 µm (a, d).
Extended Data Fig. 2. Sequence of our fluorescent OT sensor.
a, Superposition of active- and inactive-GPCR structures, adapted from the Protein Data Bank (PDB) archives (IDs: 5C1M and 6TPK). TM5–TM6 regions of active and inactive states are colored pink and green, respectively. b, Alignment of the TM5–TM6 region between meOTR and MTRIAOT; the structure of cpGFP is adapted from a PDB archive (ID: 3SG2). Mutations introduced in MTRIAOT are shown as red. c, Full amino acid sequence of MTRIAOT. Mutations in MTRIAOT, the point mutation in MTRIAOT-mut, and mutations of cpGFP that were adapted in the other fluorescent sensors are shown in red, blue, and gray, respectively.
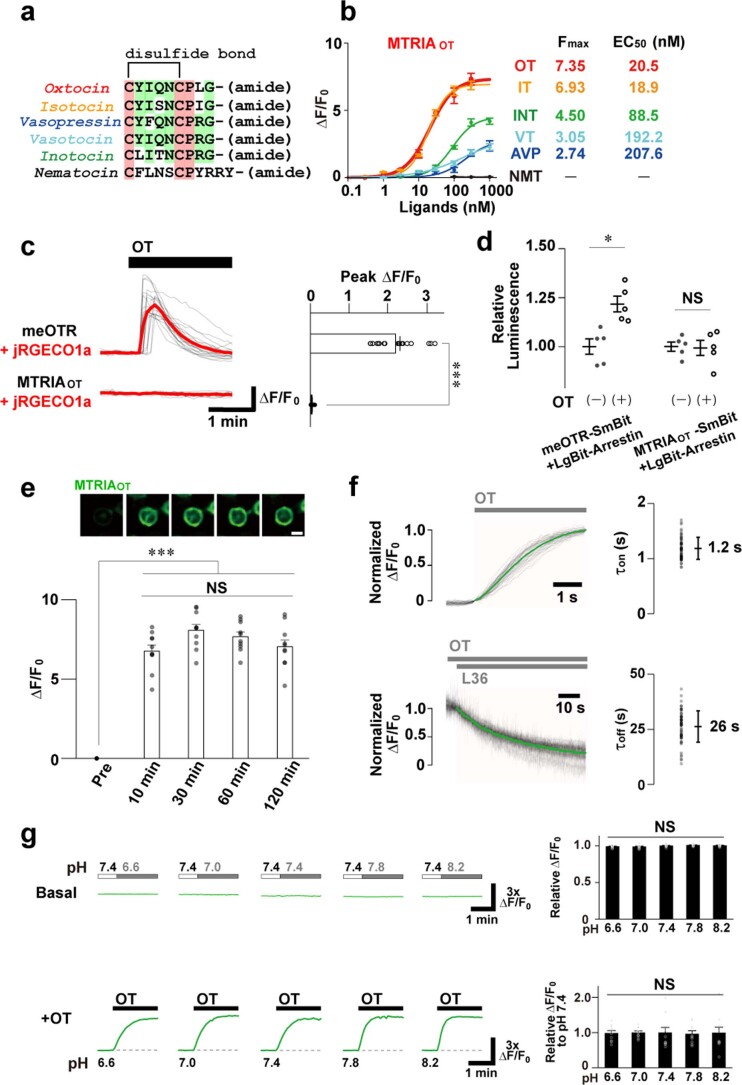
We then further characterized the ligand specificity of MTRIAOT. Compared to its sensitivity to OT, the sensor was similarly sensitive to isotocin (an OT analog in fish), much less sensitive to vasopressin orthologs (vasopressin and vasotocin) and inotocin (an OT and vasopressin ortholog in insects), and insensitive to nematocin (an OT and vasopressin ortholog in nematodes; Extended Data Fig. 3a,b). We also examined the basic properties of MTRIAOT, such as its coupling capacity with downstream effectors, long-term fluorescence stability, kinetics and pH sensitivity. We used a Ca2+ imaging experiment and a split-luciferase complementation assay to assess the coupling of MTRIAOT with Gαq protein and β-arrestin signaling pathways. MTRIAOT had no detectable effects on either of these effectors, whereas wild-type meOTR was able to couple with them (Extended Data Fig. 3c,d). Furthermore, we did not detect internalization of MTRIAOT from the PM when we chronically exposed MTRIAOT-expressing HEK293T cells to 100 nM OT (Extended Data Fig. 3e). We conducted a kinetic analysis of MTRIAOT using a local puff of OT and L-36, which yielded an on-rate and an off-rate of approximately 1.2 s and 26 s, respectively (Extended Data Fig. 3f). Finally, changes in the extracellular pH level ranging from 6.6 to 8.2 minimally affected basal and OT-induced MTRIAOT fluorescence (Extended Data Fig. 3g), indicating little pH dependence of MTRIAOT within the physiological extracellular pH range.
Extended Data Fig. 3. The basic properties of MTRIAOT in HEK293T cells.
a, Sequence alignment of OT and its orthologous neuropeptides. b, Dose-response curves of MTRIAOT to OT and its orthologous neuropeptides (n = 10 cells per point). c, Assay for G protein coupling. Traces of jRGECO1a fluorescence responses in either meOTR- or MTRIAOT-co-expressing cells upon stimulation with 100 nM OT (gray: each trace, red: average trace). Summary of peak ΔF/F0 responses are shown on the right (n = 20 cells). d, Assay for β-arrestin coupling. Traces showing the relative luminescence increase induced by NanoLuc luciferase complementation upon stimulation with 100 nM OT (n = 5 wells). e, Time-course of the fluorescence intensity of MTRIAOT over 120 min following 100 nM OT stimulation. Representative images (top) and summary of ΔF/F0 responses (bottom: n = 10 cells). f, Traces showing the kinetics of MTRIAOT in the fluorescence rise (top left: τon) upon 5 μM OT and decay (bottom left: τoff) upon 300 nM OT and subsequent 10 μM L36 (gray: each trace, green: average trace; n = 60 cells). The time constants determined by a single-exponential fitting are summarized to the right. g, Representative traces showing the dependence of MTRIAOT fluorescence intensity on extracellular pH (left top: basal fluorescence levels, bottom: OT-induced responses). Summary of basal fluorescence levels normalized by the value just before pH change (right top: n = 10 cells) and OT-induced responses formalized by the mean of ΔF/F0 at pH 7.4 (right bottom: n = 10 cells). Scale bar, 10 µm (e). Graphs represent mean ± SEM (b–e, g) and mean ± SD (f). ***P < 0.001, *P < 0.05, NS: not significant (c–e, g). Statistics (b, d, e, g) are summarized in Supplementary Note 4.
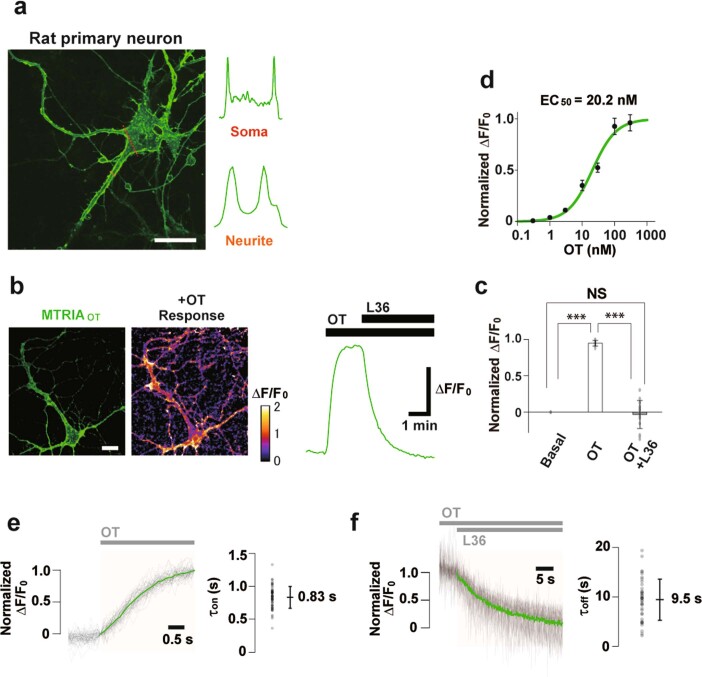
We also examined the performance of MTRIAOT in cultured rat hippocampal neurons. When expressed in primary neurons, MTRIAOT showed good PM localization both in soma and neurites (Extended Data Fig. 4a). Application of OT induced a robust increase in the fluorescence intensity of MTRIAOT, and subsequent application of L-36 suppressed its fluorescence to a level comparable to basal fluorescence (Extended Data Fig. 4b,c). The EC50 value of MTRIAOT measured in primary neurons was 20.2 nM (Extended Data Fig. 4d), almost the same value as that measured in HEK293T cells. Kinetic time constants measured in primary neurons were faster (on-rate of ~0.83 s, off-rate of ~9.5 s; Extended Data Fig. 4e,f) than those observed in HEK293T cells, similar to a previously reported GPCR-based fluorescent sensor18. Taken together, these results indicate that our MTRIAOT sensor is equipped with enough sensitivity, specificity and stability to accurately detect extracellular OT dynamics.
Extended Data Fig. 4. The basic properties of MTRIAOT in rat hippocampal primary neurons.
a, Representative image showing a rat primary neuron expressing MTRIAOT and profiles of fluorescence intensities along the dotted lines (red: soma, orange: neurite). b, Fluorescence image (left), heatmap image depicting the response to 300 nM OT (middle), and representative trace of MTRIAOT response upon 300 nM OT and subsequent 1 μM L36 (right). c, Summary of ΔF/F0 responses normalized by a peak value during OT stimulation (n = 15 cells). Statistics: one-way ANOVA (F2, 42 = 3.22, P = 3.5 × 10⁻²⁷) with Bonferroni post-hoc test (P = 1.0 × 10⁻²⁰: Basal vs. OT, P = 8.1 × 10⁻¹¹: OT vs. OT + L36, P = 1: Basal vs. OT + L36). d, Dose-response curves of MTRIAOT in primary neurons (n = 18, 24, 26, 18, 15, 35, and 42 cells for 0.3, 1, 3, 10, 30, 100, and 300 nM, respectively). Values were normalized against a maximum value of the fitted-sigmoidal curve. e–f, Traces showing the kinetics of MTRIAOT in the fluorescence rise (e left: τon) upon 5 μM OT and decay (f left: τoff) upon 300 nM OT and subsequent 1 μM L36 (gray: each trace, green: average trace; n = 59 cells in e and 38 cells in f). Time constants determined by a single-exponential fitting are summarized to the right. Scale bars, 20 µm (a) and 30 µm (b). Graphs represent mean ± SEM (c, d) and mean ± SD (e, f). ***P < 0.001, NS: not significant (c).
Validation of MTRIAOT in vivo
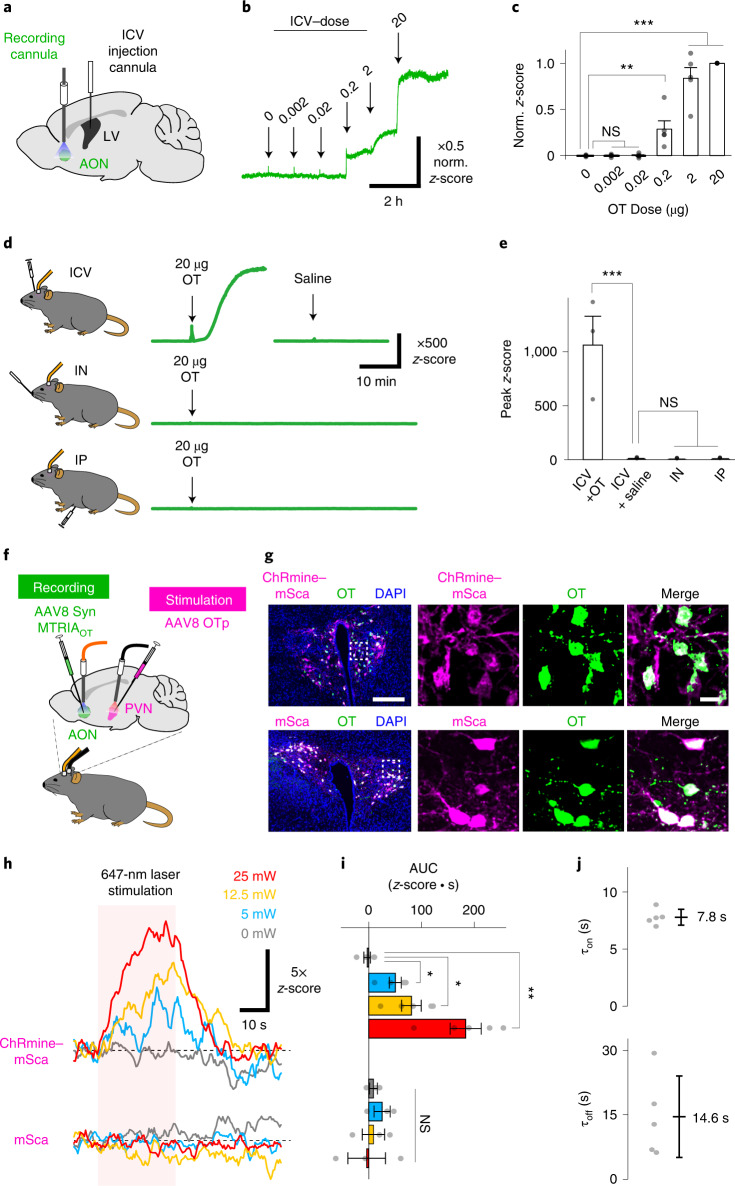
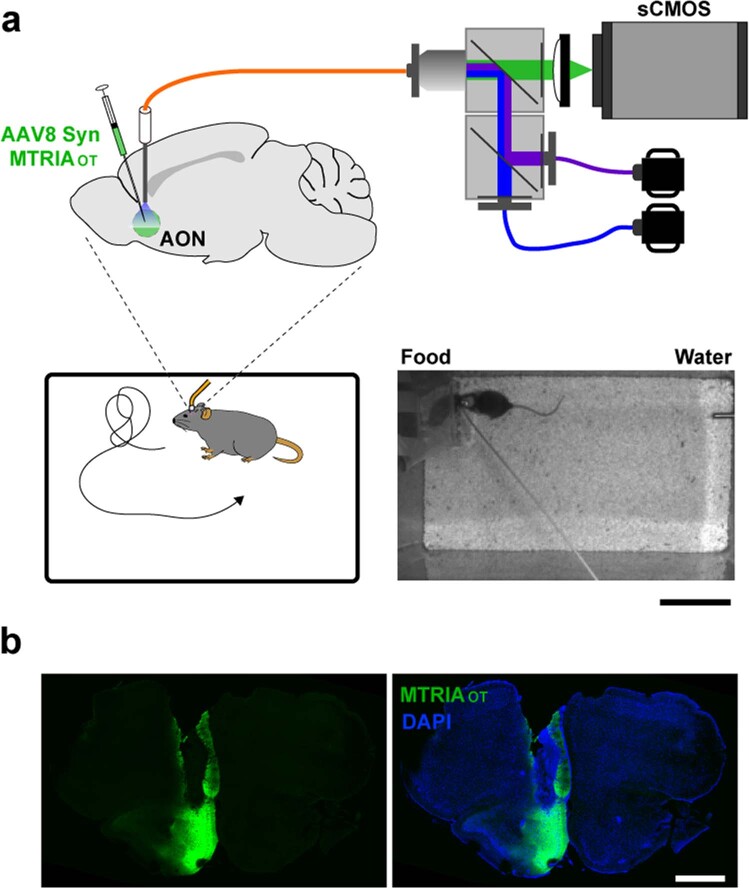
Having validated the basic properties of MTRIAOT in cultured cells, we next tested whether our OT sensor is applicable to experiments in the brains of living mice. Using an adeno-associated virus (AAV), we expressed MTRIAOT in the anterior olfactory nucleus (AON), a major target site of OT in the brain with high OTR expression levels22,23. We then conducted fiber photometry recordings through an implanted cannula placed above the injection site (Fig. 2a and Extended Data Fig. 5). First, we examined the responses of MTRIAOT after intracerebroventricular infusion of 10 µl saline containing various amounts of OT (0, 0.002, 0.02, 0.2, 2 and 20 µg) in anesthetized mice. When we serially applied increasing amounts of OT through a stainless-steel cannula implanted into the lateral ventricle (Fig. 2a), we observed robust fluorescence increases upon stimulation with OT at doses of 0.2 µg and above (Fig. 2b,c), comparable doses to those which are required to trigger OT-dependent animal behaviors24–26. This finding indicates that MTRIAOT is capable of real-time detection of extracellular OT in living brains.
Fig. 2. In vivo real-time measurement of brain oxytocin dynamics following exogenous oxytocin administration and optogenetic stimulation of oxytocin neurons.
a, Schematic illustrating fiber photometry recording of MTRIAOT in the AON. b, Representative trace of the z-scored fluorescence intensity of MTRIAOT following intracerebroventricular (ICV) injection of OT at the indicated doses. The amplitude of the signal is shown as a value normalized against the peak value of the highest dose (norm. z-score). c, Summary of normalized z-score (n = 5 mice). d, Representative traces of z-scores upon stimulation with either 20 µg OT or saline via the indicated administration routes (ICV, intranasal (IN) and intraperitoneal (IP)). e, Summary of peak z-scores (n = 3 mice). f, Schematic illustrating fiber photometry recording of MTRIAOT in the AON upon optogenetic stimulation of OT neurons in the PVN. g, Histological images showing transduction of the indicated gene products (ChRmine–mSca and mSca) in OT-positive neurons in the PVN. Overlaid images of the indicated gene product (magenta), OT staining (green) and DAPI staining (blue) are shown to the left. Magnified images within the dashed rectangles are shown on the right. h, Representative traces of MTRIAOT responses to the light stimuli at the indicated powers recorded in a mouse expressing either ChRmine–mSca or mSca in OT neurons. The period of light stimulation is indicated by the pink-shaded area. i, Summary of area under the curve (AUC) values during light stimulation (n = 5 mice in ChRmine–mSca, n = 3 mice in mSca). j, Summary of rise and decay time constants (n = 5 mice). Scale bars, 200 µm (left) and 20 µm (right) in g. Graphs represent the mean ± s.e.m. (c, e and i) and the mean ± s.d. (j). ***P < 0.001, **P < 0.01, *P < 0.05, NS (c, e and i). Statistics (c, e and i) are summarized in Supplementary Note 2.
Extended Data Fig. 5. Fiber photometry setup and confirmation of the measurement site.
a, Schematic illustrating fiber photometry measurements in a freely behaving mouse. A representative image of an experimental arena captured by an overhead camera is shown in the bottom right. b, Histology showing expression of MTRIAOT (green) and the placement of an implanted cannula. DAPI (blue) was used for counterstaining nuclei. Scale bars, 10 cm (a) and 1 mm (b).
Peripheral administration of less than 20 µg of OT is reportedly sufficient to affect animal behaviors27,28; therefore, we next evaluated whether OT levels in the AON increased after application of exogenous OT from two distinct peripheral administration routes: intranasal and intraperitoneal. Neither intranasal nor intraperitoneal administration of 20 µg of OT induced detectable fluorescence responses of MTRIAOT in anesthetized mice (Fig. 2d,e). Taken together with the finding that MTRIAOT had robust responses to intracerebroventricular administration of OT solution at a dose of 0.2 µg (Fig. 2b,c), our data indicate that less than 1% of peripherally administered OT can reach the AON.
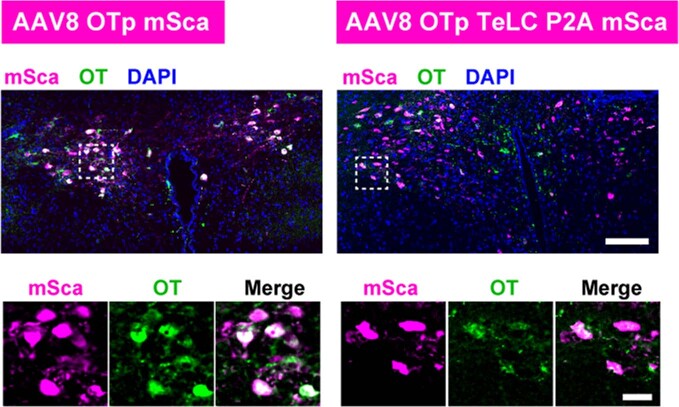
We next examined whether MTRIAOT can detect optically evoked OT release by combining fiber photometry recording and optogenetic stimulation. To this end, we virally expressed ChRmine–mSca, a fusion protein of red-shifted channelrhodopsin ChRmine29 and mScarlet (mSca), in OT-expressing PVN neurons and MTRIAOT in AON cells (Fig. 2f). For control experiments, we expressed mSca instead of ChRmine–mSca in OT neurons. Our histological analysis verified that AAV vectors harboring the OT promoter (OTp) resulted in the expression of gene products specifically in OT neurons in the PVN (Fig. 2g). We measured MTRIAOT responses in the AON upon optogenetic stimulation of OT neurons with trains of red-light pulses (647-nm wavelength, 10-ms pulse width, 20-Hz frequency) lasting for 30 s, and parameters were comparable to those previously used to evoke optogenetic OT release23,30,31. We found that MTRIAOT signals in the AON of ChRmine-expressing mice were progressively enhanced with increasing power of the stimulation laser (from 0, 5 and 12.5 to 25 mW) whereas those in control mice showed no detectable changes upon stimulation at any laser intensity (Fig. 2h,i). To estimate the kinetic properties of MTRIAOT in vivo, we determined the time constants of OT signals induced with 25 mW of light, which were stable enough for a single-exponential fitting. The mean rise and decay times were 7.8 s and 14.6 s, respectively (Fig. 2j). Taken together, these observations indicate that MTRIAOT can be used to measure endogenous OT release in vivo with high sensitivity and rapid kinetics.
Monitoring oxytocin dynamics in the brains of freely behaving mice
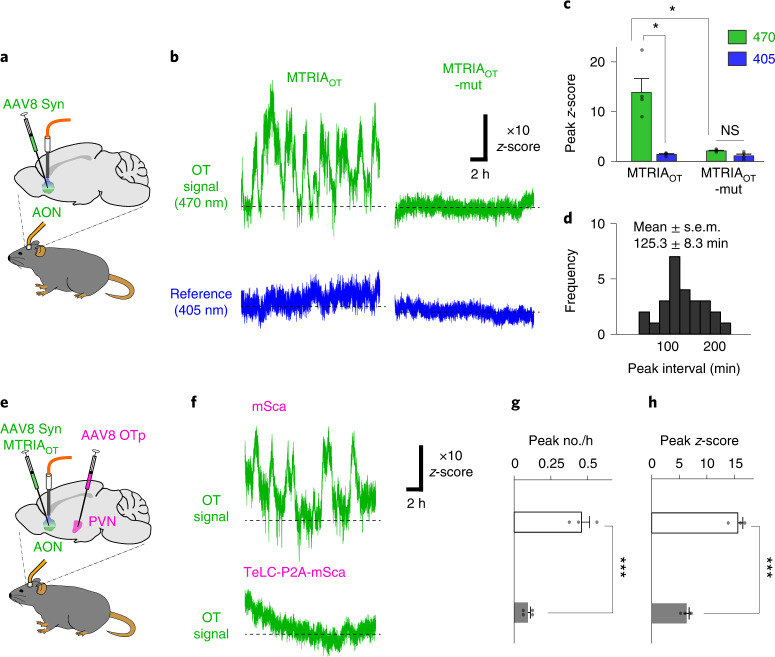
Having shown that MTRIAOT is functional in the mouse brain, we next examined whether MTRIAOT can be used to assess endogenous OT dynamics in the brains of behaving mice. OT levels in cerebrospinal fluid reportedly show daily fluctuations11,32; however, the precise temporal profile has not been fully determined, largely because of the limited sampling rate of conventional approaches. Therefore, we recorded MTRIAOT responses during daily behavior. We virally expressed MTRIAOT in the AON and measured its fluorescence responses using fiber photometry (Fig. 3a). We found that transient increases of OT signals were repeated at approximately 2-h intervals in the AON of mice freely behaving in a cage with food and water supplied ad libitum (Fig. 3b–d). We named this ultradian OT rhythm ‘OT oscillation’. OT oscillations were absent in simultaneously recorded reference signals (405-nm excited MTRIAOT) and in signals recorded using control sensors (470-nm and 405-nm excited MTRIAOT-mut; Fig. 3b), excluding the involvement of artifacts derived from movements and/or autofluorescence. We selectively transduced tetanus toxin light chain (TeLC), which prevents vesicular transmitter release33, in OT-expressing neurons in the PVN using an AAV vector harboring the OT promoter (Extended Data Fig. 6). Expression of TeLC suppressed the increase in OT compared with the control (Fig. 3e–h), confirming that OT oscillation is dependent on OT release from oxytocinergic neurons in the PVN. These results demonstrate the utility of MTRIAOT to capture ultradian OT dynamics in the brain.
Fig. 3. In vivo real-time measurement of brain oxytocin oscillation in freely behaving mice.
a, Schematic illustrating fiber photometry recording of MTRIAOT in the AON in freely behaving mice. b, Representative traces of 470-nm-excited signals (green) and 405-nm-excited signals (blue) from either MTRIAOT-expressing or MTRIAOT-mut-expressing mice. c, Summary of peak z-scores (n = 4 mice). Statistics used were one-way ANOVA (F3,12 = 3.49, P = 7.4 × 10⁻⁵) with Bonferroni post hoc test (P = 0.026, 470 nm versus 405 nm in MTRIAOT; P = 0.034, 470 nm in MTRIAOT versus 470 nm in MTRIAOT-mut; P = 0.21, 470 nm versus 405 nm in MTRIAOT-mut). d, Frequency histogram showing the intervals of OT signal peaks (n = 26 events from four mice). e, Schematic illustrating experimental protocol for assessing the involvement of OT release from PVN neurons in OT signal increases in the AON. f, Representative traces of MTRIAOT activities recorded from mice either expressing mSca or coexpressing TeLC and mSca in the PVN. g,h, Summary of the peak number every hour (g) and peak z-score (h; n = 3 mice in mSca and n = 4 mice in TeLC-P2A-mSca). Statistics used were an unpaired two-tailed t-test (P = 8.2 × 10⁻⁴ in g and P = 1.6 × 10⁻⁴ in h). Graphs represent the mean ± s.e.m. (c, g and h). ***P < 0.001, *P < 0.05, NS (c, g and h).
Extended Data Fig. 6. Histological verification of specific gene transduction in OT neurons.
Histology showing transduction of the indicated AAV vectors (left: AAV8 OTp mSca; right: AAV8 OTp TeLC P2A mSca) in OT-positive neurons in the PVN. Overlaid images of mSca (magenta), OT staining (green), and DAPI staining (blue) are shown in the top panels. Magnified images within the dotted rectangles are shown in the bottom panels. Scale bars, 100 µm (top) and 20 µm (bottom).
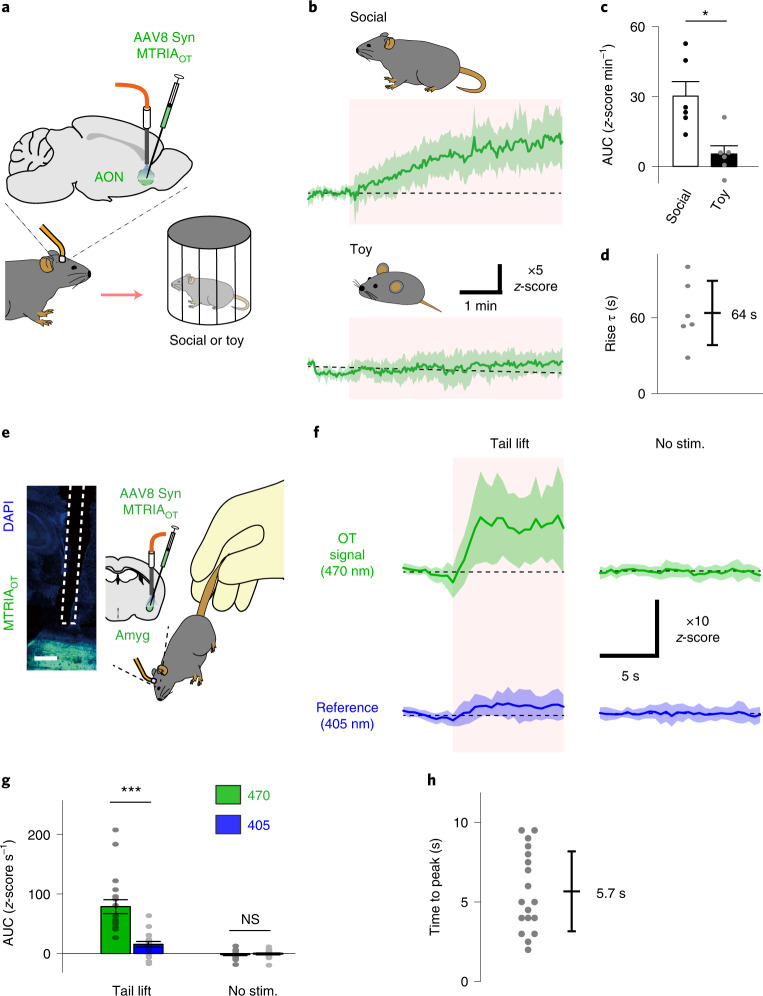
Taking advantage of the rapid kinetics of MTRIAOT, we also tested whether the sensor can detect faster phenomena. Interaction with a conspecific animal results in prompt activation of OT neurons34; therefore, we examined social interaction-induced MTRIAOT responses in the AON using fiber photometry (Fig. 4a). Following an encounter with a conspecific mouse enclosed in a wire cage, the fluorescence signal of MTRIAOT started to gradually increase, which was characterized by a rise time constant of ~1 min. We also verified that there was no apparent increase in the signal when stimulated with a toy mouse (Fig. 4b–d). These results indicate that MTRIAOT can be used to detect OT responses with a minute-order time constant.
Fig. 4. In vivo real-time measurement of brain oxytocin responses upon social interaction and acute stress.
a, Schematic illustrating fiber photometry recording of social interaction-induced OT responses. b, Mean z-scored traces (green thick lines) showing MTRIAOT responses to encounters with either a mouse (top) or a toy (bottom). The regions covering s.d. values of the traces are shaded in light green. Stimulation was applied during the periods shaded in pink. c, Summary of AUC values during stimulation (n = 6 mice). Statistics used were a paired two-tailed t-test (P = 0.03). d, Summary of rise time constants for social interaction-induced OT responses determined by a single-exponential fitting (n = 6 mice). e, Histological verification of sensor expression around the recording region (left) and schematic illustrating fiber photometry recording of social interaction-induced OT responses (right). f, Mean z-scored traces showing MTRIAOT responses (green, 470-nm-excited signal; blue, 405-nm-excited signal) either following tail lift (left, tail lift) or without simulation (right: no stim.). The regions covering s.d. values of the traces are shaded in light colors. Tail lift was applied during the periods shaded pink. g, Summary of AUC values during stimulation (n = 18 trials from three mice). Statistics used were one-way ANOVA (F3,68 = 2.74, P = 7.5 × 10⁻¹⁴) with Bonferroni post hoc test (P = 5.0 × 10⁻⁵, 470 versus 405 in tail lift, P = 1 in 470 versus 405 in no stim.). h, Summary of times to peak for tail lift-induced OT responses (n = 18 trials from three mice). Scale bar, 200 µm (e). Graphs represent the mean ± s.e.m. (c and g) and mean ± s.d. (b, d, f and h). ***P < 0.001, *P < 0.05, NS (c and g).
We next explored faster OT responses. OT levels are thought to increase in response to a wide variety of stressful stimuli35. A major target of stress-induced OT signals is the central nucleus of the amygdala30,35; therefore, we virally expressed MTRIAOT around this region and measured OT responses after a tail lift as a rapid stress stimulus (Fig. 4e). After lifting the tail of a mouse, we observed a rapid rise in MTRIAOT signal. Such robust responses were absent in simultaneously recorded 405-nm-excited reference signals, as well as 470-nm-excited and 405-nm-excited signals recorded without stimulation, indicating artifacts are negligible (Fig. 4f,g). The mean time to reach peak signal value was approximately 6 s (Fig. 4h), demonstrating the utility of MTRIAOT to detect OT responses that rapidly appear within a few seconds. Taken together, the above results show the potential of MTRIAOT for analyzing OT responses during various timescales.
Examination of potential factors affecting brain oxytocin dynamics
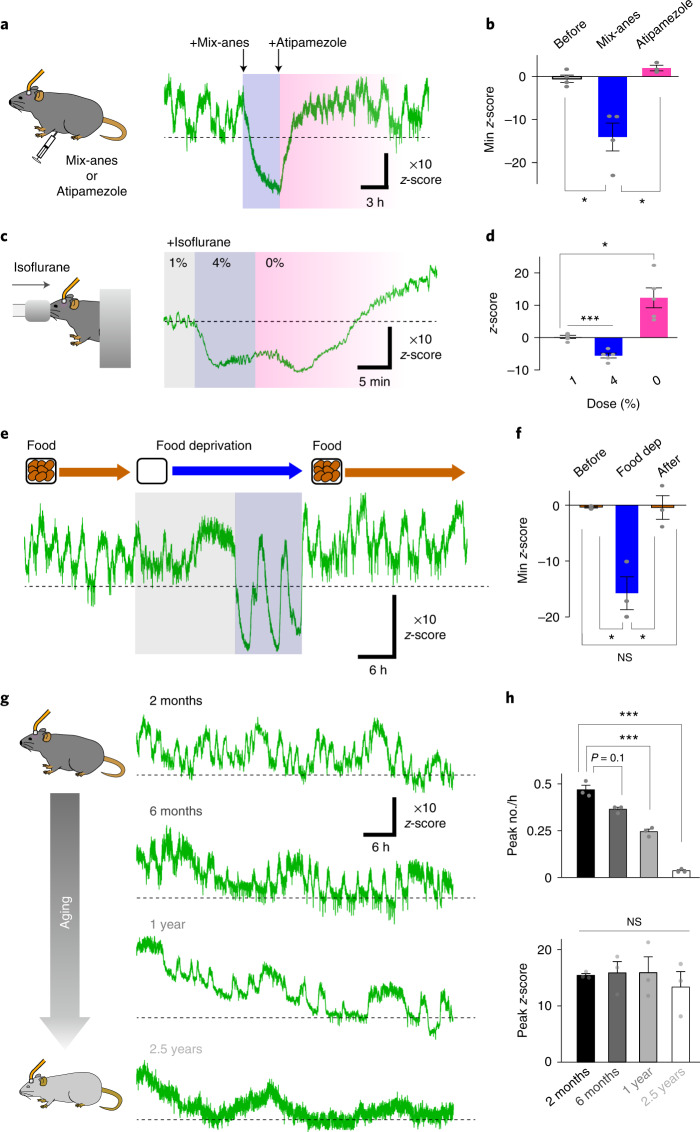
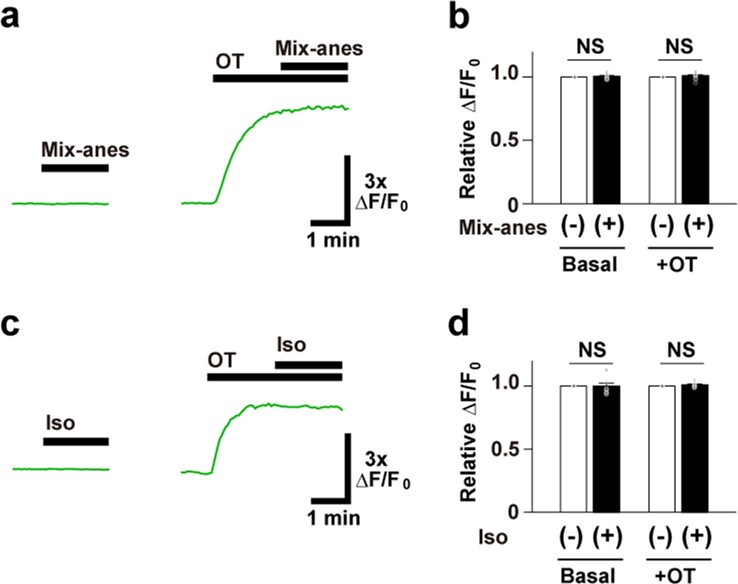
We next explored potential factors affecting patterns of OT dynamics in the brain. General anesthetics exert substantial effects on neurotransmission36,37; therefore, we evaluated the impact of two anesthetics on OT levels in the AON using fiber photometry recording. First, we examined the effect of a mixture of dexmedetomidine, butorphanol and midazolam (mix-anes). When mix-anes was intraperitoneally administered, the fluorescence signal of MTRIAOT fell to a level below the baseline (Fig. 5a,b). The undershot signal of MTRIAOT was reversed to a level comparable to baseline after administration of atipamezole, a drug that has an antagonistic effect on mix-anes (Fig. 5a,b). We also examined the effect of isoflurane, an inhalation anesthetic, on MTRIAOT responses by sequentially changing the dose from 1% to 4% to 0%. Consistent with the above result, the level of MTRIAOT fluorescence became lower as the dose of the anesthetic increased (Fig. 5c,d). We confirmed that mix-anes and isoflurane did not affect basal or OT-evoked fluorescent signals in HEK293T cells (Extended Data Fig. 7), excluding the possibility of direct suppressive effects of these anesthetics on the fluorescence signal of the sensor. Together, these results demonstrate the suppressive effect of anesthesia on brain OT levels.
Fig. 5. Alterations in brain oxytocin levels caused by anesthesia, food deprivation and aging.
a, Schematic illustrating the recording and representative trace of MTRIAOT activity showing the impact of mix-anes on OT oscillation. The background of the trace is shaded to indicate the period of anesthesia after mix-anes administration (dark blue) and period after release by the antagonist, atipamezole (pink). b, Summary of minimum z-score values before mix-anes administration, after administration of mix-anes and following subsequent administration of atipamezole (n = 4 mice in before and mix-anes, n = 3 mice in atipamezole). c, Schematic of the recording and representative trace of MTRIAOT activity showing the impact of isoflurane on OT signal. The background of the trace is shaded to indicate the period of 1% isoflurane administration (gray), of 4% isoflurane administration (dark blue), and after release from the anesthesia (0%, pink). d, Summary of the tail values of z-scores during the above three states (n = 5 mice). e, Representative trace of MTRIAOT activity showing the impact of food deprivation on OT oscillation. The background of the trace is shaded to indicate the period of food deprivation. The period of OT turbulence is colored dark blue and the peaks of undershot signal are indicated by arrowheads. f, Summary of minimum z-score values before, during and after food deprivation (n = 3 mice). g, Representative traces of MTRIAOT fluorescence signals in mice at the indicated age (2 months, 6 months, 1 year or 2.5 years). h, Summary of the peak number every hour (top) and peak z-score (bottom; n = 3 mice). Graphs represent the mean ± s.e.m. (b, d, f and h). ***P < 0.001, *P < 0.05 and NS unless otherwise stated (b, d, f and h). Statistics (b, d, f and h) are summarized in Supplementary Note 3.
Extended Data Fig. 7. Effects of anesthetic drugs on MTRIAOT fluorescence level in HEK293T cells.
a, Representative traces (left: basal fluorescence level, right: OT-induced response) showing the dependence of MTRIAOT fluorescence intensity on mix-anes (0.11 mg/mL dexmedetomidine hydrochloride, 0.6 mg/mL midazolam, and 0.75 mg/mL butorphanol tartrate). b, Summary of ΔF/F0 responses by the value just before mix-anes application (n = 10 cells). Statistics: paired two-tailed t-test (P = 0.48: Basal, P = 0.24: +OT). c, Representative traces (basal fluorescence level: left, OT-induced response: right) showing the dependence of MTRIAOT fluorescence intensity on isoflurane (1:100 dilution). d, Summary of ΔF/F0 responses by the value just before isoflurane application (n = 10 cells). Statistics: paired two-tailed t-test (P = 0.97: Basal, P = 0.18: +OT). Graphs represent mean ± SEM (b, d). NS: not significant (b, d).
Feeding is associated with OT release38; therefore, we examined the impact of fasting stress on brain OT dynamics. After about half a day of food deprivation, patterns of OT oscillation gradually became disturbed and the oscillatory signals undershot to a level below the initial baseline (Fig. 5e,f). We named this phenomenon ‘OT turbulence’ (Fig. 5e). After refeeding, OT turbulence halted and normal OT oscillation quickly recovered (Fig. 5e,f). Considering the role of OT as an appetite suppressant39, OT turbulence may manage hunger stress during starvation.
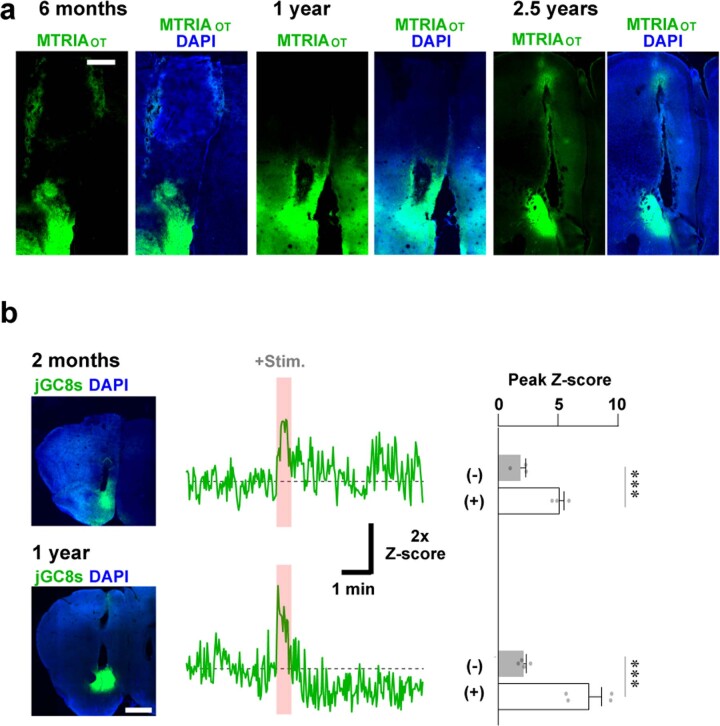
Aging is associated with a decline in the neuroendocrine system3,40; therefore, we next analyzed differences in AON OT dynamics in mice at varying ages (~2 months, ~6 months, ~1 year and ~2.5 years). We verified that AAV-mediated transduction of the sensor was successful in old animals (Extended Data Fig. 8a). Fiber photometry-mediated fluorescence measurements revealed the occurrence of oscillatory OT responses in all groups, but the frequency of OT transients became slower in older animals, although there were no detectable changes in amplitude (Fig. 5g,h). It may be possible that the reduced frequency of OT oscillation results from the vulnerability of tissue in older animals to the surgery required for fiber photometry recording. However, odor-induced Ca2+ responses in the AON were robust even in 1-year-old mice (Extended Data Fig. 8b), supporting the validity of our fiber photometry recordings in old mice. These results indicate that an altered frequency of OT oscillation may underlie aging-associated decline of brain function.
Extended Data Fig. 8. Verification of sensor expression and viability of brain tissue following surgery in aged mice.
a, Histology showing transduction of MTRIAOT in the AON of mice at 6 months, 1 year, and 2.5 years of age (green: MTRIAOT, blue: DAPI). b, Data on fiber photometry recordings of odor-induced Ca2+ responses in the AON using mice aged either 2 months (top) or 1 year (bottom). Histology showing jGCaMP8s expression (left), representative traces of the recordings (middle), and summary of peak z-scores of the jGCaMP8s signals before (-) and during (+) odor simulation are summarized (n = 3 mice for 2 months and n = 4 mice for 1 year), respectively. As an odor stimulant, a small piece of a filter paper soaked with limonene was displayed for 30 s during the period shown in pink in the middle panel. Statistics: unpaired two-tailed t-test (P = 0.006: 2 months, P = 0.002: 1 year). Graphs represent mean ± SEM (b). ***P < 0.01 (b). Scale bars, 500 µm (a) and 1 mm (b).
Developing other G-protein-coupled receptor-based sensors using MTRIA
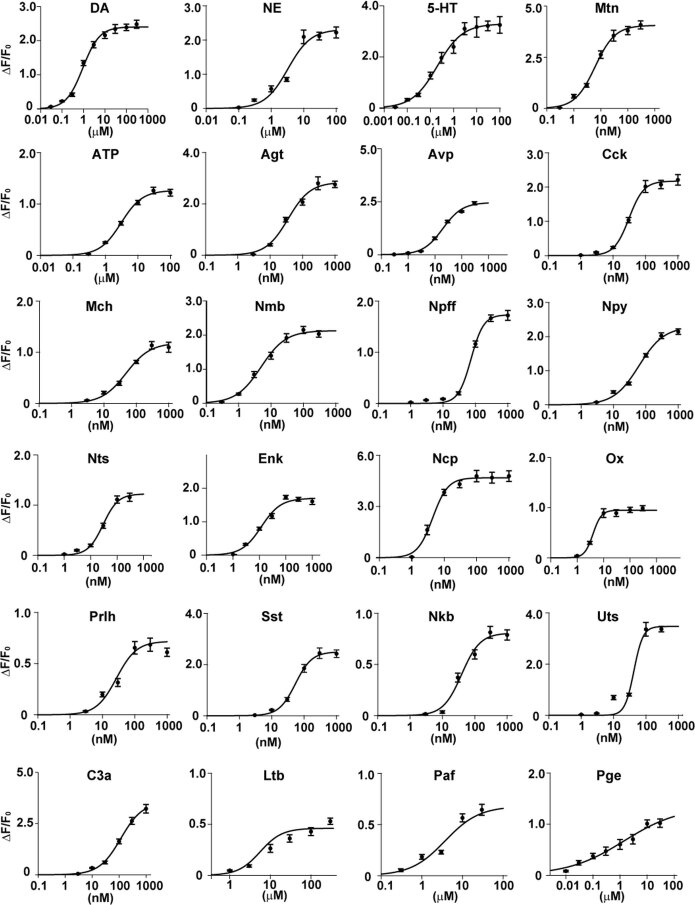
MTRIA was able to successfully produce a sensitive optical readout of OTR activation; therefore, we examined whether MTRIA was also able to detect ligand-binding-induced conformational changes of other GPCRs (Fig. 6a). We cloned 184 receptors for 46 ligands derived from human, mouse, zebrafish or medaka and conjugated MTRIA to a region ranging from position 5.62 of TM5 to position 6.36 of TM6 in the receptors (Extended Data Fig. 2a). To our surprise, almost 30% of the engineered sensors (54 of 184 proteins) showed a marked fluorescence increase (>50% ΔF/F0) upon stimulation with high concentrations of their specific ligand (Fig. 6b). In Extended Data Fig. 9 and Supplementary Table 1, we named the 24 sensors that showed the largest fluorescence response among the sensors sharing the same ligand MTRIA sensors (for example, a sensor for dopamine was called MTRIADA). We hope that this approach, the MTRIA system, will help accelerate the engineering of various GPCR-based sensors.
Fig. 6. Development of various G-protein-coupled receptor-based sensors by conjugation with MTRIA.

a, Schematic illustrating the development of MTRIA sensors. b, ΔF/F0 values are given as the mean ± s.e.m. (n = 5 cells for each group). Sensors with ΔF/F0 > 0.5 are colored either red or orange. Sensors with the best performance among receptors sharing the same ligand are colored red.
Extended Data Fig. 9. Dose-response curves of MTRIA sensors.
Dose-response curves of the fluorescent sensors for 24 ligands that were examined in HEK293T cells. Data are shown as mean ± SEM (n = 10 cells for each data point). Ligands were as follows: dopamine (DA), norepinephrine (NE), serotonin (5-HT), melatonin (Mtn), adenosine 5′-triphosphate (ATP), angiotensin (Agt), arginine-vasopressin (Avp), cholecystokinin (Cck), melanin-concentrating hormone (Mch), neuromedin B (Nmb), neuropeptide FF (Npff), neuropeptide Y (Npy), neurotensin (Nts), enkephalin (Enk), nociception (Ncp), orexin (Ox), prolactin-releasing hormone (Prlh), somatostatin (Sst), neurokinin B (Nkb), urotensin (Uts), complement component C3a (C3a), leukotriene B (Ltb), platelet-activating factor (Paf), and prostaglandin E (Pge).
Discussion
In this study, we described the development and application of a fluorescent sensor for OT, MTRIAOT. MTRIAOT-mediated in vivo fluorescence recording can report artificially evoked OT responses as well as endogenously controlled OT signals with a fast temporal resolution.
Although the impacts of exogenous OT administration on mood and emotions are expected to lead to treatments for psychiatric disorders, direct evidence for an increase in brain OT levels following peripheral OT administration remains limited. However, neither intranasal nor intraperitoneal administration of a relatively large amount had a substantial effect on OT levels in the AON. Further validation is needed to clarify whether this is the case for other brain regions.
Our in vivo measurements using MTRIAOT revealed OT oscillation, ultradian OT rhythms with intervals of approximately 2 h in the brains of adult mice. These type of OT dynamics have not been reported using conventional approaches, such as microdialysis, presumably because of the limited sampling rate and sensitivity. Future efforts are needed to clarify the regulatory mechanism and physiological significance of OT oscillation. Given that hormones associated with appetite and metabolism can stimulate OT release38,41, the rhythmic activities of brain OT signals may be autonomically controlled via interoceptive signals associated with feeding behaviors. Our observations of disturbance in the patterns of OT oscillation by food deprivation and aging support this idea.
An issue to be addressed in the future is the quantitative measurement of OT concentrations in the living brain. This will help to directly compare data acquired from different measurement sites, in different animals, or from different experimental setups. Development of next-generation OT sensors dependent on changes in quantitative fluorescence parameters (for example, fluorescence lifetime and efficiency of Förster resonance energy transfer)42,43 will offer an opportunity for real-time monitoring of absolute OT quantities in the living brain.
Overall, our MTRIAOT-mediated measurements provide information about OT dynamics in the brain. Moreover, our analyses indicate that patterns of OT dynamics in the brain can be affected by anesthesia, food deprivation and aging. Therefore, it is important to carefully consider the experimental conditions and state of participants when interpreting OT measurement data in the brain. Indeed, context-dependent and participant-dependent inconsistencies regarding the effects of OT in human clinical trials44 may be related to such parameters. The use of MTRIAOT will allow us to extend our knowledge of brain OT dynamics and its association with complex behaviors.
Methods
DNA constructs
DNA encoding GPCRs, a red fluorescent Ca2+ sensor jRGECO1a45 and PM-targeted mScarlet46 (mScamem) were amplified by PCR and then subcloned into the pCIS vector, a CAG promoter-driven expression vector47. Template DNA for GPCRs was prepared using the following four approaches. First, cDNA libraries of a mouse (Mus musculus) brain, zebrafish (Danio rerio) brain and medaka (Oryzias latipes) brain were prepared using an RNeasy Kit (Qiagen) and QuantiTect Reverse Transcription Kit (Qiagen). Second, genomic DNA of human (Homo sapiens) and mouse were isolated from HEK293T cells and a mouse brain, respectively. Third, gene fragments of OTRs derived from chicken (Gallus gallus), snake (Notechis scutatus) and frog (Xenopus laevis) were synthesized by Integrated DNA Technologies. Finally, for cloning of human dopamine receptor DRD1, human muscarinic receptor CHRM3 and human adrenergic receptor ADRA2A, plasmids encoding dLight1.1, GACh2.0 and GRABNE1m were used as templates, respectively14–16. GPCRs used in Fig. 6 and the primer pairs for their cloning are listed in Supplementary Table 2. To assess localization of OTRs in HEK293T cells, a human influenza hemagglutinin (HA)-tag was added to the N-terminal regions of OTRs using PCR. For the construction of green fluorescent transmitter sensors, cpGFPs derived from GCaMP6s were inserted into the IL3 regions of GPCRs using either overlap extension PCR48 or the Gibson assembly protocol49. For mutant sensor screening, site-directed mutagenesis was performed using primers containing mutated nucleotide(s). In particular, randomized site-directed mutagenesis was achieved using primers containing randomized codons (NNN). For the construction of plasmid DNA in the β-arrestin recruitment assay, fragments of NanoLuc—SmBit and LgBit—were amplified from pNL1.1 (Promega). Subsequently, they were fused with the C terminus of the OTR and the N terminus of rat β-arrestin50, followed by cloning into the pCIS vector. For the construction of transfer plasmid DNA for AAVs, MTRIAOT, MTRIAOT-mut and jGCaMP8s were cloned into the pAAV Syn woodchuck hepatitis virus posttranscriptional regulatory element (WPRE) vector, a plasmid driven by a human synapsin promoter. In addition, mSca, TeLC-P2A-mSca and ChRmine–mSca were cloned into the pAAV-OTp-WPRE vector, a plasmid driven by the mouse OT promoter.
Cell culture
HEK293T cells were cultured in DMEM (FUJIFILM Wako) supplemented with 10% fetal bovine serum (Thermo Fisher Scientific), 100 U ml−1 penicillin and 100 µg ml−1 streptomycin at 37 °C under a humidified atmosphere of 5% CO2 and 95% air. For fluorescence microscopy observations, cells were transfected with 1 µg of plasmid using 2 µg of a polyethylenimine-based transfection reagent (PEI MAX; Polysciences) and seeded onto either glass-bottom dishes or glass-bottom chambers (Matsunami) coated with collagen (Nitta Gelatin). After a 3-h incubation, the medium was changed, and cells were further cultured for 24–36 h before imaging experiments. Rat primary cultured neurons were prepared from the hippocampus of embryonic day 19–20 Sprague Dawley rats (CLEA Japan). Briefly, the dissected hippocampus was digested in Hanks’ Balanced Salt Solution (HBSS) containing 1 unit per ml of papain (Sigma), 0.45 mg ml−1 l-cysteine (FUJIFILM Wako) and 0.1 mg ml−1 DNase I (FUJIFILM Wako) at 37 °C for 30 min and then passed through a 70-μm nylon mesh. Isolated cells were resuspended in Neurobasal Medium (Thermo Fisher Scientific) containing NeuroBrew 21 (1:50 dilution; Miltenyi), GlutaMax (1:100 dilution; Thermo Fisher Scientific), 100 U ml−1 penicillin and 100 µg ml−1 streptomycin and were seeded on glass-bottom dishes coated with laminin (FUJIFILM Wako) and poly-l-lysine (FUJIFILM Wako). After 3 d in vitro, fresh medium, an AAV for MTRIAOT transduction and cytosine-1-β-d-arabinofuranoside (final 5 µM; FUJIFILM Wako) were applied. Then, half the amount of medium was replaced every 7 d until experiments were conducted at 12–19 d in vitro.
Adeno-associated virus production
HEK293T cells were simultaneously transfected with pHelper, XR8 and a transfer plasmid using PEI MAX transfection reagent, except for production of a viral vector for jGCaMP8s where XR9 was used instead of XR8. After overnight incubation, the medium was changed. Supernatant was collected at 48-h and 96-h time points, after medium exchange. Viral particles were purified using a polyethylene glycol-mediated precipitation method51. Purified viral particles were then concentrated using an ultrafiltration membrane unit (Amicon Ultra; EMD Millipore). Virus titers were determined by quantitative PCR using a pair of primers for the WPRE sequence (forward, actgtgtttgctgacgcaac; reverse, agcgaaagtcccggaaag). Viral vectors with titers > 1012 gc per ml were used for fiber photometry measurements.
Immunostaining of transfected cells
For immunostaining analysis of the cellular localization of OTRs, HEK293T cells co-transfected with an HA-tagged OTR and mScamem (10:1 ratio) were fixed in PBS (FUJIFILM Wako) containing 4% (wt/vol) paraformaldehyde for 10 min at room temperature. Next, cells were permeabilized and blocked for 30 min at room temperature in blocking solution (PBS containing 0.2% TritonX-100 and 5% normal goat serum (FUJIFILM Wako)) and then incubated with an anti-HA antibody (rabbit; MBL; 1:2,000 dilution) for 30 min at room temperature. After washing with PBS containing 0.1% TritonX-100 (PBST), samples were incubated with Alexa 488-conjugated anti-rabbit IgG antibody (goat; Jackson ImmunoResearch) for 30 min at room temperature. After three washes with PBST, stained cells in PBS were analyzed by microscopy.
Sensor screening and evaluation by fluorescence microscopy
Fluorescence images in Figs. 1 and 6 and Extended Data Figs. 1, 3a–e, 5 and 9 were obtained using Dragonfly 301, a spinning-disk confocal microscope system (Andor Technology) equipped with a Nikon Eclipse Ti2, lasers (405, 488, 561 and 637 nm), emission filters (450 ± 25 nm for the 405-nm laser, 525 ± 25 nm for the 488-nm laser, 600 ± 25 nm for the 561-nm laser and 700 ± 37.5 nm for the 637-nm laser) and an electron multiplication charge-coupled device camera (iXon Life 888; Andor Technology). The system was controlled by Fusion software (Andor). Either a dry objective lens (CFI PLAN APO ×20, NA 0.75; Nikon) or a water-immersion lens (CFI Plan Apo IR 60XC WI, NA 1.27; Nikon) was used.
The fluorescence images in Fig. 2g and Extended Data Figs. 3f,g, 4 and 6–8 were obtained using SpinSR10, a spinning-disk confocal microscope system (Olympus) equipped with lasers (at 405, 488, 561 and 637 nm; Coherent), a scanner unit (CSU-W1 SoRa; Yokogawa) and a complementary metal oxide semiconductor camera (Orca Flash 4.0, Hamamatsu Photonics). The system was controlled by cellSens software (Olympus). An objective lens (UPlanSApo ×10, NA 0.40; UPlanSApo ×20, NA 0.75; or UPlanSApo ×30, NA 1.05 Sil; Olympus) was used. For live-imaging experiments, data were acquired either every 100 ms (for kinetic analysis in Extended Data Figs. 3f and 4e,f) or every 5 s (for other experiments). In these experiments, laser power was 200 µW or less at the front aperture of the objective lens, and no apparent photobleaching was observed with these conditions. Therefore, we did not conduct photobleaching correction. To analyze the cellular localization of fluorescent sensors, z-stack images were acquired at 0.5-µm steps. For the screening of fluorescent sensors, transfected cells seeded onto glass-bottomed chamber slides were soaked in 200 µl of artificial extracellular solution (ECS; 150 mM NaCl, 4 mM KCl, 2 mM CaCl2, 1 mM MgCl2, 5 mM HEPES and 5.6 mM glucose; pH 7.4). Cells were then stimulated with 200 µl of drug-containing ECS, in which the drug concentration was twice the final concentration, administered through a pipette. To analyze the ligand dose–response curves of fluorescent sensors, time constants of fluorescent responses, intracellular Ca2+ responses, pH sensitivity and long-term signal stability, transfected cells were seeded onto a collagen-coated glass-bottomed dish and continuously perfused with ECS. Cells were then rapidly stimulated with drug-containing solution using a custom-made perfusion system equipped with solenoid valves. For the measurement of kinetic time constants, the tip of the perfusion system was placed as close to the imaged cells as possible. Data were processed using Fiji software52 and Excel (Microsoft), and fitting of fluorescence traces was conducted using Python modules. After conducting background subtraction, fluorescence signal (F) on a single cell was obtained. Signals were normalized to ΔF/F0 defined by (F − F0)/F0 where F0 is the fluorescence value just before stimulation. Fluorescence traces were not smoothed. Values of ΔF/F0 in Figs. 1e,h and 6b, and Extended Data Figs. 3b,g, 4c,d, 7b,d and 9 were quantified as the tail values at the end of drug stimulation. Values of peak ΔF/F0 in Fig. 1g and Extended Data Fig. 3c were quantified as the maximum values during drug stimulation. Parameters of dose–response curves (Fmax and EC50 in Fig. 1h, Extended Data Figs. 3b and 4d and Supplementary Table 1) were obtained by fitting the data to the Hill equation. Time constants (τon and τoff) in Extended Data Figs. 3f and 4e,f were calculated by fitting rise and decay phases with single-exponential functions, respectively.
β-arrestin recruitment assay
The recruitment of β-arrestin to meOTR and MTRIAOT was assessed using a split-luciferase complementation assay. HEK293T cells that were seeded onto an opaque 96-well plastic plate were co-transfected with LgBit-arrestin and either meOTR-SmBit or MTRIAOT-SmBit using PEI MAX reagent. Twenty-four hours after transfection, cells were washed with HBSS and stimulated with HBSS containing 100 nM OT. After the addition of a luciferase substrate (ONE-Glo Luciferase Assay System, Promega), luminescence was measured using a plate reader (Infinite 200 Pro F Plex; Tecan).
Reagents
OT, angiotensin (Agt), [Arg8]-vasopressin (Avp), bradykinin (Bdk), cholecystokinin (Cck), corticotropin-releasing hormone (Crh), endothelin-1 (ET-1), galanin (Gal), ghrelin (Ghr), α-melanocyte stimulating hormone (Msh), melanin-concentrating hormone (Mch), neuromedin B (Nmb), neuromedin U (NmU), neuropeptide Y (Npy), neurotensin (Nts), met-enkephalin (Enk), nociceptin (Ncp), orexin B (Ox), prolactin-releasing hormone (Prlh), parathormone (Pth), somatostatin (Sst), substance P (SP), neurokinin B (Nkb) and urotensin (Uts) were purchased from Peptide Institute. L-368,899 hydrochloride, neuropeptide FF (NpFF), sphingosine-1-phosphate (S1P), uridine 5′-diphosphate disodium salt (UDP) and anandamide (Ana) were purchased from Tocris Bioscience. Isotocin, C3a anaphylatoxin (C3a), and C5a anaphylatoxin (C5a) were purchased from Bachem. Vasotocin and thrombin receptor agonist (Thr) were purchased from Anygen, and inotocin was purchased from Phoenix Pharmaceuticals. Histamine disodium salt (His) and melatonin (Mtn) were purchased from FUJIFILM Wako. Leukotriene B4 (Ltb), leukotriene E4 (Lte), 1-oleoyl lysophosphatidic acid (LPA), platelet-activating factor C-16 (PAF) and prostaglandin F2a (Pgf) were purchased from Cayman Chemicals. Prostaglandin D2 (Pgd), prostaglandin E2 (Pge), prostaglandin I2 sodium salt (Pgi), 5-hydroxytryptamine hydrochloride (5-HT), dopamine hydrochloride (DA), acetylcholine chloride (ACh) and adenosine 5′-triphosphate disodium salt (ATP) were purchased from Nacalai. Epinephrine was purchased from Daiichi-Sankyo and norepinephrine (NE) was purchased from Alfresa Pharma Corporation. Nematocin was synthesized by Cosmo Bio. The final concentrations of applied ligands in Fig. 6b were as follows; 100 µM: DA, NE, ACh, His, 5-HT, ATP, UDP and Ado; 1 µM: Enk, C3a, Ana, LPA, PAF, Pgd, Pge, Pgf and Pgi; and 100 nM: Mtn, Agt, Avp, Bdk, Cck, Crh, ET-1, Gal, Ghr, Msh, Mch, Nmb, NmU, NpFF, Npy, Nts, Ncp, Ox, Prlh, Pth, Sst, SP, Nkb, Uts, C5a, Thr, S1P, Ltb and Lte.
Animal surgery
Animal experiments were reviewed and approved by Institutional Animal Use and Care Committees of Kanazawa University and Osaka University. All animal procedures were conducted in accordance with the guidelines of Kanazawa University and Osaka University. C57BL/6J or C57BL/6N female mice at 6–8 weeks, 6 months, 1 year or 2.5 years of age were purchased from CLEA Japan. Mice were kept in cages at 23 ± 1.5 °C with 45% ± 15% humidity under a regular 12-h dark/light cycle with ad libitum access to food and water. Stereotaxic surgery was performed under anesthesia with isoflurane (FUJIFILM Wako). The depth of anesthesia was assessed using the tail pinch method. Body temperature was maintained using a heating pad. One microliter of AAV suspension within a glass micropipette was injected into the corresponding site(s); left medial AON (2.2 mm anteroposterior (AP) and 0.3 mm mediolateral (ML) from bregma, and −4.0 mm dorsoventral (DV) from the skull surface), left and right PVN (−0.8 mm AP, ±0.3 mm ML and −4.8 mm DV), and right central nucleus of the amygdala (−1.3 mm AP, 2.5 mm ML and −4.5 mm DV). After the virus injection, a fiber-optic cannula with a 400-µm core diameter and 0.39 NA (CFMC14L05; Thorlabs) was implanted ~0.2 mm above the injection site. For optogenetic experiments, a cannula was unilaterally implanted above the injection site of the right PVN. For intracerebroventricular injection experiments, a stainless-steel cannula fabricated from a 22-gauge needle was additionally inserted into the right lateral ventricle (−0.7 mm AP, 1.5 mm ML and −2.5 mm DV). To fix and protect the implanted cannula(s), dental cement (Ketac Cem Easymix; 3 M) and silicone rubber (Body Double; Smooth-On) were used. Carprofen (5 mg per kg body weight; intraperitoneal), a nonsteroidal anti-inflammatory drug, and buprenorphine (0.1 mg per kg body weight, intraperitoneal), an opioid analgesic, were administered after the surgery. At 2 weeks or more following AAV injection, mice were used for fiber photometry experiments. On the measurement day, the cannula for fiber photometry recording was coupled to a patch cable (M79L01; Thorlabs) via an interconnector (ADAF1 or ADAF2; Thorlabs). For optogenetic experiments, the cannula for optogenetic stimulation was additionally connected to a red laser (OBIS LX, 647 nm, 100 mW; Coherent) through a patch cable (MAF3L1; Thorlabs) equipped with an interconnector (ADAF1).
Fiber photometry measurements
The fiber photometry setup (Extended Data Fig. 5a) was constructed as previously described, with a minor modification53. Excitation light from a light-emitting diode (LED) was directed into a patch cable (M79L01) through an objective lens (CFI Plan Fluor ×20 lens; Nikon), and the emission light was projected onto the sensor of a scientific complementary metal oxide semiconductor camera (Zyla 4.2 P; Andor Technology) after passing through a dichroic mirror (Di01-R405/488/561/635-25×36; Semrock) and emission filter (YIF-BA510-550S; SIGMA KOKI). To acquire an OT-dependent signal and isosbestic signal, two different LED light sources—a 470-nm light (light from M470F3 filtered with FB470-10, 4 µW at the fiber tip; Thorlabs) and 405-nm light (light from M405FP1 filtered with FB410-10, 4 µW at the fiber tip; Thorlabs)—were alternatively switched. Data were acquired at 2-s intervals with an LED light exposure of 0.3 s except for measurements of fast responses (Fig. 2f–j and 4e–h), where data were acquired at 0.5-s intervals with an LED light exposure of 0.08 s. In these experimental conditions, no apparent photobleaching was observed. Therefore, we did not conduct photobleaching correction. Device control and data acquisition were conducted using a custom-made LabVIEW program (National Instruments). Experiments were conducted within a cage (270-mm width, 440-mm length and 187-mm height), and the environment around the cage was captured every 1 s using an overhead camera (BFS-U3-I3Y3-C; FLIR Systems). To visualize the behaviors of mice and timing of simulations in the dark environment, light from an infrared LED array (AE-LED56V2; Akizuki) was used. Unless stated otherwise, mice were kept in freely behaving conditions and fed standard pellet and water ad libitum during measurements. For recording of social stimulation-induced OT responses (Fig. 4a–d), a cylindrical wire cage (10-cm diameter and 10-cm height) containing either a mouse or a toy was exposed to a mouse at the indicated times. Similarly, for recording acute stress-induced OT responses (Fig. 4e–h), the tail of a mouse was lifted for 10 s at the indicated times. To assess OT responses upon exogenous OT administration (Fig. 2a–e) and the impact of mix-anes (Fig. 5a,b), mice were anesthetized by intraperitoneal administration of a mixture of 0.375 mg per kg body weight dexmedetomidine hydrochloride, 2 mg per kg body weight midazolam and 2.5 mg per kg body weight butorphanol tartrate. For recovery from the above anesthesia, 0.75 mg per kg body weight atipamezole hydrochloride was administrated intraperitoneally. Before starting optogenetic experiments (Fig. 2f–j) and assessment of the impact of isoflurane (Fig. 5c,d), mice were placed on a heat pad and maintained with 1% isoflurane for at least for 20 min to stabilize the fluorescence signal of MTRIAOT. Data were processed using Fiji software and Excel (Microsoft), and kinetic parameters were calculated using Python modules. After conducting background subtraction, the fluorescence signal (F) was normalized to z-scores defined by (F − Fmean)/Fsd, where Fmean and Fsd are the mean and standard deviation of resting fluorescence signals at baseline, respectively. Resting fluorescence signals were taken for the indicated period as follows: 5 s (Fig. 4f–h), 10 s (Fig. 2h–j), 1 min (Fig. 4b–d), 5 min (Fig. 5c,d and Extended Data Fig. 8b) and 10 min (Figs. 2b–e, 3 and 5e–h). Data were not smoothed except for the fluorescence traces in optogenetic experiments (Fig. 2h–j). For analysis of fluorescence signals in optogenetic experiments, data were filtered using a moving average filter with a kernel (1/5, 1/5, 1/5, 1/5, 1/5) to improve the quality of single-exponential fitting. Time constants (τon and τoff in Fig. 2j and Rise τ in Fig. 3d) were calculated by fitting either the rise phase or the decay phase with a single-exponential function. Time to peak in Fig. 4h was obtained as a period from the beginning of tail lift to the time point of maximal z-score. AUC values in Figs. 2i and 4c,g were calculated by integrating the values of z-score for 30 s, and 5 min and 10 s, respectively. Z-scores in Figs. 2c and 5d were quantified as the tail values at the end of the indicated stimulation. Peak z-scores in Fig. 2e and Extended Data Fig. 8b were quantified as the peak values following stimulation. The remaining peak z-scores (Figs. 3c,h and 5h) and minimum z-scores (Fig. 5a,f) were obtained as 10-min average values around the peak and the minimum of transient OT responses, respectively. The numbers of peaks in Figs. 3g and 5h were calculated as an occurrence of transient signal with an amplitude exceeding a z-score of 3.
Immunohistochemistry
Immunohistochemical experiments were performed to confirm sensor expression and cannula insertion sites after fiber photometry measurements and to assess the specificity of OTp-mediated gene transduction. The brains of anesthetized mice were rapidly removed after decapitation, immersed in PBS containing 4% (wt/vol) paraformaldehyde overnight at 4 °C, and then incubated in PBS containing 20% (wt/vol) sucrose overnight at 4 °C. After embedding in Optimal Cutting Temperature Compound (Sakura Finetek), coronal sections of brains were cut at either a 50-µm (for anti-GFP antibody staining) or a 30-µm (for anti-OT antibody staining) thickness using a cryostat (CM1950; Leica Microsystems). For immunostaining, sections were permeabilized in blocking solution for 30 min at room temperature and then incubated with either anti-GFP antibody (rabbit; MBL; 1:1000 dilution) or anti-OT antibody (rabbit; Abcam; 1:200 dilution) overnight at 4 °C. After three washes with PBST, sections were incubated with Alexa 488-conjugated anti-rabbit IgG antibody (goat; Jackson ImmunoResearch; 1:2,000 dilution) for 40 min at room temperature. After three washes with PBST and three washes with PBS, samples were mounted in polyvinyl alcohol-based mounting medium containing 1 µg ml−1 DAPI (FUJIFILM Wako) and 2.5% (wt/vol) 1,4-diazabicyclo[2.2.2]octane (Sigma) as an anti-fade reagent. Stained sections were then imaged using a spinning-disk confocal microscope system (either Dragonfly 301 or SpinSR10). Mice with misplaced cannula were excluded from analysis.
Statistics and reproducibility
All summary data are expressed as either the mean ± s.e.m. or mean ± s.d. For comparisons of two groups, we used two-tailed Student’s t-tests. One-way ANOVA was performed when more than two groups were compared, followed by Tukey–Kramer, Bonferroni’s or Dunnett’s post hoc test. Throughout the study, P < 0.05 was considered statistically significant. Data distribution was assumed to be normal, and variance was similar between groups that were statistically compared. No statistical methods were used to predetermine sample sizes, but our sample sizes were similar to those generally used in the field13–17. Regarding the representative data in Figs. 1e, 2g and 4e and Extended Data Figs. 4a,b, 5b, 6 and 8a, we repeated the experiments two or more times and obtained similar results.
Reporting summary
Further information on research design is available in the Nature Research Reporting Summary linked to this article.
Online content
Any methods, additional references, Nature Research reporting summaries, source data, extended data, supplementary information, acknowledgements, peer review information; details of author contributions and competing interests; and statements of data and code availability are available at 10.1038/s41592-022-01597-x.
Supplementary information
Supplementary Notes 1–4 and Supplementary Tables 1 and 2.
Acknowledgements
We thank the members of the Nishiyama and Hibino laboratories for their helpful discussions, C. Tambo for technical assistance, D. Gadella (University of Amsterdam) for sharing pmScarlet_C1 (Addgene plasmid no. 85042), D. Kim and the GENIE Project (Janelia Research Campus) for sharing pGP-CMV-NES-jRGECO1a (Addgene plasmid no. 61563) and pGP-AAV-syn-jGCaMP8s-WPRE (Addgene plasmid no. 162374), Y. Li (Peking University) for sharing pAAV-hSyn-GRAB_NE1m (Addgene plasmid no. 123308) and pDisplay-GACh2.0 (Addgene plasmid no. 106073), L. Tian (UC Davis) for sharing pCMV-dLight1.1 (Addgene plasmid no. 111052), R. Lefkowitz (Duke University) for sharing β-arrestin2 GFP WT (Addgene plasmid no. 35411) and K Deisseroth (Stanford University) for sharing pAAV-hSyn-ChRmine–mScarlet-WPRE (Addgene plasmid no. 130994). This work was supported by grants from JSPS-KAKENHI to D.I. (18K15036 and 21K06421); AMED-CREST to H.H. (21gm1510004); PRIME to M.N. (JP19gm6310008); JST Moonshot R&D to H.H. (JPMJMS2024); Takeda Science Foundation to D.I.; LOTTE Foundation to D.I.; Research Foundation for Opto-Science and Technology to D.I.; Konica Minolta Science and Technology Foundation to D.I.; Salt Science Research Foundation to D.I.; and Hokuriku Bank to D.I.
Extended data
Source data
Statistical source data.
Statistical source data.
Statistical source data.
Statistical source data.
Statistical source data.
Statistical source data.
Statistical source data.
Statistical source data.
Statistical source data.
Statistical source data.
Statistical source data.
Statistical source data.
Author contributions
D.I. conceived the project, performed the experiments and analyzed the data. Y.T. contributed to the microscopy analysis. D.I., H.H. and M.N. discussed the results and wrote the manuscript.
Peer review
Peer review information
Nature Methods thanks Hyung-Bae Kwon and the other, anonymous, reviewer(s) for their contribution to the peer review of this work. Primary Handling Editor: Nina Vogt, in collaboration with the Nature Methods team.
Data availability
DNA sequences of the sensors developed in this study have been deposited at DNA Data Bank of Japan (accession nos. LC720900–LC720924). Plasmid DNAs are available from either Addgene (plasmid nos. 184594–184620) or the corresponding author. The raw data for fluorescence recordings are not suitable for distribution through public repositories due to the large file size and are available from the corresponding author upon reasonable request. Source data are provided with this paper.
Code availability
Custom LabView codes used for data acquisition are available at https://github.com/daisukeino/MTRIAOT/.
Competing interests
The authors declare no competing interests.
Footnotes
Publisher’s note Springer Nature remains neutral with regard to jurisdictional claims in published maps and institutional affiliations.
Extended data
is available for this paper at 10.1038/s41592-022-01597-x.
Supplementary information
The online version contains supplementary material available at 10.1038/s41592-022-01597-x.
References
- 1.Jurek B, Neumann ID. The oxytocin receptor: from intracellular signaling to behavior. Physiol. Rev. 2018;98:1805–1908. doi: 10.1152/physrev.00031.2017. [DOI] [PubMed] [Google Scholar]
- 2.Cochran DM, Fallon D, Hill M, Frazier JA. The role of oxytocin in psychiatric disorders: a review of biological and therapeutic research findings. Harv. Rev. Psychiatry. 2013;21:219–247. doi: 10.1097/HRP.0b013e3182a75b7d. [DOI] [PMC free article] [PubMed] [Google Scholar]
- 3.Huffmeijer R, van Ijzendoorn MH, Bakermans-Kranenburg MJ. Ageing and oxytocin: a call for extending human oxytocin research to ageing populations—a mini-review. Gerontology. 2013;59:32–39. doi: 10.1159/000341333. [DOI] [PubMed] [Google Scholar]
- 4.Kosfeld M, Heinrichs M, Zak PJ, Fischbacher U, Fehr E. Oxytocin increases trust in humans. Nature. 2005;435:673–676. doi: 10.1038/nature03701. [DOI] [PubMed] [Google Scholar]
- 5.Leng G, Ludwig M. Intranasal oxytocin: myths and delusions. Biol. Psychiatry. 2016;79:243–250. doi: 10.1016/j.biopsych.2015.05.003. [DOI] [PubMed] [Google Scholar]
- 6.McCullough ME, Churchland PS, Mendez AJ. Problems with measuring peripheral oxytocin: can the data on oxytocin and human behavior be trusted. Neurosci. Biobehav. Rev. 2013;37:1485–1492. doi: 10.1016/j.neubiorev.2013.04.018. [DOI] [PubMed] [Google Scholar]
- 7.Keech B, Crowe S, Hocking DR. Intranasal oxytocin, social cognition and neurodevelopmental disorders: a meta-analysis. Psychoneuroendocrinology. 2018;87:9–19. doi: 10.1016/j.psyneuen.2017.09.022. [DOI] [PubMed] [Google Scholar]
- 8.Declerck CH, Boone C, Pauwels L, Vogt B, Fehr E. A registered replication study on oxytocin and trust. Nat. Hum. Behav. 2020;4:646–655. doi: 10.1038/s41562-020-0878-x. [DOI] [PubMed] [Google Scholar]
- 9.Neumann I, Ludwig M, Engelmann M, Pittman QJ, Landgraf R. Simultaneous microdialysis in blood and brain: oxytocin and vasopressin release in response to central and peripheral osmotic stimulation and suckling in the rat. Neuroendocrinology. 1993;58:637–645. doi: 10.1159/000126604. [DOI] [PubMed] [Google Scholar]
- 10.Hattori T, Morris M, Alexander N, Sundberg DK. Extracellular oxytocin in the paraventricular nucleus: hyperosmotic stimulation by in vivo microdialysis. Brain Res. 1990;506:169–171. doi: 10.1016/0006-8993(90)91216-4. [DOI] [PubMed] [Google Scholar]
- 11.Artman HG, et al. Characterization of the daily oxytocin rhythm in primate cerebrospinal fluid. J. Neurosci. 1982;2:598–603. doi: 10.1523/JNEUROSCI.02-05-00598.1982. [DOI] [PMC free article] [PubMed] [Google Scholar]
- 12.Mignocchi, N., Krüssel, S., Jung, K., Lee, D. & Kwon, H. -B. Development of a genetically-encoded oxytocin sensor. Preprint at bioRxiv10.1101/2020.07.14.202598 (2020).
- 13.Sun F, et al. A genetically encoded fluorescent sensor enables rapid and specific detection of dopamine in flies, fish, and mice. Cell. 2018;174:481–496. doi: 10.1016/j.cell.2018.06.042. [DOI] [PMC free article] [PubMed] [Google Scholar]
- 14.Patriarchi, T. et al. Ultrafast neuronal imaging of dopamine dynamics with designed genetically encoded sensors. Science10.1126/science.aat4422 (2018) [DOI] [PMC free article] [PubMed]
- 15.Feng J, et al. A genetically encoded fluorescent sensor for rapid and specific in vivo detection of norepinephrine. Neuron. 2019;102:745–761. doi: 10.1016/j.neuron.2019.02.037. [DOI] [PMC free article] [PubMed] [Google Scholar]
- 16.Jing M, et al. An optimized acetylcholine sensor for monitoring in vivo cholinergic activity. Nat. Methods. 2020;17:1139–1146. doi: 10.1038/s41592-020-0953-2. [DOI] [PMC free article] [PubMed] [Google Scholar]
- 17.Peng, W. et al. Regulation of sleep homeostasis mediator adenosine by basal forebrain glutamatergic neurons. Science10.1126/science.abb0556 (2020). [DOI] [PubMed]
- 18.Dong A, et al. A fluorescent sensor for spatiotemporally resolved imaging of endocannabinoid dynamics in vivo. Nat. Biotechnol. 2021 doi: 10.1038/s41587-021-01074-4. [DOI] [PMC free article] [PubMed] [Google Scholar]
- 19.Jing M, et al. A genetically encoded fluorescent acetylcholine indicator for in vitro and in vivo studies. Nat. Biotechnol. 2018;36:726–737. doi: 10.1038/nbt.4184. [DOI] [PMC free article] [PubMed] [Google Scholar]
- 20.Wan J, et al. A genetically encoded sensor for measuring serotonin dynamics. Nat. Neurosci. 2021;24:746–752. doi: 10.1038/s41593-021-00823-7. [DOI] [PMC free article] [PubMed] [Google Scholar]
- 21.Waltenspuhl Y, Schoppe J, Ehrenmann J, Kummer L, Pluckthun A. Crystal structure of the human oxytocin receptor. Sci. Adv. 2020;6:eabb5419. doi: 10.1126/sciadv.abb5419. [DOI] [PMC free article] [PubMed] [Google Scholar]
- 22.Newmaster KT, et al. Quantitative cellular-resolution map of the oxytocin receptor in postnatally developing mouse brains. Nat. Commun. 2020;11:1885. doi: 10.1038/s41467-020-15659-1. [DOI] [PMC free article] [PubMed] [Google Scholar]
- 23.Oettl LL, et al. Oxytocin enhances social recognition by modulating cortical control of early olfactory processing. Neuron. 2016;90:609–621. doi: 10.1016/j.neuron.2016.03.033. [DOI] [PMC free article] [PubMed] [Google Scholar]
- 24.Kendrick KM, Keverne EB, Baldwin BA. Intracerebroventricular oxytocin stimulates maternal behaviour in the sheep. Neuroendocrinology. 1987;46:56–61. doi: 10.1159/000124796. [DOI] [PubMed] [Google Scholar]
- 25.Pedersen CA, Ascher JA, Monroe YL, Prange AJ., Jr. Oxytocin induces maternal behavior in virgin female rats. Science. 1982;216:648–650. doi: 10.1126/science.7071605. [DOI] [PubMed] [Google Scholar]
- 26.Williams JR, Insel TR, Harbaugh CR, Carter CS. Oxytocin administered centrally facilitates formation of a partner preference in female prairie voles (Microtus ochrogaster) J. Neuroendocrinol. 1994;6:247–250. doi: 10.1111/j.1365-2826.1994.tb00579.x. [DOI] [PubMed] [Google Scholar]
- 27.Huang H, et al. Chronic and acute intranasal oxytocin produce divergent social effects in mice. Neuropsychopharmacology. 2014;39:1102–1114. doi: 10.1038/npp.2013.310. [DOI] [PMC free article] [PubMed] [Google Scholar]
- 28.Penagarikano O, et al. Exogenous and evoked oxytocin restores social behavior in the Cntnap2 mouse model of autism. Sci. Transl. Med. 2015;7:271ra278. doi: 10.1126/scitranslmed.3010257. [DOI] [PMC free article] [PubMed] [Google Scholar]
- 29.Marshel, J. H. et al. Cortical layer-specific critical dynamics triggering perception. Science10.1126/science.aaw5202 (2019). [DOI] [PMC free article] [PubMed]
- 30.Knobloch HS, et al. Evoked axonal oxytocin release in the central amygdala attenuates fear response. Neuron. 2012;73:553–566. doi: 10.1016/j.neuron.2011.11.030. [DOI] [PubMed] [Google Scholar]
- 31.Xiao, L., Priest, M. F. & Kozorovitskiy, Y. Oxytocin functions as a spatiotemporal filter for excitatory synaptic inputs to VTA dopamine neurons. Elife10.7554/eLife.33892 (2018). [DOI] [PMC free article] [PubMed]
- 32.Perlow MJ, et al. Oxytocin, vasopressin, and estrogen-stimulated neurophysin: daily patterns of concentration in cerebrospinal fluid. Science. 1982;216:1416–1418. doi: 10.1126/science.7201163. [DOI] [PubMed] [Google Scholar]
- 33.Sweeney ST, Broadie K, Keane J, Niemann H, O’Kane CJ. Targeted expression of tetanus toxin light chain in Drosophila specifically eliminates synaptic transmission and causes behavioral defects. Neuron. 1995;14:341–351. doi: 10.1016/0896-6273(95)90290-2. [DOI] [PubMed] [Google Scholar]
- 34.Hung LW, et al. Gating of social reward by oxytocin in the ventral tegmental area. Science. 2017;357:1406–1411. doi: 10.1126/science.aan4994. [DOI] [PMC free article] [PubMed] [Google Scholar]
- 35.Olff M, et al. The role of oxytocin in social bonding, stress regulation and mental health: an update on the moderating effects of context and interindividual differences. Psychoneuroendocrinology. 2013;38:1883–1894. doi: 10.1016/j.psyneuen.2013.06.019. [DOI] [PubMed] [Google Scholar]
- 36.Muller CP, et al. The in vivo neurochemistry of the brain during general anesthesia. J. Neurochem. 2011;119:419–446. doi: 10.1111/j.1471-4159.2011.07445.x. [DOI] [PubMed] [Google Scholar]
- 37.Richards CD. Anaesthetic modulation of synaptic transmission in the mammalian CNS. Br. J. Anaesth. 2002;89:79–90. doi: 10.1093/bja/aef162. [DOI] [PubMed] [Google Scholar]
- 38.Verbalis JG, McCann MJ, McHale CM, Stricker EM. Oxytocin secretion in response to cholecystokinin and food: differentiation of nausea from satiety. Science. 1986;232:1417–1419. doi: 10.1126/science.3715453. [DOI] [PubMed] [Google Scholar]
- 39.Lawson EA. The effects of oxytocin on eating behaviour and metabolism in humans. Nat. Rev. Endocrinol. 2017;13:700–709. doi: 10.1038/nrendo.2017.115. [DOI] [PMC free article] [PubMed] [Google Scholar]
- 40.Chahal HS, Drake WM. The endocrine system and ageing. J. Pathol. 2007;211:173–180. doi: 10.1002/path.2110. [DOI] [PubMed] [Google Scholar]
- 41.Sabatier N, et al. Alpha-melanocyte-stimulating hormone stimulates oxytocin release from the dendrites of hypothalamic neurons while inhibiting oxytocin release from their terminals in the neurohypophysis. J. Neurosci. 2003;23:10351–10358. doi: 10.1523/JNEUROSCI.23-32-10351.2003. [DOI] [PMC free article] [PubMed] [Google Scholar]
- 42.Waters JC. Accuracy and precision in quantitative fluorescence microscopy. J. Cell Biol. 2009;185:1135–1148. doi: 10.1083/jcb.200903097. [DOI] [PMC free article] [PubMed] [Google Scholar]
- 43.Ravotto L, Duffet L, Zhou X, Weber B, Patriarchi T. A bright and colorful future for G-protein-coupled receptor sensors. Front. Cell Neurosci. 2020;14:67. doi: 10.3389/fncel.2020.00067. [DOI] [PMC free article] [PubMed] [Google Scholar]
- 44.Bartz JA, Zaki J, Bolger N, Ochsner KN. Social effects of oxytocin in humans: context and person matter. Trends Cogn. Sci. 2011;15:301–309. doi: 10.1016/j.tics.2011.05.002. [DOI] [PubMed] [Google Scholar]
- 45.Dana, H. et al. Sensitive red protein calcium indicators for imaging neural activity. Elife10.7554/eLife.12727 (2016). [DOI] [PMC free article] [PubMed]
- 46.Bindels DS, et al. mScarlet: a bright monomeric red fluorescent protein for cellular imaging. Nat. Methods. 2017;14:53–56. doi: 10.1038/nmeth.4074. [DOI] [PubMed] [Google Scholar]
- 47.Ino D, et al. Neuronal regulation of Schwann cell mitochondrial Ca2+ signaling during myelination. Cell Rep. 2015;12:1951–1959. doi: 10.1016/j.celrep.2015.08.039. [DOI] [PubMed] [Google Scholar]
- 48.Higuchi R, Krummel B, Saiki RK. A general method of in vitro preparation and specific mutagenesis of DNA fragments: study of protein and DNA interactions. Nucleic Acids Res. 1988;16:7351–7367. doi: 10.1093/nar/16.15.7351. [DOI] [PMC free article] [PubMed] [Google Scholar]
- 49.Gibson DG, et al. Enzymatic assembly of DNA molecules up to several hundred kilobases. Nat. Methods. 2009;6:343–345. doi: 10.1038/nmeth.1318. [DOI] [PubMed] [Google Scholar]
- 50.Shenoy SK, Lefkowitz RJ. Receptor-specific ubiquitination of beta-arrestin directs assembly and targeting of seven-transmembrane receptor signalosomes. J. Biol. Chem. 2005;280:15315–15324. doi: 10.1074/jbc.M412418200. [DOI] [PubMed] [Google Scholar]
- 51.Guo P, et al. Rapid and simplified purification of recombinant adeno-associated virus. J. Virol. Methods. 2012;183:139–146. doi: 10.1016/j.jviromet.2012.04.004. [DOI] [PMC free article] [PubMed] [Google Scholar]
- 52.Schindelin J, et al. Fiji: an open-source platform for biological-image analysis. Nat. Methods. 2012;9:676–682. doi: 10.1038/nmeth.2019. [DOI] [PMC free article] [PubMed] [Google Scholar]
- 53.Kim CK, et al. Simultaneous fast measurement of circuit dynamics at multiple sites across the mammalian brain. Nat. Methods. 2016;13:325–328. doi: 10.1038/nmeth.3770. [DOI] [PMC free article] [PubMed] [Google Scholar]
Associated Data
This section collects any data citations, data availability statements, or supplementary materials included in this article.
Supplementary Materials
Supplementary Notes 1–4 and Supplementary Tables 1 and 2.
Data Availability Statement
DNA sequences of the sensors developed in this study have been deposited at DNA Data Bank of Japan (accession nos. LC720900–LC720924). Plasmid DNAs are available from either Addgene (plasmid nos. 184594–184620) or the corresponding author. The raw data for fluorescence recordings are not suitable for distribution through public repositories due to the large file size and are available from the corresponding author upon reasonable request. Source data are provided with this paper.
Custom LabView codes used for data acquisition are available at https://github.com/daisukeino/MTRIAOT/.


