

Abstract
Objective
The sensitivity and specificity of current biomarkers for gastric cancer were insufficient. The aim of the present study was to screen novel biomarkers and determine the diagnostic values of ornithine aminotransferase (OAT) and carbamoyl phosphate synthetase 1 (CPS1) for detecting gastric cancer.
Methods
With stable isotope tags, we labelled an initial discovery group of four paired gastric cancer tissue samples and identified with LC‐ESI‐MS/MS. A validation group of 159 gastric cancer samples and 30 healthy controls were used to validate the candidate targets. GSEA was used to explore the pathways activated in gastric cancer.
Results
Four hundred and thirty one proteins were found differentially expressed in gastric cancer tissues. Of these proteins, OAT and CPS1 were found over‐expressed in gastric cancer patients, with sensitivity of 70.4% (95% CI: 63.3%–77.6%) and specificity of 80.5% (95% CI: 74.3%–86.7%) for ornithine aminotransferase, and with sensitivity of 68.6% (95% CI: 61.3%–75.8%) and specificity of 73% (95% CI: 66%–79.9%) for carbamoyl phosphate synthetase 1. The co‐expression of OAT and CPS1 in gastric cancer tissues has a sensitivity of 81% (95% CI: 73.2%–88.8%) and specificity of 89% (95% CI: 83%–95%). Furthermore, both OAT and CPS1 were overexpressed in patients with local invasion T3 and T4 stages than those in patients with T1 and T2 stages. The co‐expression of OAT and CPS1 was strongly correlated with histological grade I 68% (95% CI: 58.7%–77.3%) and TNM stage I/II 52% (95% CI: 42%–62%). The areas under ROC curves were up to 0.758 for the co‐expression of OAT and CPS1 in gastric cancer. GSEA results showed that two gene sets and 30 gene sets were activated in OAT high‐ and CPS1 high‐expression patients with gastric cancer, respectively.
Conclusions
The present findings indicated a tight correlation between the co‐expression of OAT and CPS1 and the histological grade, local invasion, and TNM stages of gastric cancer. Therefore, OAT and CPS1 might be predictors for gastric cancer invasion and potential targets for anticancer drug design for gastric cancer.
Keywords: amino metabolism, CPS1, gastric cancer, iTRAQ, OAT
GSEA was performed to elucidate OAT‐ and CPS1‐regulated gene sets in gastric cancer from the GEO database. The TOP two pathways enriched in the OAT‐high expression group are shown in A and B, and TOP four pathways enriched in the CPS1‐high expression group are shown in C‐F.

1. INTRODUCTION
Gastric cancer (GC) is the fifth most common type of cancer and the third leading cause of cancer‐related death worldwide. The 5‐year relative survival rate was approximately 55% in patients with stage II or III gastric cancer. 1 The contributors to high incidence and mortality of gastric cancer include distant metastasis and poor prognosis in advanced stage of gastric cancer.
The past decades have witnessed great advances in the treatment of patients with gastric cancer, including preoperative endoscopy and postoperative chemotherapy. With the wide use of endoscopic diagnostic and therapeutic techniques, the proportion of cured gastric cancers has been continuously growing year by years. 2 However, there were still a large number of patients who presented with advanced gastric cancer stage due to the lack of early detection methods and biomarkers. The 5‐year survival rate of early gastric cancer patients undergoing radical resection can reach about 90%, while that of advanced gastric cancer patients was less than 30%. The serum markers such as CA19‐9, CEA, and CA72‐4 were commonly used in clinical laboratory diagnosis for gastric cancer. However, the sensitivity and specificity of these markers were not ideal enough. For example, the sensitivity for CA19‐9, CEA, and CA72‐4 were 18.98%, 22.69%, and 22.69%, respectively. 3 Therefore, it was urgent for us to develop specific early diagnostic markers for gastric cancer.
In the present study, we aim to identify early screen biomarkers for gastric cancer. We used iTRAQ‐labeled quantitative proteomics to determine the expression levels of proteins among gastric cancer and adjacent gastric tissues and benign gastritis as well. These results provided novel diagnostic and therapeutic targets for early detection and follow‐up of gastric cancer.
2. MATERIALS AND METHODS
2.1. Sample collection
In this study, 159 cases of gastric cancer tissues and adjacent gastric tissues were collected from the affiliated hospital of North Sichuan Medical College from January 2015 to December 2021. The surrounding gastric tissues were 5 cm from the tumor edge and free of cancer cells. All patients with gastric cancer did not receive preoperative radiotherapy or chemotherapy. From January 2015 to December 2021, the formalin‐fixed, paraffin‐embedded tissue specimens of 30 benign gastritis patients were collected from the affiliated hospital of North Sichuan Medical College. The Human Research Ethics Committee from North Sichuan Medical College approved all aspects (NSMC2021077).
2.2. Sample preparation and iTRAQ labeling
We used the discovery group including four pairs of gastric cancer tissue samples and surrounding gastric tissues for proteomics analysis. For the selection of four pairs of gastric cancer tissue samples, we set the criteria as follows: (1) ≥ 40 years; (2) adenocarcinoma; (3) no distant metastasis; (4) fresh gastrectomy specimens from patients with gastric cancer who did not receive preoperative radiotherapy or chemotherapy. All tissue samples were lysed in lysis buffer (7 M urea, 1 mg/ml DNase I, 1 mM Na3VO4, and 1 mM PMSF), centrifuged at 12,000 rpm, and the supernatant was collected for total protein concentration determination by using Bradford protein assay methods. Secondly, iTRAQ labeling was applied for each sample. We used 100 μg of sample protein for precipitation by adding six times volumes of cold acetone and then incubated at −20°C for 4 h. After precipitation, the protein was dissolved in solution buffer and then denatured, and the cysteine was blocked according to the manufacturer's instructions (Applied Biosystems). Next, 20 μl of 0.25 μg/μl trypsin was used to digest each sample protein. The iTRAQ 8‐plex reagent was dissolved in methanol. The tryptic peptide of each sample was added into iTRAQ dissolution buffer, then mixed with iTRAQ 8‐plex reagent, and incubated for 1 h at room temperature. The labeled protein was pooled before further analysis.
2.3. Strong cation exchange chromatography and MS/MS analysis
The iTRAQ‐labeled samples were fractionated using a Shimadzu LC‐20AB HPLC pump system fitted with a 5‐μm particle size, 4.6 × 250 mm Ultremex SCX column (Phenomenex). The column was eluted with a gradient of a buffer A (25 mM NaH2PO4 in 25% ACN, pH 2.7) for 10 min, 5%–35% buffer B (25 mM NaH2PO4, 1 M KCl, 25% ACN, pH 2.7) for 11 min, and 35%–80% buffer B for 1 min. The fractions were collected at 1‐min intervals. The eluted peptides were pooled into 20 fractions. The peptides dried by the Speed‐Vac concentrator and desalted with C18 Sep‐Pak. MS/MS analysis was conducted by using a LTQ Orbitrap Velos (Thermo) system connected to the HPLC. The SCX‐fractionated peptides dissolved in 2% ACN, 0.1% FA. The sample volume was 10 μl per injection. A data‐dependent procedure was applied to the MS scan for the most abundant precursor ions by using a threshold ion count of 5000. During the LC–MS mode, data were acquired in the m/z range of 350–2000 Da.
2.4. Peptide identifications
The acquired data were searched against the International Protein Index (IPI) human database using the Mascot (Matrix Science version 2.2). The data were searched with a tolerance of 10 ppm on the precursors and 0.05 Dalton on the fragment ions. If there was least one such unique peptide match, a protein was considered identified. We set the threshold of a 1.2‐fold increase or decrease as significant change in expression.
2.5. Immunohistochemistry (IHC)
Tissue sections were stained with the ornithine aminotransferase (OAT) and carbamoyl phosphate synthetase 1 (CPS1) primary antibodies at a dilution of 1:100 (Abcam) at 4°C overnight. The sections were then washed and incubated with the secondary antibodies of HRP‐conjugated goat anti‐rabbit/mouse IgG at a lilution of 1:1 (D110073; Sangon). The sections were then visualized by diaminobenzidine (DAB) reagent (DAKO). The expression of protein was assessed semi‐quantitatively according to the intensity of staining as follows: negative (0), weak (+1), moderate (+2), strong (+3). The percentage of stained cancer cells was scored as follows: 0 (<5%), 1 (6%–25%), 2 (26%–50%), 3 (51%–75%), and 4 (76%–100%). A total score was finally calculated for all cases according to the abovementioned scores. 4
2.6. Gene set enrichment analysis
Gene set enrichment analysis (GSEA) was used to elucidate pathways that were activated in gastric cancer. RNA‐seq data of gastric cancer from the Gene Expression Omnibus database (GSE84437, https://www.ncbi.nlm.nih.gov/geo/query/acc.cgi?acc=GSE84437) was analyzed with GSEA software (V2.0; Broad Institute). Gene sets with NES >1, p value≤0.05 and FDR <0.25 were considered as significantly enriched.
2.7. Statistical analysis
The χ2 test was applied to calculate the correlation of protein expression with clinicopathological parameters in gastric cancer patients. GSEA V2.0 was used to perform gene set enrichment analysis. All statistical analyses were performed by SPSS 22.0 (SPSS) for Windows.
3. RESULTS
3.1. Identification of OAT and CPS1, the potential biomarkers for gastric cancer
To identify the expression of OAT and CPS1, we used a discovery group of four pairs of technical replicates of gastric cancer tissues and adjacent gastric tissues to perform the iTRAQ quantitative proteomics. Our previous studies had showed that 224 proteins were significantly upregulated and 207 proteins were downregulated in gastric cancer relative to paired adjacent gastric tissues. 5 OAT was found to be upregulated with a 1.294 fold changes in gastric cancer tissues, and CPS1 was found to be upregulated with a 1.333 fold changes in gastric cancer tissues. Figure 1 showed the representative MS/MS peptides spectrum for OAT and CPS1 in gastric cancer, respectively.
FIGURE 1.

Identification of OAT and CPS1 with iTRAQ based LC‐MS/MS analysis, which showed the representative MS/MS spectrums for OAT (A–D) and CPS1 (E–H).
3.2. Validation of protein targets OAT and CPS1 in gastric cancer obtained from iTRAQ results
We further performed immunohistochemistry to confirm the expression of OAT and CPS1 in gastric cancer (Figure 2). The results showed that OAT was significantly overexpressed in 70.4% (95% CI: 63.3%–77.6%) of gastric cancer tissues relative to that of 19.5% (95% CI: 13.3%–25.7%) in adjacent gastric tissues. The sensitivity and the specificity for OAT were 70.4% (95% CI: 63.3%–77.6%) and 80.5% (95% CI: 74.3%–86.7%) in detecting gastric cancer. Furthermore, the results showed that CPS1 was significantly overexpressed in 68.6% (95% CI: 61.3%–75.8%) of gastric cancer tissues relative to that of 27% (95% CI: 21.1%–34%) in adjacent gastric tissues, with a sensitivity of 68.6% (95% CI: 61.3%–75.8%) and specificity of 73% (95% CI: 66%–79.9%) (Table 1). Moreover, the coexpression of OAT and CPS1 was detected in 81% (95% CI: 73.2%–88.8%) gastric cancer tissues, with a sensitivity of 81% (95% CI: 73.2%–88.8%) and specificity of 89% (95% CI: 83%–95%) in detecting gastric cancer (Figure 3). The area under curve (AUC) for combined assay of OAT and CPS1 was 0.758 (Figure 4). It was obvious that the combined assay of OAT and CPS1 significantly improved the sensitivity and specificity in detecting gastric cancer.
FIGURE 2.

Immunohistochemistry analysis to validate the expression of OAT and CPS1 in gastric cancer tissues. Expression of OAT was predominantly located in the cytoplasm of cancer cells (A, Adjacent tissues; B and C, Gastric cancer tissues). Expression of CPS1 was also predominantly located in cytoplasm of cancer cells (D, Adjacent tissues; E and F, Gastric cancer tissues).
TABLE 1.
Immunohistochemical analysis of OAT and CPS1 expression in gastric cancer, adjacent normal tissues, and health controls
| Sample types | Health controls | Adjacent gastric tissues | Cancer tissues | p‐values |
|---|---|---|---|---|
| OAT (−) | 22 | 128 | 47 | |
| OAT (+) | 8 | 31 | 112 | <0.001 |
| CPS1 (−) | 21 | 116 | 50 | |
| CPS1 (+) | 9 | 43 | 109 | <0.001 |
| OAT and CPS1 (−) | 18 | 97 | 19 | |
| OAT and CPS1 (+) | 5 | 12 | 81 | <0.001 |
Note: Chi‐square test was used to calculate the difference, with the significant level of p ≤ 0.01.
FIGURE 3.

Positive rates of OAT (A) and CPS1 (A) and both of the two enzymes (B) in gastric cancer tissues.
FIGURE 4.

ROC curve for combined assay of OAT and CPS1. AUC = 0.758, p < 0.001.
3.3. Comparison of pathological variables of OAT positive patients with OAT negative patients
To find out the correlation of OAT expression with the pathological variables of gastric cancer patients, we compared the pathological variables between OAT‐positive and ‐negative patients. All gastric cancer tissues underwent immunohistochemistry of OAT expression evaluation. We selected histological type, T staging, and node metastasis for further analysis. We found that OAT was significantly overexpressed in patients with T3 and T4 stages compared with that of patients with T1 and T2 local invasion (p = 0.01) (Table 2).
TABLE 2.
Comparison OAT positive with negative gastric cancer patients with TNM staging variables
| Variables | OAT (−) | OAT (+) | Case | p‐values |
|---|---|---|---|---|
| Histology classification | ||||
| Adenocarcinoma | 38 | 97 | 135 | |
| Signet‐ring cell carcinoma | 9 | 15 | 24 | 0.355 |
| pT | ||||
| T1 and T2 | 29 | 44 | 73 | |
| T3 and T4 | 18 | 68 | 86 | 0.01 |
| pN | ||||
| pN0 | 25 | 45 | 70 | |
| pN1and pN2 | 8 | 37 | 45 | |
| pN3a and pN3b | 14 | 30 | 44 | 0.11 |
| pM a | ||||
| pM0 | 45 | 107 | 152 | – |
| pM1 | 2 | 5 | 7 | – |
Owing to the insufficient number of cases in the pM1 subgroup, the p value of the pM group is not calculated.
3.4. Comparison of pathological variables between CPS1‐positive patients and CPS1‐negative patients
The pathological variables of CPS1‐positive expression patients and ‐negative expression patients are compared in Table 3. As can be seen from the Table 3, the expression of CPS1 was significantly associated with the local invasion that CPS1 was highly expressed in patients with T3 and T4 stages than that of patients with T1 and T2 stages (p = 0.02) (Table 3).
TABLE 3.
Comparison CPS1 positive with negative gastric cancer patients with TNM staging variables
| Variables | CPS1 (−) | CPS1 (+) | Case | p‐values |
|---|---|---|---|---|
| Histology classification | ||||
| Adenocarcinoma | 44 | 91 | 135 | |
| Signet‐ring cell carcinoma | 6 | 18 | 24 | 0.46 |
| pT | ||||
| T1 and T2 | 30 | 43 | 73 | |
| T3 and T4 | 20 | 66 | 86 | 0.02 |
| pN | ||||
| pN0 | 23 | 47 | 70 | |
| pN1 and pN2 | 11 | 34 | 45 | |
| pN3a and pN3b | 16 | 28 | 44 | 0.45 |
| pM | ||||
| pM0 | 47 | 105 | 152 | |
| pM1 | 3 | 4 | 7 | 0.51 |
3.5. The combined assay of OAT and CPS1 expression and its correlation with pathological variables of gastric cancer
To further analyze the association of combined OAT and CPS1 expression with gastric cancer, we divided the gastric cancer patients into several groups according to the pathological variables. As shown in Table 4, the coexpression of OAT and CPS1 was significantly associated with histological grade and TNM staging. There were 68% cases of gastric cancer patients with histological grade I who had a more positive rate of OAT and CPS1 coexpression than that of 32% in patients with histological grade II and III (p = 0.03). Moreover, the coexpression of OAT and CPS1 was significantly higher in gastric cancer patients with TNM III/IV stages than that of patients with TNM I/IIstages (p = 0.04) (Table 4).
TABLE 4.
Correlations of OAT and CPS1 expression with clinicopathological parameters in gastric cancer
| Clinicopathological parameters | OAT and CPS1 (−) | OAT and CPS1 (+) | Case | p‐values |
|---|---|---|---|---|
| Age (year) | ||||
| ≥60 | 12 | 49 | 61 | |
| ≤59 | 7 | 32 | 39 | 0.83 |
| Sex | ||||
| Male | 14 | 62 | 76 | |
| Female | 5 | 19 | 24 | 0.79 |
| Histology classification | ||||
| Adenocarcinoma | 16 | 69 | 85 | |
| Signet‐ring cell carcinoma | 3 | 12 | 15 | 0.92 |
| Histological grade | ||||
| I | 9 | 59 | 68 | |
| II and III | 10 | 22 | 32 | 0.03 |
| Lymph node metastasis | ||||
| Positive | 11 | 51 | 62 | |
| Negative | 8 | 30 | 38 | 0.68 |
| TNM Staging | ||||
| I/II | 14 | 38 | 52 | |
| III/IV | 5 | 43 | 48 | 0.04 |
Note: The significant difference was conducted with Chi‐square test, with the significant level of p ≤ 0.05.
3.6. Gene sets enrichment analysis to reveal genes activated in gastric cancer
We download the RNA‐seq dataset of GSE84437 from the GEO database. We divided the subjects into OAT high group (top 50%) and OAT low group (bottom 50%) according to the expression of OAT in gastric cancer patients. We also divided the subjects into CPS1 high group (top 50%) and CPS1 low group (bottom 50%) based on CPS1 expression. We set the criteria of NES >1, p value ≤0.05 and FDR <0.25 to perform GSEA. The results showed that two gene sets were significantly enriched in OAT high expression group, 30 gene sets were significantly enriched in CPS1 high expression group (Figure 5). Table 5 showed the TOP pathways enriched in OAT high and CPS1 high expression group. The significantly enriched gene sets in OAT high group were elevated circulating aspartate aminotransferase concentration and elevated circulating alanineaminotransferase concentration. The TOP five gene sets enriched in CPS1 high group were weng por targets liver dn, weng por dosage, descartes fetal liver hepatoblasts, car igfbp1, and weng por targets globa. The dataset had 14,205 (56.5%) genes correlated with CPS1 high expression with the correlation area of 55.9%.
FIGURE 5.

GSEA was performed to elucidate OAT and CPS1 regulated gene sets in gastric cancer from the GEO database. The TOP two pathways enriched in the OAT‐high expression group were shown in A and B, and TOP four pathways enriched in the CPS1‐high expression group are shown in C–F.
TABLE 5.
Top gene sets enriched in OAT high expression and CPS1 high expression patients with gastric cancer
| Name | Size | ES | NES | NOM p‐val | FDR Q‐val | |
|---|---|---|---|---|---|---|
| OAT high expression group | Elevated Circulating Aspartate Aminotransferase Concentration | 20 | 0.60 | 1.91 | 0.000 | 0.000 |
| Elevated Circulating Alanine aminotransferase Concentration | 18 | 0.57 | 1.64 | 0.000 | 0.000 | |
| CPS1 high expression group | Weng_Por_Targets_Liver_Dn | 20 | 0.78 | 2.23 | 0.000 | 0.079 |
| Weng_Por_Dosage | 21 | 0.51 | 2.20 | 0.000 | 0.039 | |
| Descartes_Fetal_Liver_Hepatoblasts | 378 | 0.51 | 2.16 | 0.000 | 0.034 | |
| Car_Igfbp1 | 55 | 0.57 | 2.14 | 0.000 | 0.026 | |
| Weng_Por_Targets_Global_Dn | 22 | 0.64 | 1.98 | 0.000 | 0.021 | |
| Hp_Hemangioblastoma | 17 | 0.55 | 1.93 | 0.000 | 0.048 | |
| Cervera_Sdhb_Targets_1_Dn | 32 | 0.60 | 1.86 | 0.000 | 0.056 | |
| Mebarki_Hcc_Progenitor_Wnt_Dn_Ctnnb1_Dependent_Blocked_By_Fzdcrd | 18 | 0.64 | 1.80 | 0.000 | 0.088 | |
| Kegg_O_Glycan_Biosynthesis | 25 | 0.60 | 1.75 | 0.000 | 0.092 | |
| Mebarki_Hcc_Progenitor_Wnt_Dn_Ctnnb1_Dependent | 25 | 0.62 | 1.72 | 0.000 | 0.106 |
4. DISCUSSION
During the past decades, there have been huge improvements in the treatment of gastric cancer. However, the prognosis of gastric cancer was still poor, mainly because it had been already achieved advanced stages when it was diagnosed. Therefore, discovery of novel diagnostic markers is urgently required for early diagnosis of gastric cancer. In the present study, by using iTRAQ‐labeled quantitative proteomics, we found that OAT and CPS1 were significantly overexpressed in gastric cancer patients. Moreover, the overexpression of OAT and CPS1 was significantly correlated with pathological variables, including histological grade, local invasion, and TNM staging. The results of GSEA showed that a number of gene sets, including amino acid metabolism enzymes and aminotransferase, were activated in OAT and CPS1 high expression gastric cancer patients.
Ornithine aminotransferase, a pyridoxal 5'phosphate‐dependent mitochondrial enzyme, catalyzed the reversible interconversion of ornithine and α‐ketoglutarate to l‐glutamate semialdehyde, which cyclizes to Δ1‐pyrroline‐5‐carboxylate (P5C) and l‐glutamate. 6 , 7 , 8 , 9 , 10 Recently, studies showed that OAT was involved in proline metabolism, which was altered in cancer cells to sustain cell proliferation. Moreover, cellular glutamate generated from OAT can be converted to glutamine by glutamine synthetase to synthesize de novo nucleotide.
Previous study found that OAT was significantly higher expressed in lung cancer specimens than that of normal lung tissues. The over expression of OAT was significantly correlated with TNM III/IV staging. 11 Liu et al. 12 reported that OAT was upregulated in non‐small cell lung cancer and associated with the advanced TNM stage, metastasis, and poor tumor differentiation. The studies above suggested that OAT was a new target for cancer. Risha et al. 13 demonstrated that OAT secreted by vesicles and have functional activity, which may had potential therapeutic applications in future.
However, the OAT expression and potential mechanism in gastric cancer were still unknown. In the present study, we demonstrated that OAT was overexpressed in 70.4% cases of gastric cancer tissues, which was significantly higher than that of 19.5% cases of adjacent cancer tissues. Furthermore, OAT was significantly overexpressed in patients with T3 and T4 stages than that of patients with T1 and T2 stage (p = 0.01) (Table 2). These data suggested that overexpression of OAT may affect gastric cancer cell local invasion and metastasis.
Previous studies suggested that OAT was a potential chemotherapy target for cancers. Silverman et al. 14 have recently synthesized OAT inactivators to inhibit the activity of OAT and lead to downregulation of l‐Gln and growth inhibition of hepatocellular carcinoma through targeting the Wnt/β‐catenin pathway, which suggests that OAT was an important chemotherapy target for treatment of cancer. Zhu et al. 15 recently showed that both human OAT and γ‐aminobutyric acid aminotransferase have a similar active site. They used two inhibitors of γ‐aminobutyric acid aminotransferase, CPP‐115 and OV329, to inhibit the activity of OAT by synthesizing a series of analogues. They found that analogue 10b was a high selectivity and potency inhibitor for OAT. By using stopped‐flow spectrophotometry and X‐ray crystallography, Butrin et al. 16 demonstrated the pH dependency of the human OAT multistep reaction mechanism and elucidated the roles of ornithine α‐amino and δ‐amino groups in substrate recognition and in facilitating catalytic turnover, which provide clues for the design of mechanism‐based inactivators against human OAT. Our GSEA results revealed that two amino acid metabolic pathways, aspartate aminotransferase and alanine aminotransferase, were activated in CPS1 high expression gastric cancer patients, which suggested that OAT was a promising target in treatment of gastric cancer. To further improve the sensitivity and specificity of OAT in gastric cancer, we analyzed the CPS1, which serves as coordinate diagnostic biomarkers for gastric cancer.
Carbamoyl phosphate synthetase 1 (CPS1) is a mitochondrial metabolic key enzyme, converting ammonia into carbamoyl phosphate. 17 , 18 , 19 Previous studies demonstrated that CPS1 was mainly expressed in intestinal epithelia, liver, and across most of cancer types, including glioblastoma, cholangiocarcinoma, and colorectal cancer. In cancer cells, CPS1 sustains cancer cell growth by augmenting the concentration of carbamoyl phosphate for de novo pyrimidine synthesis. 20 , 21 , 22 , 23 Knockdown of CPS1 can inhibit cancer cell growth in vitro. 24
By using the GEO database, Zali et al. 25 identified several differential expressed genes and constructed PPI network for Barrett's esophagus. They found that the prominent genes including CPS1, KIT, CFTR, IMPDH2, MYB, FLT1 and ATP4A can be biomarkers for Barrett's esophagus. Fang et al. 26 detected CPS1 expression in Correa's cascade patients including choronic atrophic gastritis with intestinal metaplasia, patients with intraepithelial neoplasia, and patients with gastric cancer. They found that CPS1 expression was gradually downregulated in Correa's cascade, with strong expression in patients with intestinal metaplasia and in intraepithelial neoplasia, but lower expressed in patients with gastric cancer, regardless of histological type. Dirk Andreas et al. 27 found that CPS1 was downregulated in HCC and further reduced in recurrent tumors and distant metastases.
Contrary to previous studies, we found that CPS1 was highly expressed in 68.6% cases of gastric cancer tissues than that of 27% cases of adjacent gastric tissues and than that of 30% cases of benign gastritis (Table 1 and Figure 3A). On the other hand, another study found that CPS1 was significantly overexpressed in glioblastoma multiforme. 28 These discrepancies may be caused by the differences of sample sources, detection methods, and experimental conditions, which need to be further verified.
To screen the potential inhibitors for CPS1, Yao et al. 29 identified as a specific inhibitor H3B‐120 for CPS1 through high‐throughput screen. They found that H3B‐120 binds to allosteric pocket to block ATP hydrolysis in the process of carbamoyl phosphate synthesis. The analogues of H3B‐120 can block CPS1 cellular activity in primary human hepatocytes. Furthermore, by using a high‐throughput screening effort and structure based drug design, Alan et al. 30 found that piperazine H3B‐616(25) as a potent allosteric inhibitor of CPS1. Our GSEA analysis revealed that there were a number of genes activated in CPS1 high expression gastric cancer patients, including the key enzymes and cooperators in the process of amino acid metabolism and fatty acid metabolism such as FABP2, APOA4, BDH1, ADH1A, GBA3, and APOB, et al. These results indicated that CPS1 was a promising target in treatment of gastric cancer.
The sensitivity and specificity of traditional markers such as CA19‐9, CEA, and CA72‐4 were not ideal enough. The sensitivity for CA19‐9, CEA, and CA72‐4 were 18.98%, 22.69%, and 22.69%, respectively. 3 Therefore, it was urgently required to find novel biomarkers to improve the diagnostic rate for early gastric cancer. In the present study, our validation study showed that the sensitivity and specificity of OAT were 70.4% and 80.5% for gastric cancer, respectively. The sensitivity and specificity of OAT in detecting gastric cancer were higher than that of CEA and CA‐199. Furthermore, OAT was overexpressed in patients with T3 and T4 stages than that of patients with T1 and T2 stages, indicating OAT serves as a potential biomarker for gastric cancer.
Nevertheless, we were not content with the sensitivity and specificity obtained by OAT. We therefore combined analysis of OAT with CPS1 and obtained higher sensitivity and specificity for gastric cancer. For combined analysis of OAT and CPS1, we obtained 81% of sensitivity and 89% of specificity for gastric cancer (Table 1 and Figure 3B). In addition, for combined analysis of OAT and CPS1, the AUC for gastric cancer was 0.758 (Figure 4). Obviously, the combined analysis of OAT and CPS1 obtained a higher sensitivity, specificity, and AUC than those of traditional biomarkers, indicating that combined analyses of OAT and CPS1 were potential diagnostic biomarkers for screening and follow‐up of gastric cancer. The roles of OAT and CPS1 in regulating ammonia metabolism in cancer cells are shown in Figure 6.
FIGURE 6.
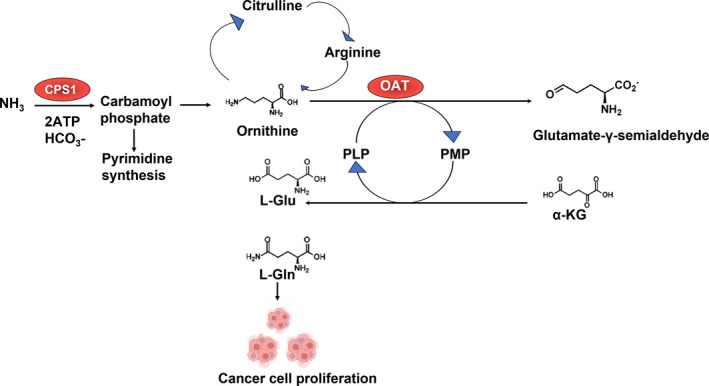
The roles of OAT and CPS1 in regulating ammonia metabolism in cancer cells. α‐KG, α‐ketoglutarate; l‐Glu, l‐glutamate; l‐Gln, l‐Glutamine; PLP, pyridoxal 5'‐phosphate; PMP, pyridoxamine phosphate.
The limitations of the present study were as follows. (1), the sample size of the present study was relatively small. We will enlarge the sample size in future study to obtain more sufficient conclusions. (2), because the OAT and CPS1 were expressed in a variety of tumors, we only tested the expression of OAT and CPS1 in gastric cancer and the adjacent normal gastric tissues in the present study. As long as conditions permit in the future, we will supplement the data from other tumor types to obtain more sufficient conclusions.
5. CONCLUSION
In conclusion, by using the iTRAQ based quantitative proteomics, the present study identified OAT and CPS1 that were significantly overexpressed in gastric cancer, which significantly correlated with clinical parameters, including histological grade, local invasion, and TNM staging, in patients with gastric cancer. Our study suggested that detecting of OAT and CPS1 can serve as novel diagnostic and therapeutic targets for early screen and follow‐up for gastric cancer.
FUNDING INFORMATION
This work was supported by the National Natural Science Foundation of China (81702093); the Sichuan Provincial Department of Science and Technology (2020YJ0379); the Special Foundation of Cooperation between Nanchong Government and North Sichuan Medical College (20SXJCQN0004; 20SXQT0053; 18SXHZ0281).
CONFLICT OF INTEREST
The authors declare no conflict of interest.
ACKNOWLEDGMENTS
We would like to thank the funding project of the National Natural Science Foundation of China (81702093). The Sichuan Provincial Department of Science and Technology (2020YJ0379); The Special Foundation of Cooperation between Nanchong Government and North Sichuan Medical College (20SXJCQN0004; 20SXQT0053; 18SXHZ0281).
Jiang Z, Wei C, Luo Y, et al. Ornithine aminotransferase and carbamoyl phosphate synthetase 1 involved in ammonia metabolism serve as novel targets for early stages of gastric cancer. J Clin Lab Anal. 2022;36:e24692. doi: 10.1002/jcla.24692
Wubin Guo and Xiaoxia Yuan contributed equally to this work.
DATA AVAILABILITY STATEMENT
The dataset (GSE84437) was available on the GEO database (https://www.ncbi.nlm.nih.gov/geo/query/acc.cgi?acc=GSE84437). Other data are available from the corresponding author upon reasonable request.
REFERENCES
- 1. Park Y, Koh J, Na HY, et al. PD‐L1 testing in gastric cancer by the combined positive score of the 22C3 PharmDx and SP263 assay with clinically relevant cut‐offs. Cancer Res Treat. 2020;52:661‐670. [DOI] [PMC free article] [PubMed] [Google Scholar]
- 2. Jeong SH, Kim RB, Park SY, et al. Nomogram for predicting gastric cancer recurrence using biomarker gene expression. Eur J Surg Oncol. 2020;46:195‐201. [DOI] [PubMed] [Google Scholar]
- 3. Yu J, Zhang S, Zhao B. Differences and correlation of serum CEA, CA19‐9 and CA72‐4 in gastric cancer. Mol Clin Oncol. 2016;4:441‐449. [DOI] [PMC free article] [PubMed] [Google Scholar]
- 4. Jiang Z, Sun X, Zhang Q, et al. Identification of candidate biomarkers that involved in the epigenetic transcriptional regulation for detection gastric cancer by iTRAQ based quantitative proteomic analysis. Clin Chim Acta. 2017;471:29‐37. [DOI] [PubMed] [Google Scholar]
- 5. Jiang Z, Shen H, Tang B, et al. Identification of diagnostic markers involved in the pathogenesis of gastric cancer through iTRAQ‐based quantitative proteomics. Data Brief. 2017;11:122‐126. [DOI] [PMC free article] [PubMed] [Google Scholar]
- 6. Butrin A, Beaupre BA, Kadamandla N, et al. Structural and kinetic analyses reveal the dual inhibition modes of ornithine aminotransferase by (1S,3S)‐3‐Amino‐4‐(hexafluoropropan‐2‐ylidenyl)‐cyclopentane‐1‐carboxylic acid (BCF3). ACS Chem Biol. 2021;16:67‐75. [DOI] [PMC free article] [PubMed] [Google Scholar]
- 7. Moschitto MJ, Doubleday PF, Catlin DS, Kelleher NL, Liu D, Silverman RB. Mechanism of inactivation of ornithine aminotransferase by (1S,3S)‐3‐Amino‐4‐(hexafluoropropan‐2‐ylidenyl)cyclopentane‐1‐carboxylic acid. J Am Chem Soc. 2019;141:10711‐10721. [DOI] [PMC free article] [PubMed] [Google Scholar]
- 8. Peng Y, Cooper SK, Li Y, et al. Ornithine‐δ‐aminotransferase inhibits neurogenesis during xenopus embryonic development. Invest Ophthalmol Vis Sci. 2015;56:2486‐2497. [DOI] [PMC free article] [PubMed] [Google Scholar]
- 9. Zigmond E, Ben Ya'acov A, Lee H, et al. Suppression of hepatocellular carcinoma by inhibition of overexpressed ornithine aminotransferase. ACS Med Chem Lett. 2015;6:840‐844. [DOI] [PMC free article] [PubMed] [Google Scholar]
- 10. Lee H, Juncosa JI, Silverman RB. Ornithine aminotransferase versus GABA aminotransferase: implications for the design of new anticancer drugs. Med Res Rev. 2015;35:286‐305. [DOI] [PMC free article] [PubMed] [Google Scholar]
- 11. Li W, Zhang W, Deng W, et al. Quantitative proteomic analysis of mitochondrial proteins differentially expressed between small cell lung cancer cells and normal human bronchial epithelial cells. Thorac Cancer. 2018;9:1366‐1375. [DOI] [PMC free article] [PubMed] [Google Scholar]
- 12. Liu Y, Wu L, Li K, et al. Ornithine aminotransferase promoted the proliferation and metastasis of non‐small cell lung cancer via upregulation of miR‐21. J Cell Physiol. 2019;234:12828‐12838. [DOI] [PubMed] [Google Scholar]
- 13. Risha Y, Susevski V, Hüttmann N, Poolsup S, Minic Z, Berezovski MV. Breast cancer‐derived microvesicles are the source of functional metabolic enzymes as potential targets for cancer therapy. Biomedicine. 2021;9:107. [DOI] [PMC free article] [PubMed] [Google Scholar]
- 14. Silverman RB. Inactivators of ornithine aminotransferase for the treatment of hepatocellular carcinoma. ACS Med Chem Lett. 2022;13:38‐49. [DOI] [PMC free article] [PubMed] [Google Scholar]
- 15. Zhu W, Butrin A, Melani RD, et al. Rational design, synthesis, and mechanism of (3S,4R)‐3‐Amino‐4‐(difluoromethyl)cyclopent‐1‐ene‐1‐carboxylic acid: employing a second‐deprotonation strategy for selectivity of human ornithine aminotransferase over GABA aminotransferase. J Am Chem Soc. 2022;144:5629‐5642. [DOI] [PMC free article] [PubMed] [Google Scholar]
- 16. Butrin A, Butrin A, Wawrzak Z, Moran GR, Liu D. Determination of the pH dependence, substrate specificity, and turnovers of alternative substrates for human ornithine aminotransferase. J Biol Chem. 2022;298:101969. [DOI] [PMC free article] [PubMed] [Google Scholar]
- 17. Liu TH, Li DC, Gu CF, Ye SF. Carbamyl phosphate synthetase I. a novel marker for gastric carcinoma. Chin Med J (Engl). 1989;102:630‐638. [PubMed] [Google Scholar]
- 18. Taguchi A, Fahrmann JF, Hanash SM. A promising CPS1 inhibitor keeping ammonia from fueling cancer. Cell Chem Biol. 2020;27:253‐254. [DOI] [PubMed] [Google Scholar]
- 19. Wu T, Luo G, Lian Q, et al. Discovery of a carbamoyl phosphate synthetase 1‐deficient HCC subtype with therapeutic potential through integrative genomic and experimental analysis. Hepatology. 2021;74:3249‐3268. [DOI] [PubMed] [Google Scholar]
- 20. Liu X, Zhang X, Bi J, Li Z, Zhang Z, Kong C. Caspase recruitment domain family member 10 regulates carbamoyl phosphate synthase 1 and promotes cancer growth in bladder cancer cells. J Cell Mol Med. 2019;23:8128‐8138. [DOI] [PMC free article] [PubMed] [Google Scholar]
- 21. Butler SL, Dong H, Cardona D, et al. The antigen for hep par 1 antibody is the urea cycle enzyme carbamoyl phosphate synthetase 1. Lab Invest. 2008;88:78‐88. [DOI] [PubMed] [Google Scholar]
- 22. Chen Z, Tang N, Wang X, Chen Y. The activity of the carbamoyl phosphate synthase 1 promoter in human liver‐derived cells is dependent on hepatocyte nuclear factor 3‐beta. J Cell Mol Med. 2017;21:2036‐2045. [DOI] [PMC free article] [PubMed] [Google Scholar]
- 23. Liu H, Dong H, Robertson K, Liu C. DNA methylation suppresses expression of the urea cycle enzyme carbamoyl phosphate synthetase 1 (CPS1) in human hepatocellular carcinoma. Am J Pathol. 2011;178:652‐661. [DOI] [PMC free article] [PubMed] [Google Scholar]
- 24. Çeliktas M, Tanaka I, Tripathi SC, et al. Role of CPS1 in cell growth, metabolism and prognosis in LKB1‐inactivated lung adenocarcinoma. J Natl Cancer Inst. 2017;109:1‐9. [DOI] [PMC free article] [PubMed] [Google Scholar]
- 25. Zali MR, Zadeh‐Esmaeel MM, Rezaei Tavirani M, Rezaei Tavirani S, Norouzinia M, Rezaei‐Tavirani M. Barrett's esophagus network analysis revealed that arginine, alanine, aspartate, glutamate, valine, leucine and isoleucine can be biomarkers. Gastroenterol Hepatol Bed Bench. 2018;11:S98‐S104. [PMC free article] [PubMed] [Google Scholar]
- 26. Fang X, Wu X, Xiang E, et al. Expression profiling of CPS1 in Correa's cascade and its association with gastric cancer prognosis. Oncol Lett. 2021;21(6):441. [DOI] [PMC free article] [PubMed] [Google Scholar]
- 27. Ridder DA, Schindeldecker M, Weinmann A, et al. Key enzymes in pyrimidine synthesis, CAD and CPS1, predict prognosis in hepatocellular carcinoma. Cancers (Basel). 2021;13:744. [DOI] [PMC free article] [PubMed] [Google Scholar]
- 28. Wu G, Yan Y, Zhou Y, et al. Expression and clinical significance of CPS1 in glioblastoma multiforme. Curr Res Transl Med. 2019;67:123‐128. [DOI] [PubMed] [Google Scholar]
- 29. Yao S, Nguyen TV, Rolfe A, et al. Small molecule inhibition of CPS1 activity through an allosteric pocket. Cell Chem Biol. 2020;27:259‐268. [DOI] [PubMed] [Google Scholar]
- 30. Rolfe A, Yao S, Nguyen TV, et al. Discovery of 2,6‐Dimethylpiperazines as allosteric inhibitors of CPS1. ACS Med Chem Lett. 2020;11:1305‐1309. [DOI] [PMC free article] [PubMed] [Google Scholar]
Associated Data
This section collects any data citations, data availability statements, or supplementary materials included in this article.
Data Availability Statement
The dataset (GSE84437) was available on the GEO database (https://www.ncbi.nlm.nih.gov/geo/query/acc.cgi?acc=GSE84437). Other data are available from the corresponding author upon reasonable request.