Abstract
Diffuse midline gliomas (DMGs) bearing driver mutations of histone 3 lysine 27 (H3K27M) are incurable brain tumors with unique epigenomes. Here, we generated a syngeneic H3K27M mouse model to study the amino acid metabolic dependencies of these tumors. H3K27M mutant cells were highly dependent on methionine. Interrogating the methionine cycle dependency through a short-interfering RNA screen identified the enzyme methionine adenosyltransferase 2A (MAT2A) as a critical vulnerability in these tumors. This vulnerability was not mediated through the canonical mechanism of MTAP deletion; instead, DMG cells have lower levels of MAT2A protein, which is mediated by negative feedback induced by the metabolite decarboxylated S-adenosyl methionine. Depletion of residual MAT2A induces global depletion of H3K36me3, a chromatin mark of transcriptional elongation perturbing oncogenic and developmental transcriptional programs. Moreover, methionine-restricted diets extended survival in multiple models of DMG in vivo. Collectively, our results suggest that MAT2A presents an exploitable therapeutic vulnerability in H3K27M gliomas.
The 2021 World Health Organization (WHO) classification of central nervous system cancers established a new subclass of very aggressive high-grade gliomas (grade IV), called DMGs, which is inclusive of most diffuse intrinsic pontine gliomas (DIPGs)1. The poor prognosis of DMG/DIPGs is multifactorial, in part due to the tumor’s anatomical location, which precludes surgical resection, as well as the limited number of therapeutically active agents able to penetrate the blood–brain barrier2. Radiation, the current standard of care, provides only transient benefits, whereas chemotherapy does not improve survival3. DMGs and most DIPGs (~80%) are characterized by a hotspot mutation of lysine 27-to-methionine (K27M) in the genes encoding histone 3 variants, H3.1 and H3.3 (ref.4). Patients with DIPG and H3K27M mutations have a 5-year survival rate of less than 10% and a median survival time of 9–12 months5,6. The resulting H3K27M mutant histone inhibits the Polycomb repressive complex 2 (PRC2) by interacting with its EZH2 subunit, thereby bringing about a global reduction in histone trimethylation (H3K27me3)7. The global decrease in H3K27me3, with concomitant increases in H3K27 acetylation (H3K27Ac), results in the transcription and activation of several oncogenic proteins and pathways8–11.
H3K27M modeling in drosophila, mouse and human cells have licensed the mutation in tumor initiation and growth, as well as the maintenance of its altered epigenetic landscape9,12. Indeed, gene knockdown by short-hairpin RNA (shRNA) or clustered regularly interspaced short palindromic repeats CRISPR-associated protein 9 (CRISPR-Cas9) knockout (KO) of H3K27M impairs the production and spread of the repressive H3K27me3 mark from PRC2 high-affinity sites9,13,14. Therefore, targeting the H3K27M mutation or H3K27M-based dependencies that sustain DIPGs may provide new insight into their biology and reveal therapeutic avenues to pursue for their treatment.
DIPGs, like other brain tumors, can be initiated or maintained by alterations to the epigenome14,15. Epigenetic regulatory enzymes utilize co-substrates/cofactors produced by metabolism, forging a link between transcriptional regulation and metabolism16–18. For example, adult diffuse gliomas harbor mutations in isocitrate dehydrogenase 1 and 2 that initiate a CpG island methylator phenotype19. Posterior fossa type A (PFA) ependymomas reside in hypoxic tumor microenvironments (TMEs) that control the availability of select metabolites to diminish histone methylation and to increase both demethylation and acetylation of H3K27 (ref.15). Collectively, metabolism programs play a critical role in influencing the epigenomic programs and present new opportunities for targeting fatal brain tumors, such as DIPG.
Despite the recognition of cancer metabolism, targeting general metabolic mechanisms is rarely safe or effective, as shown by numerous side effects of antimetabolite chemotherapy. Many non-malignant cells, including those in the bone marrow, intestinal crypts and hair follicles, proliferate rapidly, at rates even greater than those of cancer cells20. Identifying the metabolic needs of proliferating cancer cells versus those of proliferating normal and healthy cells emerges as a prominent challenge, especially in young children with cancer who are still undergoing development. Tumors also retain features of their healthy parental tissue, which can result in toxicity to the surrounding non-malignant tissue when targeted21.
Based on this background, we hypothesized that DIPGs exhibit unique metabolic dependencies on amino acids (AAs) and that one-carbon metabolism presents a therapeutic pathway. Here, we transformed oligodendrocyte transcription factor 2 (OLIG2)positive neural progenitor cells (NPCs), a putative cell of origin for DIPGs22,23, to generate isogenic mouse lines to interrogate the influence of known DIPG mutations on proliferating NPCs. We identified a reliance on the AA methionine and its effects on the epigenome of DIPG.
Results
Modeling DIPG alterations in NPCs expressing OLIG2.
To study transcriptomic and metabolic changes in DIPG, we established isogenic cells using the three most common alterations observed in human DMG tumors, which cooperate to initiate DIPG in human neural stem cells and animal models: mutant histone H3 (H3K27M), overexpression of wild-type platelet-derived growth factor receptor (PDGFRA) and expression of a common hotspot mutation of tumor protein p53 (TP53) (TP53 R237H) (Fig. 1a)24. We used Cre-mediated recombination to stably and irreversibly invert a segment of DNA within mouse NPCs transduced by lentivirus. This backbone contains our three genes of interest, H3K27M, PDGFRA and TP53 R273H and a green fluorescent protein (GFP) reporter to serve as a selectable marker. Henceforth, this cassette is denoted as H3K27MPP and is flanked by heterotypic mutant loxP sites (loxP-2272 and loxP5171) that can recombine with their identical sequences, but not with each other25. Our control cassette is denoted as H3WTPP and encodes for wild-type H3F3A, PDGFRA and mutant p53 R273H. All three genes of either cassette were in their inverted, transcriptionally inactive state (Fig. 1b). The inclusion of self-cleavage peptide sequences, P2A and T2A, between the three tumor genes enabled all three proteins to be independently expressed from one transcript. A second construct was generated using an established Olig2 promoter-driving Cre recombinase and a mCherry-selectable marker. We selected the Olig2 promoter to specifically target OLIG2+ NPCs in the midbrain/hindbrain, the most likely cell of origin for DIPG22. Expression of Iroquois Homeobox2 (IRX2), a transcription factor that is only present in the midbrain and hindbrain, confirmed our ability to isolate region-specific NPC cells (Fig. 1c)26 and suggested successful transduction with H3K27M, as euchromatin studies suggest that IRX2 is active exclusively in a H3K27M setting14. We next transduced NPCs dissected from male and female hindbrains with either one or both of our viral constructs. CRE-mediated DNA inversion produces an in-frame messenger RNA transcript encoding our transgenes. Dual GFP–mCherry-sorted cells confirmed expression of all three trans-genes, whereas GFP-sorted cells without Olig2-mCherry displayed no transgene activation (Extended Data Fig. 1a).
Fig. 1 |. Generation of a syngeneic mouse model of DIPG.
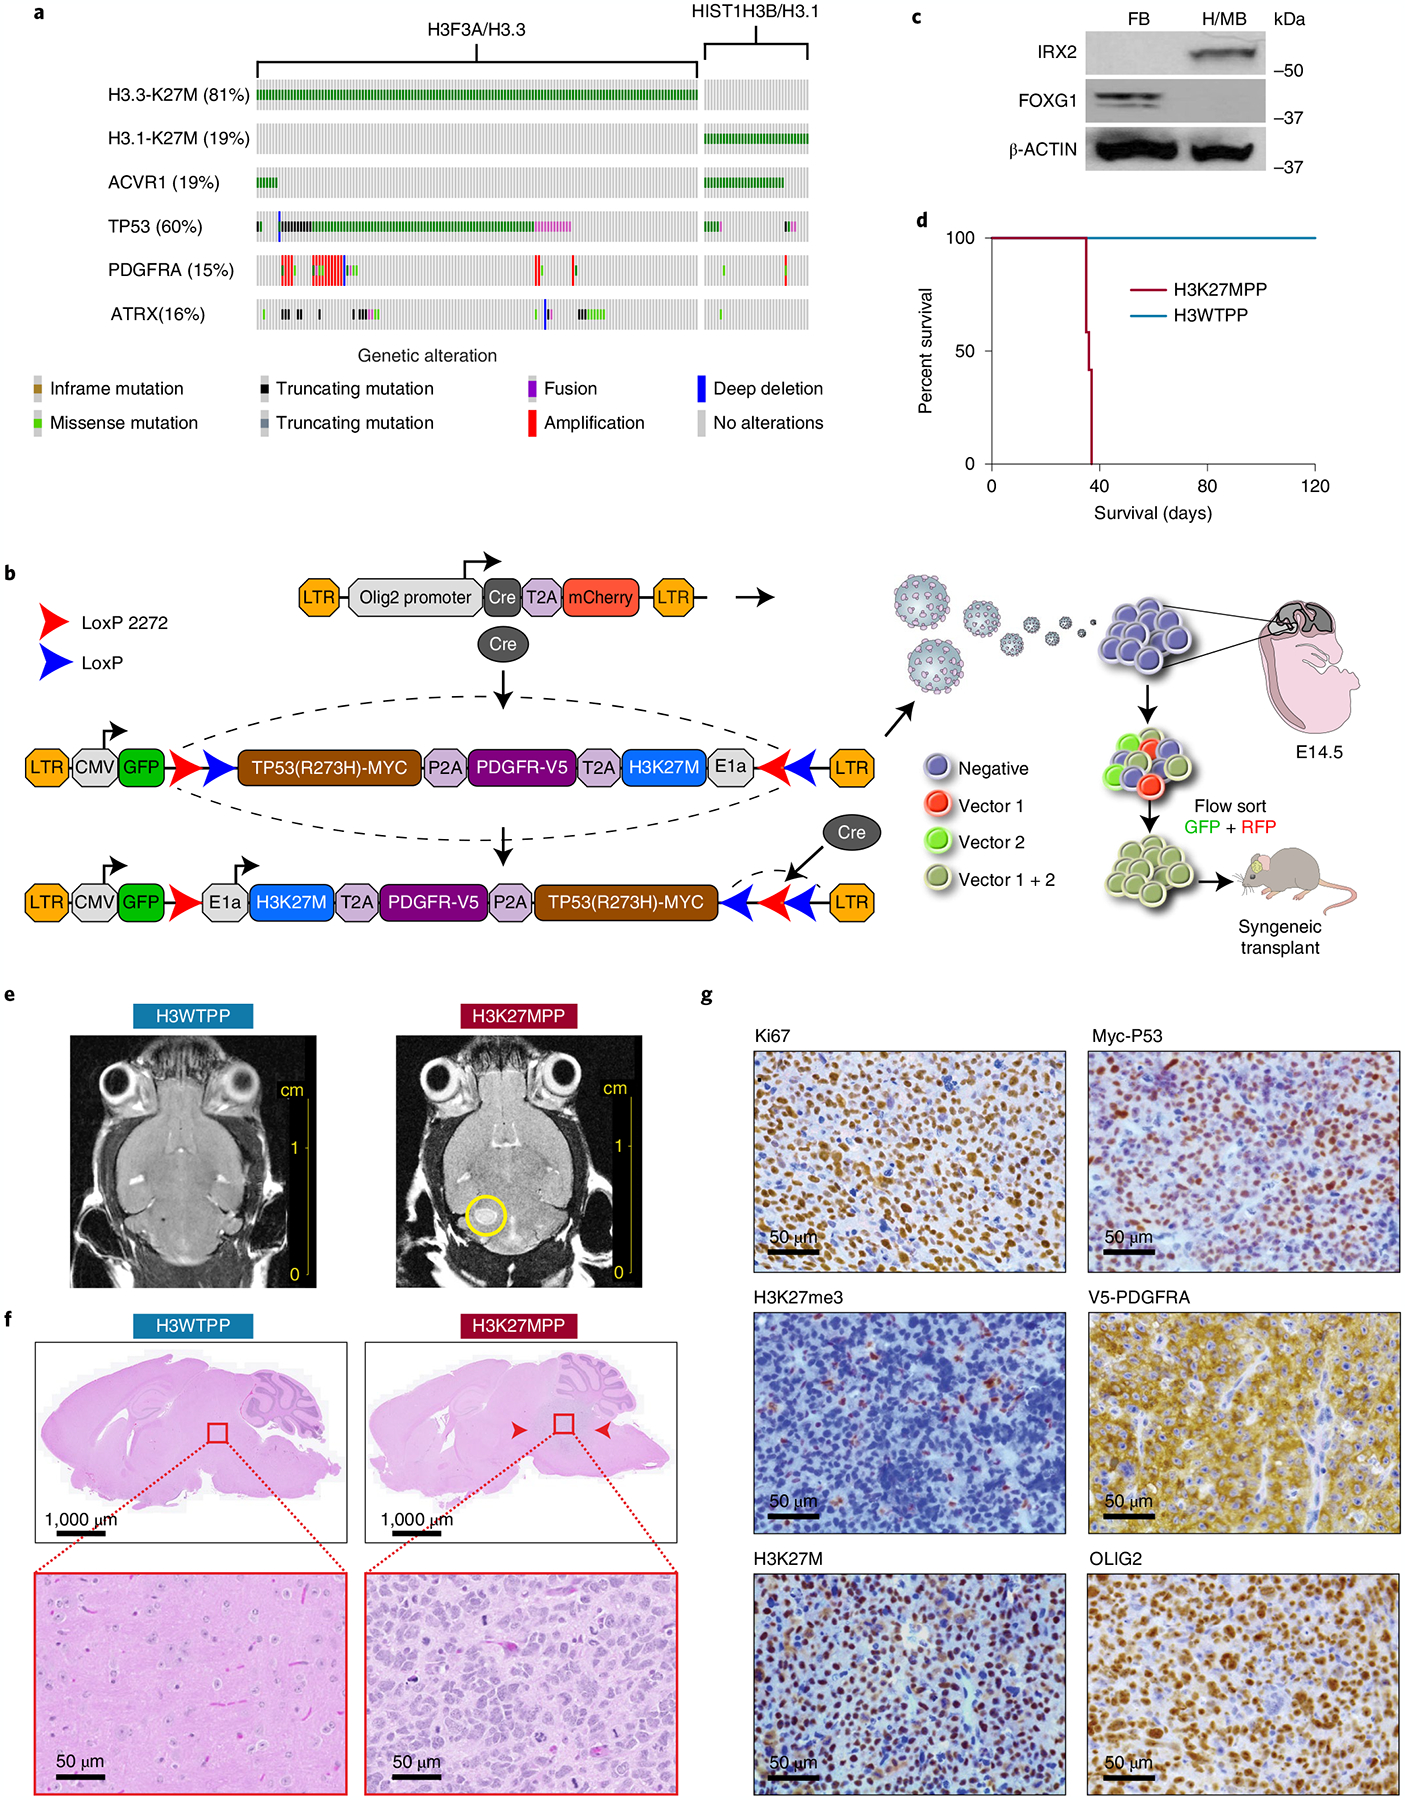
a, Oncoprint of H3K27M mutant tumors with top alterations. In addition to H3K27M, we selected PDGFRA and TP53 to target in our model development. b, Schematic of strategy used to target OLIG2-positive NPCs using flip-excision (FLEx) cassette switches, whereby Olig2 promoter drives Cre expression and the target genes H3F3A, TP53 and PDGFRA are inverted. c, Western blot confirming regional isolation of NPCs. FOXG1 for forebrain and IRX2 for mid/hindbrain. All western blots were performed in biological triplicate. d, Kaplan–Meier survival curve of 2.5 × 10⁴ H3K27MPP cells or H3WTPP cell injected into the midbrain-pons of immunocompetent C57BL/6 mice. A log-rank Mantel–Cox test was performed between the groups with n = 12 mice per group (6 male and 6 female). ****P = 0.0005. e, MRI viewing the axial plane of mice 14 d after injection confirming tumor in H3K27MPP cells. f, Hematoxylin and eosin (H&E) staining confirming high-grade glioma histology from H3K27MPP-injected cells. g, Immunohistochemistry confirming transgene expression in vivo and loss of H3K27me3 in our model. All experiments were performed in biological triplicate.
Generation of a syngeneic mouse model of DMG.
After confirming transgene activation of our cells, we performed stereotactic intracranial injections into the midbrain/brain stem of young male and female Mus musculus C57BL/6 mice (<4 weeks). We used the following coordinates with Lambda (a suture of the skull) serving as the 0 point (coordinates, x = −0.8 mm, y = −0.8 mm, z = 5.0 mm). Mice succumbed to tumors with a median survival of 40–55 d (Fig. 1d). Our vector expressing wild-type H3, PDGFRA and P53 R273H did not form tumors, supporting the requirement for H3K27M in tumor formation in vivo (Fig. 1d). Magnetic resonance imaging (MRI) confirmed tumor formation 2 weeks after implantation in our H3K27MPP cells, but not H3WTPP cells (Fig. 1e). Our model demonstrated 100% penetrance (n = 10) and produced tumors with high-grade glioma histology similar to DIPG and loss of the H3K27me3 mark with healthy adjacent brain used as controls (Fig. 1f,g and Extended Data Fig. 1b).
Transcriptome analysis identifies altered one-carbon metabolism.
To parse the specific molecular mechanisms driving transformation of the H3K27MPP model, we performed whole transcriptome analysis using RNA-sequencing. We performed cross-species analysis comparing our mouse transcriptomes to the four predominant DIPG/DMG human gene signatures: oligodendrocyte precursor-like cells (OPCs), cell cycle (CC), astrocytic cells (ACs) and oligodendrocyte cells (ODCs)22. The H3K27MPP cells displayed the most similarity to the CC signature, with less but notable enrichment in the AC and OPC signatures (Fig. 2a). OLIG2+ NPC control cells were strongly enriched for the OPC signature, whereas H3WTPP cells did not display specific enrichment for any distinct DMG/DIPG gene signature (Fig. 2a). t-distributed stochastic neighbor embedding (t-SNE) confirmed our three cell groups populations were transcriptionally distinct (Extended Data Fig. 1c).
Fig. 2 |. Transcriptional profiling identifies alteration in methionine metabolism in DMG.
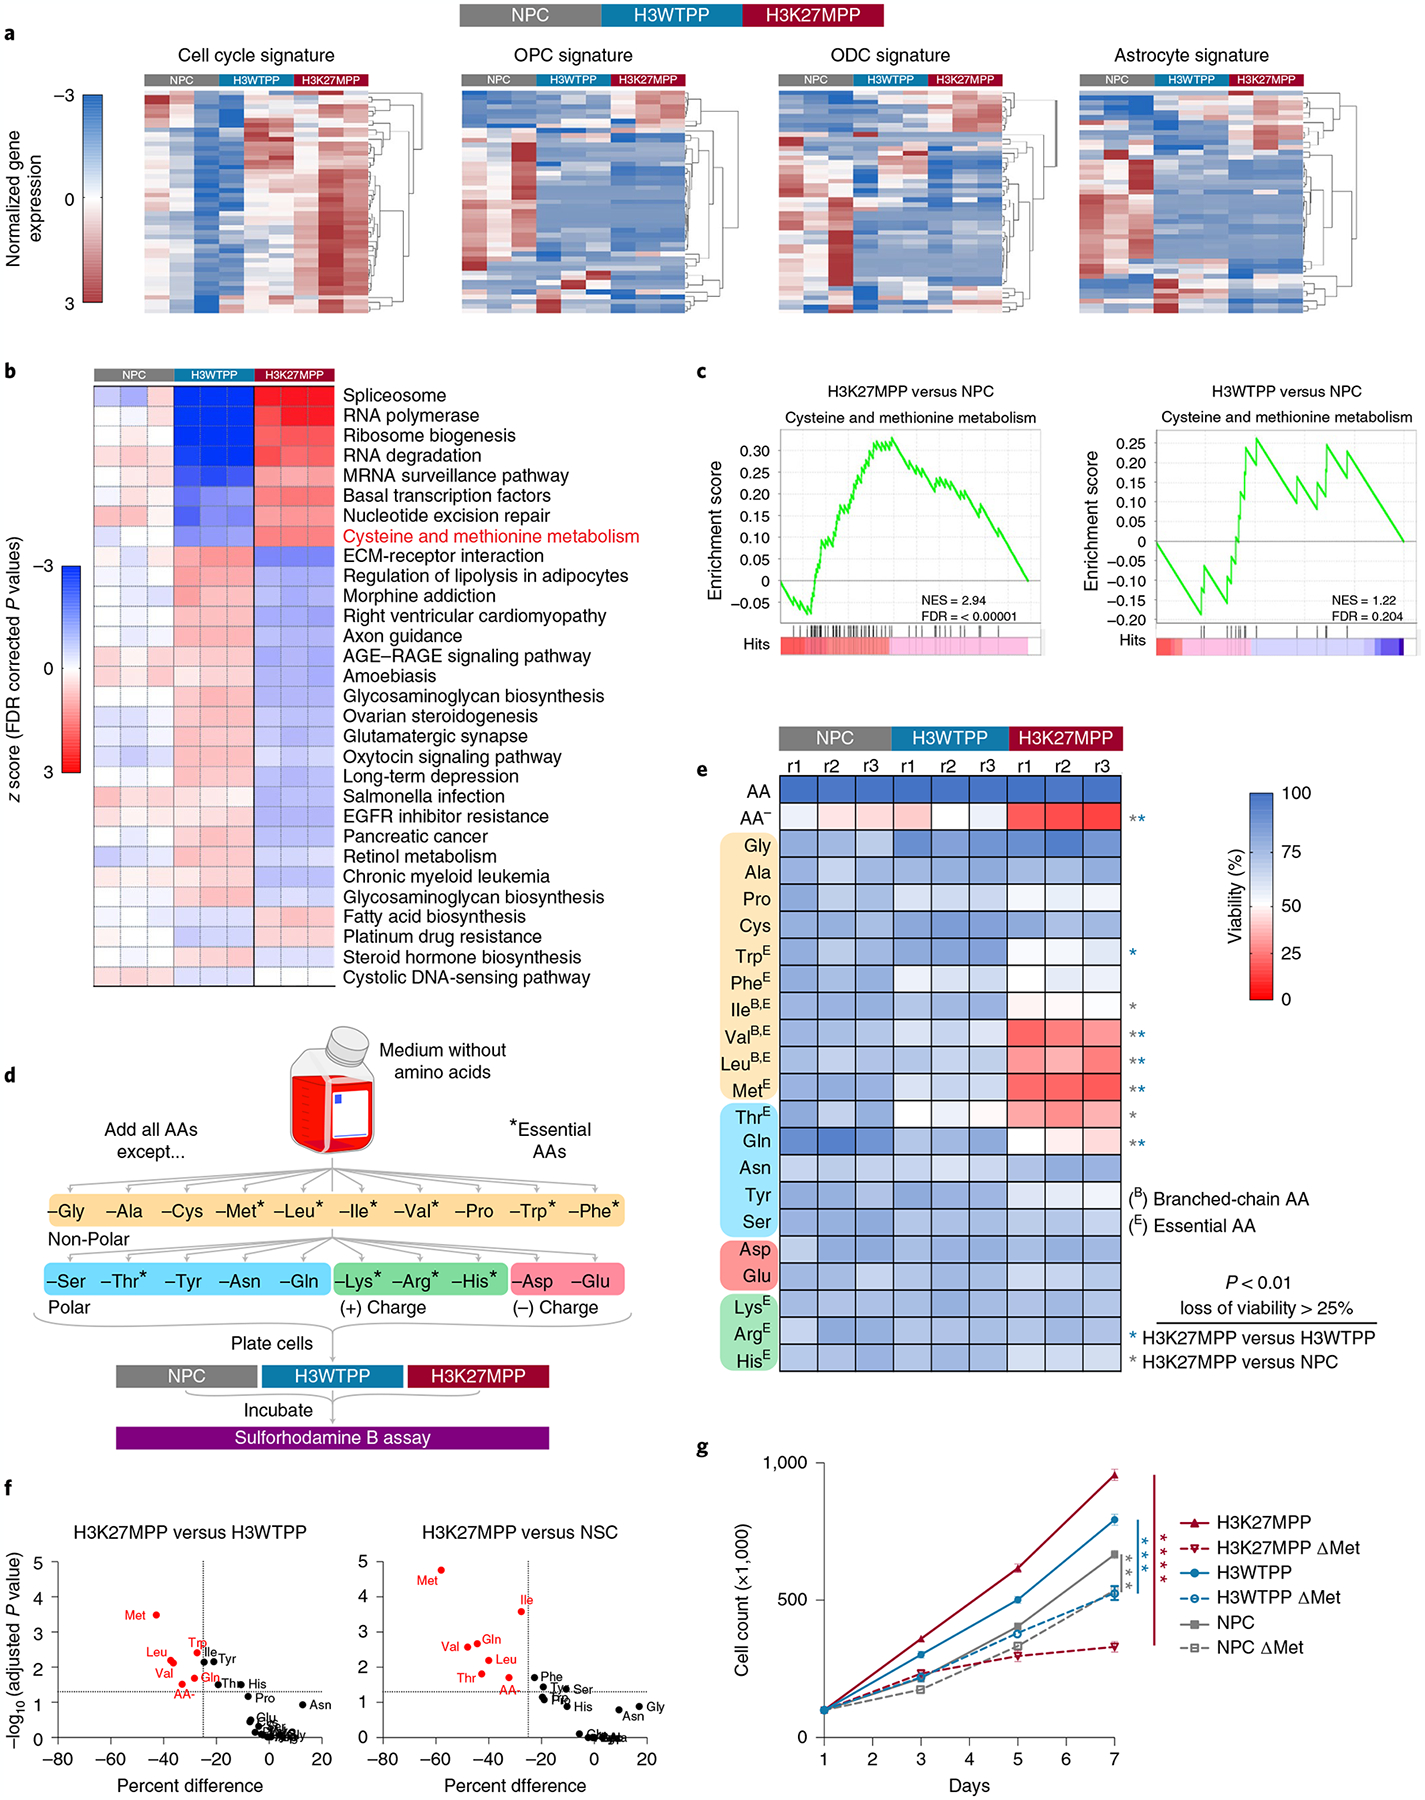
a, Hierarchical clustering (HCL) of 1,500 most variable genes among H3K27MPP cells, H3WTPP cells and OLIG2-positive NPCs. b, KEGG pathway analysis comparing NPC, H3WTPP, and H3K27MPP cells. The P values were corrected for multiple testing using FDR. c, GSEA plots of H3K27MPP and H3WTPP cells compared to NPC control cells for cysteine and methionine metabolism. d, Schematic of AA dropout screen, where AAs are grouped by their properties and essentiality. e, AA dropout screen in control OLIG2-positive NPCs, H3K27MPP cells and H3WTPP cells. The screen was performed in biological triplicate with technical replicates of n = 3. P values are provided for AAs that resulted in >25% loss of viability compared to control (H3K27MPP versus H3WTPP Met P = 0.000014, Trp P = 0.000185, Leu P = 0.000321, Val P = 0.00045, Gln P = 0.001304, AA− P = 0.00207; H3K27MPP versus NSC Met P = 0.000001, Ile P = 0.000013, Gln P = 0.000108, Val P = 0.000141, Leu P = 0.000357, Thr P = 0.000915, AA− P = 0.002651). f, Graphical representation of data in e plotted to percentage difference in viability against −log10(adjusted P value). Comparison of H3K27MPP versus H3WTPP (left), comparison of H3K27MPP versus NSC (right). g, Direct cell counts of control, H3WTPP and H3K27MPP cells in control and methionine-depleted medium. Experiments were performed in biological triplicate. Statistical analysis was performed on day 7 using an unpaired, two-tailed t-test. Data are represented as the mean ± s.e.m. (H3K27MPP versus H3K27MPP + MR P = 0.000003; H3WTPP versus H3WTPP + MR P = 0.000145; and NSC versus NSC + MR P = 0.000479). *P < 0.05, **P < 0.01, ***P < 0.001, ****P < 0.0001. Data in a–c were analyzed from RNA-sequencing performed in biological triplicate for each condition. Statistical analysis was performed using multiple unpaired t-tests and the Holm–Šídák method was used for multiple comparisons (e,f).
To identify differentially expressed genes (DEGs), we compared the transcriptomes of control NPC, H3WTPP and H3K27MPP cells against each other using DESeq2 with significance established at twofold change with a false discovery rate (FDR)-corrected P value <0.05. A summary of the DEGs between the comparisons is presented in Extended Data Fig. 1d–f and Supplementary Table 1. Due to the expected large transcriptional changes, we performed Kyoto Encyclopedia of Genes and Genomes (KEGG) enrichment analysis to identify top differential biological processes among the three cell types (Fig. 2b). Splicing and various RNA-processing pathways or transcription were enriched in H3K27MPP cells, as previously reported (Fig. 2b)14. Of interest was the enrichment of cysteine and methionine metabolism in H3K27MPP cells but not H3WTPP cells compared to NPC controls (Fig. 2b,c). Gene Ontology (GO) analysis also identified enrichment of S-adenosyl methionine (SAM)-dependent and methyltransferase activity in H3K27MPP cells compared to H3WTPP cells (Extended Data Fig. 1g).
H3K27MPP cells are sensitive to AA withdrawal, including methionine.
Given the compelling involvement of cysteine and particularly methionine in our pathway analysis, we sought to extend our transcriptomic data with a comprehensive AA dropout screen to evaluate which AAs impact DIPG growth (Fig. 2d). We systematically removed all individual AAs from our media. As anticipated, compared to complete control NPC medium, H3K27MPP cells had the greatest reduction of cell biomass as evaluated by Sulforhodamine B (SRB) assay in AA-removed conditions (Fig. 2e,f). We next queried whether restriction of any single AA resulted in preferential decrease in viability in our H3K27MPP model versus H3WTPP or control mNPCs. Medium depleted of glutamine (Q), threonine (T), methionine (M) and the branched-chain AAs, valine (V), leucine (L) and isoleucine (I), significantly reduced H3K27MPP viability compared to other cells (Fig. 2e,f). Methionine removal caused a 75% reduction in viability, validating our pathway analysis from transcriptomic data. The critical vulnerability of H3K27MPP cells, but not H3WTPP or healthy NPCs, to methionine depletion was observed even with medium changed daily to account for the faster proliferation of H3K27MPP (Fig. 2g), eliminating the impact of alternative dependencies.
Murine Mat2a is a key driver of methionine metabolism in DIPG.
Methionine-restricted diets and therapeutic targeting of the methionine cycle present translational paradigms where cancer but not healthy cells manifest a high dependency on methionine (Fig. 3a)27. Due to the pleotropic effects of methionine metabolism28, we hypothesized that enzymes involved in methionine metabolism or one-carbon metabolism may selectively target H3K27MPP cells. To identify such genes in H3K27M-driven methionine dependence, we performed a short-interfering RNA (siRNA) screen targeting 19 genes critically involved in the methionine cycle and one-carbon metabolism, herein referred to as methionine metabolism (Fig. 3b and Extended Data Fig. 2a). Mat2a and Amd1 loss selectively targeted H3K27MPP cells, but not H3WTPP cells or NPCs, with a greater than twofold effect on cell viability (Fig. 3b and Extended Data Fig. 2a). Using an orthogonal approach, H3K27MPP cells, but not isogenic H3WTPP cells or control NPCs, were sensitive to both a MAT2A inhibitor and an AMD1 inhibitor, as evaluated by direct cell counts (Extended Data Fig. 2b,c). H3K27MPP cells had lower MAT2A and higher AMD1 protein levels (Fig. 3c). MAT2A catalyzes the production of SAM from methionine and adenosine triphosphate (ATP), with SAM being the primary methyl donor in methyltransferase activity. We further interrogated the role of MAT2A, given its central role in methionine metabolism and methylation reactions, using non-targeting and murine Mat2a-targeting doxycycline (dox)-inducible shRNA to generate H3K27MPP control and MAT2A protein knockdown cells (Fig. 3d). MAT2A protein loss induced growth defects over several time points (Fig. 3e). To ascertain the role of H3K27M, we developed a dox-inducible H3K27M or wild-type control system construct into E14.5 OLIG2+ NPCs (Fig. 3f). H3K27M was sufficient by itself to reduce MAT2A and increase AMD1 protein levels (Extended Data Fig. 2d) and increase proliferation and sensitivity to methionine restriction (MR) (Fig. 3g). Removal of dox by day 3 restored MAT2A protein, reduced AMD1 protein levels and rescued cell counts in MR media compared to cells with continual dox treatment and persistent H3K27M expression (Fig. 3h and Extended Data Fig. 2d). These data suggest that H3K27M is the primary sensitizer to MR.
Fig. 3 |. H3K27M, PDGFRA and P53 R237H cooperate to alter metabolism.
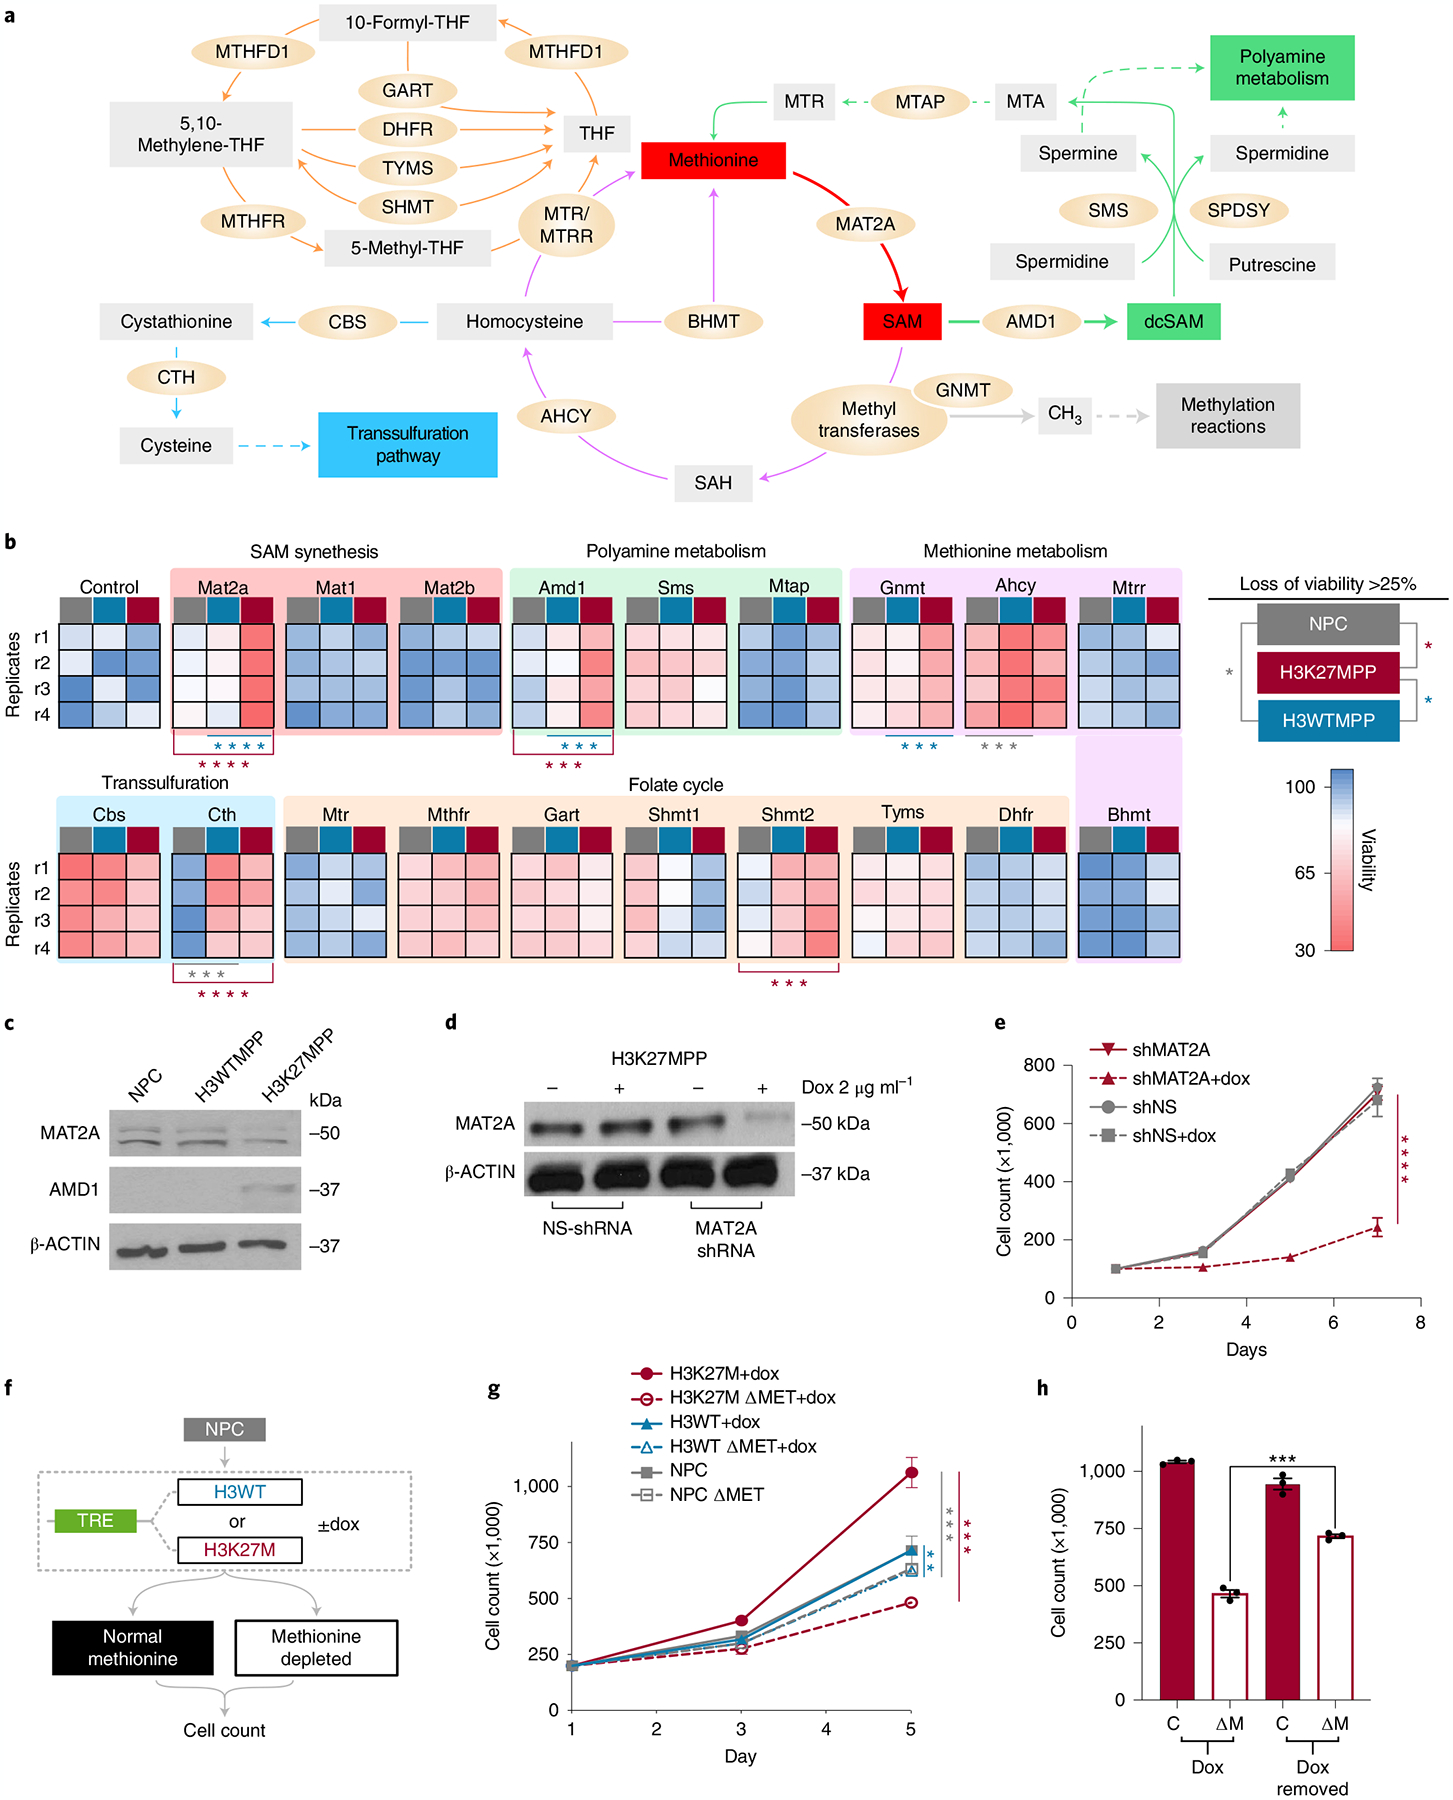
a, Methionine metabolism containing the methionine cycle, folate cycle and methionine salvage/polyamine pathways. b, siRNA screen targeting several enzymes and proteins related to methionine metabolism. Data are represented as a heat map of the average of four independent biological replicates. Statistical analysis was performed using multiple unpaired t-tests; the Holm–Šídák method was used for multiple comparisons. P values provided for siRNA that resulted in >25% loss of viability compared to control. H3K27MPP versus NSC Mat2a (P < 0.000001), Cth (P = 0.000064), Amd1 (P = 0.000118) and Shmt2 (P = 0.000149). H3K27MPP versus H3WTPP Mat2a (P < 0.000001), Gnmt (P = 0.000138) and Amd1 (P = 0.00048). H3WTPP versus NSC Cth (P = 0.000326) and Ahcy (P = 0.00034). Graphical representation of all siRNA percentage change to significance is provided in Extended Data Fig. 2a. *P < 0.05, **P < 0.01, ***P < 0.001, ****P < 0.0001. P > 0.05 not shown. c, Western blot comparing MAT2A and AMD1 expression in H3WTPP, H3K27MPP and control OLIG2-positive NPCs. d, Western blot confirming MAT2A knockdown with non-targeting and MAT2A dox-inducible shRNA in H3K27MPP cells. e, Cell count of H3K27MPP cells over several time points with control or MAT2A knockdown. Experiments were performed in biological triplicate. Statistical analysis was performed on day 7 (shMat2a versus shMat2a + dox, ****P = 0.000037; P > 0.05 not shown). f, Schematic of dox-inducible H3K27M and H3WT constructs introduced into NPCs. g, Cell counts of control NPC, dox-inducible H3WT and H3K27M in methionine-depleted conditions (P < 0.05). Experiments performed were in biological triplicate. Statistical analysis was performed on day 5 (H3K27MPP + dox versus H3K27MPP + dox + MR P = 0.000132; H3WTPP + dox versus H3WTPP + dox + MR P = 0.001547; NPC + MR versus H3K27MPP + dox + MR P = 0.000378). *P < 0.05, **P < 0.01, ***P < 0.001, ****P < 0.0001. h, Cell count of H3K27MPP in methionine-depleted conditions comparing the cells incubated in dox and cells removed from dox conditions. Experiments were performed in biological triplicate. Statistical analysis was performed on day 5. (H3K27MPP dox removed + MR versus H3K27MPP + dox + MR ***P = 0.0002). Experiments were performed in biological triplicate (c,d). Statistical test was an unpaired, two-tailed t-test and data are represented as mean ± s.e.m. (e,g,h).
DMG cells display reduced MAT2A protein expression.
We hypothesized that sensitivity to MAT2A loss in DMG could be attributed to MTAP deletion. MAT2A inhibition is synthetically lethal in several cancers with homozygous deletion of S-methyl-5ʹ-thioadenosine phosphorylase (MTAP), a gene neighboring the frequently deleted tumor suppressor loci of CDKN2A/B on chromosome 9p29. Unlike in adult glioblastoma (GBM), pediatric high-grade gliomas, including DMG/DIPG, have low rates of MTAP deletion (Fig. 4a; 44% versus 7%, *P < 0.05 by Fisher’s exact test). To explore an alternative hypothesis, we interrogated MAT2A protein expression by analyzing protein levels of MAT2A and other proteins involved in methionine metabolism in DMG cell lines in comparison to control human neural stem cells (NSCs), several adult GBM (aGBM) lines and hemispheric pediatric high-grade glioma (PHGG) lines. DMG lines consistently had lower MAT2A protein levels compared to NSCs, aGBM and PHGG lines (Fig. 4b,c). Lower MAT2A protein levels in H3K27M DMG suggest that residual MAT2A expression is critical for DMG survival, similar to residual EZH2 expression reported in previous DMG studies30. Consistent with lower MAT2A protein expression, mass spectrometry (MS) confirmed that DIPG cells had lower SAM levels, lower S-adenosylhomocysteine (SAH) levels and higher SAM:SAH ratios (Fig. 4d–i).
Fig. 4 |. MAT2A expression is lower in DIPGs.
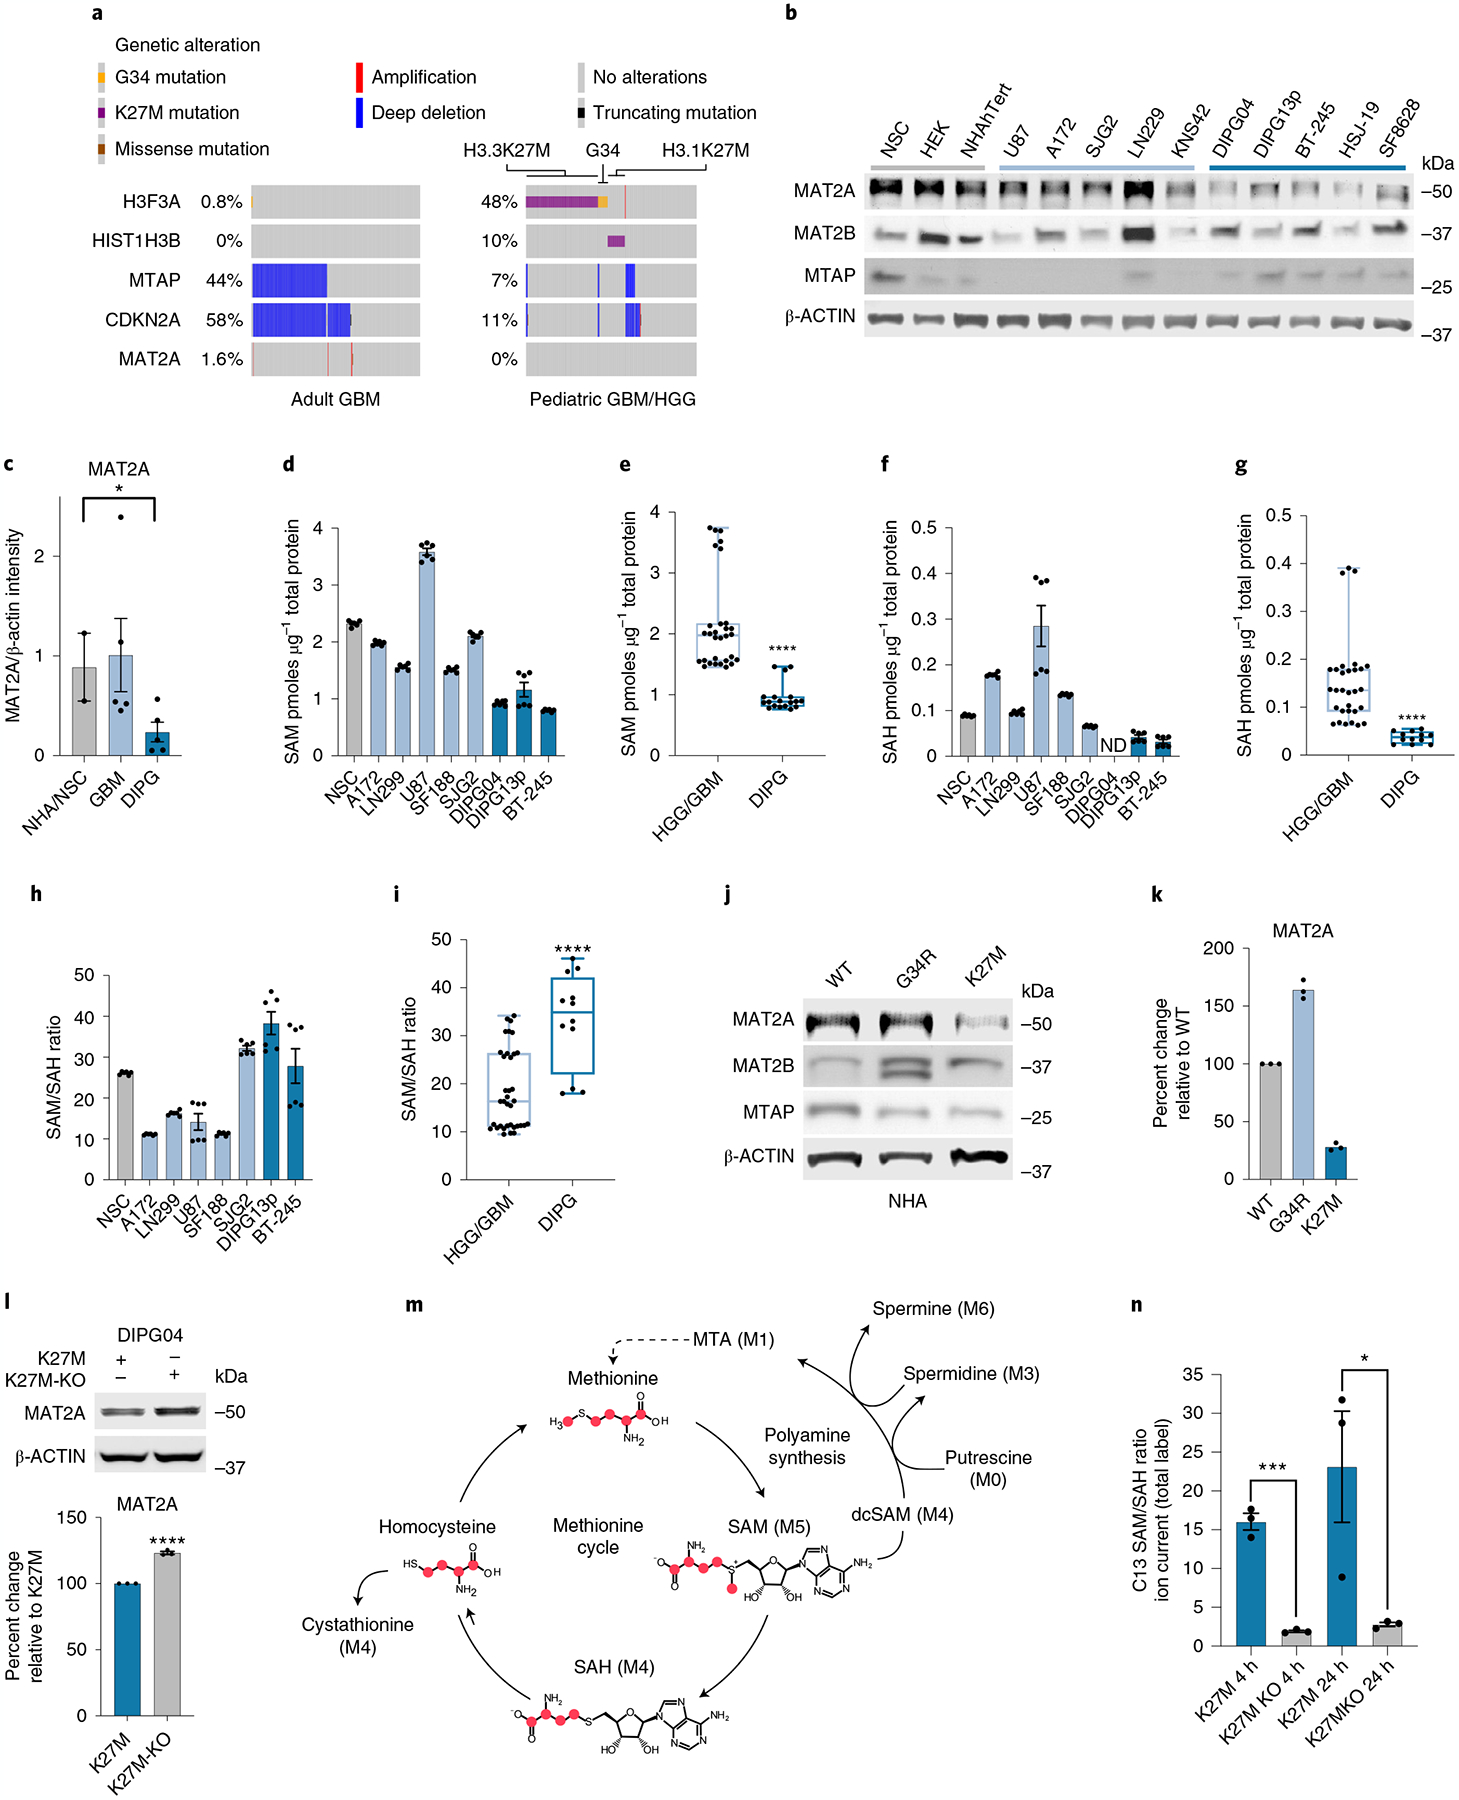
a, Oncoprint visualizing MTAP deletion in adult GBM (TCGA PanCancer Atlas)68 and PHGG dataset (ICR London)24. Data were generated using the PedcBioPortal69,70. b, Quantitative western blotting of proteins involved in methionine metabolism in DMG, PHGG, aGBM and control cells. This experiment was performed in biological duplicate. c, Quantification of western blots using LI-COR fluorescent secondary antibodies with the LI-COR Odyssey Clx Imaging System. Quantification was performed in the linear range through Image Studio Lite (v.5.2). Healthy brain n = 2, GBM n = 5 and DIPG n = 5. Biological samples were measured three times and the average intensity was plotted for each biological replicate. Healthy brain versus DIPG *P = 0.0447; P > 0.05 not shown. d–g, MS-based quantification of SAM (d) and SAH (f) across DMG, HGG and control cells. DIPG04 SAH was below the detectable threshold and designated as not detected (ND). Comparison of mean quantifications of SAM (e) between three DMG and five HGG cell lines (n = 6 biological replicates/cell line) (****P ≤ 0.0001). Comparison of mean quantifications of SAH between DMG and HGG groups (g). Statistical analysis was performed on five GBM cell lines and two DIPG cell lines (n = 6 biological replicates per cell line; ****P < 0.0001). h,i, Ratio of SAM/SAH in DMG, HGG and control cells (h). Comparison of mean SAM/SAH ratio between five GBM cell lines and two DIPG cell lines (n = 6 biological replicates per cell line) (****P < 0.0001) (i). j,k, Quantitative western blot of NHAs expressing wild-type, H3.3 G34R (hemispheric pHGG histone mutation) or H3K27M mutations (j). Quantification of western blots using Li-Cor fluorescent system of j (k). Samples were repeatedly measured in technical triplicates. l, Western blot of MAT2A in CRISPR-corrected H3K27M KO DIPG04 versus K27M control. Quantification of western blots using LI-COR fluorescent system (bottom). n = 3 biological replicates. Biological samples were measured three times and the average intensity was plotted for each biological replicate (****P < 0.0001). m, C13 labeling of methionine with respective isotope derivatives. n, Ratio of SAM/SAH derived from C13 methionine labeling flux analysis of CRISPR-corrected DIPG04 versus DIPG04 control. n = 3 biological replicates for each cell line (K27M versus K27MKO at 4 h ***P = 0.0002; and K27M versus K27MKO 24 h *P = 0.0471). *P < 0.05, **P < 0.01, ***P < 0.001. Box and whiskers are defined by the center line denoting the median and the lower and upper ends of the box denote the 25th and 75th percentiles, respectively (e,g,i). The whiskers indicate the maximum and the minimum values of the data distribution. Statistical analysis was performed using an unpaired, two-tailed t-test (c,e,g,i,l,n). Data are displayed as mean ± s.e.m. (c,d,f,h,l,n).
To investigate whether H3K27M mutations lower MAT2A protein expression, we transduced normal human astrocytes (NHAs) with either H3K27M, histone H3 G34R (H3G34R) and wild-type H3 lentivirus. Only H3K27M-expressing NHAs showed a reduction of MAT2A (Fig. 4j,k), which we also observed in our H3K27MPP model (Fig. 3c). Conversely, KO of H3K27M (KO cells) in patient-derived DIPG04 cells, using a CRISPR-mediated strategy, increased MAT2A protein expression (Fig. 4l)13,14. To test the hypothesis that reduced MAT2A, SAM and SAH levels in H3K27M-mutant cells may be indicative of impaired methylation reactions, we performed C13-methionine-labeling experiments at sequential time points and observed that DIPG04 cells with H3K27M removal (KO) showed a notable decrease in the SAM:SAH ratio (Fig. 4m,n), a surrogate indicator of increased methyltransferase activity. Collectively, these data support that H3K27M can impair MAT2A protein and impair global methylation potential.
MAT2A is a therapeutic vulnerability in DIPG.
To complement our mouse model work, we targeted MAT2A expression in patient-derived H3K27M DMG cells. We used an inducible shRNA targeting human MAT2A in three H3K27M-mutant DMG lines: DIPG04, DIPG13p and BT-245. Immunoblotting confirmed efficient MAT2A knockdown using two independent dox-inducible shRNAs targeting MAT2A and a non-silencing shRNA control within 5 d (Fig. 5a–c). Loss of MAT2A reduced growth and viability evaluated over 4 d (Fig. 5d–f). MAT2A knockdown resulted in reduced SAM production (Fig. 5g). We also observed a modest increase of cells in the G1 cell cycle phase and corresponding decrease of cells in the S phase of the cell cycle in all three lines (Extended Data Fig. 3a–c). We complemented our genetic approach with pharmacological inhibition of MAT2A. We inhibited MAT2A using AG-24512 (a MAT2A competitive inhibitor) at varying concentrations in our DIPG, PHGG and aGBM cell lines. DIPG cells had lower half-maximal effective concentrations (EC50) compared to PHGG lines, human NSCs and NHAs (Fig. 5h and Extended Data Fig. 3d–f for extended EC50 data). Of note, EC50 values of AG-24512 for H3K27M DMGs were lower compared to high-grade gliomas stratified by MTAP status (Fig. 5h and Extended Data Fig. 3d). To complement our knockdown and pharmacological data and ascribe the sensitivity of the inhibitor to MAT2A, we overexpressed MAT2A in DIPG cells. Overexpression of MAT2A in DIPG04 and BT-245 cells resulted in a reduction of cell proliferation by day 5 and increased EC50 values to AG-24512 (Fig. 5i–n). Similar data were observed in our H3K27MPP model (Extended Data Fig. 4a–c).
Fig. 5 |. Silencing MAT2a inhibits patient-derived DIPG lines.
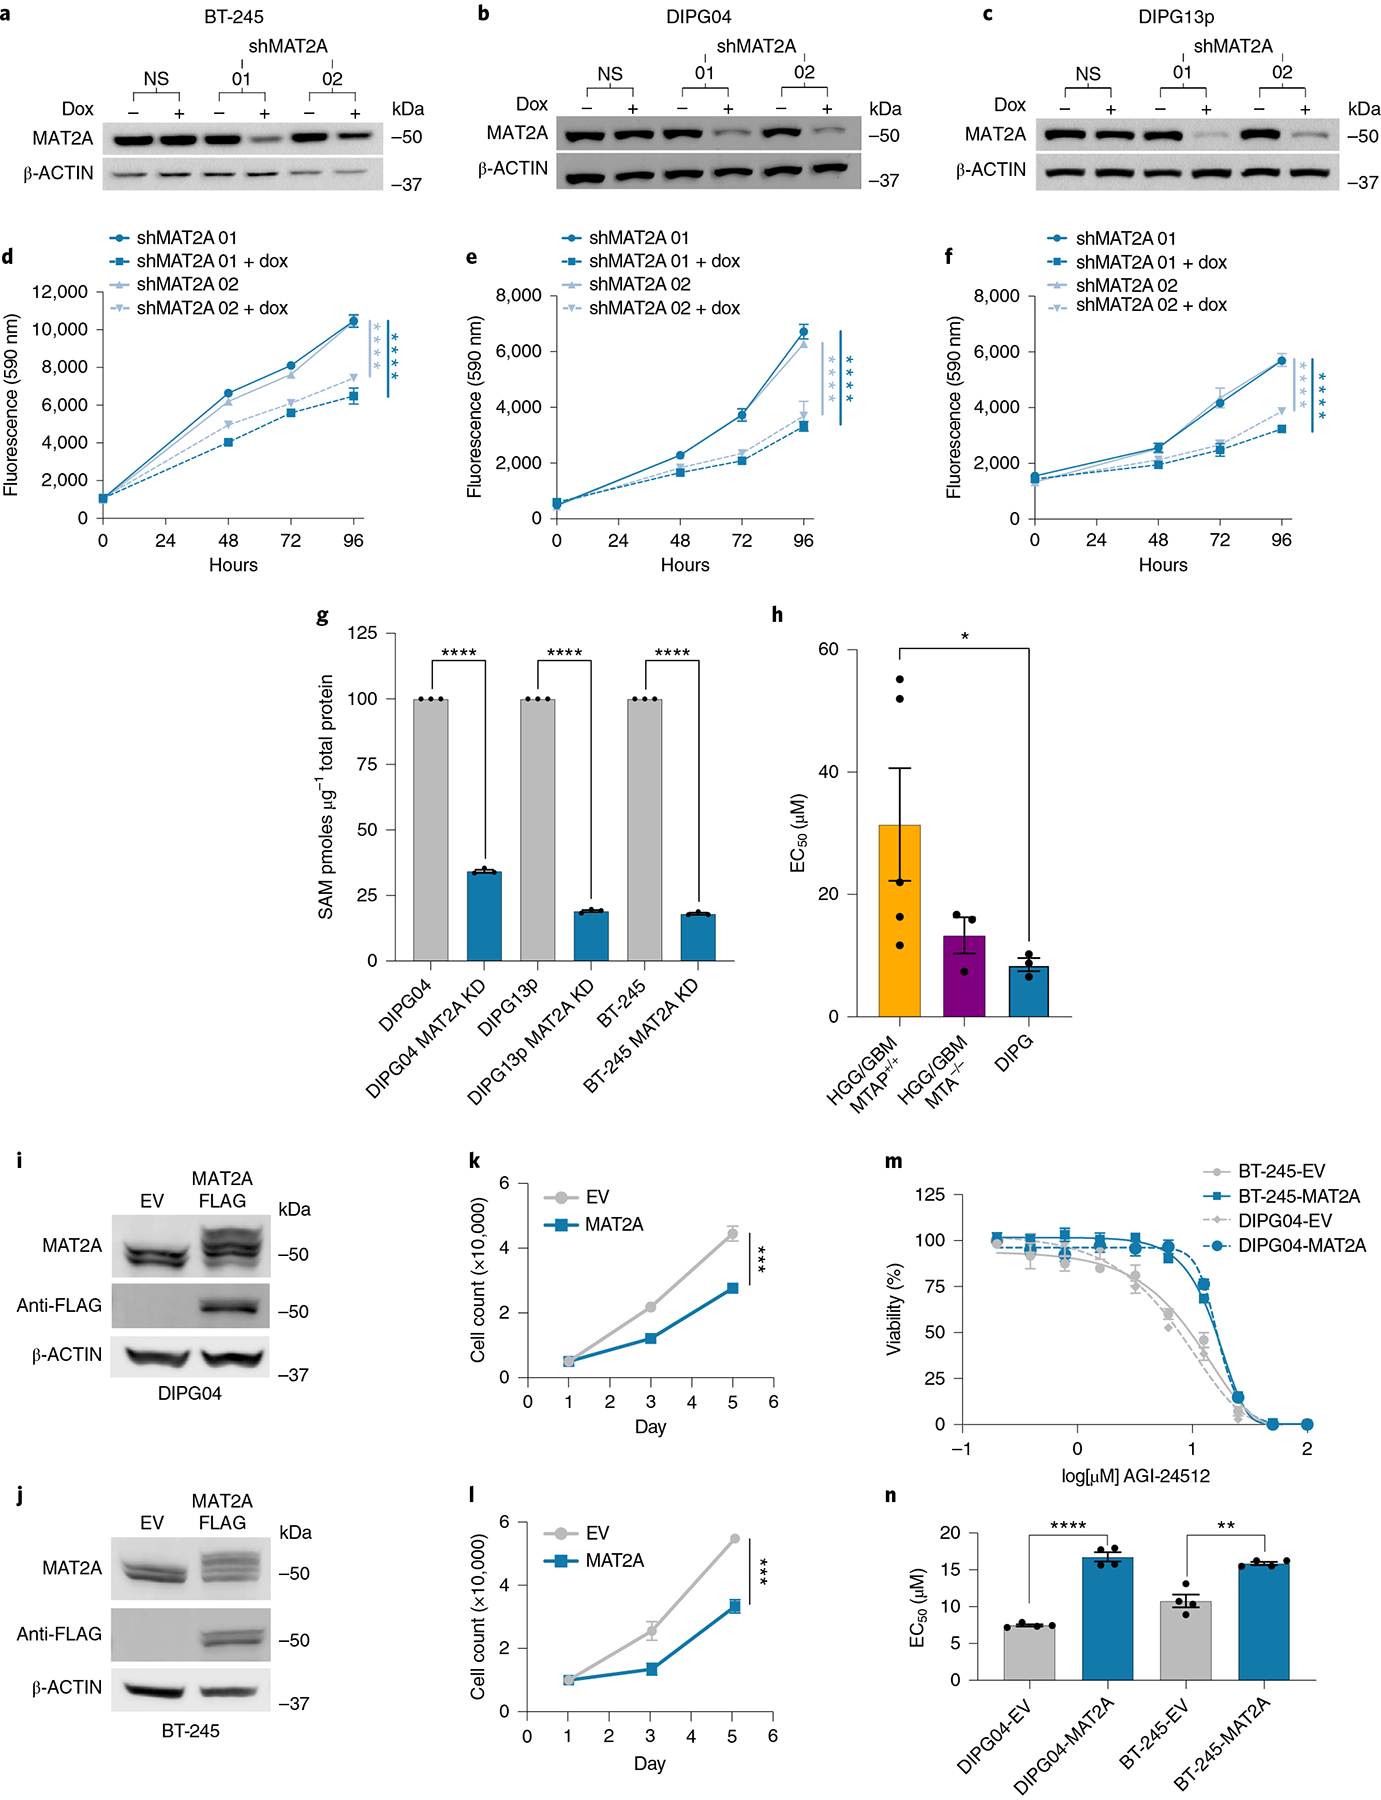
a–c, Western blot confirming knockdown of MAT2A using dox-inducible shRNA. BT-245 (a), DIPG04 (b) and DIPG13p (c) cells were treated with dox for 120 h. d–f, Alamar blue, cell viability assay of BT-245 (d), DIPG04 (e) and DIPG13p (f) cells treated with or without dox (MAT2A knockdown). Cell growth was evaluated over 4 d. Experiments were performed in four biological replicates. BT-245 (shMAT2A01 versus shMAT2A01 + dox ****P = 0.000014) and (shMAT2A02 versus shMAT2A02 + dox ****P < 0.000001) (d). DIPG04 (shMAT2A01 versus shMAT2A01 + dox ****P = 0.000067) and (shMAT2A02 versus shMAT2A02 + dox ****P < 0.000001) (e). DIPG13p (shMAT2A01 versus shMAT2A01 + dox ****P = 0.000032) and (shMAT2A02 versus shMAT2A02 + dox ****P < 0.000001) (f). g, MS-based quantification of SAM between control and MAT2A knockdown cells. n = 3 biological replicates for each condition (DIPG04 versus DIPG04 MAT2A knockdown ****P < 0.0001; DIPG13p versus DIPG13p MAT2A knockdown ****P < 0.0001; and BT-245 versus BT-245 MAT2A knockdown ****P < 0.0001). h, Comparison of mean EC50 values across DMG, HGG/GBM-MTAP-deleted and wild-type (WT) cell lines (n = 5 GBM-MTAP+/+, n = 3 GBM-MTAP−/−, n = 3 DIPG). Statistical analysis was performed using two-tailed Mann–Whitney U-test. Data are displayed as mean ± s.e.m. (HGG/GBM MTAP+/+ versus DIPG *P = 0.0357; P > 0.05 not displayed). i,j, Western blot of DMG cell lines expressing MAT2A–FLAG DIPG04 (i) and BT-245 (j). k,l, Cell count of DMG cell lines expressing MAT2A–FLAG DIPG04 (k) and BT-245 (l). Experiments performed were in biological triplicate. Statistical analysis was performed at day 5 (DIPG04–EV versus DIPG04–MAT2A–FLAG ***P = 0.000121 (k) and BT-245-EV versus BT-245–MAT2A–FLAG ***P = 0.000325 (l)). m, MAT2A inhibitor (AGI-24512) dose–response of DMG cell lines, DIPG04 and BT-245 expressing MAT2A–FLAG compared to control lines. Experiments were performed in biological sextuplicate. Data are displayed as mean ± s.e.m. n, Comparison of EC50 values of DMG cell lines, DIPG04 and BT-245 expressing MAT2A–FLAG compared to isogenic controls. Experiments were performed in biological quadruplicate (DIPG04–EV versus DIPG04–MAT2A–FLAG ****P < 0.0001; and BT-245–EV versus BT-245–MAT2A–FLAG **P = 0.0013). *P < 0.05, **P < 0.01, ***P < 0.001, ****P < 0.0001. Western blots were performed in biological triplicate (a–c,i,j). Statistical analysis was performed using a two-tailed, unpaired t-test (d–g,k,l,n). Data are displayed as mean ± s.e.m.
H3K27M represses MAT2A protein expression via AMD1.
To interrogate the molecular mechanism by which H3K27M represses MAT2A, we postulated that deregulation of genes in methionine metabolism creates an imbalance or negative feedback, as evidenced by several studies on methionine metabolism31,32. We interrogated the Krug et al. chromatin immunoprecipitation sequencing (ChIP-seq) dataset, assaying for H3K27me3 levels in control H3K27M cells and isogenic KO cells13. KO of H3K27M by CRISPR-CAS9 restores H3K27me3-repressive chromatin marks and inhibits several oncogenic gene pathways. Interrogating this dataset (ranked by z score), H3K27M-mutant lines BT-245 and DIPG13p (both used in this study) had complete loss of H3K27me3 levels at the AMD1 locus and isogenic H3K27M KO lines (H3K27M KO) had a restoration of locus wide repressive mark H3K27me3 (Fig. 6a,b). Moreover, AMD1, which converts SAM to decarboxylated S-adenosyl methionine (dcSAM), was the second differential hit from our methionine siRNA screen. AMD1 was preferentially expressed at the protein level in DIPG cells compared to NSC (negative for AMD1 expression) and was higher in DIPG lines when compared to NHAs, PHGGs and aGBM (Fig. 6c).
Fig. 6 |. AMD1 Downregulates MAT2a.
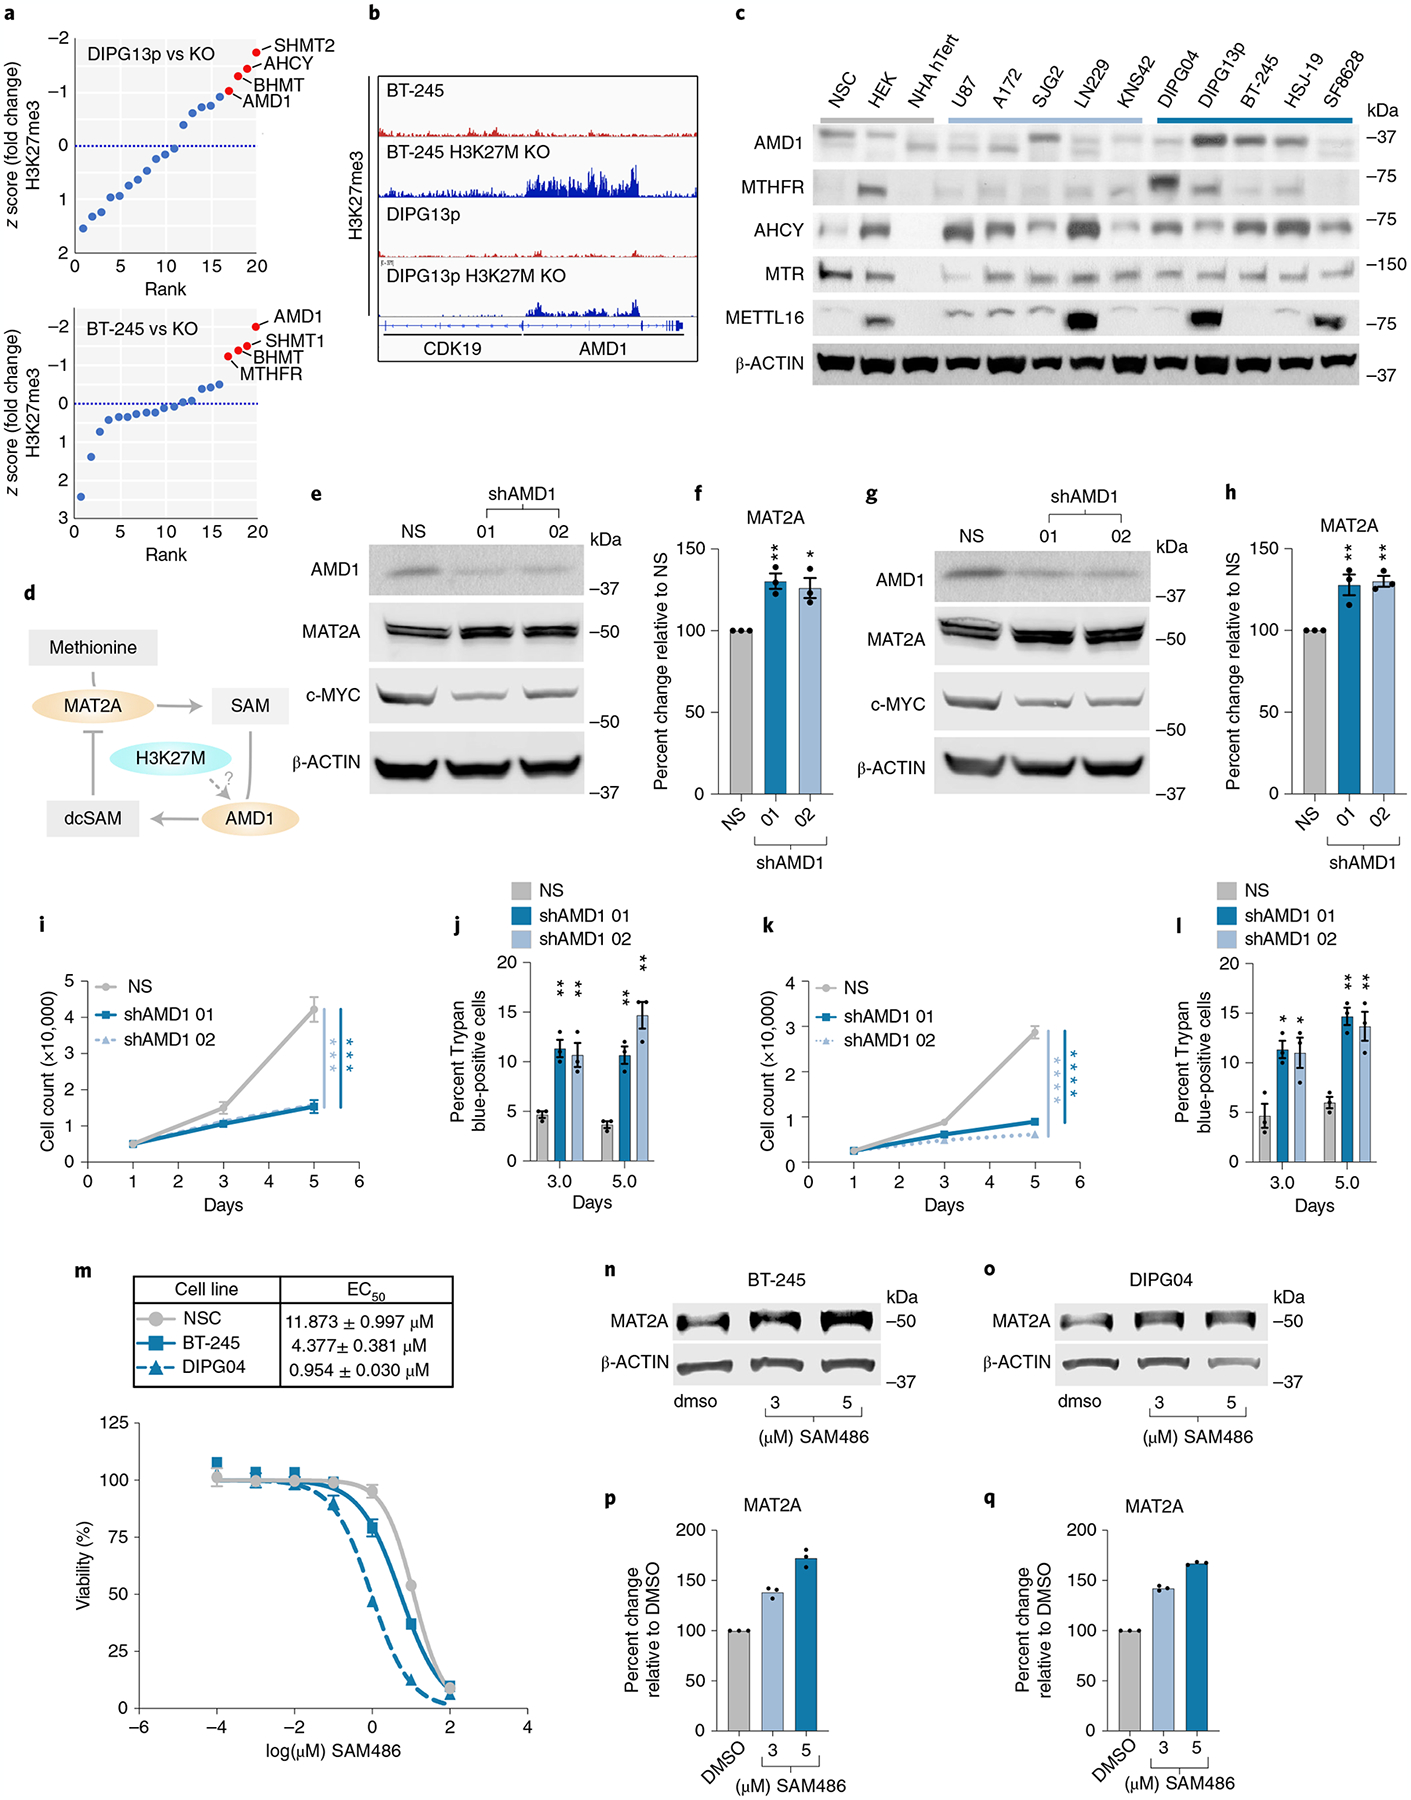
a, Distribution of z-scored H3K27me3 fold change in DMG cell lines versus isogenic CRISPR-corrected H3K27MKO, DIPG13p and BT-245. b, Integrated genomics viewer output of H3K27me3 ChIP-seq data at the AMD1 locus in H3K27M lines and isogenic lines with H3K27M KO. c, Western blotting of several components of methionine metabolism in DMG, PHGG, aGBM and control cells. d, Proposed hypothesis of MAT2A-reduced protein expression via AMD1 and dcSAM. e–h, Quantitative western blotting of MAT2A and C-MYC in AMD1 knockdown BT-245 (e) and DIPG04 (g). Quantification of MAT2A using Li-Cor fluorescent system in AMD1 knockdown (f) BT-245 and (h) DIPG04. n = 3 Biological replicates and samples were repeatedly measured three times. Statistical analysis was performed using a one-way analysis of variance (ANOVA) followed by a one-sided Tukey’s multiple comparison test. Data are displayed as mean ± s.e.m. (shAMD1_01 **Adjusted P = 0.0072, shAMD1_02 *Adjusted P = 0.0145) (f) and shAMD1_01 **Adjusted P = 0.0074, shAMD1_02 **Adjusted P = 0.0051 (h); adjusted P > 0.05 not displayed). i. Cell count in DMG lines BT-245 cells with AMD1 knockdown, days 1, 3 and 5. Experiments were performed in biological triplicate. Statistical analysis was performed on day 5 (NS versus shAMD1 01 ***P = 0.00028; and NS versus shAMD1 02 ***P = 0.000211). NS, non-silencing siRNA. j, Percentage of apoptotic cells in BT-245 cells lines with AMD1 knockdown, days 3 and 5. Experiments were performed in biological triplicate. Statistical analysis was performed at day 3 and 5 (shAMD1_01 day 3 **P = 0.002111, shAMD1_01 day 5 **P = 0.001757; and shAMD1_02 day 3 **P = 0.008581, shAMD1_02 day 5 **P = 0.001322). k, Cell count in DMG lines DIPG04 with AMD1 KD, days 3 and 5. Experiments were performed in biological triplicate. Statistical analysis was performed on day 5 (NS versus shAMD1 01 ****P = 0.000015; and NS versus shAMD1 02 ****P = 0.000009). l, Percentage of apoptotic cells in DIPG04 cells with AMD1 KD, days 3 and 5 (P < 0.001). Experiments were performed in biological triplicate. Statistical analysis was performed at day 3 and 5 (shAMD1_01 day 3 *P = 0.011056, day 5 **P = 0.001193; and shAMD1_02 day 3 *P = 0.031126, day 5 **P = 0.008023). *P < 0.05, **P < 0.01. m, Dose–response of DMG cells, BT-245, DIPG04 and NSC cells treated with AMD1 inhibitor. EC50 values in BT-245, DIPG04 and NSC (top). Experiments were performed in biological sextuplicate. Data are displayed as mean ± s.e.m. n,o, Quantitative western blotting of MAT2A with escalating doses of AMD1 inhibitor BT-245 (n) and DIPG04 (o). p,q, Quantification of MAT2A using Li-Cor fluorescent system in BT-245 (p) and DIPG04 (q) technical replicates of n = 3, samples were measured repeatedly three times. Statistical analysis was performed using a two-tailed, unpaired t-test (i–l). Data are displayed as mean ± s.e.m. DMSO, dimethylsulfoxide.
Excess SAM reduces MAT2A expression33, but the effects of dcSAM on MAT2A expression is currently unknown. dcSAM is unstable in many conditions, so we used genetic and pharmacological inhibition of AMD1 as a surrogate approach34. To test the hypothesis that AMD1 loss could inhibit MAT2A expression (Fig. 6d), we knocked down AMD1 using two independent shRNAs compared to a non-targeting shRNA control in DIPG04 and BT-245 cells (Fig. 6e,g). Loss of AMD1 resulted in an increase of MAT2A protein expression (Fig. 6e–h). Moreover, stable knockdown of AMD1 resulted in a reduction of growth and viability (Fig. 6i–l). We next inhibited AMD1 using sardomozide (also known as SAM486A or CGP48664), an established AMD1 inhibitor35. DIPG cells were more sensitive to SAM486A compared to NSCs (Fig. 6m). Confirming our knockdown data, inhibition of AMD1 led to a marked increase of MAT2A at the protein level (Fig. 6n–q). We interrogated the potential combinatorial effect of AMD1 and MAT2A inhibition in our H3K27MPP model. Dual inhibition was more effective in reducing viability compared to single agents and dual inhibition with MR resulted in a dramatic reduction of cell viability (Extended Data Fig. 4d). Moreover, AMD1 inhibition, and the resultant increase in SAM, partially rescued cell viability under MR conditions (Extended Data Fig. 4d,e). SAM homeostasis is maintained by a negative feedback loop whereby methyltransferase-like 16 (METTL16) regulates mature: immature MAT2A transcript mRNA through a process called intron retention. In high-SAM conditions, METTL16 methylates MAT2A transcript at distinct hairpins in the 3-UTR of MAT2A causing intron 8 retention and subsequent mRNA degradation, whereas in low-SAM conditions, METTL16–MAT2A transcript interactions are reduced, resulting in increased splicing of intron 8 and increased mature MAT2A mRNA33. Of note, high SAM levels increase METTL16 turnover on the immature MAT2A transcript (dwell time) leading to increased hairpin methylation and MAT2A degradation.
In this context, our results present a paradox whereby H3K27M DMGs have lower total SAM compared to hemispheric gliomas, which would imply that more mature MAT2A transcript and protein should be generated. To address this, we hypothesized that dcSAM may promote high turnover of METTL16–MAT2A transcript interactions like SAM, thereby inhibiting MAT2A transcript and ultimately protein expression33. To test this hypothesis, we interrogated mature MAT2A transcript and MAT2A intron 8 retention in the context of MAT2A inhibition (AG-24512), SAM and dcSAM using quantitative PCR with reverse transcription (qRT–PCR). As expected, MAT2A inhibition (reduced SAM) increased mature mRNA, decreasing intron 8 retention and addition of excess SAM created the opposite effect by lowering mature transcript and increasing intron 8 retention (Extended Data Fig. 5a–d) in DIPG04 cells. Confident of our positive controls we tested the effect of dcSAM on DIPG04 cells and observed that as with excess SAM, dcSAM promoted intron 8 retention and lower mature transcript and protein levels (Extended Data Fig. 5a–d). We next tested whether exogenous dcSAM could in fact reduce MAT2A transcript and protein through intron 8 retention in NSCs, cells known to be AMD1 negative. Notably, we observed near identical results in with dcSAM (Extended Data Fig. 5e–h). Collectively, these findings suggest that H3K27M leads to increased AMD1 protein expression through loss of the repressive mark H3K27me3 and that AMD1 and resultant dcSAM may interfere with MAT2A expression and protein stability.
MAT2A knockdown alters histone methylation in H3K27M tumors.
As SAM is the universal cofactor for all methyltransferases, we hypothesized that loss of MAT2A and subsequent reduction of SAM would alter global cell methylation and DMG relevant histone marks. Loss of MAT2A in DIPG04, DIPG13p and BT-245 cells resulted in a global reduction of MAT2A and symmetric dimethylarginine (SDMA), as expected using infrared quantitative western blot analysis (Fig. 7a,b and Extended Data Fig. 6a–d). H3K27M-mutant gliomas/DIPGs are vulnerable to transcriptional disruption8. We next set out to determine the impact of MAT2A loss with respect to methylated histone marks that are integral for transcription. A modest but consistent reduction of H3K4me3, a marker of transcriptional initiation, was observed in all three cell lines. (Fig. 7a,b and Extended Data Fig. 6a–d). Loss of MAT2A led to pronounced reduction in H3K36me3, a marker of transcriptional elongation (Fig. 7a,b and Extended Data Fig. 6a–d).
Fig. 7 |. Silencing MAT2a alters the transcriptome and H3K36me3 deposition.
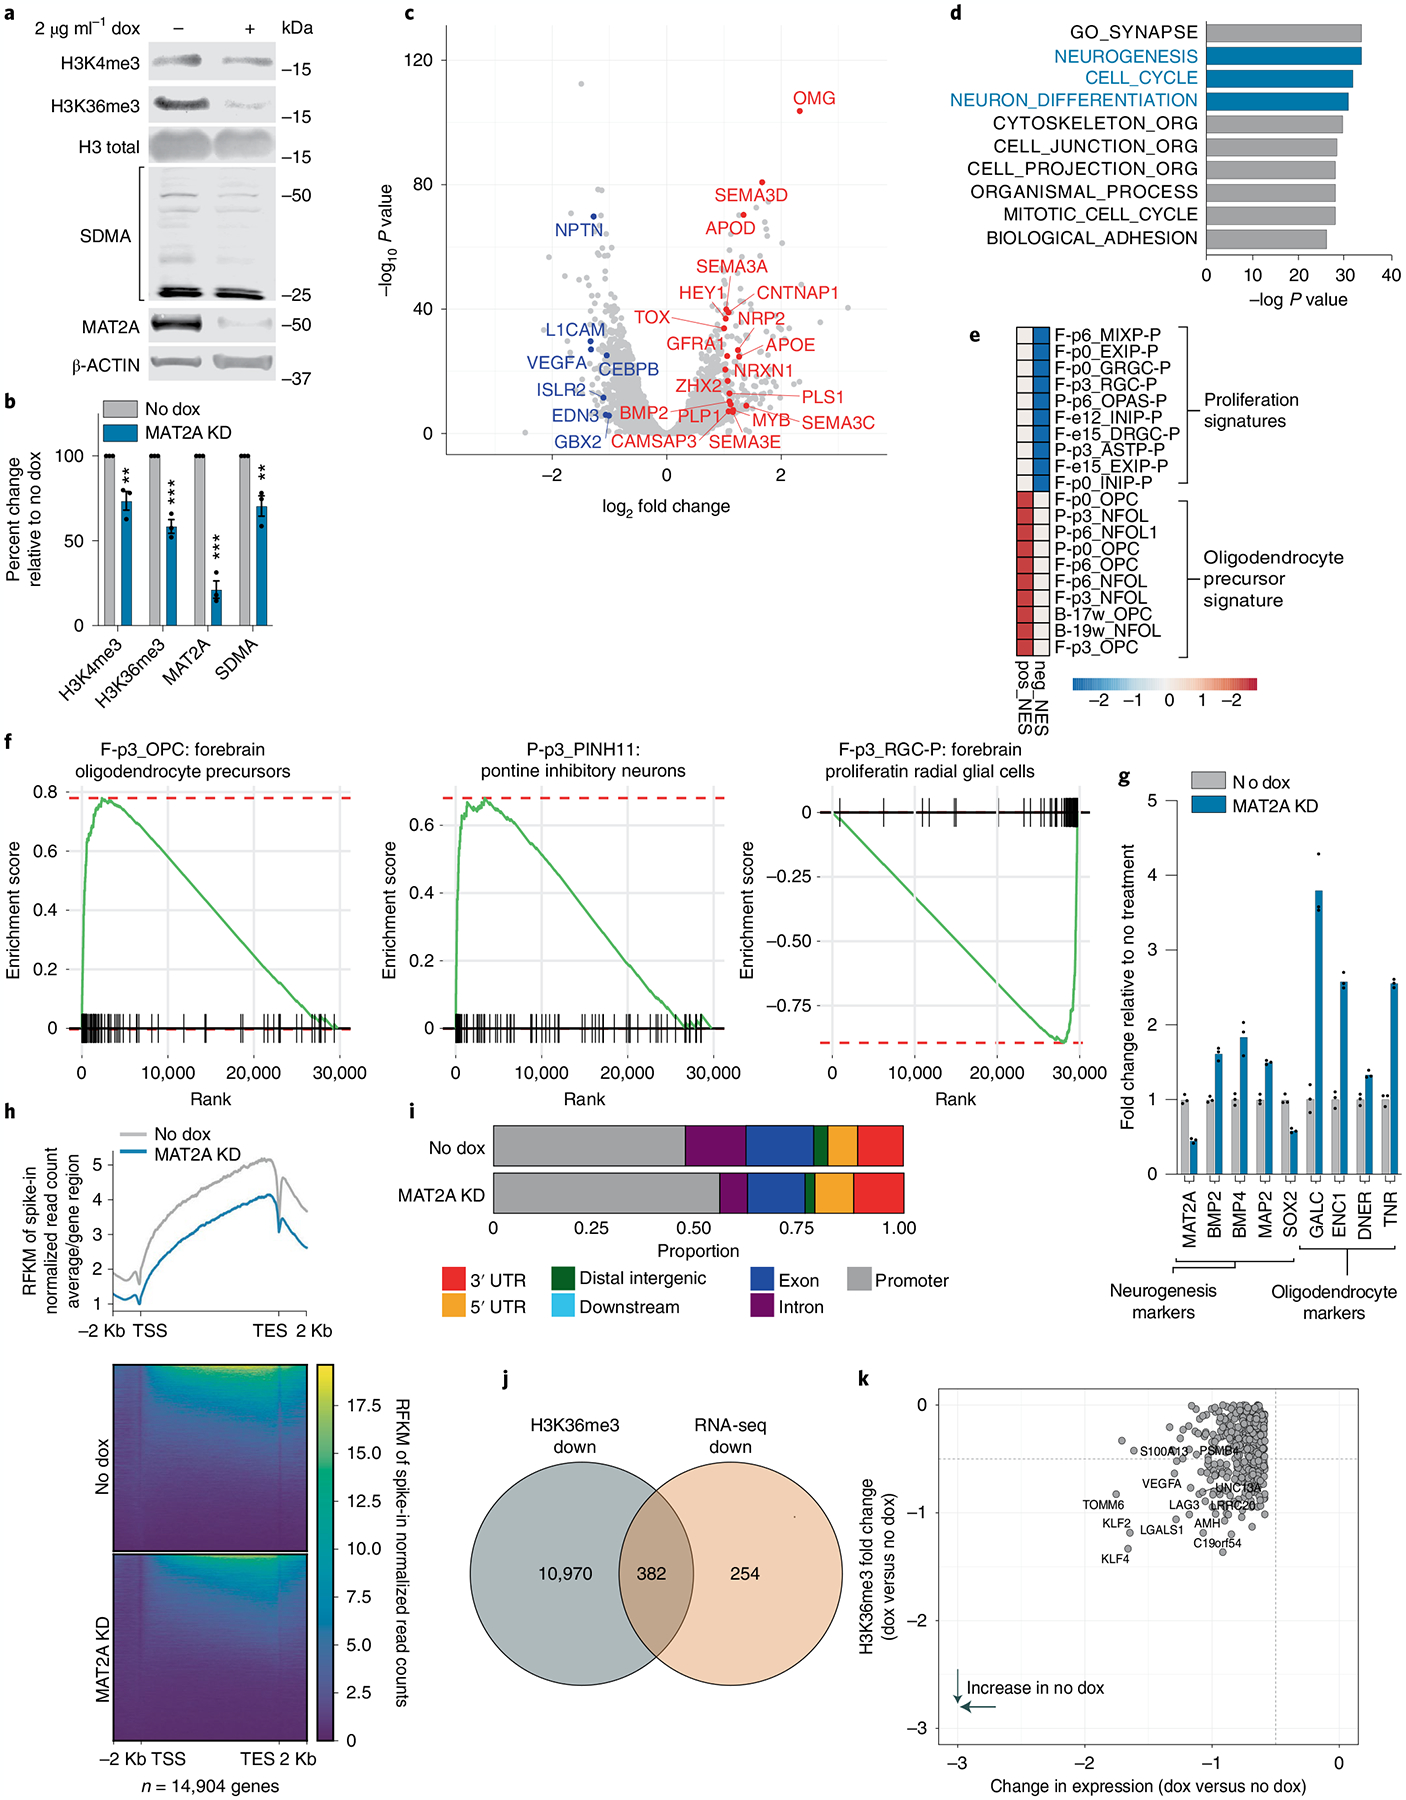
a, Quantitative western blotting of histone modifications (H3K4me3 and H3K36me3) and SDMA in DIPG13p cells comparing MAT2A knockdown to control cells. b, Quantification of histone modifications (H3K4me3 and H3K36me3), SDMA and MAT2A using Li-Cor fluorescent system for DIPG13p cells, MAT2A knockdown versus control cells. Experiments were performed in biological triplicate; samples were repeatedly measured three times. Statistical analysis was performed using a two-tailed, unpaired t-test. Data displayed as mean ± s.e.m. (no dox versus MAT2A knockdown H3K4me3 **P = 0.008283; H3K36me3 ***P = 0.000501; MAT2A ***P = 0.000103; and SDMA **P = 0.00792). c, Volcano plot of differential gene expression comparing MAT2A knockdown to control cells. Canonical neuronal markers are highlighted in red (upregulated) and blue (downregulated). Statistical adjustments were made for multiple comparisons using iDEP.94 DESeq2 Statistical packages in R. d, Top ten gene sets (GO), derived from GSEA analysis of changes to the transcriptome in MAT2A knockdown. e, Heat map of top ten negative and positive enriching developmental cell signatures in MAT2A knockdown. f, Enrichment plots of selected developmental cell signatures from e. g, Real-time PCR validation of selected canonical neurogenesis genes and markers of oligodendrocyte cells. n = 3 technical triplicates for each gene. h, Heat map of spike-in normalized H3K36me3 ChIP-Rx-seq reads centered at human genes in no dox (top) versus dox (bottom) induction of MAT2A shRNA expression in DIPG13p cells. TSS, (Transcription Start Site); TES, (Transcription End Site). i, Bar plots of H3K36me3 ChIP-Rx-seq reads demonstrating alterations of H3K36me3 at different regions summarized across all human genes in DIPG13p cells. j, Venn diagram of overlapping genes between ChIP-Rx-seq and RNA-seq data. k, Plot of H3K36me3 (fold change) versus RNA-seq (fold change), neurogenesis makers are indicated.
MAT2A regulation of the epigenome and transcriptome in H3K27M tumors.
To determine the effects of MAT2A knockdown-mediated reduction of H3K36me3 on global transcription, we leveraged two techniques: RNA-seq to evaluate direct and indirect transcriptional changes and chromatin immunoprecipitation with reference exogenous genome sequencing (ChIP-Rx-Seq) that enables performance of genome-wide quantitative comparisons of histone modifications to analyze H3K36me3 protein interactions with DNA36. We performed RNA-seq on DIPG13p cells and observed notable gene expression changes (Fig. 7c and Supplementary Table 2; ±1.3 fold cutoff FDR < 0.05). Gene set enrichment analysis (GSEA) with leading-edge analysis identified that loss of MAT2A resulted in a shift from NPC identities to more differentiated glial cells (Fig. 7d–f and Extended Data Fig. 8a–c). qRT–PCR confirmed the increase of neuronal and oligodendrocytic markers and reduction of SRY-Box transcription factor 2 (SOX2), a master regulator of NPC identity (Fig. 7g). Using H3K36me3 ChIP-Rx-seq in DIPG13p, we observed a genome-wide reduction of H3K36me3 across promoter regions and gene bodies, consistent with impairment of transcriptional elongation at specific gene loci (Fig. 7h,i, Extended Data Fig. 9a and Supplementary Table 3)37. Integrating H3K36me3 ChIP-Rx-seq with RNA-seq revealed an overlap of genes with GSEA identifying altered NPC identity as a notable process (Fig. 7j,k, Extended Data Fig. 9c and Supplementary Table 4). In support of these findings, RNA-seq and H3K36me3 ChIP-Rx-seq in DIPG04 yielded similar results (Extended Data Figs. 7a–i, 8d–f and 9b,d and Supplementary Tables 3 and 4). To complement our MAT2A knockdown, MR in the medium reduced cell viability in H3K36me3 in DIPG04 and DIPG13p cells, which could directly be rescued by SAM supplementation (50 μM) (Extended Data Fig. 10a–l).
Dietary methionine and MAT2A disruption impede in vivo DIPG growth.
To determine whether loss of MAT2A or an MR diet translate into effective preclinical therapies in vivo setting, we implanted H3K27MPP cells into mice that received a control chow with 0.86% methionine (w/w) or a methionine-restricted chow of 0.12% methionine (w/w). Tumor-bearing mice receiving the MR diet displayed an extended overall survival, increasing from 38.6 ± 4.4 to 57.4 ± 2.9 d, respectively (Fig. 8a,b). We also observed a reduction in Ki67, a marker of proliferation in the MR group (Fig. 8b,c). In parallel, we killed a second set of mice (n = 3 per group) upon first signs of neurological distress. Western blot analysis confirmed a reduction of H3K36me3 and NPC identity markers OLIG2 and a reduction of SAM (Fig. 8d–f). Mice on the MR diet had an increase in MAT2A protein, as lower methionine boosts MAT2A protein stability and splicing (Fig. 8e,f). To complement these results, we interrogated a second highly aggressive patient-derived xenograft (PDX) DIPG model, DIPG13p. Mice bearing DIPG13p intracranial xenografts received vehicle or dox via drinking water to induce MAT2A knockdown. Mice with MAT2A loss had a median survival of 42 d compared to vehicle-treated mice whose median survival was 34 d for an overall survival increase of 24% (Fig. 8g,h). We did not observe a notable change in Ki67 in this model comparing control to MR diets (Fig. 8h). Taken together, these observations indicate that an MR diet or MAT2A knockdown represents a therapeutic target in DIPG cells.
Fig. 8 |. MAT2A depletion or MR impedes DIPG growth in vivo.
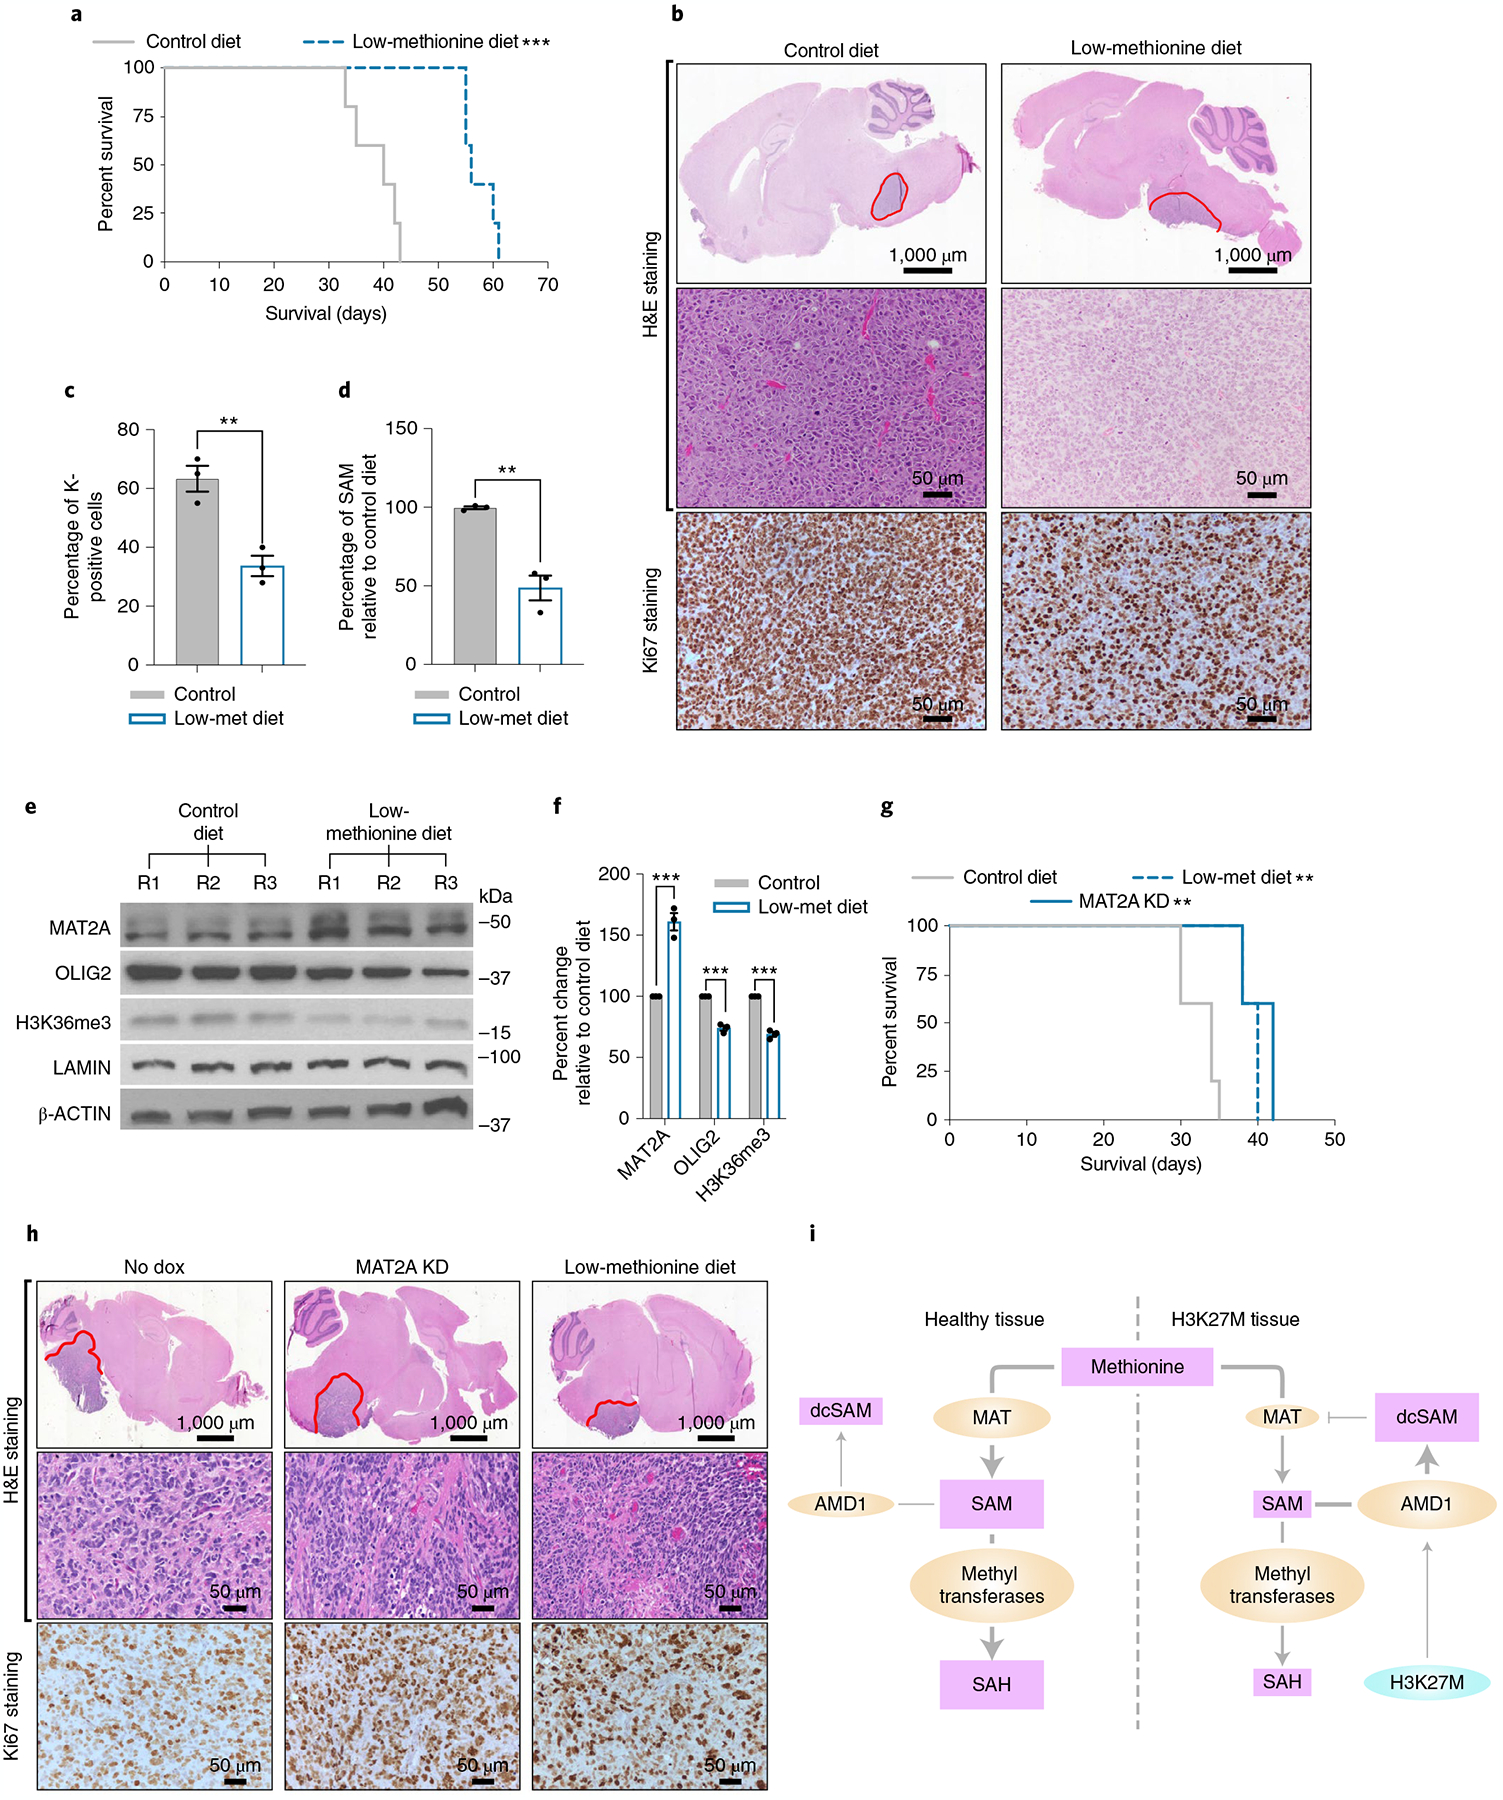
a, Kaplan–Meier survival curve showing that MR increases survival of the H3K27MPP DMG model. Kaplan–Meier survival curve of H3K27MPP cells injected into the midbrain-pons of immunocompetent C57BL/6 mice. A log-rank Mantel–Cox test was performed between the groups with n = 7 mice per group (4 male and 3 female). ***P = 0.0003. A post hoc power estimation based on the sample size with a two-sided α of 0.05 provided a >0.99 power. b, H&E and Ki67 staining confirming high-grade glioma histology from H3K27MPP-injected mice. c, Ki67 quantification confirming loss of Ki67-positive cells from H3K27MPP tumors on low-methionine diet compared to control chow. Ki67 indices were calculated from three animals per group with each index being an average of five high-magnification field of views (control versus low-methionine diet **P = 0.003). d, Quantification of SAM concentrations in H3K27MPP tumors on a low-methionine diet compared to control chow (n = 3 tumors per group; control versus low-methionine diet **P = 0.0062). e. Western blotting of MAT2A, OLIG2, H3K36me3 and LAMIN in H3K27MPP tumors from control and low-methionine diets. f, Quantification of MAT2A and OLIG2 normalized to β-actin and H3K36me3 normalized to LAMIN from e from three independent western blots comparing H3K27MPP tumors on control diet versus a low-methionine diet (control versus MR MAT2A ***P = 0.000955; OLIG2 ***P = 0.000236; and H3K36me3 ***P = 0.000118). g, In vivo orthotopic DIPG13p xenograft with control, MAT2A knockdown (+ dox) or DIPG13p xenografts put on a low-methionine data. A log-rank Mantel–Cox test was performed between the groups with n = 5 mice per group (5 female) (control versus MAT2A knockdown **P = 0.0019) and (control versus low-methionine diet **P = 0.0019). A post hoc power estimation based on the sample size with a two-sided α of 0.05 provided: control versus MAT2A knockdown 0.995 power and control versus low methionine, 0.991 power. h. H&E and MAT2A immunohistochemistry (IHC). I. Proposed model of compromised MAT2A function in DIPG compared to healthy cells. Statistical analysis was performed using a two-tailed, unpaired t-test (c,d,f). Data are displayed as mean ± s.e.m.
Discussion
The concept of synthetic lethality posits that tumors bearing genetic alterations reprogram cellular processes that create critical dependencies amenable to targeting with high therapeutic indices. The discovery of H3K27M mutations in a subset of gliomas usually diagnosed in children and young adults has already yielded possible therapeutic sensitivities, but these tumors remain universally lethal. The limited spatial and temporal distribution of gliomas bearing H3K27M mutations suggests that these mutations are transformative in a cell of origin restricted to specific neural anatomical locations and developmental phases, which may also inform therapeutic dependencies. OLIG2positive NPCs are the putative cell of origin for many pediatric brain tumors, including DMG/DIPG and seminal single-cell studies have provided the context for numerous types of these cells22,38.
NPCs have distinct metabolic requirements and how H3K27M affects these processes to sustain growth are poorly characterized. Second, this provides a unique opportunity to identify potential biological and ultimately therapeutic vulnerabilities in H3K27M mutant cells. To investigate the metabolic differences between/across H3K27M tumors, we generated an isogenic transplantable mouse model based on the following criteria: (1) OLIG2 expression, which is commonly upregulated in H3K27M DMGs/DIPGs;22 (2) hindbrain NPCs enriched for IRX2, a transcription factor enriched in the hindbrain/pons;26 (3) NPCs from an early developmental time point, which have been shown to be putative cells of origin for many pediatric brain tumors, including H3K27M DIPGs;12,39 and (4) use of the top three co-occurring alterations of H3K27M DIPGs: H3K27M, P53 and PDGFRA12,39. Our model also employs flip-excision (FLEx) switches, which enable us to take advantage of site-specific Cre recombinase orientation specificity40. By manipulating LoxP site orientation, altering the genomic site targeted by the FLEx cassette and using a promoter-specific Cre construct such as our Olig2–Cre vector, this system can be easily modified to target the origin cells of other HGGs and brain tumors.
Using our model and isogeneic controls, we identified a dependence on methionine metabolism for cell growth. Methionine is an essential AA and its dietary restriction has been shown to extend the lifespans of several organisms41,42. Methionine is integral to one-carbon metabolism, which allows for volatile single-carbon group transfers in a series of enzymatically coupled reactions. Two coupled metabolic cycles exist at the center of one-carbon metabolism: the folate cycle and the methionine cycle43. MAT2A converts methionine to SAM, which is a methyl donor for numerous reactions. SAM utilization for methyltransferase reactions ultimately generates SAH, which is then converted to homocysteine and eventually converted back to methionine. SAH can also enter the trans-sulfuration pathway to form other sulfur-containing AAs. Perturbing methionine, the methionine cycle and one-carbon metabolism, for example, have proven effective therapeutic strategies as demonstrated by 5-fluorouracil (5-FU) and radiation therapy27. At present, radiation is the only treatment approved for DMG and DIPGs. MR diets have extended the survival of several in vivo cancer models, with encouraging patient data27,41,42. Physiological levels of methionine measured in human plasma range from 25 μmol/Lto 68 μmol/L with similar levels observed in mice (±62 μmo/L)44,45. Our DIPG cell lines are maintained in a custom medium formulation consisting of DMEM F12 and Neurobasal A with a final methionine concentration of 150 μmol/L, two- to three-fold higher than physiological levels. As with all metabolic studies, future work should modulate AAs and other nutrient levels to study the effects of metabolism in multiple cell media conditions.
Due to the pleotropic effects of methionine28, we hypothesized that identifying genes important to its metabolism would reveal which aspects of this process are essential for tumor growth. We identified one such gene, MAT2A, which encodes an enzyme that catalyzes the production of SAM from methionine and serves as a cofactor in methyltransferase (MTase) reactions. Further characterization of our model and subsequent validation in human DIPG cell lines support that MAT2A knockdown or pharmacological inhibition has profound cell growth defects that are not observed in NPCs, suggesting a metabolic vulnerability that characterizes DIPGs. MAT2A expression has also been demonstrated to increase cancer cell proliferation and promote tumor formation in other neoplasms46,47. Moreover, recent preclinical studies have shown that MAT2A inhibitors impede tumor growth46,48. A potential resistance mechanism that counters MAT2A inhibition is that SAM reduction has been shown to increase MAT2A protein. Additional work is required to characterize the various post-transcriptional and post-translational modifications to which MAT2A is subjected, as these alterations in turn trigger several positive and negative feedback mechanisms that remain poorly understood33.
SAM supplementation in DIPG/DMG cells was able to rescue MAT2A loss with respect to cell viability and H3K36me3 levels at lower concentrations (50 μM) but reduced DMG growth at higher concentrations (500 μM). The antiproliferative and tumor-inhibitory effects of SAM have been previously reported49,50. In keeping with findings, while loss of MAT2A impedes DIPG growth, we also observed that overexpression of MAT2A could also have a negative effect on growth. Disturbing transcription-related pathways in DIPG have been postulated as an attractive therapeutic strategy, but epigenetic-based therapies have been shown to be context-dependent in DIPG. For example targeting residual EZH2 function and residual H3K27me3 levels leads to a reduction of DIPG growth30. Conversely, increasing H3K27me3 using H3K27me3 demethylases has also been shown to impede DIPG growth51. Therefore, the histone methylation of H3K27me3 state when perturbed in either direction can impair growth. We postulate that like EZH2, MAT2A may also represent this goldilocks principle in DIPG, supporting the notion that H3K27M tumors require a hypomethylated state for growth52.
Unlike other cancers, pediatric brain tumors, including DIPGs, are characterized by a low frequency of MTAP deletion. Therefore, MTAP status cannot fully explain sensitivity to MAT2A inhibition. Our data support a new model of MAT2A sensitivity. We observed that DIPG lines expressed lower protein levels of MAT2A and that AMD1 inhibition and dcSAM reduction could increase MAT2A protein levels. A potential advantage of AMD1 expression-induced dcSAM production could be to support anabolism or pro-growth signaling pathways. We propose a putative model by which H3K27M mediates a reduction of MAT2A leading to a compromised methionine cycle, which can be therapeutically exploited (Fig. 8I). In support, AMD1 expression has been shown to stabilize the MYC oncogene in embryonic stem cells and is downregulated in NSCs/NPCs53. Polyamine biosynthesis has been a metabolic pathway of interest to target in several cancers. In support ornithine decarboxylase 1, the rate-limiting enzyme in polyamine synthesis, is irreversibly inhibited by difluoromethylornithine and has shown efficacy in glioma models, including DMG54. One limitation of our study and the field is the inability to readily detect dcSAM due to its stability, something that we plan to address in future studies55.
MAT2A inhibition or methionine depletion modulates several histone marks47. Here, we report that MAT2A inhibition results in preferential H3K36me3 depletion. H3K36me3 is a histone mark primarily deposited at the core and 3′ end of active genes56. In summary, we provide a rationale and therapeutic strategy, whereby targeting a metabolic vulnerability would be an approach for brain tumors, opening up an avenue for treatment that is under-explored. This study offers the possibility that dietary modulation can provide a promising treatment approach for an otherwise incurable brain tumor of childhood.
Methods
Generation of a syngeneic model.
All animal procedures were carried out ethically according to protocols approved by the University of Pittsburgh (UPitt) Institutional Animal Care and Use Committee (IACUC) (20108110, PI: Agnihotri). H3F3A (Ensembl: ENSG00000163041), PDGFRA (Ensembl: ENSG00000134853) and TP53 (Ensembl: ENSG00000141510) complementary DNAs were amplified with HA, V5 and MYC tags, respectively and assembled by Gibson Assembly with T2A and P2A tags. The H3F3A–PDGFRA–TP53 ligated construct was cloned inverted into pLV–eGFP flanked by 5′-Lox2272 and LoxP sites and 3′ anti-Lox2272 and LoxP sites. Site-directed mutagenesis was performed to create H3F3A K27M and TP53 R273H mutant constructs using the QuikChange II Site-Directed Mutagenesis kit and manufacturer’s protocol (Agilent, cat. no. 200523). Mouse Olig2 promoter was cloned from genomic DNA into pLV upstream of Cre (accession no. FJ457013.1) and mCherry (accession no. MN872303.1)57. Cloning and plasmid sequence validation were performed by VectorBuilder Services. Plasmids and full sequences are available upon request. E14.5 NSCs were isolated from timed pregnancies of C57BL/6J mice (Jackson Laboratory, stock no. 000664). NSCs were isolated using a Papain dissociation kit (Worthington Biochemicals, cat. no. LK003150). NSCs were established in complete NeuroCult Proliferation kit (Stem Cell Technologies, cat. no. 05702), supplemented with human recombinant EGF (Stem Cell Technologies, cat. no. 78006.1), human recombinant bFGF (Stem Cell Technologies, cat. no. 78003.1) and heparin solution (Stem Cell Technologies, cat. no. 07980). pLV–eGFP lentivirus of H3F3A-HA/PDGFRA-V5/TP53 R273H-MYC, H3F3A_K27M-HA/PDGFRA-V5/TP53 R273H-MYC and mOlig2–Cre–mCherry were generated as follows: 400 μl of Opti-MEM I (Gibco) containing 2.4 μg pCMV-dR8.2 dvpr, 1.8 μg pCMV-VSV-G, 3 μg piSMART mCMV/TurboGFP shRNA plasmid (Dharmacon) and 20 μl FuGENE HD (Fugent LLC) was added to a 10-cm plate of HEK293T cells grown in complete medium + 10% fetal bovine serum (FBS)11. Medium was collected from the HEK293T cells 48 h after transfection and spun at 2,000g. Virus-containing supernatant was either used directly for lentiviral transduction or concentrated with Lenti-X lentiviral concentrator (Takara). Mouse NPCs were then transduced by overnight incubation with lentivirus with a multiplicity of infection of 2 containing 5 μg ml−1 Polybrene (EMD Millipore). Beginning 2 d after transduction, cells were sorted for eGFP and mCherry using the FACSAria IIu. Post-sorted cells were confirmed for transgene expression by western blotting (see below). Intracranial injections of 2.5 × 10⁴ cells into the midbrain of young C57BL/6 mice (<4 weeks old) were performed with a Quintessential Stereotaxic Injector (Stoelting, cat. no. 53311) in a total volume of 2 μl and injection rate of 0.5 μl min−1, using the following coordinates with lambda (a suture of the skull) serving as the 0 point (coordinates x = −0.8 mm, y = −0.8 mm, z = 4.0 mm).
Cell culture.
DIPG cell lines (all with the H3K27M mutation) SU-DIPG-IV (DIPG04), SU-DIPG-13p (DIPG13p) and BT-245 were grown and passaged in DIPG medium as previously reported8,10,58. SF8628 (H3K27M) and immortalized NHAs were grown in DMEM (Invitrogen) supplemented with 10% FBS (Invitrogen). All cell lines were confirmed by STR profiling and tested as mycoplasma negative by PCR.
Amino acid dropout screen.
H3K27M mutant, H3WT cells and control NPCs were grown in modified mouse neural progenitor (NPC) medium. NPCs were grown in DMEM (Biological Industries, cat. no. 06-1055-66-1) without AAs supplemented with EGF (Stem Cell Technologies, cat. no. 78006.1), bFGF (Stem Cell Technologies, cat. no. 78003.1) and Heparin (Stem Cell Technologies, cat. no. 07980). AAs were individually added back to original formulation concentrations using AAs purchased from Sigma (cat. no. LAA10-1KT). The medium was filtered before use and cell viability defects were evaluated using the Sulforhodamine B-based assay (Sigma, cat. no. TOX6-1KT).
Magnetic resonance imaging.
Anesthesia for in vivo MRI.
All mice received general inhalation anesthesia with isoflurane for in vivo brain imaging. The mice were placed into a clear plexiglass anesthesia induction box that allowed unimpeded visual monitoring of the animals. Induction was achieved by administration of 3% isoflurane mixed with oxygen for 5 min. Depth of anesthesia was monitored by toe reflex (extension of limbs and spine positioning) and respiration rate. Once the plane of anesthesia was established, it was maintained with 1–2% isoflurane in oxygen via a designated nose cone and the mouse was transferred to the designated animal bed for imaging. Respiration was monitored using a pneumatic sensor placed between the animal bed and the mouse’s abdomen while rectal temperature was measured with a fiberoptic sensor and the core temperature was maintained at 36.8 + 0.2 °C with a feedback-controlled warm air source (SA Instruments).
In vivo MRI acquisition.
In vivo brain MRI was carried out on a Bruker BioSpec 70/30 USR spectrometer (Bruker BioSpin MRI) operating at 7-Tesla field strength, equipped with an actively shielded gradient system B-GA12S2 gradient with 440 mT m−1 gradient strength and slew rate 3,440 T m−1 s−1 as well as a quadrature radiofrequency volume coil with an inner diameter of 35 mm. For T2-weighted anatomical imaging a multi-planar T2-weighted anatomical imaging covering the whole brain volume was acquired with Rapid Imaging with Refocused Echoes (RARE) pulse sequence with the following parameters: field of view (FOV) = 2 cm, matrix = 256 × 256, slice thickness = 0.6 mm, in-plane resolution = 78 μm × 78 μm, RARE factor = 8, effective echo time (TE) = 48 ms, repetition time (TR) = 1,800 ms and flip angle (FA) = 180°.
Stable shRNA knockdown.
Lentiviral piSMART MAT2A dox-inducible shRNA and non-silencing plasmids were purchased as glycerol stocks from Dharmacon (cat. nos. V3IHSHEG_7438501, V3IHSHEG_9034381, V3IHSHEG_9586801 and VSC11653). Cells were transduced overnight with lentivirus in appropriate growth medium containing 5–8 μg ml−1 Polybrene (EMD Millipore). Two days after transduction, cells were cultured with 0.5–1 μg ml−1 puromycin (Gibco) for 5–7 d. Dox was purchased from Sigma (cat. no. D9891–5G) and administered in vitro at 2 μg ml−1 with knockdowns confirmed by western blot analysis. Oligonucleotide sequences, company names and catalog numbers are provided in Supplementary Table 5.
siRNA screen.
A total of 50,000 NPC control, K27MPP and H3WTPP cells were plated in 12-well plates. Cells were transfected 12 h after plating with a custom endoribonuclease-prepared siRNA library (esiRNA) (Sigma). Overall, 20 ng of esiRNA was used per target with X-tremeGENE HP DNA Transfection Reagent (Sigma). Cell viability was assessed 96 h later by Sulforhodamine B assay (cat. no. TOX6–1KT, Millipore Sigma). Oligonucleotide sequences, company names and catalog numbers are provided in Supplementary Table 5.
Cell proliferation assays, viability assays and drug EC50 analysis.
Countess II FL Automated Cell Counter (Thermo Fisher Scientific) were used for direct cell counts. Alamar blue (Thermo Fisher Scientific), using the manufacturer’s standard protocol was used to determine cell viability. EC50 curve analysis was performed using raw fluorescent Alamar blue values that were inputted into PRISM 7.0.
Small molecule inhibitors.
The 3-O-acetyl-11-keto-β-boswellic acid (AKBA) was purchased from Selleck Chemicals (cat. no. 9024). PF-9366 (cat. no. HY-107778) and AGI-24512 (HY-112130) were purchased from MedChemExpress. SAM was purchased from New England Biolabs (cat. no. B9003S) and SAH was purchased from Sigma Aldrich (cat. no. A9384). AMD1 inhibitor (sardomozide HCl, also known as SAM486A) was purchased from MedKoo Biosciences (cat. no. 200411).
Western blots.
Cell pellets were lysed in PLC lysis buffer containing protease and phosphatase inhibitors (Roche). Bicinchoninic acid (BCA) assay (Pierce Chemical Co) was used to quantify protein lysates. Total protein lysate at 30–40 μg was loaded in 8–13% SDS–PAGE gels and electrophoresed. Proteins were transferred to PVDF membranes using a semi-dry transfer apparatus (Bio-Rad). Membranes were blocked for 1 h and probed for various proteins overnight in 5% non-fat milk or 5% BSA in Tris-buffered saline, 0.5% Tween-20 (TBST) or phosphate-buffered saline with 0.5% Tween-20 (PBST). Membranes were washed for 5 min in TBST (3×) and incubated with horseradish peroxidase-conjugated antibodies specific for the primary antibody (Bio-Rad Laboratories). Binding was detected using Chemiluminescence Reagent Plus (PerkinElmer). Western blots were performed as described by Koncar et. al.11.
Histone and MAT2A Li-Cor western blot quantification.
30μg of total protein lysate was loaded into a 13% SDS–PAGE gel and electrophoresed. Proteins were transferred to a 0.2-μm PVDF membrane using wet-transfer apparatus. Membranes were dried in 100% methanol and then reactivated and blocked for 1 h in 5% non-fat milk in TBST and probed for various proteins overnight in 5% BSA in TBST. Membranes were washed for 8 min in TBST (3×) and then incubated with IRDye 680RD goat anti-mouse IgG secondary antibody (1:15,000, Fisher Scientific, cat. no. 925–68070) or IRDye 800CW donkey anti-rabbit IgG secondary antibody (1:30,000, Thermo Fisher Scientific, cat. no. NC0964679). Binding was detected using Odyssey Clx Imaging System and quantified through Image Studio Lite (v.5.2).
RNA-sequencing.
RNA was extracted from samples using the QIAGEN RNeasy mini kit (cat. no. 74104) as per manufacturer’s instructions. Strand-specific RNA-seq library preparation and sequencing were performed at Novogene Biotech using standard Illumina protocols carried out on the Illumina NovaSeq 6000 platform as per the manufacturer’s instructions (Novagene Genomic Services). Short read sequences (150-bp, mate paired) obtained from sequencing were trimmed and further mapped to the reference human genome (hg19) and gene sequences were aligned using the Bowtie (v.2.3.5.1) algorithm employed in the CLC genomics Software Workbench 2020 (Ensemble, v.54, QIAGEN, CLC workbench 2020)59. Genes with transcript per million values <2 were considered to be not expressed at a sufficient level to permit reliable quantification and were removed. Sample counts were then normalized to counts per million (CPM) and transformed (log2CPM + 2) using the edgeR package in the R computing environment. iDEP.94 DESeq2 statistical packages in R were used to identify notable changes in gene expression between experimental conditions60,61. Unless otherwise stated, significance was defined as genes having an absolute fold change >1.5, P value <0.05 and FDR < 0.05. Notable gene lists were analyzed using parametric GSEA (PGSEA (3.0)) packages in R62,63.
Chromatin immunoprecipitation.
DIPG13P/DIPG04 MAT2A knockdown and control cells were fixed in 1% formaldehyde (Sigma). Nuclei were further lysed in a 1% SDS buffer by sonication (Bioruptor) chilled to 4 °C. Sonications were performed on Bioruptor Sonication System UCD-300 for 60 cycles, 10 s on 20 s off. Samples were assessed for sonication efficiency by gel electrophoresis (150–500 bp) and further diluted to achieve an SDS percentage of 0.1. Approximately 5% of sonicated drosophila S2 chromatin was added to each sample to facilitate quantification of the total histone mark for sequencing analysis. ChIP was carried out using the Diagenode SX-8G IP-Star Compact (Diagenode automated Ideal ChIP-seq kit). In brief, 25 μl of protein A affinity beads were washed three times before being incubated with 6 μg of the H3K36me3 antibody (cat. no. 91265 Active Motif) for 1 h. Sonicated lysate containing protease inhibitors from control or MAT2A KD cells was then combined with beads and incubated for 10 h. Beads were then washed for a 20-min cycle with the provided kit wash buffers and reverse cross-linked on a heat block for 4 h at 65 °C. Samples were further treated in sequence with RNase (cat. no. AM2288, Life Technologies) and then Proteinase K (cat. no. 4333793, Thermo Fisher Scientific) incubated at 65 °C for 30 min. Samples were then purified using the QIAGEN MiniElute PCR purification kit as per manufactures instructions. Input samples were processed in parallel with the ChIP step omitted.
Library preparation and sequencing for ChIP-RX-seq.
KAPA Hyper prep kit (cat. no. KK8504, KAPA Biosystems) and KAPA Dual-indexed adaptor kit (cat. no. KK8722 KAPA Biosystems) were used to construct the ChIP-RX DNA library for sequencing on an Illumina platform following the manufacturer’s instructions. After adaptor ligation, 2× volume of AMPure XP beads was used to recover the small fragments. After 12–14 cycles of PCR amplification, the product was cleaned up with AMPure XP beads. Then, 3% gel purification was performed if the PCR dimers were too much. Paired-end Illumina sequencing was performed on the barcoded libraries as per the instructions of the manufacturer. Briefly, the mixed libraries were denatured according to the standard protocol from Illumina. Then, 1.3 ml of 1.8 pM diluted library pool was loaded to a NextSeq 500/550 Mid Output Kit v2 (150 cycles) and sequenced in the NextSeq 500 platform (2 × 75 bp, 8-bp index).
ChIP-Rx-seq analysis.
Raw paired-end reads were trimmed using trimGalore and subsequently aligned to hg19 reference genome using Bowtie2 (v2.3.5.1, --local --no-unal --no-mixed --no-discordant --phred33 -I 10 -X 700)64. The resulting alignments were sorted and marked for duplicates using picard tools (MarkDuplicates, v.2.21.1) (http://broadinstitute.github.io/picard/), respectively. Spike-in normalization was performed by aligning the reads to the dm6 genome to determine the scaling factor. The normalized bam files were used to generate bigwig files using Deeptools (v.3.4.3). To visualize H3K36me3 signals over genes, the spike-in normalized read densities were plotted for 14,904 genes passing the criteria of gene length >2 kb and a gap distance of 4 kb from the neighboring gene. To call broad H3K36me3 peaks, epic265 (implementation of SICER)66 and MACS2 (2.2.7) were used with bin size of 400, gap size of 3 and FDR of 0.001. Peaks were annotated to genomic regions using R package ChipSeeker67. To determine fold change difference in H3K36me3 signal between experimental conditions, multiBigwigSummary (Deeptools, v.3.4.3) was used to compute scores across Refseq genes. The resulting log fold change was used to compare with RNA-seq data.
Immunohistochemistry.
Paraffin-embedded blocks were cut into 5-μm sections. Slides were processed as follows: de-waxed in xylene followed by rehydration in a standard alcohol series. Antigen retrieval was by pressure cooking for 20 min in citrate buffer (pH 6.0), followed by blocking of endogenous peroxidase in 3% H2O2. The antibodies were added and incubated overnight at 4 °C. Antibodies were detected using a secondary-HRP labeled mouse or rabbit antibody detection system (Dako EnVision+ System-HRP cat. no. k4401, cat. no. k4403) followed by addition of 3,3ʹ-diaminobenzidine (DAB) chromagen (Vector Labs) for visualization. Sections were counter-stained with hematoxylin (Fisher Scientific) and slides dehydrated in 70, 80 and 100% ethanol and xylene. Slides were cover-slipped and mounted in Permount (Fisher Scientific). IHC was performed as described by Koncar et. al.11.
SAM and SAH quantification.
Cellular extractions were prepared in an acetone and 0.1% formic acid in water (80:20) solution. Radiolabeled SAM-d3 (S-methyl-d3) and SAH (13C10) were spiked into each extraction to serve as an internal reference standard. The organic phase from each extraction was further isolated and evaporated to dryness and reconstituted in 0.1% formic acid in water. Then, 20 μl of the reconstituted extraction was subjected to high-performance liquid chromatography utilizing a C18 column with elutions performed using a 5–95% acetonitrile gradient delivered over a period of 2.5 min at a flow rate of 0.8 ml min−1. Ion detections were performed using a ABSciex 4000 triple quadrupole mass spectrometer with corresponding ions detected at 2.63 and 4.65 min for SAM and SAH, respectively. Reference standards at concentrations of 20, 39, 101, 355 and 740 nM were prepared in 0.1% formic acid in water and similarly injected and analyzed to generate a standard curve to facilitate quantification of each cellular extraction. Concentrations of SAM and SAH determined for each extraction were normalized to total protein.
Gene set enrichment analysis.
GSEA was performed on iDEP.94 DESeq2 statistical packages in R to derive differential gene expression of MAT2A knockdown in DIPG04 and DIPG13p cell lines. To compute overlaps we utilized the GSEA pre-ranking tool to query the GO collection of the molecular signature database (MsigDB) (http://software.broadinstitute.org/gsea/msigdb). The top ten-computed overlaps with an FDR q value <0.05 were reported. MAT2A knockdown RNA-seq transcriptomes for DIPG13p and DIPG04 were projected across developmental cell gene signatures using ssGSEA as previously described38. Normalized enrichment scores for each signature were computed and reported.
Animal studies.
All animal procedures were carried out ethically according to protocols approved by UPitt’s IACUC (20108110, PI: Agnihotri). The 4-week-old non-obese diabetic severe combined immunodeficient male or female mice (Mus musculus NOD-scid IL2Rγnull) were injected with 1 × 10⁵ DIPG13p, H3K27MPP or H3WTMPP (4–6-week-old, in both male and female mice; see figure legends). No statistical methods were used to predetermine sample sizes but our sample sizes were similar to those reported in previous publications11,58. Furthermore a post hoc power analysis was performed to determine power >0.95. Cells were resuspended in 2 μl of PBS and injected into the pons/midbrain using a stereotactic frame (Stoelting) and automated cell injector (Stoelting) with cells delivered over 4 min. Coordinates were as follows from the Lambda suture (x = 0.8 mm, y = −0.8mm, z = −5.0 mm). Mice were injected with tumor and randomized to control diet (cat. no. 181855–203), MAT2A knockdown or low-methionine diet (cat. no. 1818556-203, Animal Specialties and Provisions). The animal technician was blinded to experimental condition. Mice were monitored daily for signs of ill health or overt tumors; once mice displayed signs of hydrocephalus (domed head) or neurological duress, they were humanely killed as defined by IACUC (20108110, PI: Agnihotri). UKCCCR guidelines 1997 recommend limiting solid tumors to 10% of the host’s body weight. This criterion was not exceeded in this study. Brains were extracted and fixed in 4% PFA. Mice were kept at 73–74 °F with 30% humidity and a dark–light cycle of 14–10 h. No animals or data points were excluded from the analysis.
13C-methionine isotope tracing.
Polar metabolites were extracted from frozen (−80 °C) cell pellets with 80% ice-cold methanol. Parallel samples were processed for protein estimation and subsequent metabolite normalization. Based on protein concentrations, aliquots of metabolite extract were lyophilized under vacuum pressure using the SpeedVac Concentrator and stored at −80 °C for further processing. Samples were then reconstituted with 50:50 methanol: water mixture and subjected to targeted liquid chromatograph tandem MS (LC–MS/MS) analysis. The LC–MS/MS analysis was performed in positive and negative modes and acquired on two Agilent 1290 Infinity II UHPLC and 6545B Accurate-Mass Quadrupole Time of Flight (MS Q-TOF) LC–MS systems. Agilent Masshunter Workstation Software LC–MS Data Acquisition for 6500 Series Q-TOF MS with v.09.00, Build 9.0.9044.0 was used for tuning, calibration and data acquisition.
In positive mode, the UHPLC was configured with 1290 Infinity II LC Flexible Pump (Quaternary Pump), 1290 Infinity II Multisampler, 1290 Infinity II Multicolumn Thermostat with a six-port valve. A Waters Acquity UPLC BEH amide column (2.1 × 100 mm, 1.7 μm) was used and kept at 55 °C with the mobile phases of (A) consisting of 10 mM ammonium acetate with 0.125% formic acid in 95:5 ratio of acetonitrile: water and mobile phase (B) consisting of 10 mM ammonium acetate with 0.125% formic acid in 5:95 ratio of acetonitrile: water. The following gradient was used: mobile phase (A) was held at 100% for 0.7 min, decreasing to 85% in at 6.7 min, then held for 2 min, decreased to 28% at 16.0 min and held for 0.7 min before going to initial condition at 16.8 min and held for 5.2 min equilibration of 22 min total run time. The injection volume was 2 μl. The flow rate was 0.2 ml min−1.
In positive MS scan mode, the Agilent G6545B Q-TOF MS with Dual AJD ESI Sources in centroid mode was configured with following parameters: acquisition range: 50–1,200 da at scan rate of 2 spectra s−1, gas temp 320 °C, gas flow 8 l min−1, nebulizer at 35 psi, sheath gas heater 350 °C, sheath gas flow 11 l min−1, capillary 3,500 V, nozzle voltage 1,000 V, fragmentor 175 V, skimmer1 65 V, OctopoleRFPeak 750 V, collision 0 V, auto recalibration limit of detection 300 ppm with min height 1,000 counts and reference ions of two at 121.0509 and 922.0098 da.
In negative mode, the UHPLC was configured with 1290 Infinity II LC Flexible Pump (Quaternary Pump), 1290 Infinity II Multisampler, 1290 Infinity II Multicolumn thermostat with a six-port valve. Solvent A was 97% water and 3% methanol 15 mM acetic acid and 10 mM tributylamine at pH of 5. Solvent C was 15 mM acetic acid and 10 mM tributylamine in methanol. Washing solvent D was acetonitrile. LC system seal washing solvent was 90% water and 10% isopropanol and the needle wash solvent was 75% methanol and 25% water. Also used were: GC-grade tributylamine 99% (ACROS ORGANICS), LC–MS grade acetic acid Optima (Fisher Chemical), InfinityLab Deactivator additive, ESI-L Low concentration Tuning mix (Agilent Technologies), LC–MS-grade solvents of water and acetonitrile, methanol (Millipore) and isopropanol (Fisher Chemical). Agilent ZORBAX RRHD Extend-C18, 2.1 × 150 mm, 1.8 μm and ZORBAX Extend Fast Guards for UHPLC were used in the separation. LC gradient profile was 0.25 ml min−1, 0–2.5 min, 100% A; 7.5 min, 80% A and 20% C; 13 min 55% A and 45% C; 20 min, 1% A and 99% C; 24 min, 1% A and 99% C; 24.05 min, 1% A and 99% D; 27 min, 1% A and 99% D; at 0.8 ml min−1, 27.5–31.35 min, 1% A and 99% D; at 0.6 ml min−1, 31.50 min, 1% A and 99% D; at 0.4 ml min−1, 32.25–39.9 min, 100% A; at 0.25 ml min−1, 40 min, 100% A. Column temp was kept at 35 °C, samples were at 4 °C and injection volume was 5 μl.
In negative scan mode, the Agilent G6545B Q-TOF MS with Dual AJD ESI Sources in centroid mode was configured with the following parameters: acquisition range: 50–1,200 da at scan rate of 1 spectra s−1, gas temp 250 °C, gas flow 13 l min−1, nebulizer at 40 psi, sheath gas heater 325 °C, sheath gas flow 12 l min−1, capillary 3,500 V, nozzle voltage 1,000 V, fragmentor 130 V, skimmer1 60 V, OctopoleRFPeak 750 V, cCollision 0 V, AutoRecalibration limit of detection 150 ppm with min height 1,000 counts and reference ions of two at 59.0139 and 980.0164 da.
Flow cytometry.
Cells grown after induction with dox were collected and washed with ice-cold PBS and resuspended in 1 ml of cold PBS. Samples were then fixed by incrementally adding ice-cold 100% ethanol until final dilution ethanol was equal to 80%. Fixed samples were left in 4 °C overnight. Pellets were then washed with ice-cold PBS with 0.5 mM EDTA (Fisher Scientific, 15575020). Samples were resuspended in 1 ml of staining solution and incubated for 30 min (staining solution was PBS with 0.1% Triton X-100, 0.5 mM EDTA, 50 μg ml−1 RNase and 1:1,000–10,000 propidium iodide). Cell cycle distributions were quantified using a Becton Dickinson-LSRII Flow Cytometer. Data were collected using Cell Quest Software (Becton Dickinson Immunocytometry). Cell populations were analyzed using FlowJo (v.10.6.2); a gating strategy has been provided. Cell cycle percentages were calculated using the Dean–Jett-Fox model. Statistical analysis was calculated using GraphPad Prism (v.7.0).
Statistical analysis, reproducibility and rigor.
Sample size descriptions are detailed in figure legends and were chosen based on previous experience based on the given experiment. No animals or data points were excluded from this study. In vivo experiments were performed in a blinded manner. Additionally, mice were randomized into experimental condition after injection. For all other experiments, the investigators were not blinded to data allocation during experiments and outcome assessment. Western blots were performed in biological triplicate unless stated otherwise. This study complies with all relevant ethical regulations from UPitt and UPitt’s IACUC (20108110, PI: Agnihotri). Statistical analysis was performed using GraphPad Prism 7.0. All in vitro experiments were performed in biological triplicate unless otherwise stated. Values reported are mean and s.e.m. ANOVA was conducted for multi-group comparisons followed by either one-sided post hoc Tukey’s test, post hoc Dunnett’s test or Šídák’s multiple comparisons test to identify differences between groups. Survival analysis was performed using the log-rank Mantel–Cox survival test. For direct pairwise comparisons where appropriate, an unpaired two-tailed t-test was used. Data distribution was assumed to be normal, but this was not formally tested. Significance was established as *P < 0.05, **P < 0.01, ***P < 0.001, ****P < 0.0001.
Reporting Summary.
Further information on research design is available in the Nature Research Reporting Summary linked to this article.
Extended Data
Extended Data Fig. 1 |. Generation of a Syngeneic Mouse Model of DIPG and RNA-seq profiling of NPC to H3WTMPP and H3K27MPP cells.
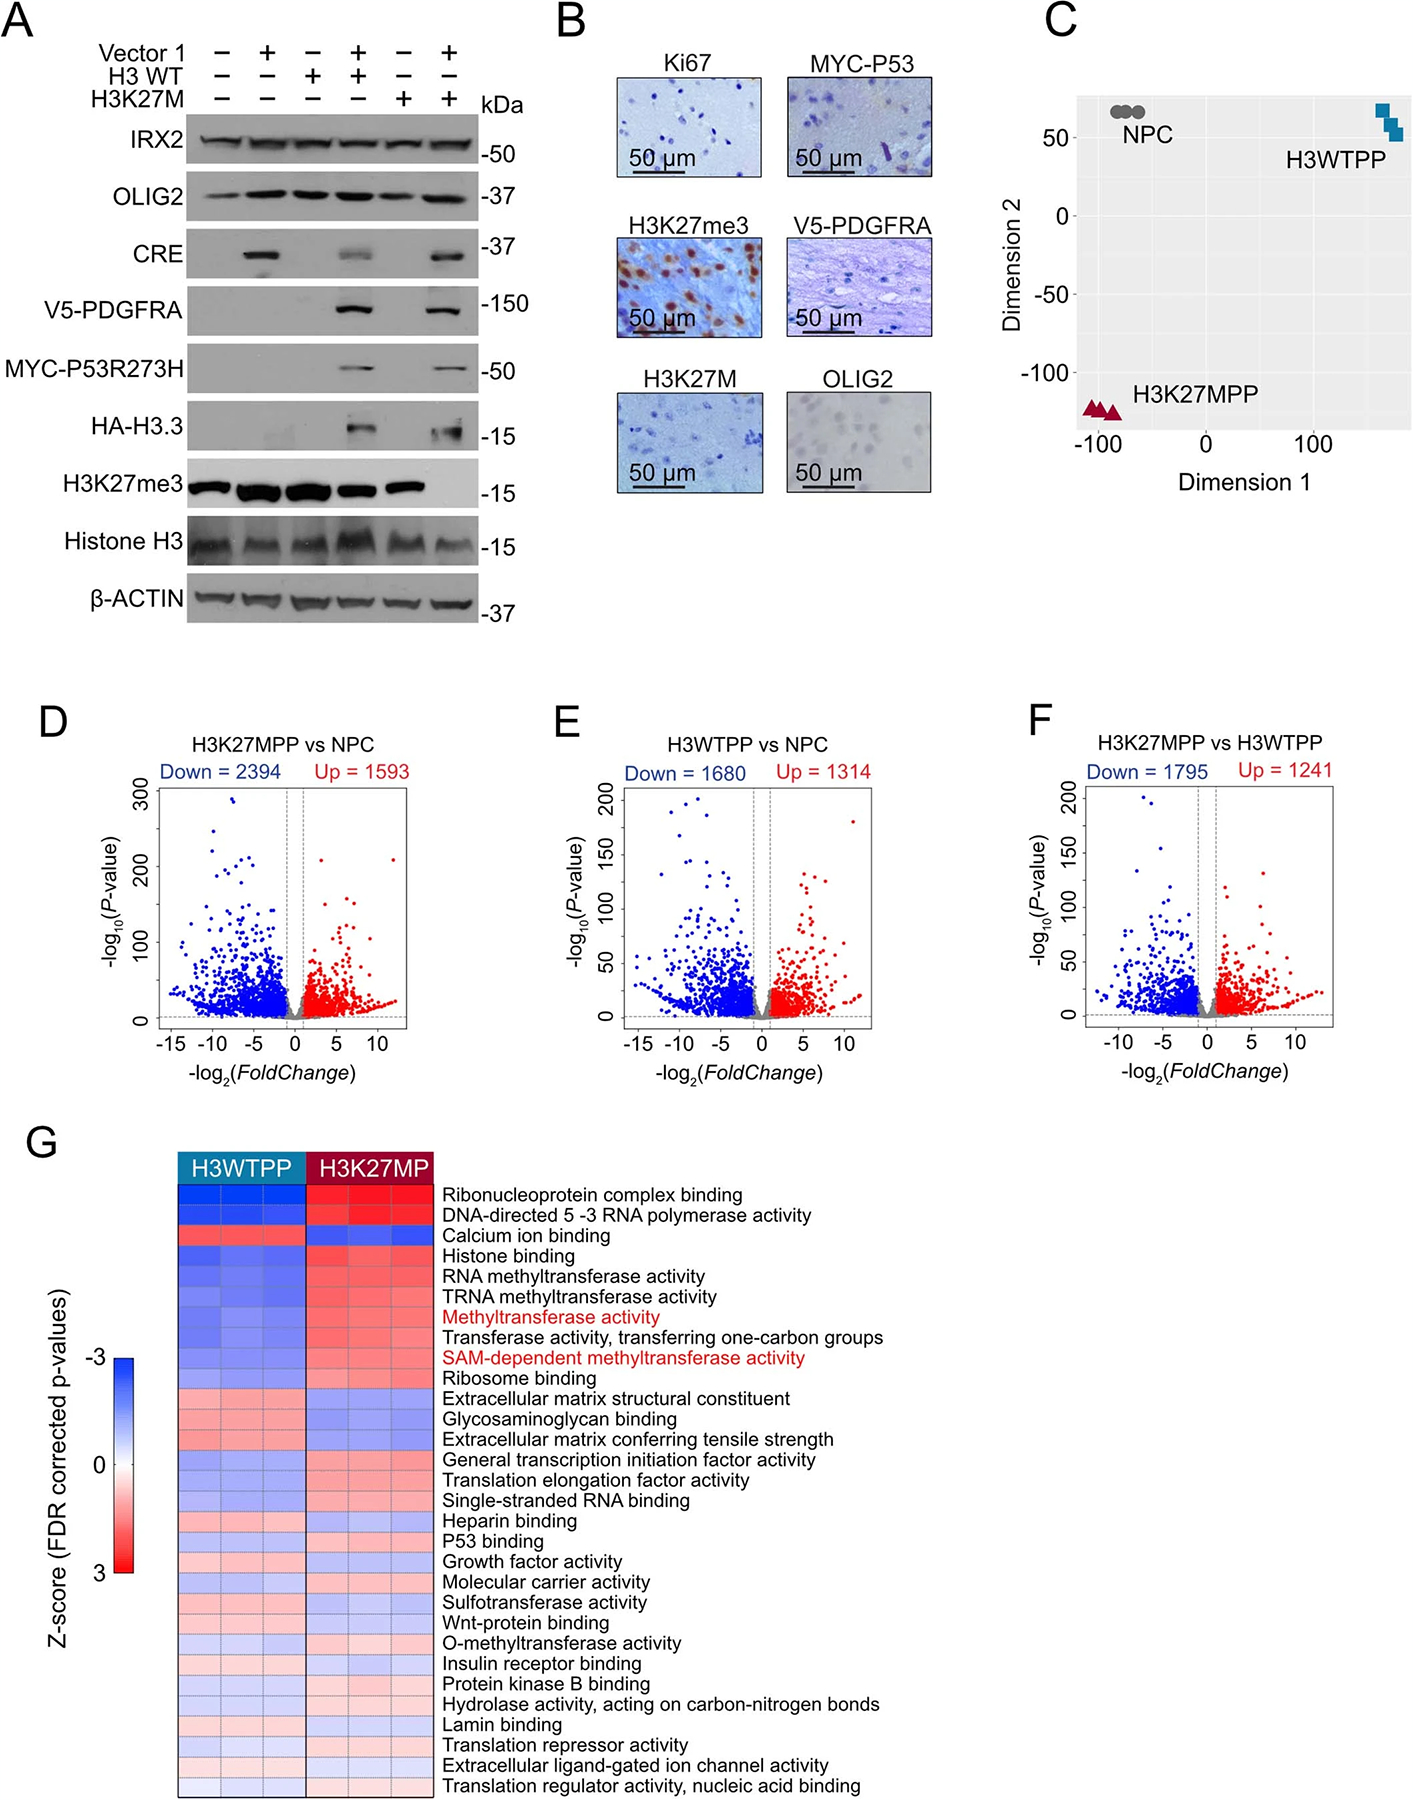
A. Western blot confirming epitope tagged transgene expression. B. Immunohistochemistry confirming transgene in negative in adjacent normal brain and cells are low for OLIG2 and positive for H3K27me3. Staining was confirmed in 3 independent mice. [AUs: Please include a scale bar]. C. Multidimensional scaling plot of RNA-seq data comparing control NPCs, H3WTPP and H3K27MPP cells. D-F. DESEQ2 Volcano plots comparing H3K27MPP cells to control NPCs (D), H3WTPP cells compared to control NPCs (E) and H3K27MPP cells to H3WTPP cells (F). Analysis was on RNA-sequencing performed on 3 biological replicates per condition. Statistical adjustments were made for multiple comparisons using iDEP.94 DESeq2 Statistical packages in R. Data displayed in blue or red represent genes with an FDR >0.05. G. Gene-set enrichment analysis (GSEA) using molecular terms, comparing H3WTPP and H3K27MPP from RNA-sequencing performed in biological triplicates for each condition.
Extended Data Fig. 2 |. SiRNA drop out screen reveals sensitivity to MAT2A and AMD1 loss.
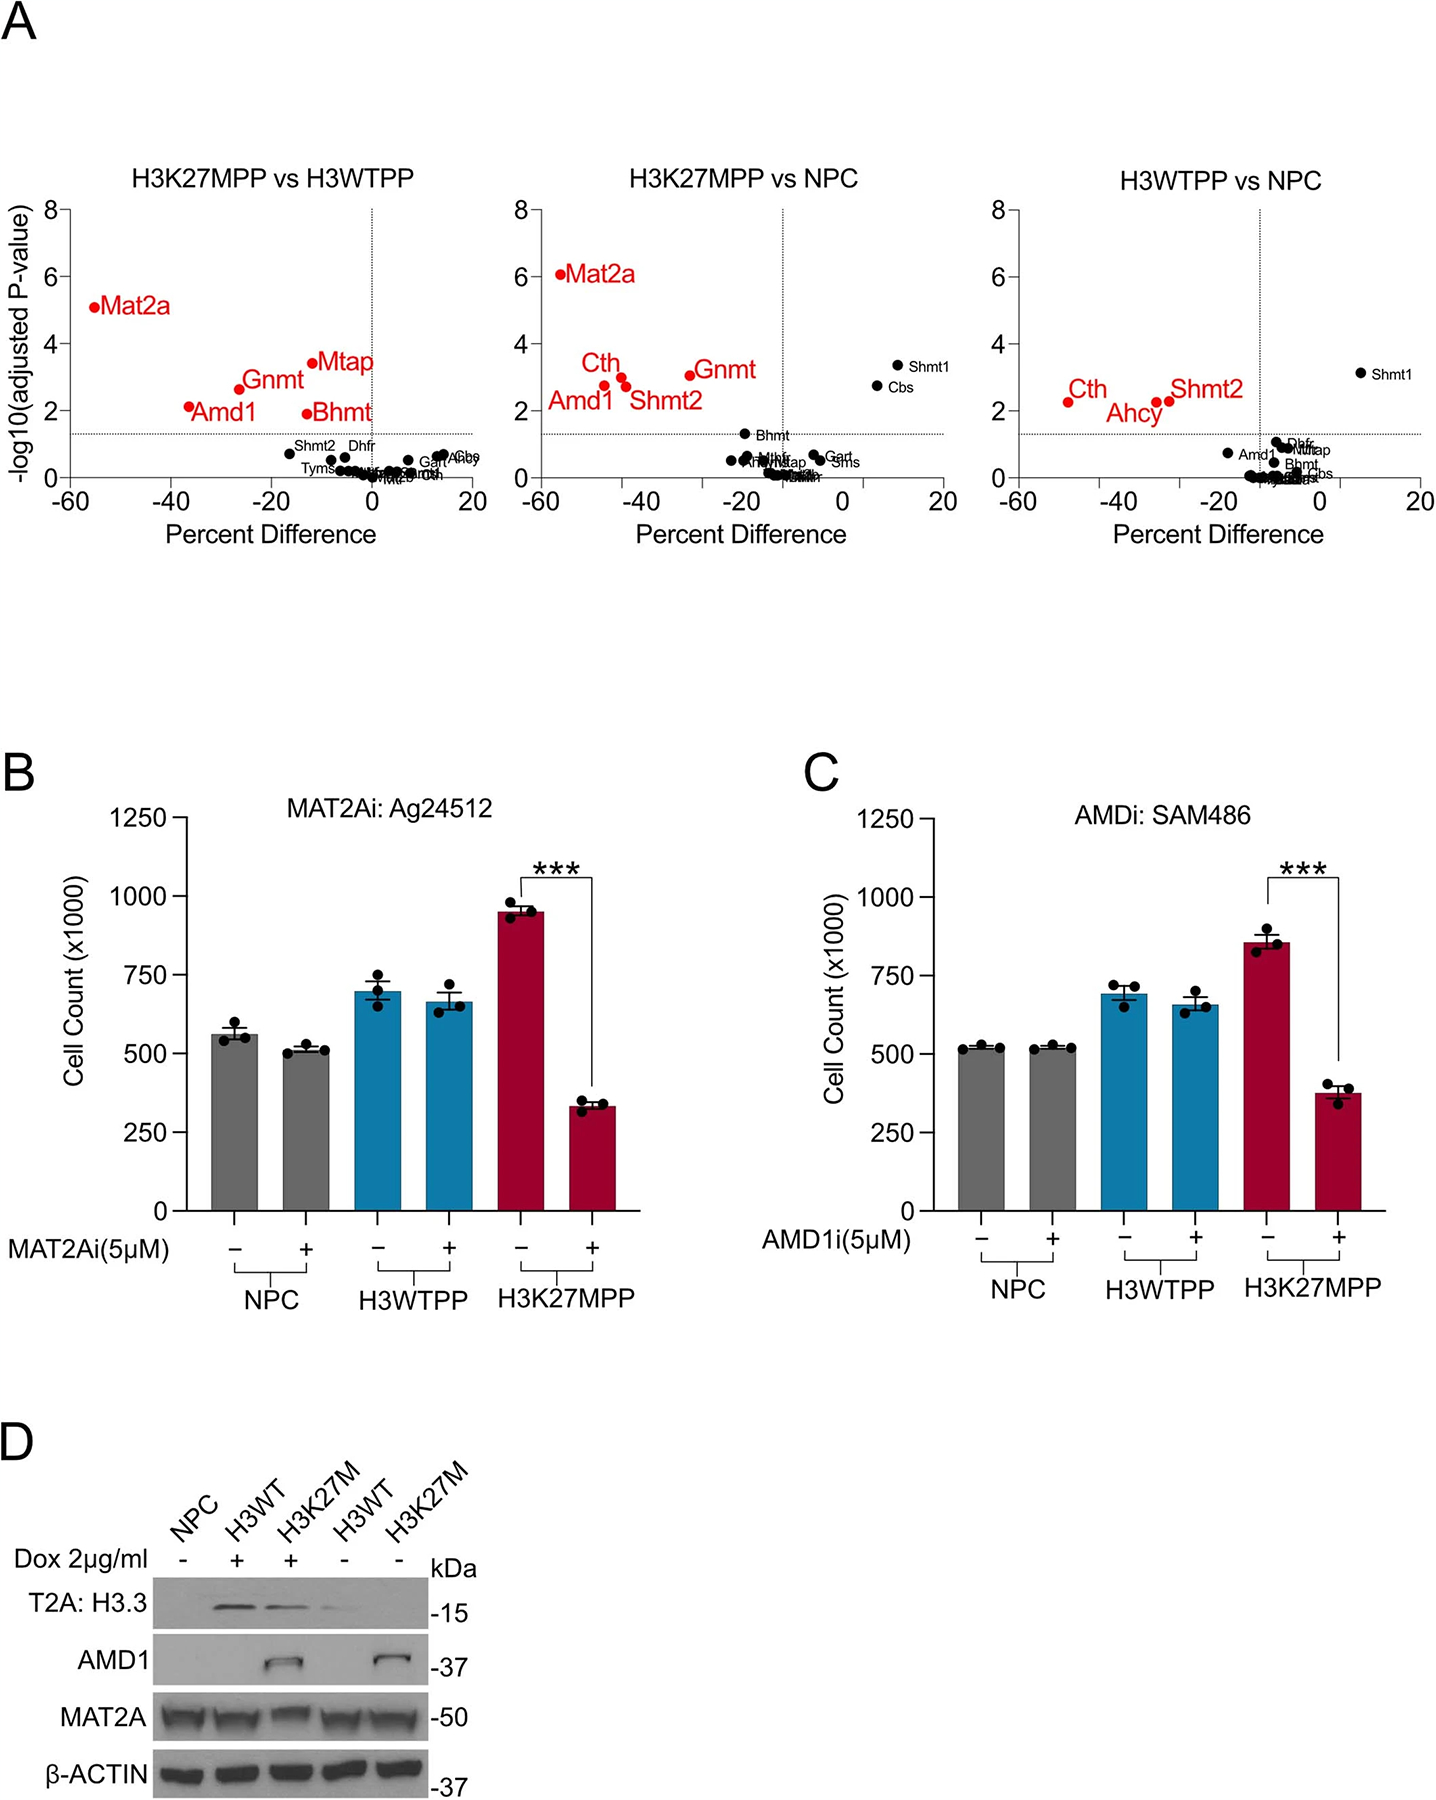
A. Graphical representation of data in (Fig. 3B) plotted to percent difference in viability against −log10(adjusted P-value) generated from multiple T-tests unpaired, using Holm-Šídák method for multiple comparisons. (Left most graph comparing H3K27MPP vs H3WTPP, center H3K27MPP vs NSC, right H3WTPP vs NSC). siRNA in red Adjusted P-value<0.05 and percent loss of viability >25%. B. Cell count of NPC, H3WTPP, and H3K27MPP cells treated with 5 μM of MAT2A Inhibitor (AGI-24512) for 5 days. Experiments were performed in biological replicates (n=3). Statistical analysis performed as two-tailed, unpaired T-test. Data displayed as mean ± s.e.m. (NPC vs. NPC+MAT2Ai p=0.071), (H3WTPP vs. H3WTPP+MAT2Ai p=0.4486), and (H3K27MPP vs. H3K27MPP+MAT2Ai ***p<0.0001). C. Cell count of NPC, H3WTPP, and H3K27MPP cells treated with 5 μM of AMD1 inhibitor SAM426 for 5 days. Experiments were performed in biological replicates (n=3). Statistical analysis performed as two-tailed, unpaired T-test. Data displayed as mean ± s.e.m. (NPC vs. NPC+AMD1i p>0.9999), (H3WTPP vs. H3WTPP+AMD1i p=0.3248), and (H3K27MPP vs. H3K27MPP+AMD1i ***p<0.0001). D. Western blot comparing MAT2A and AMD1 expression in Histone H3 variant doxycycline inducible NPCs.
Extended Data Fig. 3 |. Effect of MAT2A inhibition in glioma lines. A-C.
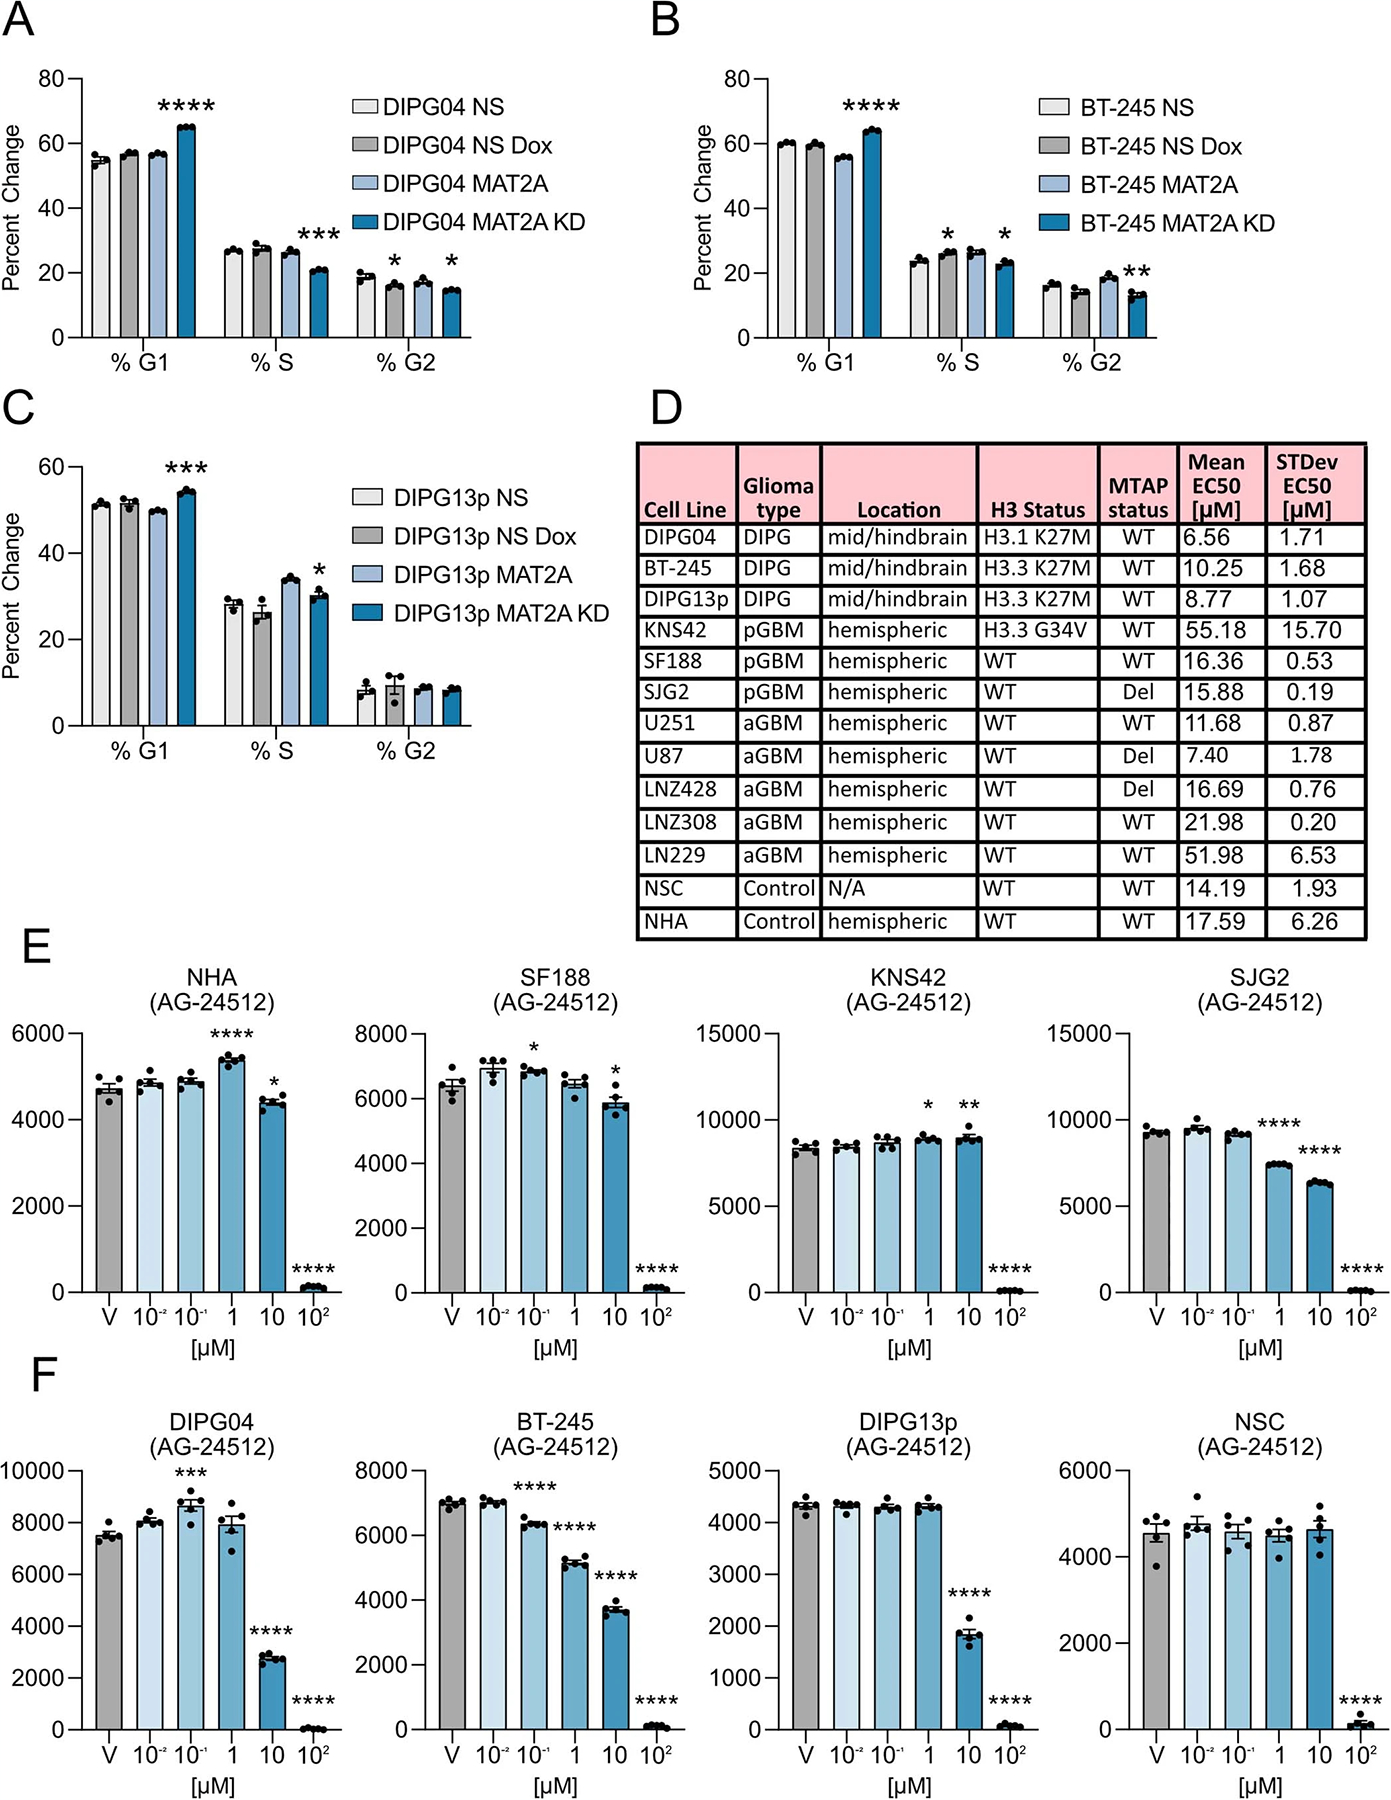
Cell cycle analysis of control DMG cells compared to MAT2A knockdowns in (A) DIPG04, (B) BT-245 (C) DIPG13p. Experiments performed in biological triplicate. Statistical analysis as two-tailed, unpaired-T test. Data is displayed as mean± s.e.m. ((A) (DIPG04 NS No Dox vs. DIPG04 NS Dox %G2 *p=0.047), (DIPG04 MAT2A No Dox vs. Dox %G1 ****p=0.000004, %S ***p=0.000561, %G2 *p=0.014235). ((B) (BT-245 NS No Dox vs. Dox %S *p=0.041398), (BT-245 MAT2A No Dox vs. Dox %G1 ****p=0.000013, %S *p=0.017414, %G2 **p=0.004338). ((C) DIPG13p MAT2A No Dox vs. Dox %G1 ***p=0.000194, %S *p=0.011396). *p<0.05, **p<0.01, ***p<0.001, ****p<0.0001. p>0.05 not displayed. D. Summary of cell line features for MAT2A inhibitor viability response. E. Non-DMG/DIPG lines: Alamar blue viability response to varying doses of AG-24512. Experiments performed were in 5 biological replicates. Statistical analysis was performed using a one-way ANOVA followed by a Dunnett’s multiple comparison test. Data is displayed as mean± s.e.m. Adjusted P-values as follows: ((NHA) DMSO vs. 1 μM ****p<0.0001, DMSO vs. 10 μM *p=0.0107, DMSO vs. 100 μM ****p<0.0001), ((SF188) DMSO vs. 0.1 μM *p=0.0237, DMSO vs.10 μM *p=0.0297, DMSO vs. 100 μM ****p<0.0001), ((KNS42) DMSO vs. 1 μM *p=0.0269, DMSO vs. 10 μM **p=0.0086, DMSO vs. 100 μM ****p<0.0001), ((SJG2) DMSO vs. 1 μM ****p<0.0001, DMSO vs. 10 μM ****p<0.0001, DMSO vs. 100 μM ****p<0.0001). *p<0.05, **p<0.01, ***p<0.001, ****p<0.0001. p>0.05 not displayed. F. H3K27M mutant DIPG lines: Alamar blue viability in response to varying doses of AG-24512. Experiments performed were in 5 biological replicates. Statistical analysis was performed using a one-way ANOVA followed by a Dunnett’s multiple comparison test. Data is displayed as mean± s.e.m. Adjusted P-values as follows: ((DIPG04) DMSO 0.1 μM ***p=0.0004, DMSO vs. 10 μM ****p<0.0001, DMSO vs. 100 μM ****p<0.0001), ((BT-245) DMSO vs. 0.1, 1, 10, 100 μM ****p<0.0001), ((DIPG13p) DMSO vs. 10, 100 μM ****p<0.0001), ((NSC) DMSO vs. 100 μM ****p<0.0001). *p<0.05, **p<0.01, ***p<0.001, ****p<0.0001. p>0.05 not displayed.
Extended Data Fig. 4 |. MAT2A Overexpression reduces cell proliferation and increases EC50s to AG-24512.
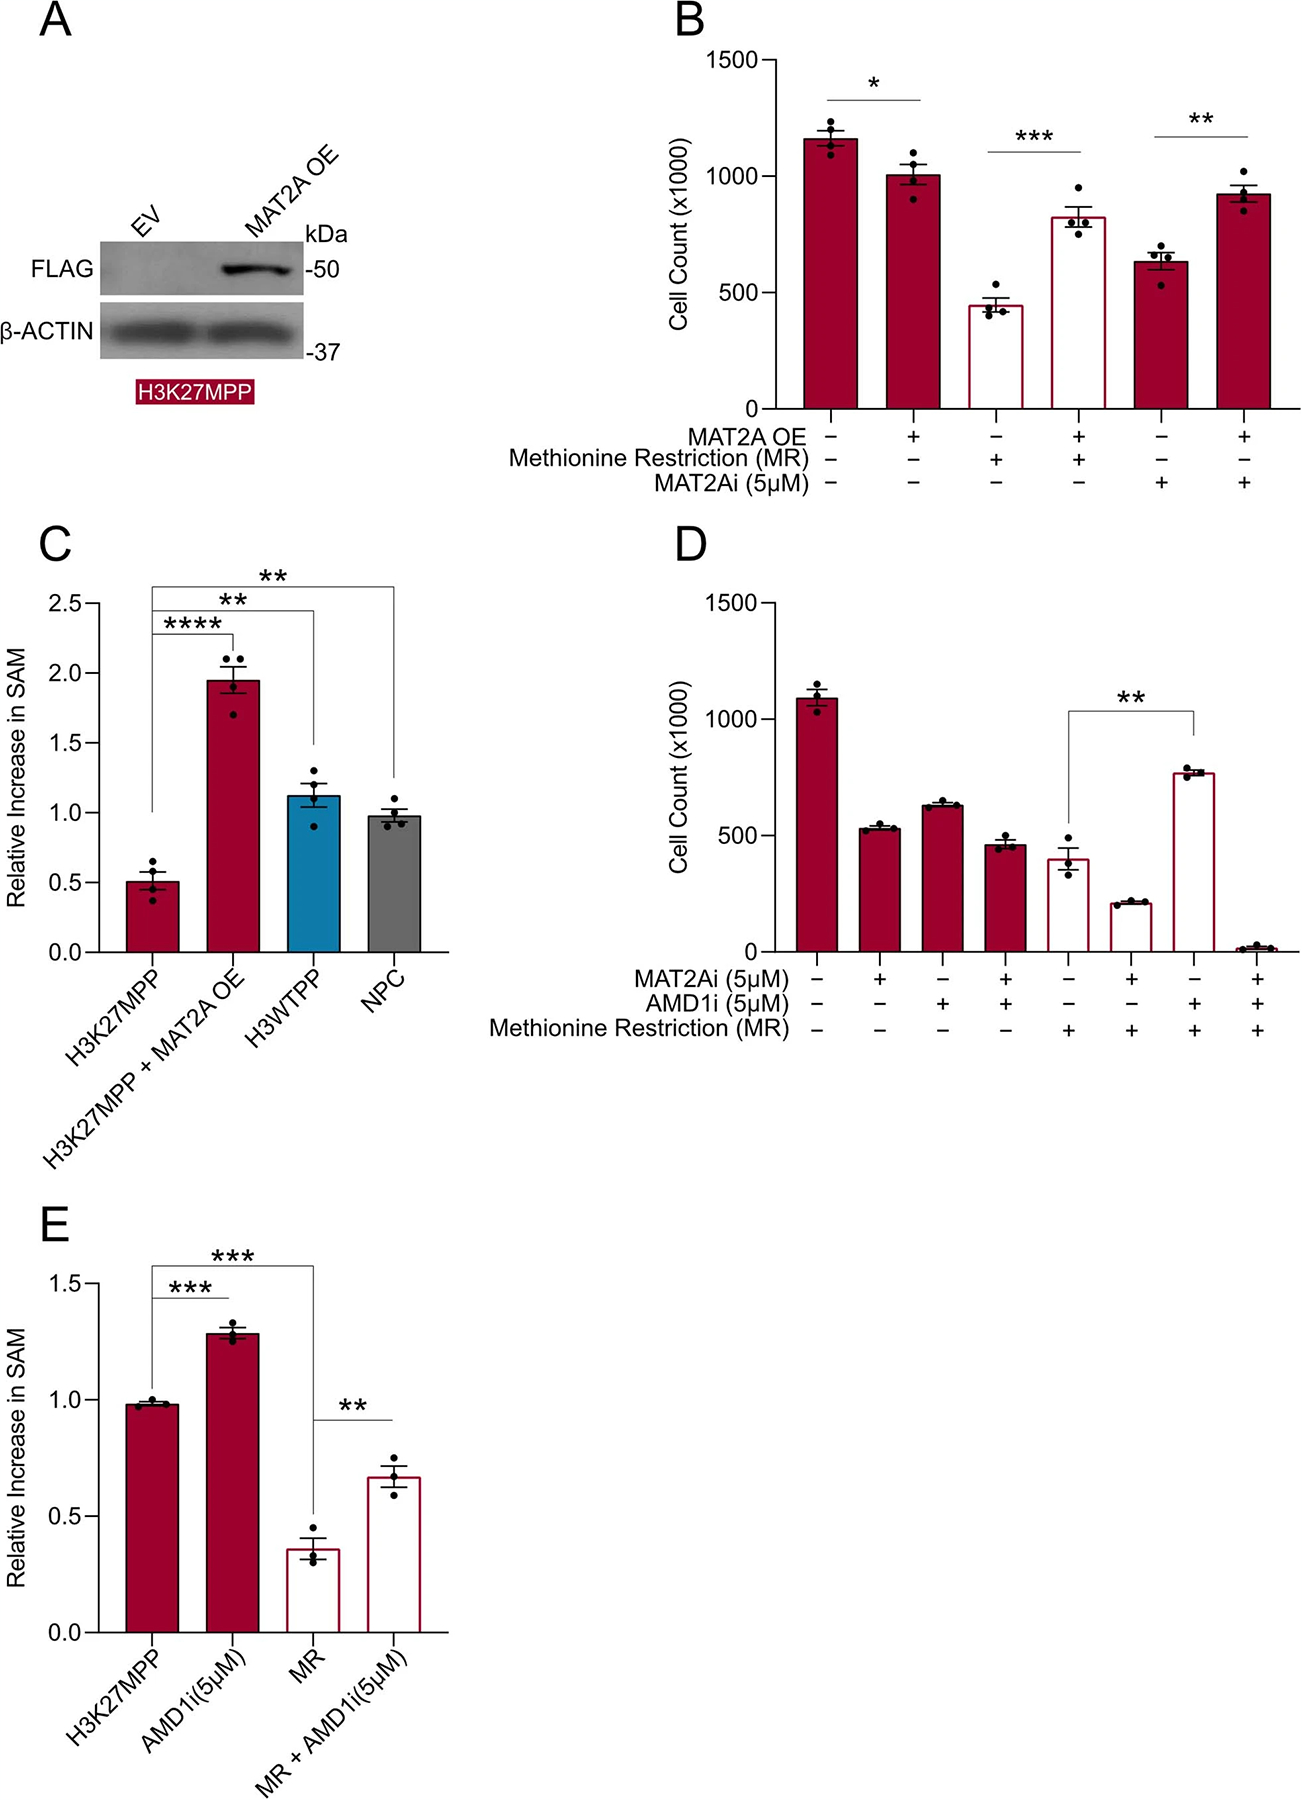
A. Western blot of MAT2A-FLAG overexpression in H3K27MPP cells. B. Cell count of H3K27MPP cells comparing combinations of MAT2A over-expression, methionine deprivation, and MAT2A inhibitor. Experiments were performed in biological replicates (n=3). Data is displayed as mean± s.e.m. Statistical analysis performed as two-tailed, unpaired T-test. (H3K27MPP vs. H3K27MPP MAT2A OE *p=0.0285), (H3K27MPP+MR vs. H3K27MPP MAT2A OE+MR ***p=0.0004), and (H3K27MPP+MAT2Ai vs. H3K27MPP MAT2A OE+MAT2Ai **p=0.0013). *p<0.05, **p<0.01, ***p<0.001, ****p<0.0001. C. Quantification of SAM in H3K27MPP control and MAT2A over expressing (OE) cells compared with H3WTPP and NSC. Experiments were performed in biological replicates (n=4). Data is displayed as mean± s.e.m. Statistical analysis performed as two-tailed, unpaired T-test. (H3K27MPP vs. H3K27MPP MAT2A OE ****p<0.0001), (H3K27MPP vs. H3WTPP **p=0.0012), and (H3K27MPP vs. NPC **p=0.001). *p<0.05, **p<0.01, ***p<0.001, ****p<0.0001. D. Cell count of H3K27MPP cells comparing combinations of MAT2A Inhibitor (AGI-24512), AMD1 inhibitor (SAM426) and methionine deprivation conditions. Experiments were performed in biological replicates (n=3). Data is displayed as mean± s.e.m. Statistical analysis performed as two-tailed, unpaired T-test. (H3K27MPP+MR vs. H3K27MPP+MR+AMD1i **p=0.0016). E. Quantification of SAM in H3K27MPP cells comparing the combination of AMD1 inhibitor (SAM426) with methionine deprivation conditions. Experiments were performed in biological replicates (n=4) Data is displayed as mean± s.e.m. Statistical analysis performed as two-tailed, unpaired T-test. (H3K27MPP vs. AMD1i ***p=0.0003), (H3K27MPP vs. MR ***p=0.0002), and (H3K27MPP+MR vs. H3K27MPP+MR+AMD1i **p=0.0089). *p<0.05, **p<0.01, ***p<0.001, ****p<0.0001.
Extended Data Fig. 5 |. The effects of dcSAM on MAT2A intron retention and protein stability.
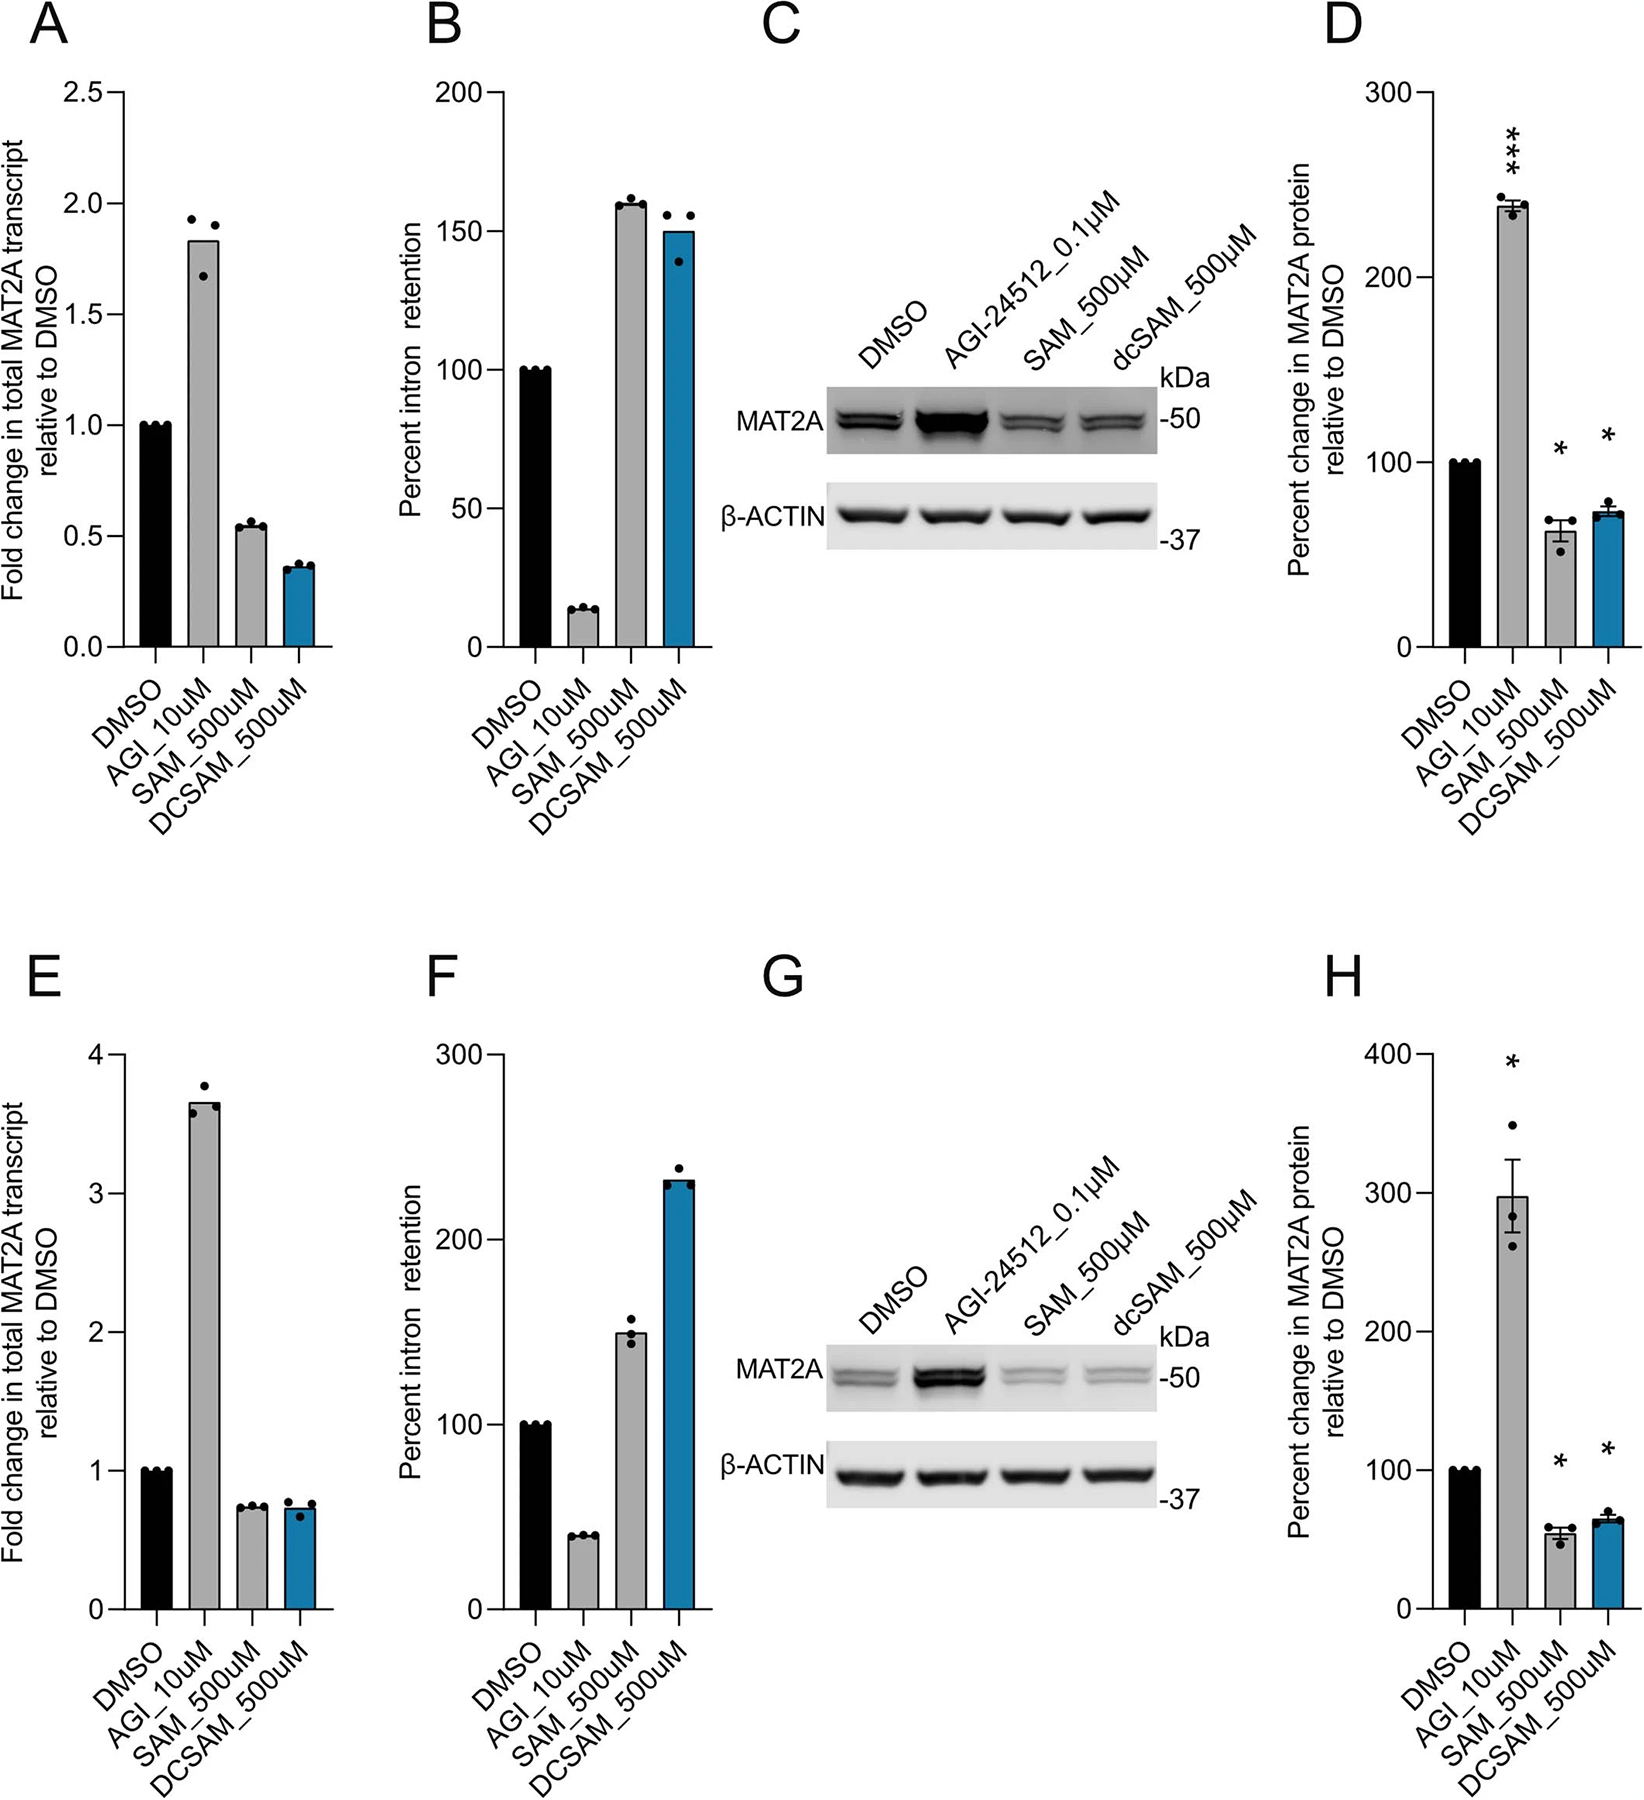
A. Fold change in total MAT2A transcript levels relative to DMSO control in DIPG04 cells incubated for 6 hours in the following: 0.1 μM AGI-24512, 500 μM SAM and 500 μM dcSAM. Experiment was performed once, and samples were repeatedly measured in triplicate for each condition. B. Percent Intron 8 retention in total MAT2A transcript in DIPG04 cells incubated for 6 hours in the following: 0.1 μM AGI-24512, 500 μM SAM and 500 μM dcSAM. Experiment was performed once, n=3 technical replicates for each condition. C. Quantitative western blotting of MAT2A protein and actin in DIPG04 cells incubated for 48 hours in the following: 0.1 μM AGI-24512, 500 μM SAM and 500 μM dcSAM. D. Quantification of westerns from C) using Li-Cor fluorescent system. Biological replicate of n=3. Biological samples were measured 3 times and the average intensity was plotted for each biological replicate. Adjusted P-values as follows: (DMSO vs. AGI 10 μM ***p=0.0009), (DMSO vs. SAM 500 μM *p=0.0439), and (DMSO vs. dcSAM 500 μM *p=0.0189). *p<0.05, **p<0.01, ***p<0.001, ****p<0.0001. E. Fold change in total MAT2A transcript levels relative to DMSO control in NSC-PT2 cells incubated for 6 hours in the following: 0.1 μM AGI-24512, 500 μM SAM and 500 μM dcSAM. Experiment was performed once, and samples were repeatedly measured in triplicate for each condition. F. Percent intron 8 retention in total MAT2A transcript in NSC-PT2 cells incubated for 6 hours in the following: 0.1 μM AGI-24512, 500 μM SAM and 500 μM dcSAM. Experiment was performed once, n=3 technical replicates for each condition. G. Quantitative Western blotting of MAT2A protein and actin in NSC-PT2 cells incubated for 48 hours in the following: 0.1 μM AGI-24512, 500 μM SAM and 500 μM dcSAM. H. Quantification of westerns from G) using Li-Cor fluorescent system. Biological replicate of n=3. Biological samples were measured 3 times and the average intensity was plotted for each biological replicate. Adjusted P-values as follows: (DMSO vs. AGI 10 μM *p=0.033), (DMSO vs. SAM 500 μM *p=0.0153), and (DMSO vs. dcSAM 500 μM *p=0.0116). ((D, H) Statistical analysis performed as a repeated measures one-way ANOVA followed by Dunnett’s multiple comparisons test. Data displayed as mean ± s.e.m.).
Extended Data Fig. 6 |. Functional characterization of MAT2A knockdown in human DMG patients.
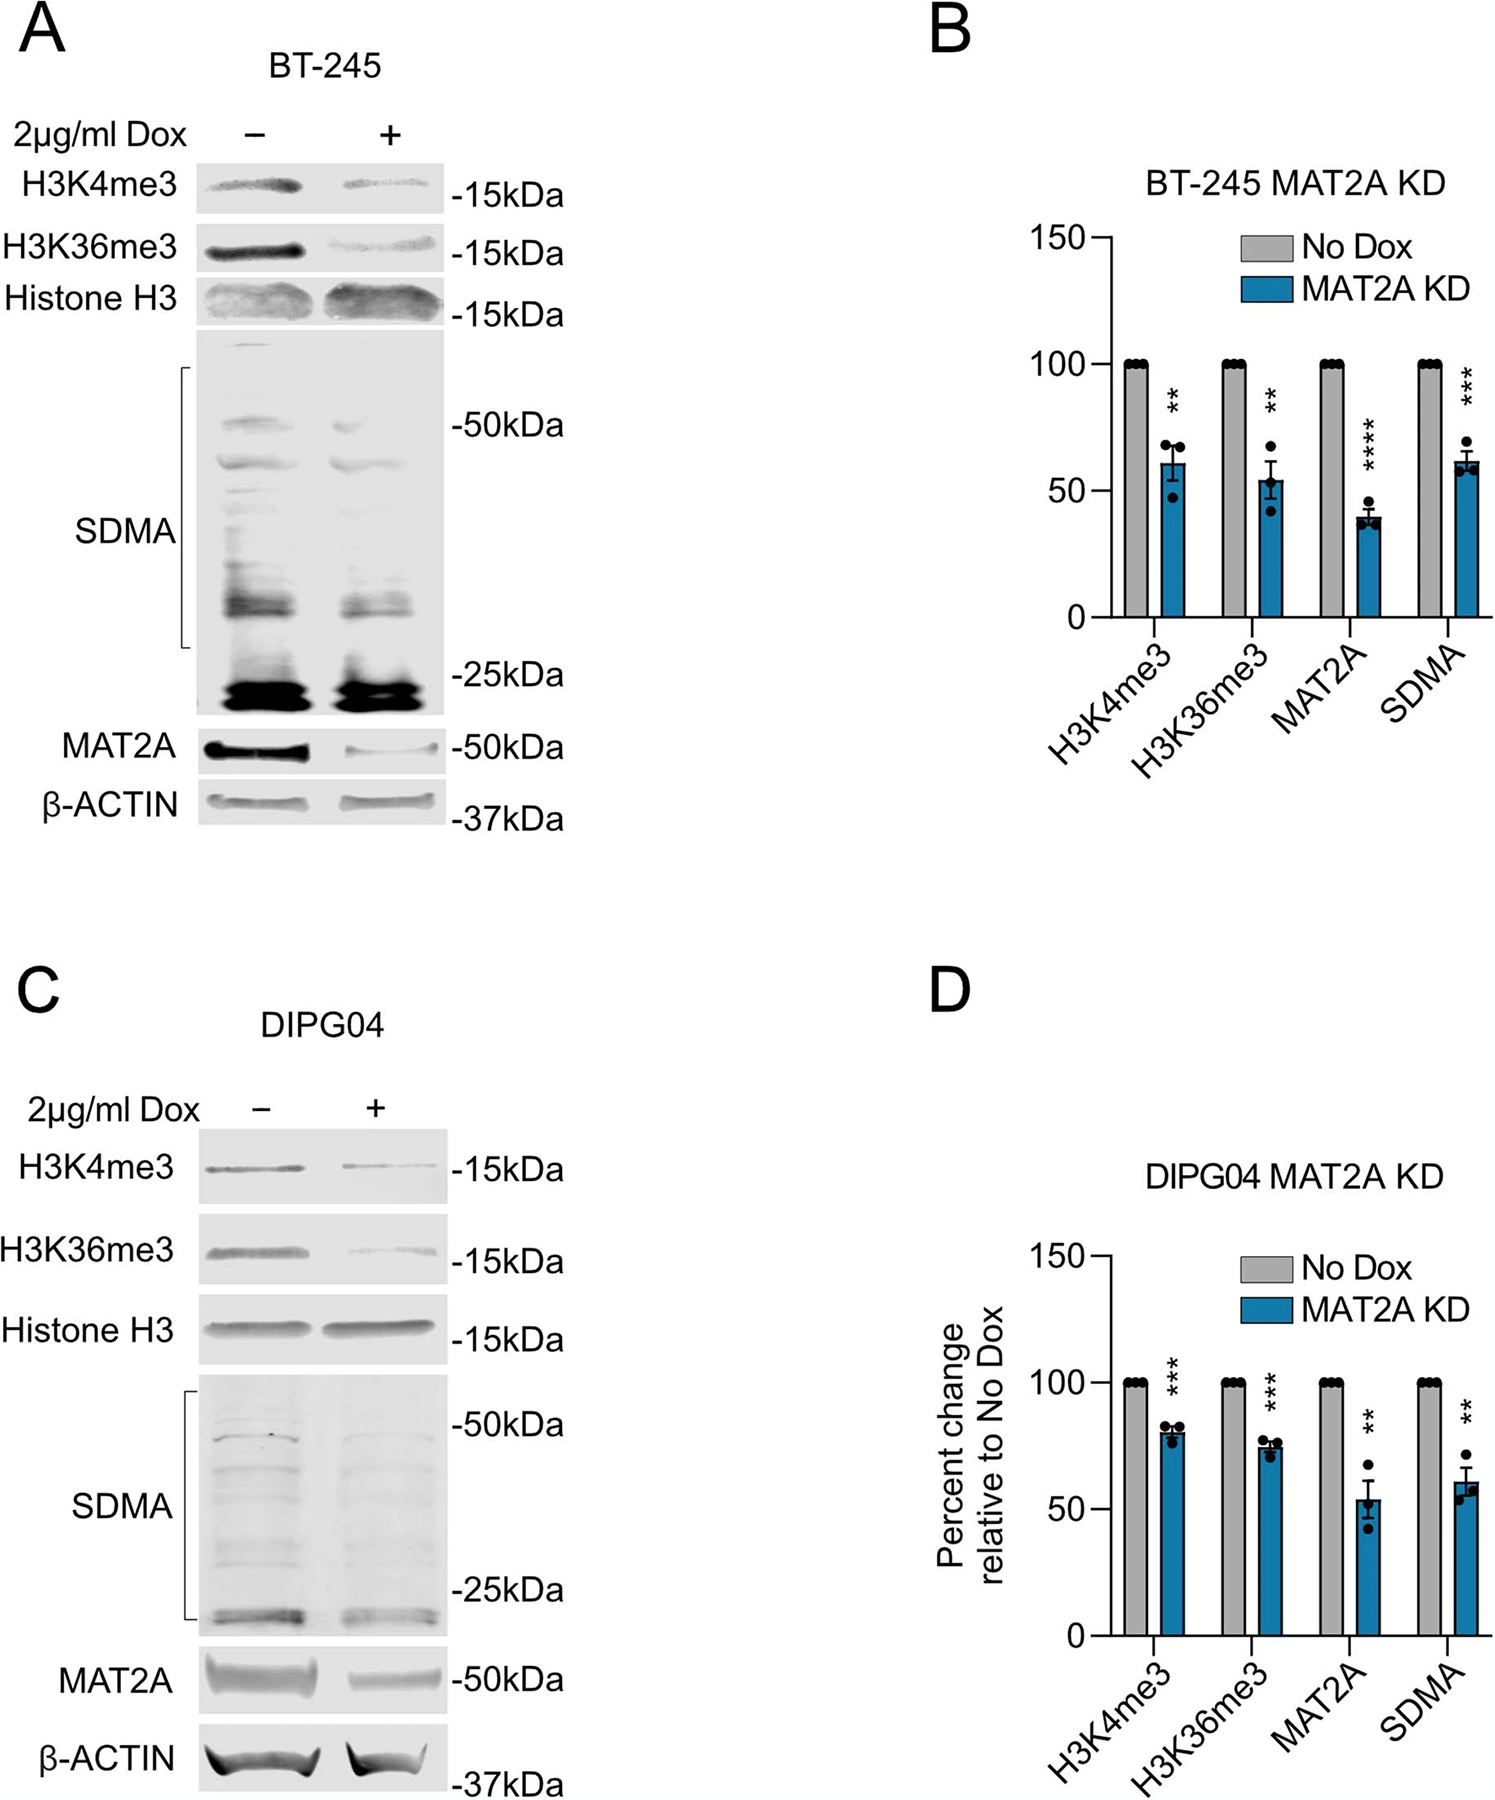
A. Quantitative Western Blotting of histone modifications (H3K4me3 and H3K36me3), and SDMA in BT-245 cells comparing MAT2A knockdown to control cells. B. Quantification of histone modifications (H3K4me3 and H3K36me3), SDMA, and MAT2A using Li-Cor fluorescent system for BT-245 cells, MAT2A knockdown vs control cells. Experiments performed in biological replicate of n=3, samples were repeatedly measured 3 times. Statistical analysis performed as two-tailed, unpaired T-test. Data displayed as mean ± s.e.m. (No Dox vs. Dox H3K4me3 **p=0.004557, H3K36me3 **p=0.003499, MAT2A ****p=0.00004, SDMA ***p=0.000578). *p<0.05, **p<0.01, ***p<0.001, ****p<0.0001. C. Quantitative Western Blotting of histone modifications (H3K4me3, H3K36me3), and SDMA in DIPG04 cells comparing MAT2A knockdown to control cells. D. Quantification of histone modifications (H3K4me3 and H3K36me3), SDMA, and MAT2A using Li-Cor fluorescent system for DIPG04 cells, MAT2A knockdown vs. control cells. Experiments performed in biological replicate of n=3, samples were repeatedly measured 3 times. Statistical analysis performed as two-tailed, unpaired T-test. Data displayed as mean ± s.e.m. (No Dox vs. Dox H3K4me3 ***p=0.000861, H3K36me3 ***p=0.000296, MAT2A **p=0.003325, SDMA **p=0.002049). *p<0.05, **p<0.01, ***p<0.001, ****p<0.0001.
Extended Data Fig. 7 |. Silencing MAT2a alters the transcriptome and H3K36me3 deposition.
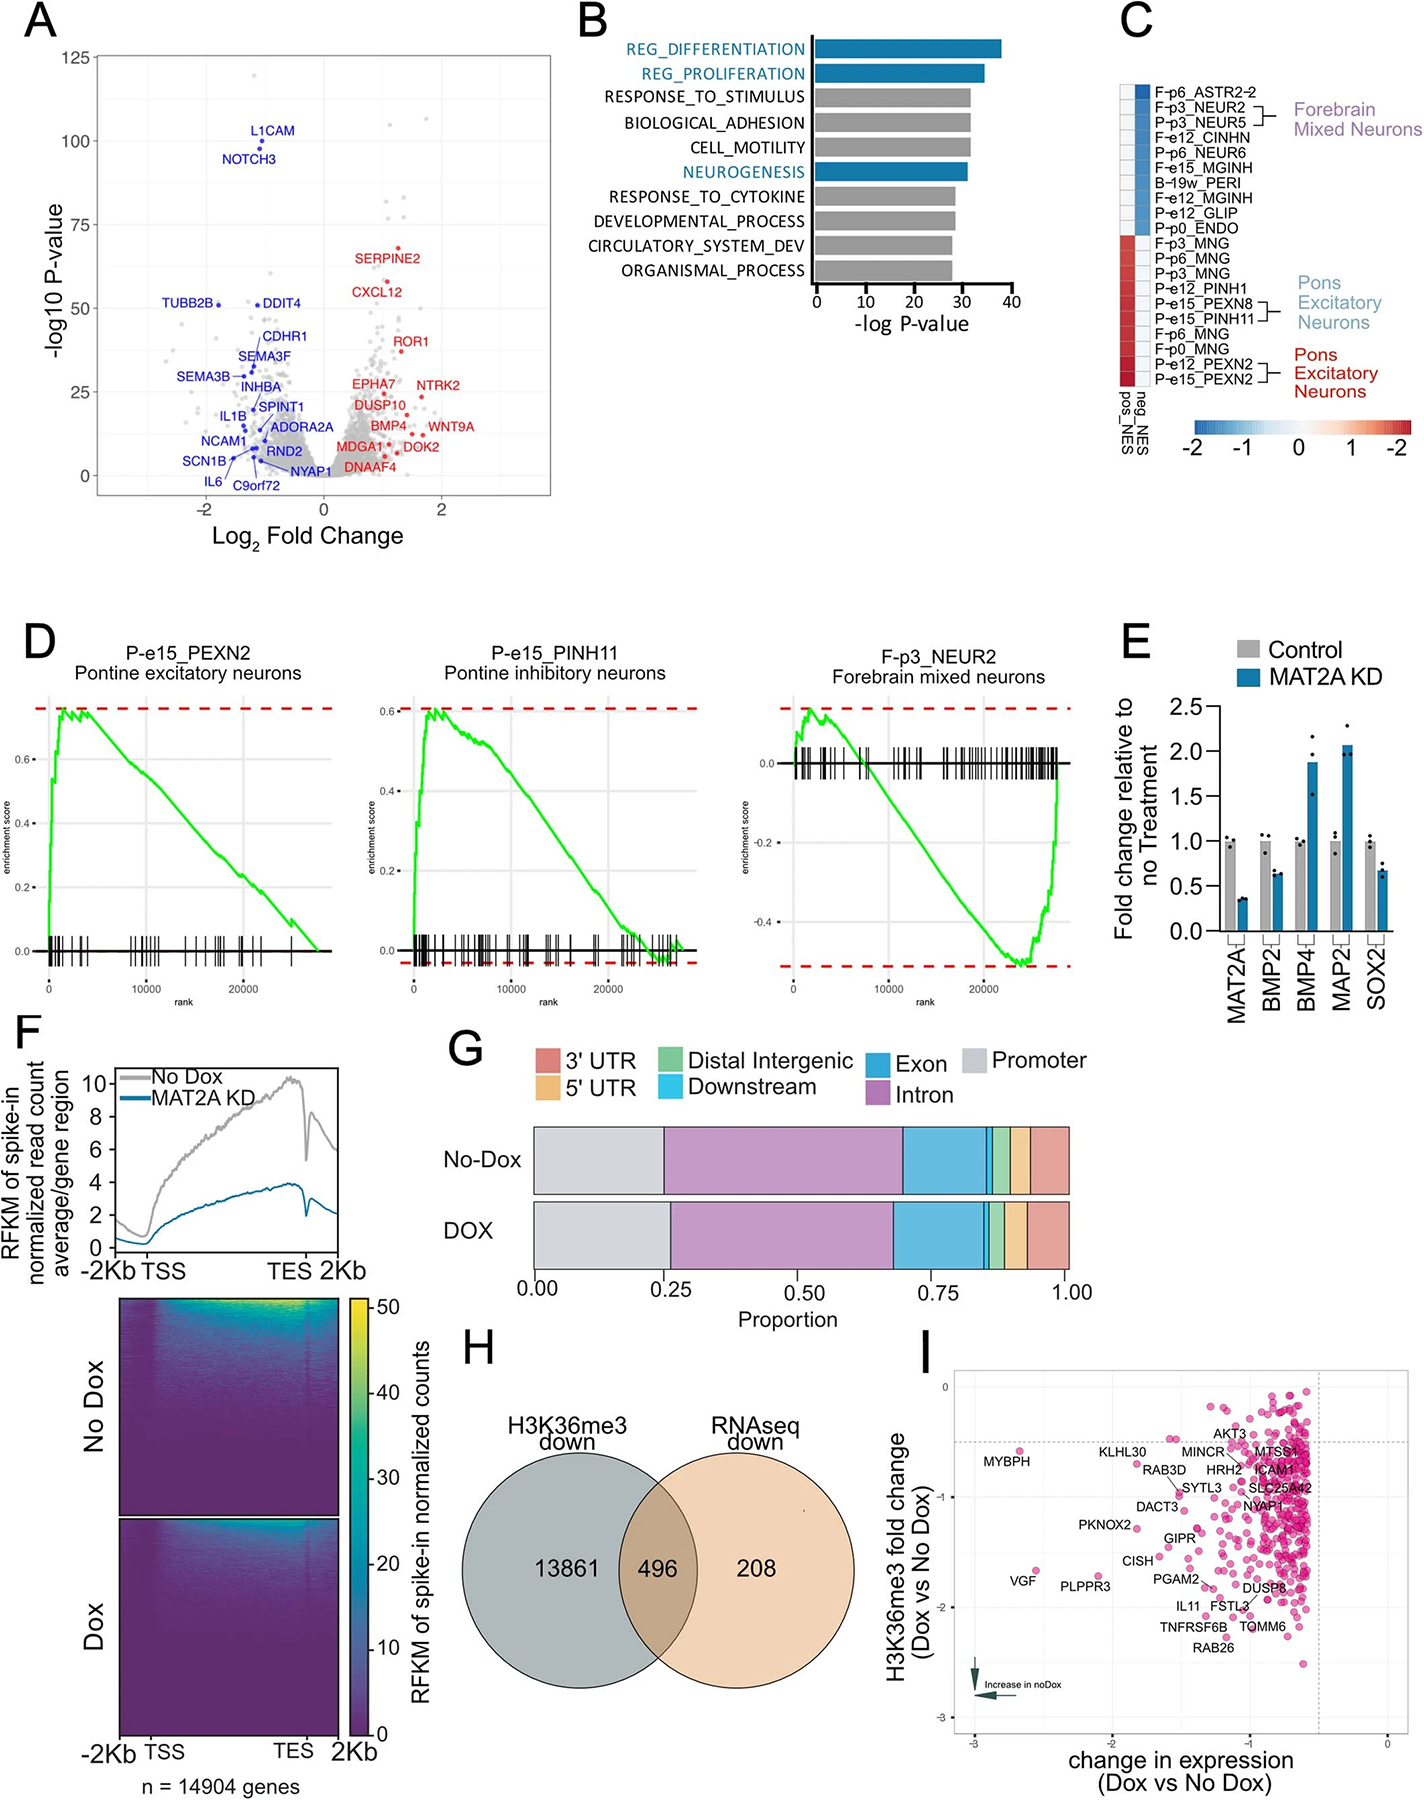
A. Volcano plot of differential gene expression comparing MAT2A knockdown to control DIPG04 cells. Canonical neuronal markers are highlighted in red (designating up-regulated genes) or blue (designating down-regulated genes). Statistical adjustments were made for multiple comparisons using iDEP.94 DESeq2 Statistical packages in R. B. Top 10 Gene sets, (Gene Ontology), derived from GSEA analysis of changes to the transcriptome in MAT2A knockdown. C. Heatmap of top 10 negative and positive enriching developmental cell signatures in MAT2A knockdown. D. Enrichment plots of selected developmental cell signatures from Extended Data Fig. 7C. E. Realtime PCR validation of selected canonical neurogenesis genes and markers of oligodendrocyte cells. Experiment was performed one time, n=3 technical triplicates for each gene. F. Heatmap of spike-in normalized H3K36me3 ChIP-Rx-seq reads centered at human genes in no doxycycline (top panel) vs. doxycycline (bottom panel) induction of MAT2A shRNA expression in DIPG04 cells. G. Bar plots of H3K36me3 ChIP-Rx-seq reads demonstrating alterations of H3K36me3 at different regions summarized across all human genes in DIPG04 cells. H. Venn diagram of overlapping genes between ChIP-Rx-seq and RNA-seq data. I. Plot of H3K36me3 (fold-change) vs. RNA seq (fold-change) with MAT2A KD, neurogenesis makers are indicated.
Extended Data Fig. 8 |. Leading edge analysis enriched developmental cell signatures in MAT2A KD.
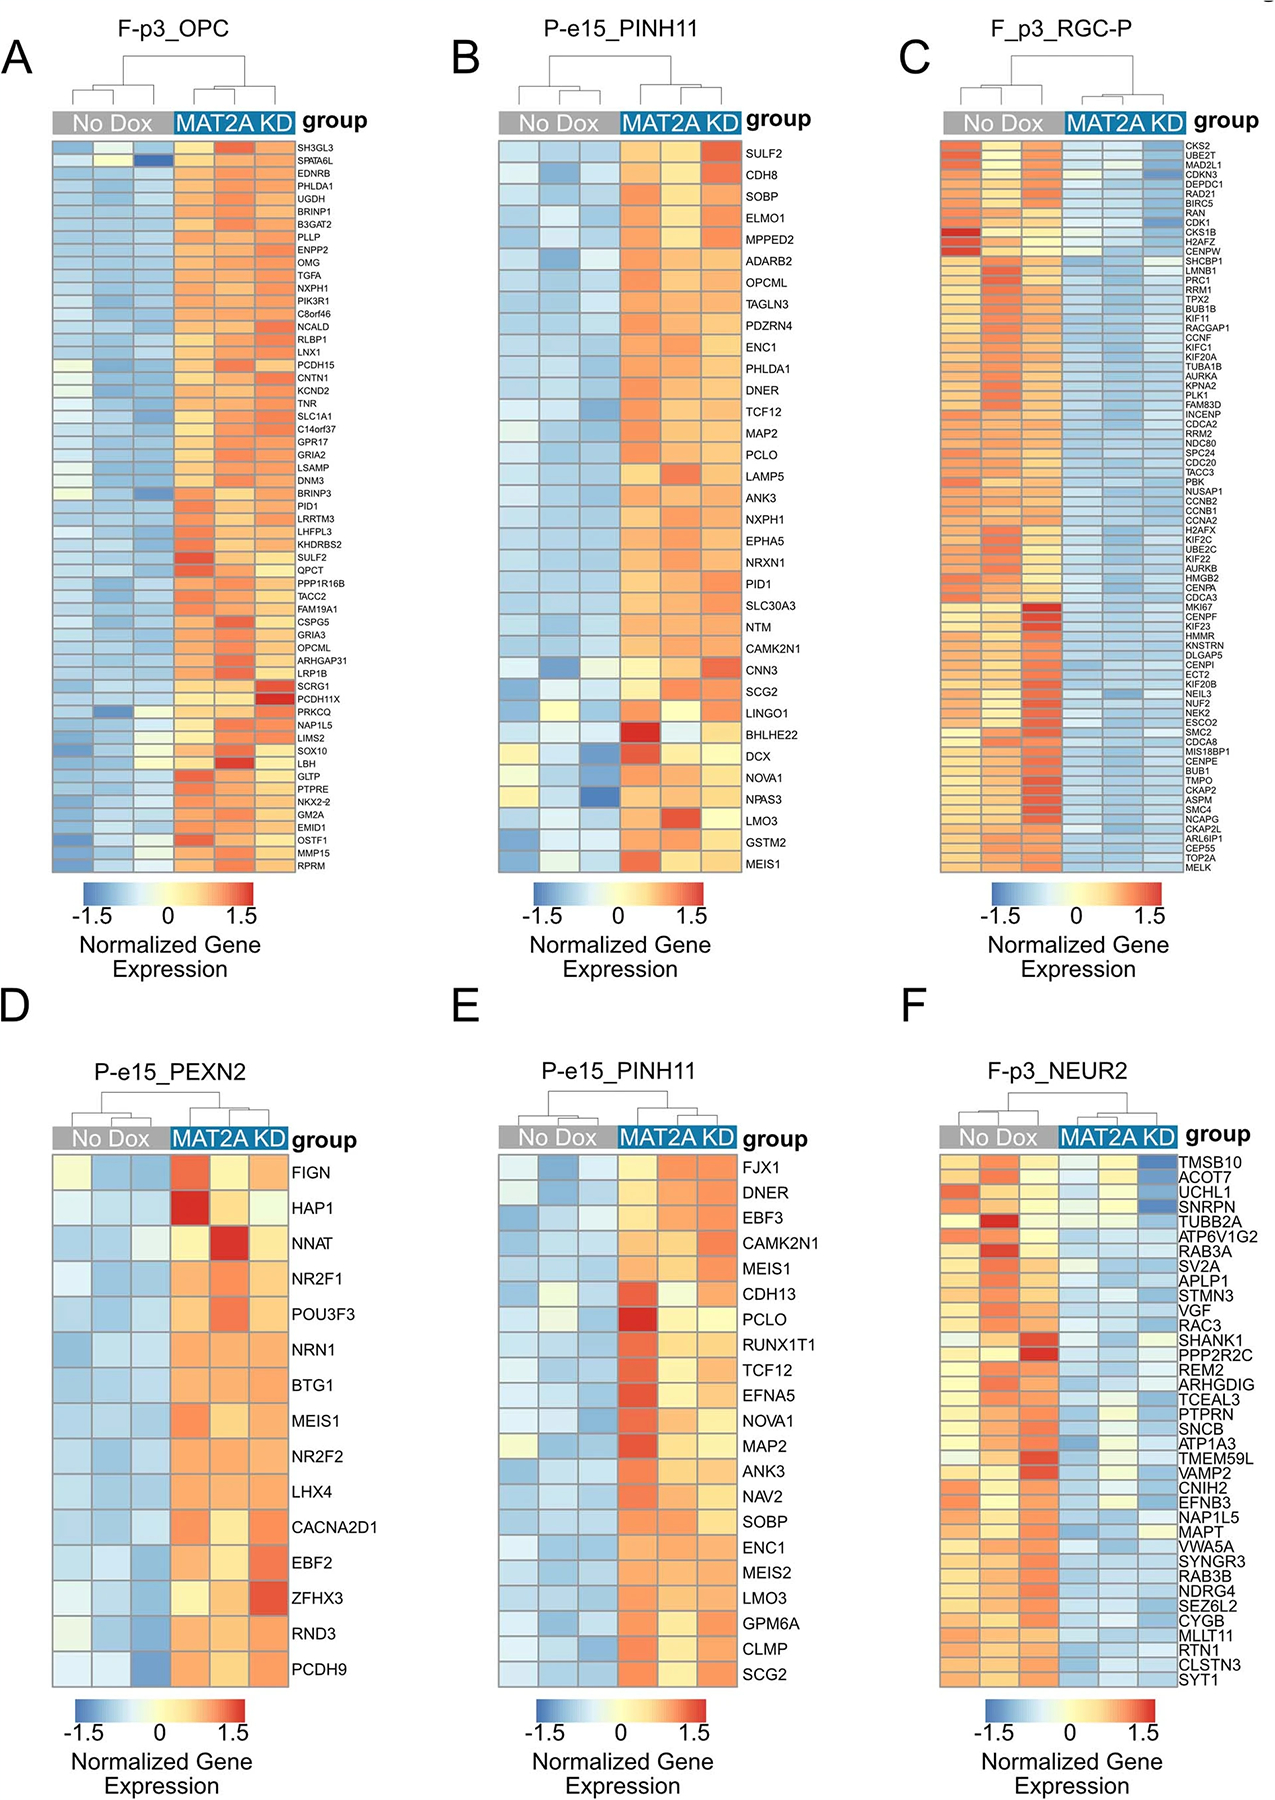
A-C. Leading edge analysis of DIPG13pP Enrichment plots (Fig. 7F). D-F. Leading edge analysis of DIPG04 Enrichment plots (Extended Data Fig. 7D).
Extended Data Fig. 9 |. MAT2A knockdown decreases H3K36me3 globally in DMG cells.
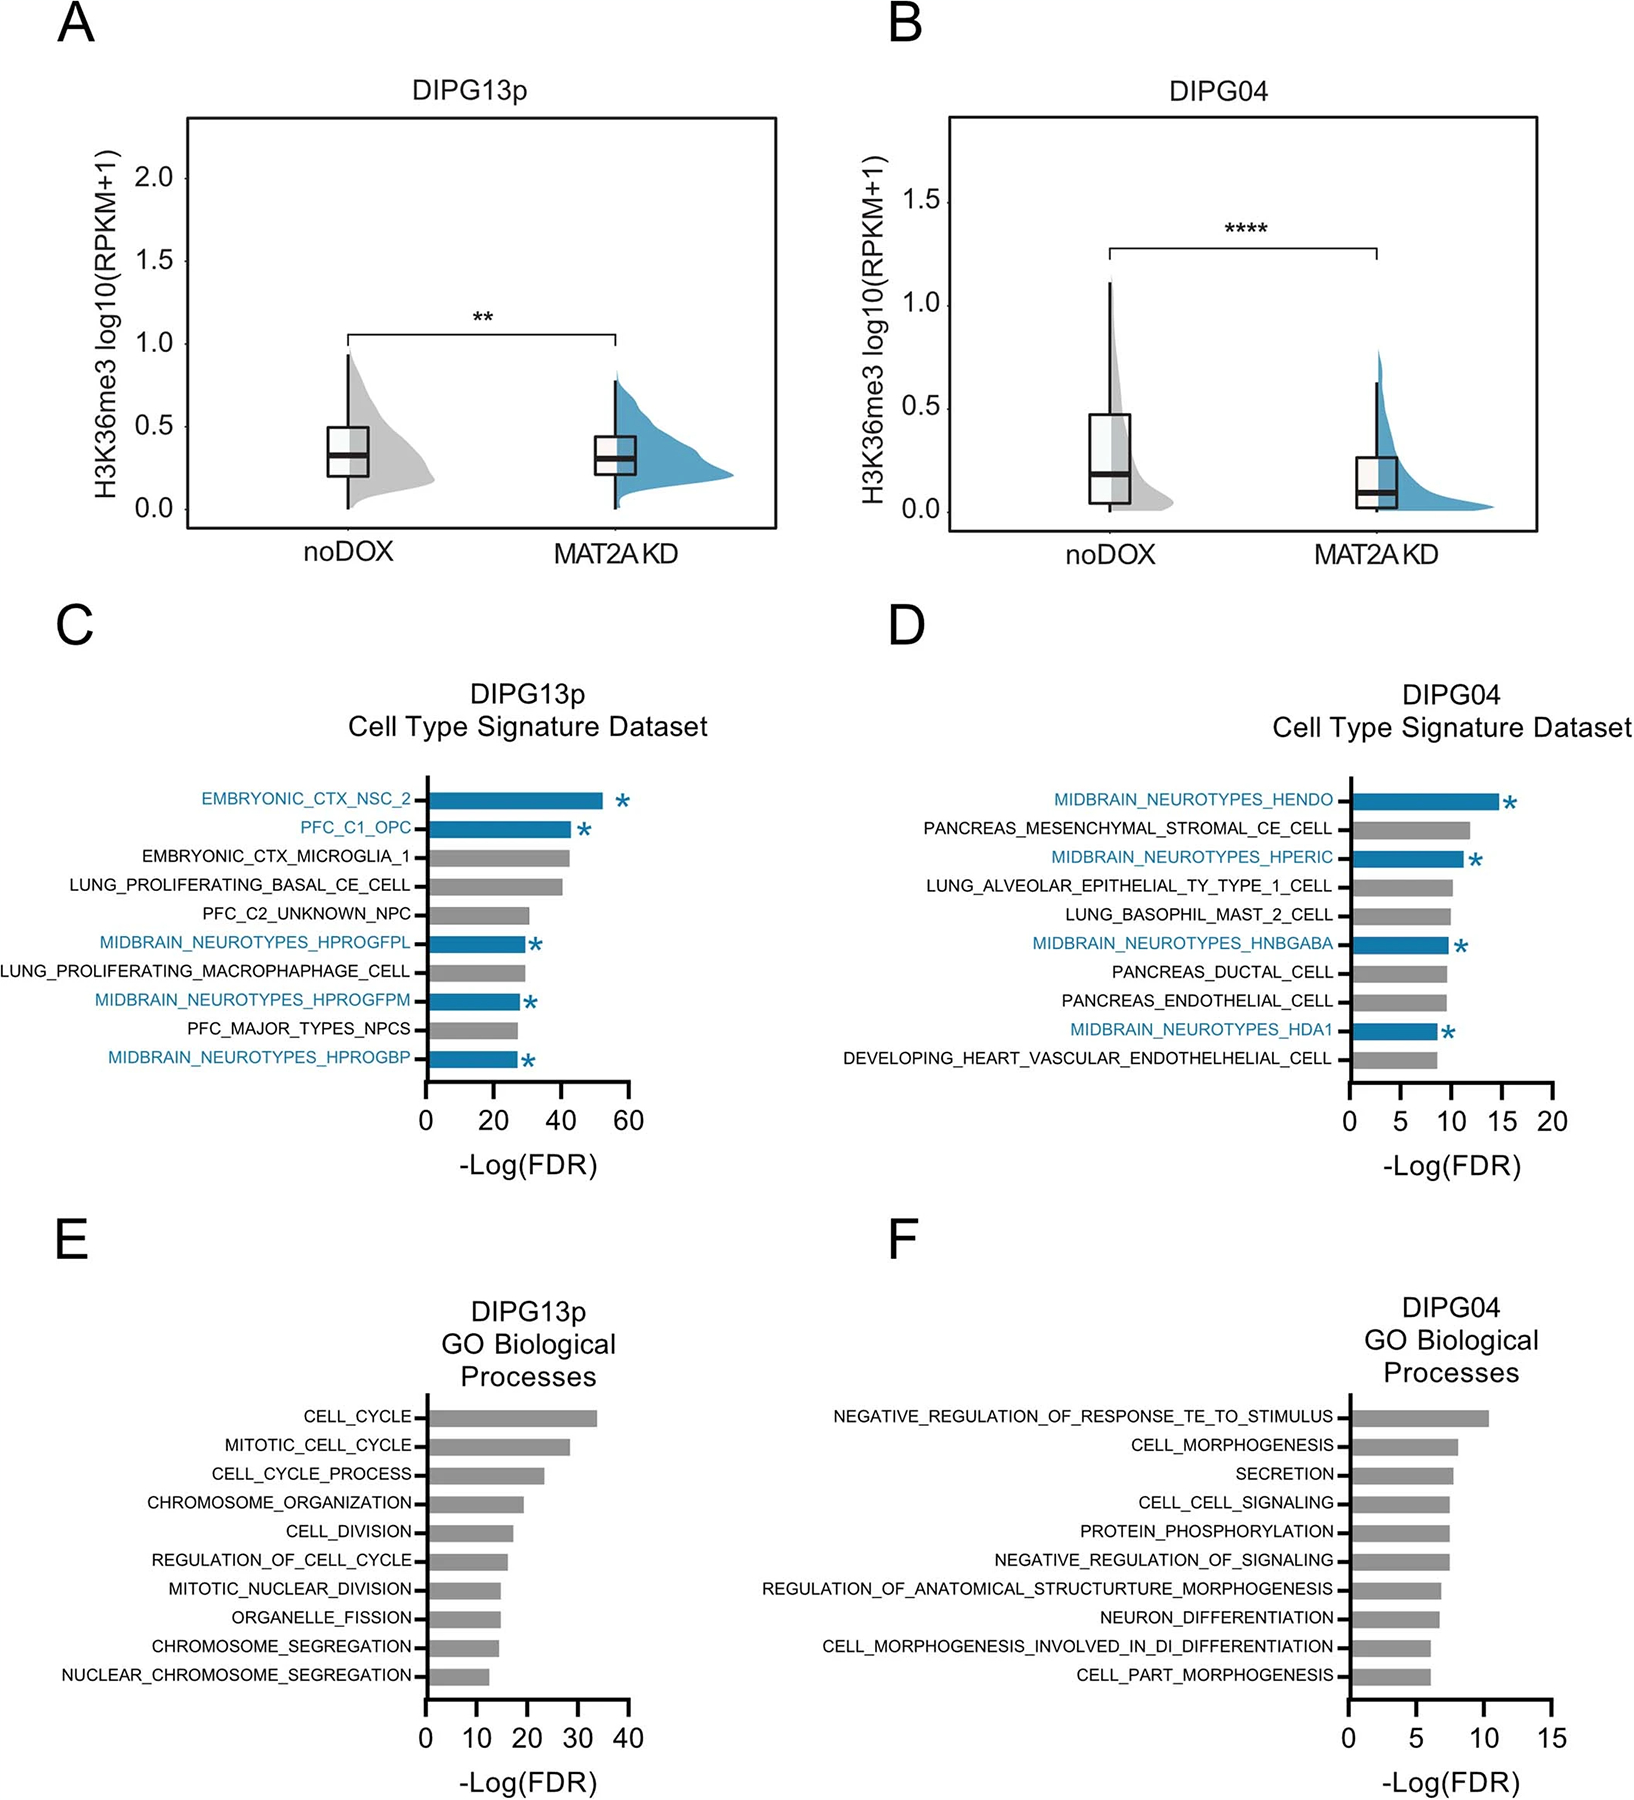
A. Plot Showing a decrease in H3K36me3 signal with MAT2A KD in DIPG13p cells. Statistical analysis was performed on 1 Mb bins comparing a single DIPG13p sample with Mat2a KD vs control (no doxycycline) using a two-sided Wilcoxon test, **p=0.0013, the center line denotes the median and the lower and upper ends of the box denote the 25th and 75th percentiles respectively. The whiskers indicate the maximum and the minimum values of the data distribution. B. Plot Showing a decrease in H3K36me3 signal with MAT2A KD in DIPG04 cells. Statistical analysis was performed on 1 Mb bins comparing a single DIPG04 sample with Mat2a KD vs control (no doxycycline) using a two-sided Wilcoxon test, ****p<2.22e-16., the center line denotes the median and the lower and upper ends of the box denote the 25th and 75th percentiles respectively. The whiskers indicate the maximum and the minimum values of the data distribution. C, D. GSEA analysis using Cell Type Signature Datasets in DIPG13p (C) and DIPG04 (D) with genes which are significantly differential in both RNA-seq and ChIP datasets after MAT2A KD. E, F. GSEA analysis using GO Biological Processes Datasets in DIPG13p (E) and DIPG04 (F) with genes which are significantly differential in both RNA-seq and ChIP datasets after MAT2A KD.
Extended Data Fig. 10 |. Methionine Restriction induced viability defect and total H3K36me3 loss can be rescued with SAM repletion in DMG cells.
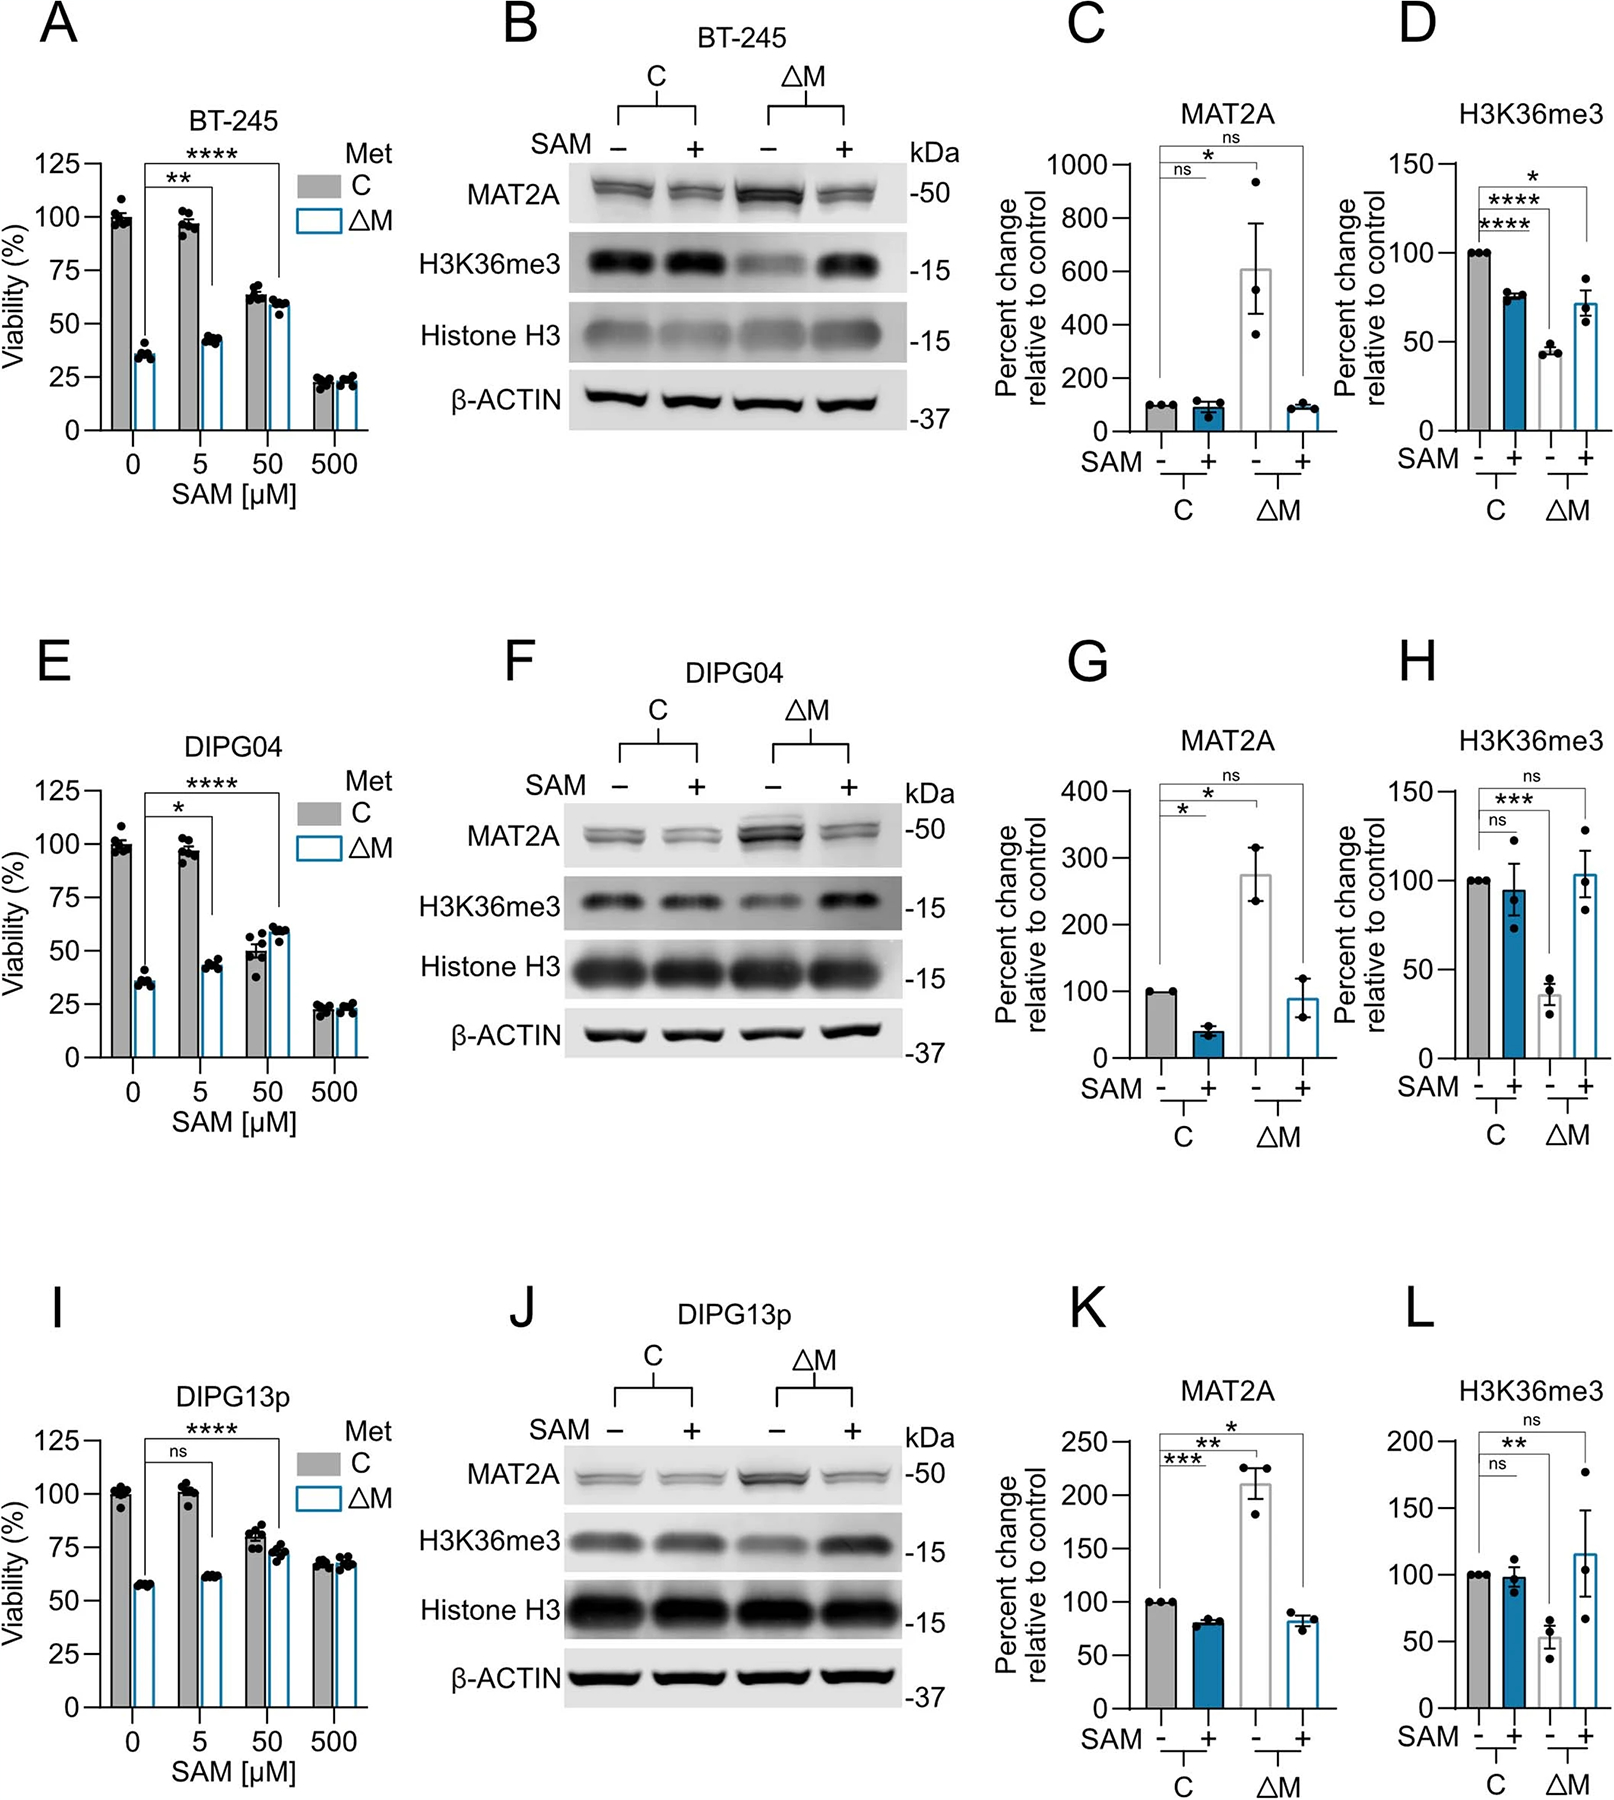
A. Percent viable cell count of BT-245 cells grown in media with 10% of normal methionine levels relative to control (100%) and supplemented with escalating concentrations of SAM. Adjusted P-values as follows: (10%Met 0 μMSAM vs. 10%Met 5 μM SAM **p=0.0042), and (10%Met 0 μMSAM vs. 10%Met 50 μM SAM ****p<0.0001). B. Quantitative western blotting of MAT2A, H3K36me3, and histone H3 in BT-245 cells comparing 10% methionine media with 100% supplemented with 500 μM of SAM. C, D. Quantification of MAT2A and H3K36me3 using Li-Cor fluorescent system for BT-245 cells comparing. 10% methionine media with 100% supplemented with 500uM of SAM. Biological replicate of n=3, samples were repeatedly measured 3 times. ((C) (100%Met vs. 100%+SAM p=0.7178), (100%Met vs. 10%Met *p=0.0394), and (100%Met vs. 10%Met+SAM p=0.3989). ((D) (100%Met vs. 100%+SAM ****p<0.0001), (100%Met vs. 10%Met ****p<0.0001), and (100%Met vs. 10%Met+SAM *p=0.0171). E. Percent viable cell count of DIPG04 cells grown in media with 10% of normal methionine levels relative to control (100%) and supplemented with escalating concentrations of SAM. Adjusted P-values as follows: (10%Met 0 μMSAM vs. 10%Met 5 μM SAM *p=0.0141), and (10%Met 0 μMSAM vs. 10%Met 50 μM SAM ****p<0.0001). F. Quantitative western blotting of MAT2A, H3K36me3, and histone H3 in DIPG04 cells comparing 10% methionine media with 100% supplemented with 500 μM of SAM. G, H. Quantification of MAT2A and H3K36me3 using Li-Cor fluorescent system for DIPG04 cells comparing. 10% methionine media with 100% supplemented with 500uM of SAM. ***p<0.0001 Biological replicate of n=2, samples were repeatedly measured 3 times. ((G) (100%Met vs. 100%+SAM *p=0.0135), (100%Met vs. 10%Met *p=0.0479), and (100%Met vs. 10%Met+SAM p=0.7667). ((H) (100%Met vs. 100%+SAM p=0.7451), (100%Met vs. 10%Met ***p=0.0004), and (100%Met vs. 10%Met+SAM p=0.7897). I. Percent viable cell count of DIPG13P cells grown in media with 10% of normal methionine levels relative to control (100%) and supplemented with escalating concentrations of SAM. Adjusted P-values as follows: (10%Met 0 μMSAM vs. 10%Met 5 μM SAM p=0.1167), and (10%Met 0 μMSAM vs. 10%Met 50 μM SAM ****p<0.0001). J. Quantitative western blotting of MAT2A, H3K36me3 and histone H3 in DIPG13p cells comparing 10% methionine media with 100% supplemented with 500 μM of SAM. K, L. Quantification of MAT2A and H3K36me3 using Li-Cor fluorescent system for DIPG13p cells comparing 10% methionine media with 100% supplemented with 500 μM of SAM. ***p<0.0001 Biological replicate of n=3, samples were repeatedly measured 3 times. ((K) (100%Met vs. 100%+SAM ***p=0.0008), (100%Met vs. 10%Met **p=0.0015), and (100%Met vs. 10%Met+SAM *p=0.0242). ((L) (100%Met vs. 100%+SAM p=0.8428), (100%Met vs. 10%Met **p=0.0057), and (100%Met vs. 10%Met+SAM p=0.6469). ((A, E, I) Experiments performed were in biological triplicates. Statistical analysis performed as a one-way ANOVA followed by Šídák’s multiple comparisons test. Data displayed as mean ± s.e.m.). ((C-D, G-H,K-L) Statistical analysis performed as a two-tailed, unpaired T-test. Data displayed as mean ± s.e.m.).
Supplementary Material
Acknowledgements
This work was supported by National Institutes of Health grant award to S.A. (R01NS115831), Michael Mosier Defeat DIPG Foundation and V-Foundation (in honor of Connor’s Cure). S.C.M. is funded by a National Institutes of Health grant (R01NS116361), ALSF A award, The Pediatric Brain Tumor Foundation, Michael Mosier Defeat DIPG Foundation, Chad Tough Foundation, V Scholar Foundation, Cookies for Cancer Foundation, and ALSAC Foundation. M.E.H. was funded by the Joshua’s Wish Foundation. S.G.W. was funded by a National Institutes of Health grant (NIHS10OD023402). C.L.K. was funded by the Canadian Institutes of Health Research (CIHR) grant PJT-156086 and by a salary award from the Fonds de Recherche du Québec-Santé (FRQS).
Footnotes
Competing interests
The authors declare no competing interests.
Extended data is available for this paper at https://doi.org/10.1038/s43018-022-00348-3.
Supplementary information The online version contains supplementary material available at https://doi.org/10.1038/s43018-022-00348-3.
Data availability
All ChIP-Rx sequencing and RNA-sequencing data generated in this study have been deposited at NCBI Gene Expression Omnibus under accession codes GSE160006 and GSE160088. Source data for all figures has been provided as source data files.
Further information on research design is available in the Nature Research Reporting Summary linked to this article. The data that support the findings of this study are available from the corresponding author upon request. Source data are provided with this paper.
References
- 1.Louis DN et al. The 2021 WHO classification of tumors of the central nervous system: a summary. Neuro-oncology 10.1093/neuonc/noab106 (2021). [DOI] [PMC free article] [PubMed] [Google Scholar]
- 2.Hoffman LM et al. Clinical, radiologic, pathologic, and molecular characteristics of long-term survivors of diffuse intrinsic pontine glioma (DIPG): a collaborative report from the International and European Society for Pediatric Oncology DIPG registries. J. Clin. Oncol 36, 1963–1972 (2018). [DOI] [PMC free article] [PubMed] [Google Scholar]
- 3.Warren KE Diffuse intrinsic pontine glioma: poised for progress. Front. Oncol 2, 205 (2012). [DOI] [PMC free article] [PubMed] [Google Scholar]
- 4.Sturm D et al. Hotspot mutations in H3F3A and IDH1 define distinct epigenetic and biological subgroups of glioblastoma. Cancer Cell 22, 425–437 (2012). [DOI] [PubMed] [Google Scholar]
- 5.Ostrom QT et al. CBTRUS statistical report: primary brain and central nervous system tumors diagnosed in the United States in 2008–2012. Neuro-oncology 17, iv1–iv62 (2015). [DOI] [PMC free article] [PubMed] [Google Scholar]
- 6.Jones C et al. Pediatric high-grade glioma: biologically and clinically in need of new thinking. Neuro-oncology 19, 153–161 (2017). [DOI] [PMC free article] [PubMed] [Google Scholar]
- 7.Lewis PW et al. Inhibition of PRC2 activity by a gain-of-function H3 mutation found in pediatric glioblastoma. Science 340, 857–861 (2013). [DOI] [PMC free article] [PubMed] [Google Scholar]
- 8.Nagaraja S et al. Transcriptional dependencies in diffuse intrinsic pontine glioma. Cancer Cell 31, 635–652 (2017). [DOI] [PMC free article] [PubMed] [Google Scholar]
- 9.Silveira AB et al. H3.3 K27M depletion increases differentiation and extends latency of diffuse intrinsic pontine glioma growth in vivo. Acta neuropathologica 10.1007/s00401-019-01975-4 (2019). [DOI] [PMC free article] [PubMed] [Google Scholar]
- 10.Vinci M et al. Functional diversity and cooperativity between subclonal populations of pediatric glioblastoma and diffuse intrinsic pontine glioma cells. Nat. Med 10.1038/s41591-018-0086-7 (2018). [DOI] [PMC free article] [PubMed] [Google Scholar]
- 11.Koncar RF et al. Identification of novel RAS signaling therapeutic vulnerabilities in diffuse intrinsic pontine gliomas. Cancer Res. 79, 4026–4041 (2019). [DOI] [PubMed] [Google Scholar]
- 12.Larson JD et al. Histone H3.3 K27M accelerates spontaneous brainstem glioma and drives restricted changes in bivalent gene expression. Cancer Cell 35, 140–155 (2019). [DOI] [PMC free article] [PubMed] [Google Scholar]
- 13.Harutyunyan AS et al. H3K27M induces defective chromatin spread of PRC2-mediated repressive H3K27me2/me3 and is essential for glioma tumorigenesis. Nat. Commun 10, 1262 (2019). [DOI] [PMC free article] [PubMed] [Google Scholar]
- 14.Krug B et al. Pervasive H3K27 acetylation leads to ERV expression and a therapeutic vulnerability in H3K27M gliomas. Cancer Cell 35, 782–797 (2019). [DOI] [PMC free article] [PubMed] [Google Scholar]
- 15.Michealraj KA et al. Metabolic regulation of the epigenome drives lethal infantile ependymoma. Cell 10.1016/j.cell.2020.04.047 (2020). [DOI] [PMC free article] [PubMed] [Google Scholar]
- 16.Kaelin WG Jr. & McKnight SL Influence of metabolism on epigenetics and disease. Cell 153, 56–69 (2013). [DOI] [PMC free article] [PubMed] [Google Scholar]
- 17.Dawson MA & Kouzarides T Cancer epigenetics: from mechanism to therapy. Cell 150, 12–27 (2012). [DOI] [PubMed] [Google Scholar]
- 18.Lu C & Thompson CB Metabolic regulation of epigenetics. Cell Metab. 16, 9–17 (2012). [DOI] [PMC free article] [PubMed] [Google Scholar]
- 19.Noushmehr H et al. Identification of a CpG island methylator phenotype that defines a distinct subgroup of glioma. Cancer Cell 17, 510–522 (2010). [DOI] [PMC free article] [PubMed] [Google Scholar]
- 20.Vander Heiden MG & DeBerardinis RJ Understanding the intersections between metabolism and cancer biology. Cell 168, 657–669 (2017). [DOI] [PMC free article] [PubMed] [Google Scholar]
- 21.Gaude E & Frezza C Tissue-specific and convergent metabolic transformation of cancer correlates with metastatic potential and patient survival. Nat. Commun 7, 13041 (2016). [DOI] [PMC free article] [PubMed] [Google Scholar]
- 22.Filbin MG et al. Developmental and oncogenic programs in H3K27M gliomas dissected by single-cell RNA-seq. Science 360, 331–335 (2018). [DOI] [PMC free article] [PubMed] [Google Scholar]
- 23.Monje M et al. Hedgehog-responsive candidate cell of origin for diffuse intrinsic pontine glioma. PNAS 108, 4453–4458 (2011). [DOI] [PMC free article] [PubMed] [Google Scholar]
- 24.Mackay A et al. Integrated molecular meta-analysis of 1,000 pediatric high-grade and diffuse intrinsic pontine glioma. Cancer Cell 32, 520–537 (2017). [DOI] [PMC free article] [PubMed] [Google Scholar]
- 25.Kondo S et al. Simultaneous on/off regulation of transgenes located on a mammalian chromosome with Cre-expressing adenovirus and a mutant loxP. Nucleic Acids Res. 31, e76 (2003). [DOI] [PMC free article] [PubMed] [Google Scholar]
- 26.Ahn JI et al. Comprehensive transcriptome analysis of differentiation of embryonic stem cells into midbrain and hindbrain neurons. Dev. Biol 265, 491–501 (2004). [DOI] [PubMed] [Google Scholar]
- 27.Gao X et al. Dietary methionine influences therapy in mouse cancer models and alters human metabolism. Nature 572, 397–401 (2019). [DOI] [PMC free article] [PubMed] [Google Scholar]
- 28.Sanderson SM, Gao X, Dai Z & Locasale JW Methionine metabolism in health and cancer: a nexus of diet and precision medicine. Nat. Rev. Cancer 19, 625–637 (2019). [DOI] [PubMed] [Google Scholar]
- 29.Mavrakis KJ et al. Disordered methionine metabolism in MTAP/CDKN2A-deleted cancers leads to dependence on PRMT5. Science 351, 1208–1213 (2016). [DOI] [PubMed] [Google Scholar]
- 30.Mohammad F et al. EZH2 is a potential therapeutic target for H3K27M-mutant pediatric gliomas. Nat. Med 23, 483–492 (2017). [DOI] [PubMed] [Google Scholar]
- 31.Borrego SL et al. Metabolic changes associated with methionine stress sensitivity in MDA-MB-468 breast cancer cells. Cancer Metab. 4, 9 (2016). [DOI] [PMC free article] [PubMed] [Google Scholar]
- 32.Chen Z et al. Mice deficient in methylenetetrahydrofolate reductase exhibit hyperhomocysteinemia and decreased methylation capacity, with neuropathology and aortic lipid deposition. Hum. Mol. Genet 10, 433–443 (2001). [DOI] [PubMed] [Google Scholar]
- 33.Pendleton KE et al. The U6 snRNA m(6)A methyltransferase METTL16 regulates SAM synthetase intron retention. Cell 169, 824–835 (2017). [DOI] [PMC free article] [PubMed] [Google Scholar]
- 34.Ohnuma M et al. N1-aminopropylagmatine, a new polyamine produced as a key intermediate in polyamine biosynthesis of an extreme thermophile, Thermus thermophilus. J. Biol. Chem 280, 30073–30082 (2005). [DOI] [PubMed] [Google Scholar]
- 35.Regenass U et al. CGP 48664, a new S-adenosylmethionine decarboxylase inhibitor with broad spectrum antiproliferative and antitumor activity. Cancer Res. 54, 3210–3217 (1994). [PubMed] [Google Scholar]
- 36.Orlando DA et al. Quantitative ChIP-seq normalization reveals global modulation of the epigenome. Cell Rep. 9, 1163–1170 (2014). [DOI] [PubMed] [Google Scholar]
- 37.Andersson R et al. An atlas of active enhancers across human cell types and tissues. Nature 507, 455–461 (2014). [DOI] [PMC free article] [PubMed] [Google Scholar]
- 38.Jessa S et al. Stalled developmental programs at the root of pediatric brain tumors. Nat. Genet 51, 1702–1713 (2019). [DOI] [PMC free article] [PubMed] [Google Scholar]
- 39.Pathania M et al. H3.3(K27M) cooperates with Trp53 loss and PDGFRA gain in mouse embryonic neural progenitor cells to induce invasive high-grade gliomas. Cancer Cell 32, 684–700 (2017). [DOI] [PMC free article] [PubMed] [Google Scholar]
- 40.Schnütgen F et al. A directional strategy for monitoring Cre-mediated recombination at the cellular level in the mouse. Nat. Biotechnol 21, 562–565 (2003). [DOI] [PubMed] [Google Scholar]
- 41.Orentreich N, Matias JR, DeFelice A & Zimmerman JA Low methionine ingestion by rats extends life span. J. Nutr 123, 269–274 (1993). [DOI] [PubMed] [Google Scholar]
- 42.Lee BC et al. Methionine restriction extends lifespan of Drosophila melanogaster under conditions of low amino-acid status. Nat. Commun 5, 3592 (2014). [DOI] [PMC free article] [PubMed] [Google Scholar]
- 43.Ser Z et al. Targeting one carbon metabolism with an antimetabolite disrupts pyrimidine homeostasis and induces nucleotide overflow. Cell Rep. 15, 2367–2376 (2016). [DOI] [PMC free article] [PubMed] [Google Scholar]
- 44.Schmidt JA et al. Plasma concentrations and intakes of amino acids in male meat-eaters, fish-eaters, vegetarians and vegans: a cross-sectional analysis in the EPIC-Oxford cohort. Eur. J. Clin. Nutr 70, 306–312 (2016). [DOI] [PMC free article] [PubMed] [Google Scholar]
- 45.Hu J & Cheung NK Methionine depletion with recombinant methioninase: in vitro and in vivo efficacy against neuroblastoma and its synergism with chemotherapeutic drugs. Int. J. Cancer 124, 1700–1706 (2009). [DOI] [PMC free article] [PubMed] [Google Scholar]
- 46.Marjon K et al. MTAP deletions in cancer create vulnerability to targeting of the MAT2A/PRMT5/RIOK1 axis. Cell Rep. 15, 574–587 (2016). [DOI] [PubMed] [Google Scholar]
- 47.Wang Z et al. Methionine is a metabolic dependency of tumor-initiating cells. Nat. Med 25, 825–837 (2019). [DOI] [PubMed] [Google Scholar]
- 48.Quinlan CL et al. Targeting S-adenosylmethionine biosynthesis with a novel allosteric inhibitor of Mat2A. Nat. Chem. Biol 13, 785–792 (2017). [DOI] [PubMed] [Google Scholar]
- 49.Strekalova E et al. S-adenosylmethionine biosynthesis is a targetable metabolic vulnerability of cancer stem cells. Breast Cancer Res. Treat 175, 39–50 (2019). [DOI] [PMC free article] [PubMed] [Google Scholar]
- 50.Mahmood N et al. Methyl donor S-adenosylmethionine (SAM) supplementation attenuates breast cancer growth, invasion, and metastasis in vivo; therapeutic and chemopreventive applications. Oncotarget 9, 5169–5183 (2018). [DOI] [PMC free article] [PubMed] [Google Scholar]
- 51.Hashizume R et al. Pharmacologic inhibition of histone demethylation as a therapy for pediatric brainstem glioma. Nat. Med 20, 1394–1396 (2014). [DOI] [PMC free article] [PubMed] [Google Scholar]
- 52.Bender S et al. Reduced H3K27me3 and DNA hypomethylation are major drivers of gene expression in K27M mutant pediatric high-grade gliomas. Cancer Cell 24, 660–672 (2013). [DOI] [PubMed] [Google Scholar]
- 53.Zhang D et al. AMD1 is essential for ESC self-renewal and is translationally down-regulated on differentiation to neural precursor cells. Genes Dev. 26, 461–473 (2012). [DOI] [PMC free article] [PubMed] [Google Scholar]
- 54.Khan A et al. Dual targeting of polyamine synthesis and uptake in diffuse intrinsic pontine gliomas. Nat. Commun 12, 971 (2021). [DOI] [PMC free article] [PubMed] [Google Scholar]
- 55.Guiraud SP et al. High-throughput and simultaneous quantitative analysis of homocysteine-methionine cycle metabolites and co-factors in blood plasma and cerebrospinal fluid by isotope dilution LC-MS/MS. Anal. Bioanal. Chem 409, 295–305 (2017). [DOI] [PMC free article] [PubMed] [Google Scholar]
- 56.Chantalat S et al. Histone H3 trimethylation at lysine 36 is associated with constitutive and facultative heterochromatin. Genome Res. 21, 1426–1437 (2011). [DOI] [PMC free article] [PubMed] [Google Scholar]
- 57.Chen CT, Gottlieb DI & Cohen BA Ultraconserved elements in the Olig2 promoter. PLoS ONE 3, e3946 (2008). [DOI] [PMC free article] [PubMed] [Google Scholar]
- 58.Grasso CS et al. Functionally defined therapeutic targets in diffuse intrinsic pontine glioma. Nat. Med 21, 555–559 (2015). [DOI] [PMC free article] [PubMed] [Google Scholar]
- 59.Langmead B, Trapnell C, Pop M & Salzberg SL Ultrafast and memory-efficient alignment of short DNA sequences to the human genome. Genome Biol. 10, R25 (2009). [DOI] [PMC free article] [PubMed] [Google Scholar]
- 60.Anders S & Huber W Differential expression analysis for sequence count data. Genome Biol. 11, R106 (2010). [DOI] [PMC free article] [PubMed] [Google Scholar]
- 61.Love MI, Huber W & Anders S Moderated estimation of fold change and dispersion for RNA-seq data with DESeq2. Genome Biol. 15, 550 (2014). [DOI] [PMC free article] [PubMed] [Google Scholar]
- 62.Kim SY & Volsky DJ PAGE: parametric analysis of gene set enrichment. BMC Bioinf. 6, 144 (2005). [DOI] [PMC free article] [PubMed] [Google Scholar]
- 63.Raudvere U et al. g:Profiler: a web server for functional enrichment analysis and conversions of gene lists (2019 update). Nucleic Acids Res. 47, W191–W198 (2019). [DOI] [PMC free article] [PubMed] [Google Scholar]
- 64.Langmead B & Salzberg SL Fast gapped-read alignment with Bowtie 2. Nat. Methods 9, 357–359 (2012). [DOI] [PMC free article] [PubMed] [Google Scholar]
- 65.Stovner EB & Sætrom P epic2 efficiently finds diffuse domains in ChIP-seq data. Bioinformatics 35, 4392–4393 (2019). [DOI] [PubMed] [Google Scholar]
- 66.Zang C et al. A clustering approach for identification of enriched domains from histone modification ChIP-seq data. Bioinformatics 25, 1952–1958 (2009). [DOI] [PMC free article] [PubMed] [Google Scholar]
- 67.Yu G, Wang LG & He QY ChIPseeker: an R/Bioconductor package for ChIP peak annotation, comparison and visualization. Bioinformatics 31, 2382–2383 (2015). [DOI] [PubMed] [Google Scholar]
- 68.Brennan CW et al. The somatic genomic landscape of glioblastoma. Cell 155, 462–477 (2013). [DOI] [PMC free article] [PubMed] [Google Scholar]
- 69.Cerami E et al. The cBio cancer genomics portal: an open platform for exploring multidimensional cancer genomics data. Cancer Discov. 2, 401–404 (2012). [DOI] [PMC free article] [PubMed] [Google Scholar]
- 70.Gao J et al. Integrative analysis of complex cancer genomics and clinical profiles using the cBioPortal. Science Signal. 6, pl1 (2013). [DOI] [PMC free article] [PubMed] [Google Scholar]
Associated Data
This section collects any data citations, data availability statements, or supplementary materials included in this article.
Supplementary Materials
Data Availability Statement
All ChIP-Rx sequencing and RNA-sequencing data generated in this study have been deposited at NCBI Gene Expression Omnibus under accession codes GSE160006 and GSE160088. Source data for all figures has been provided as source data files.
Further information on research design is available in the Nature Research Reporting Summary linked to this article. The data that support the findings of this study are available from the corresponding author upon request. Source data are provided with this paper.


