

Abstract
Proteolysis-targeting chimeras (PROTACs) are a promising new class of drugs that selectively degrade cellular proteins of interest. PROTACs that target oncogene products are avidly being explored for cancer therapies, and several are currently in clinical trials. Drug resistance is a substantial challenge in clinical oncology, and resistance to PROTACs has been reported in several cancer cell models. Here, using proteomic analysis, we discovered intrinsic and acquired resistance mechanisms to PROTACs in cancer cell lines mediated by greater abundance or production of the drug efflux pump MDR1. PROTAC-resistant cells were re-sensitized to PROTACs by genetic ablation of ABCB1 (which encodes MDR1) or by co-administration of MDR1 inhibitors. In MDR1-overexpressing colorectal cancer cells, degraders targeting either the kinases MEK1/2 or the oncogenic mutant GTPase KRASG12C synergized with the dual epidermal growth factor receptor (EGFR/ErbB)/MDR1 inhibitor lapatinib. Moreover, compared to single-agent therapies, combining MEK1/2 degraders with lapatinib improved growth inhibition of MDR1-overexpressing KRAS-mutant colorectal cancer xenografts in mice. Together, our findings suggest that concurrent blockade of MDR1 will likely be required with PROTACs to achieve durable protein degradation and therapeutic response in cancer.
INTRODUCTION
Proteolysis-targeting chimeras (PROTACs) have emerged as a revolutionary new class of drugs that utilize cancer cells’ own protein-destruction machinery to selectively degrade essential tumor drivers (1). PROTACs are small molecules with two functional ends, wherein one end binds to the protein of interest while the other binds to an E3 ubiquitin ligase (2, 3), bringing the ubiquitin ligase to the target protein, leading to its ubiquitination and subsequent degradation by the proteasome. PROTACs have enabled the development of drugs against previously “undruggable” targets and require neither catalytic activity nor high-affinity target binding to achieve target degradation (4). Additionally, low doses of PROTACs can be highly effective at inducing degradation, which can reduce off-target toxicity associated with high-dosing of traditional inhibitors (3). PROTACs have been developed for a variety of cancer targets, including oncogenic kinases (5), epigenetic proteins (6) and, recently, KRASG12C proteins (7). PROTACs targeting the androgen receptor or estrogen receptor are avidly being evaluated in clinical trials for prostate cancer (NCT03888612) or breast cancer (NCT04072952), respectively.
However, PROTACs may not escape the overwhelming challenge of drug resistance that befalls so many cancer therapies (8). Resistance to PROTACs in cultured cells has been shown to involve genomic alterations in their E3 ligase targets, such as decreased expression of Cereblon (CRBN), Von Hippel Lindau (VHL), or Cullin2 (CUL2) (9–11). Upregulation of the drug efflux pump encoded by ABCB1—MDR1 (multidrug resistance 1), a member of the superfamily of ATP-binding cassette (ABC) transporters—has been shown to convey drug resistance to many anti-cancer drugs including chemotherapy agents, kinase inhibitors, and other targeted agents (12). Recently, PROTACs were shown to be substrates for MDR1 (10, 13), suggesting that drug efflux represents a potential limitation for degrader therapies. Here, using degraders (PROTACs) against bromodomain and extraterminal (BET) bromodomain proteins and cyclin-dependent kinase 9 (CDK9) as a proof-of-concept, we applied proteomics to define acquired resistance mechanisms to PROTAC therapies in cancer cells following chronic exposure. Our study reveals a role for the drug efflux pump MDR1 in both acquired and intrinsic resistance to protein degraders in cancer cells and supports combination therapies involving PROTACs and MDR1 inhibitors to achieve durable protein degradation and therapeutic responses.
RESULTS
Proteomics characterization of degrader-resistant cells reveals common upregulation of the multidrug resistance protein MDR1
To explore resistance mechanisms to PROTAC therapies, we chronically exposed the ovarian cancer cell line A1847 to BET bromodomain (BBD) or CDK9 degraders and carried out single-run proteomics using liquid chromatography with tandem mass spectrometry (LC-MS/MS) (14) comparing parental and degrader-resistant cells (Fig. 1A). Changes in protein abundance following chronic degrader treatment were measured using label-free quantitation (LFQ) (15). We generated degrader-resistant A1847 cells through chronic exposure to increasing doses of BBD degraders dBET6 (CRBN) (16) or MZ1 (VHL) (17), or CDK9 degrader Thal SNS 032 (CRBN) (18). The chronically exposed A1847 cells were more resistant to BBD or CDK9 degraders than treatment-naïve (meaning, parental) cells, whereby they showed a rightward shift in dose-response cell viability curves (Fig. 1, B and C, and fig. S1A). In contrast to parental cells, treatment of chronically exposed cells with increasing doses of BET protein degraders was insufficient to degrade BRD2, BRD3 or BRD4 and reduce the levels of BET protein target FOSL1 to the extent observed in parental cells (Fig. 1D and fig. S1B). Analysis of degradation efficiency revealed that dBET6-R cells required significantly higher concentrations of dBET6 to achieve DC50 (the concentration at which 50% of the target protein is degraded) for BRD2, BRD3, and BRD4 compared to parental cells (Fig. 1E and fig. S1, C and D). Similarly, treatment of A1847 cells with increasing doses of CDK9-degrader Thal SNS 032 did not reduce CDK9 protein levels or CDK9-mediated phosphorylation of RNA polymerase S2 to the degree observed in parental cells (Fig. 1F). Analysis of degrader activity showed that Thal-R cells required micromolar concentrations of Thal SNS 032 to reach DC50 for CDK9, compared to low nanomolar concentrations in parental cells (Fig. 1G and fig. S1, E and F). Together, these findings demonstrated continuous exposure of A1847 cells to BBD or CDK9 degraders reduced target degradation efficiency, thus requiring increased concentrations of PROTACs to achieve DC50 observed in parental cells.
Figure 1. Proteomics characterization of degrader-resistant cancer cell lines.

(A) Workflow for identifying protein targets upregulated in degrader-resistant cancer cells. Single-run proteome analysis was performed, and changes in protein levels amongst parent and resistant cells were determined by label-free quantitation. (B and C) Cell viability assessed by CellTiter-Glo in parental and dBET6- or Thal SNS 032-resistant A1847 cells treated with increasing doses of dBET6 (B) or Thal SNS 032 (C) for 5 days. Data were analyzed as % of DMSO control, presented as means ± SD of 3 independent assays. GI50 values were determined using PRISM software. (D to G) Immunoblotting for degrader targets and downstream signaling in parental A1847 cells and their derivative dBET6-R or Thal-R cells treated with increasing doses of dBET6 or Thal SNS 032 for 4 hours. The dBET6-R and Thal-R cells were continuously cultured in 500 nM of the PROTAC. Blots are representative, and densitometric analysis are means ± SD from 3 blots, each normalized to loading control, GAPDH. DC50 values, quantitating either (E) the dose of dBET6 that reduces BRD2, BRD3 or BRD4 or (G) the dose of Thal SNS 032 that reduces CDK9 protein levels 50% of the DMSO control treatment, were determined with Prism software. (H to K) Volcano plot of proteins with increased or reduced abundance in dBET6-R (H) or Thal-R (I) A1847 cells relative to parental cells. Differences in protein log2 LFQ intensities amongst degrader-resistant and parental cells were determined by paired t-test Permutation-based adjusted P values at FDR of <0.05 using Perseus software. The top 10 upregulated proteins in each are shown in (J) and (K), respectively. (L and M) ABCB1 log2 LFQ values in dBET6-R cells from (H) and Thal-R cells from (I) compared to that in parental A1847 cells. Data are presented as means ± from 3 independent assays. By paired t-test Permutation-based adjusted P values at FDR of <0.05 using Perseus software, ***P ≤0.001. (N) Cell viability assessed by CellTiter-Glo in parental and MZ1-resistant SUM159 cells treated with increasing doses of MZ1 for 5 days. Data were analyzed as % of DMSO control, presented as means of 3 independent assays. GI50 were determined using PRISM software. (O and P) Immunoblotting for degrader targets and downstream signaling in parental or MZ1-R SUM159 cells treated with increasing doses of MZ1 for 24 hours. The MZ1-R cells were continuously cultured in 500 nM MZ1. Blots are representative, and densitometric analysis are means ± SD from 3 blots, each normalized to loading control, GAPDH. DC50 values were determined in Prism software. (Q and R) Top 10 upregulated proteins (Q) and ABCB1 log2 LFQ values (R) in MZ1-R cells relative to parental SUM159 cells. ***P ≤0.001 as described in (L and M). Related data are in fig. S1 and data file S1.
Volcano plot analysis of changes in protein abundance comparing parent and degrader-resistant cells showed significant remodeling of the proteome upon continuous exposure to BET bromodomain or CDK9 degraders (Fig. 1, H and I, fig. S1G, and data file S1). The overall proteome response among dBET6-R and Thal-R was similar, with a Pearson correlation of R=0.775 (fig. S1H), whereas the changes in protein abundance amid the BBD PROTACs dBET6-R and MZ1-R were less similar, with a Pearson correlation of R=0.344 (fig. S1I). These differences could be attributed to the distinct recruitment ligases used by MZ1 (VHL) or dBET6 (CRBN), as well as the established differences in selectivity for the BBDs, where MZ1 preferentially degrades BRD4 (17), whereas dBET6 degrades BRD2, BRD3 and BRD4, equivalently (16).
A comparison of the top 10 upregulated proteins in dBET6, MZ1 and Thal SNS 032 resistant cells relative to parental cells, revealed that 2 proteins were commonly induced: the ATP-dependent drug efflux pump, ATP Binding Cassette Subfamily B Member 1 (ABCB1) (19), and the RNA binding factor Insulin-Like Growth Factor 2 mRNA-Binding Protein 3 (IGF2BP3) (20) (Fig. 1, J and K, and fig. S1J). Notably, ubiquitin ligases were not amongst the top upregulated proteins in dBET6-R or Thal-R cells, ruling out a compensatory ligase response (data file S1). Of particular interest, ABCB1 (MDR1) is a member of the superfamily of ATP-binding cassette (ABC) transporters involved in translocation of drugs and phospholipids across the membrane and has established functions in drug resistance (12). MDR1 protein levels were upregulated ~3.5-fold in dBET6-R, ~5–5-fold in MZ1-R and ~2.5-fold in Thal-R cells relative to parental cell lines by LFQ analysis (Fig. 1, L and M, and fig. S1K).
Similarly, we observed that chronic exposure of the breast cancer cell line SUM159 to MZ1 resulted in drug resistance, requiring higher concentrations of MZ1 to reduce cell viability and BBD protein levels than parental cells (Fig. 1, N and O). Moreover, analysis of degradation efficiency showed that MZ1-R cells required significantly higher concentrations of MZ1 to achieve DC50 for BRD2, BRD3 and BRD4 compared to parental cells (Fig. 1P and fig. S1, L and M). Proteomics analysis of MZ1- resistant SUM159 cells revealed that MDR1 was amongst the top 10 upregulated proteins, with an increase of ~4.5-fold in MZ1-R cells compared to parental cells (Fig. 1, Q and R, fig. S1N, and data file S1).
Gene amplification and/or hypomethylation of ABCB1 promotes drug efflux of degraders in A1847 cells chronically exposed to PROTACs
Elevated ABCB1 mRNA and protein levels were confirmed in degrader-resistant A1847 and SUM159 cells by reverse transcription-polymerase chain reaction (RT-PCR) (Fig. 2A and fig. S2A), immunoblot (Fig. 2B and fig. S2B) and immunofluorescence (Fig. 2, C to E), where MDR1 protein was detected at the membrane of degrader-resistant cells. Increased MDR1 drug efflux activity was detected in BET bromodomain or CDK9 degrader-resistant cells relative to parental cells using the Rhodamine 123 efflux assay (21) (Fig. 2F). To explore differences in intracellular levels of PROTACs among parental and degrader-resistant cells, we utilized a CRBN nano bioluminescence resonance energy transfer (NanoBRET) target engagement assay (22). In response to increasing doses of dBET6, dBET6-R cells exhibited reduced CRBN NanoBRET-engagement compared to parental cells, suggesting elevated MDR1 drug efflux activity in degrader-resistant cells limits PROTAC accumulation in cells (Fig. 2G).
Figure 2. Chronic Exposure to Degraders Induces MDR1 Expression and Drug Efflux Activity.
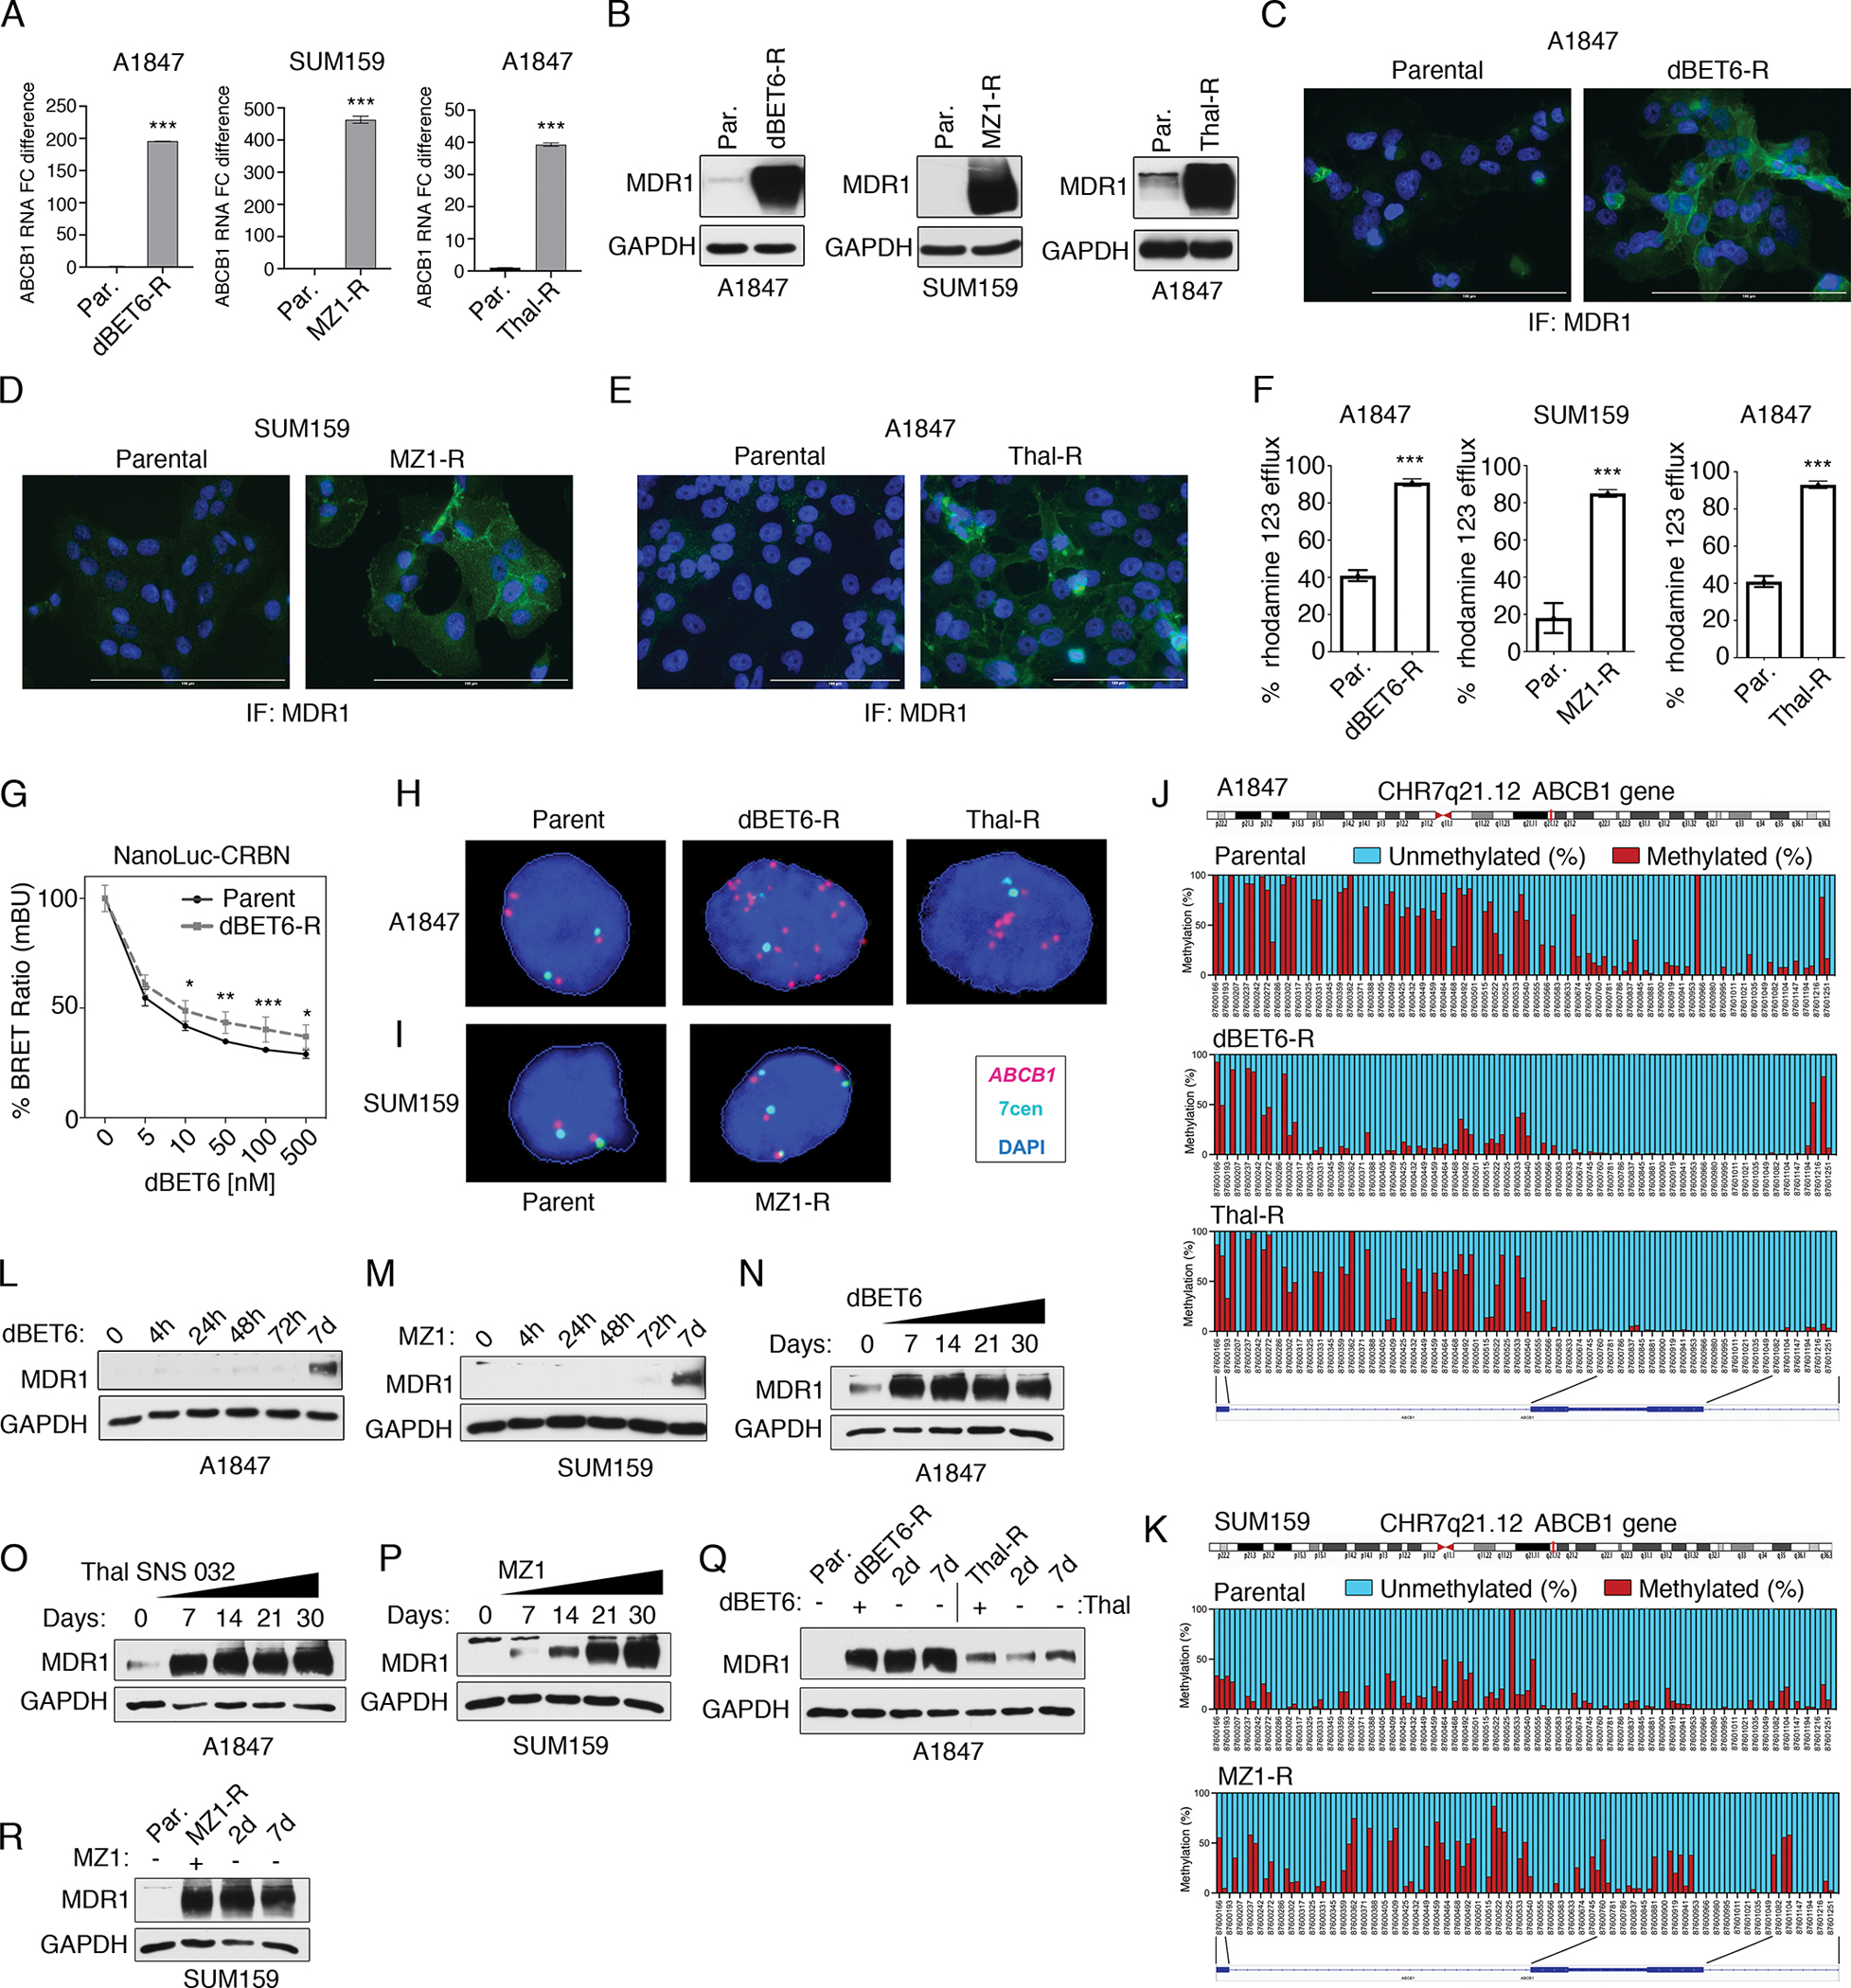
(A) ABCB1 mRNA levels in parental and degrader-resistant cell lines as determined by qRT-PCR. Data are means ± SD of 3 independent experiments. ***P ≤0.001 by Student’s t-test. (B) Immunoblot analysis of MDR1 protein levels in parental and degrader-resistant cell lines. Blots are representative 3 independent experiments. (C to E) Immunofluorescence (“IF”) microscopy of MDR1 protein levels in A1847 dBET6-R (C), SUM159 MZ1-R (D) and Thal-R A1847 cells (E) relative to parental cells. Nuclear staining by DAPI. Images are representative of 3 independent experiments. Scale bars, 100 μM. (F) Drug efflux activity in A1847 dBET6-R, SUM159 MZ1-R and Thal-R A1847 cells relative to parental cells (Par.) using Rhodamine 123 efflux assays. Bars are means ± SD of 3 independent experiments. ***P ≤0.001 by Student’s t-test. (G) Intracellular dBET6 levels in parental or dBET-R A1847 cells transfected with CRBN-sensor and treated with increasing concentrations of dBET6. Intracellular dBET6 levels measured using the CRBN NanoBRET target engagement assay. Data were analyzed as % of DMSO control, presented as means ± SD of 3 independent assays. *P ≤0.05. **P ≤0.01, ***P ≤0.001 by Student’s t-test. (H and I) FISH analysis of representative drug-sensitive parental and drug-resistant A1847 (H) and SUM159 (I) cells using ABCB1 and control XCE 7 centromere probes. Images of interphase nuclei were captured with a Metasystems Metafer microscope workstation, and the raw images were extracted and processed to depict ABCB1 signals in magenta, centromere 7 signals in cyan, and DAPI-stained nuclei in blue. (J and K) CpG methylation status of the ABCB1 downstream promoter (coordinates: chr7.87,600,166–87,601,336) by bisulfite amplicon sequencing in parent and degrader-resistant A1847 (J) and SUM159 (K) cells. Images depict averaged percentage of methylation for each region of the promoter, where methylation status is depicted by color: Red, methylated; blue, unmethylated. Schematic of the ABCB1 gene with the location of individual CpG sites is shown. Graphs are representative of 3 independent experiments. (L and M) Immunoblot analysis of MDR1 protein levels following short-term exposure [for hours (h) or days (d) as indicated] to BET protein degraders dBET6 or MZ1 (100 nM) in A1847 (L) and SUM159 (M) cells, respectively. Blots are representative of 3 independent experiments. (N to P) Immunoblot analysis of MDR1 protein levels in A1847 and SUM159 cells following long-term exposure (7 to 30 days) to BET protein degraders dBET6 (N), Thal SNS 032 (O), or MZ1 (P) each at 500 nM. Blots are representative of 3 independent experiments. (Q and R) Immunoblot analysis of MDR1 protein levels in degrader-resistant A1847 (Q) and SUM159 (R) cells following PROTAC removal for 2 or 7 days. Blots are representative of 3 independent experiments. Related data are in fig. S2 and data file S2.
Amplification of ABCB1 has been previously shown to occur in chemotherapy-resistant cells leading to increased MDR1 drug efflux activity (23). To determine if gene amplification contributed to increased MDR1 levels in degrader-resistant cells, we performed fluorescence in situ hybridization (FISH) analysis using ABCB1 probe (reddish-purple or fuchsia color), which localizes to the long arm of chromosome 7 at band 7q21.12 and the control XCE 7 centromere probe (cyan) (Fig. 2, H and I, and fig. S2C).
The parental A1847 cells consistently showed two pairs of ABCB1 and 7 centromere signals, as well as two extra ABCB1 signals. Degrader-resistant A1847 cells showed amplification of ABCB1, with a mean of ~12 ABCB1 signals/nucleus in Thal-R cells, and a mean of ~30 signals/nucleus in dBET6-R cells, whereas only 3 to 4 signals per nucleus were observed for 7 centromere probe in each degrader-resistant cell line (Fig. 2H and fig. S2C). Notably, FISH analysis of metaphase spreads from Thal-R cell showed a 7q deletion and a long derivative (7) containing a putative homogeneously staining region (hsr) hybridized to the ABCB1 probe (red mid-size arrow) (fig. S2D). FISH analysis of metaphase spreads from dBET6-R cells revealed either many copies of the ABCB1 locus localized within three duplicated segments within a very long derivative (7) marker chromosome or many copies of the ABCB1 within small extrachromosomal material known as double minutes (dmin) (24), although it is noteworthy that these structures were not discernable by Giemsa or DAPI staining, indicating that these structures were smaller than typical (fig. S2E).
Nearly all SUM159 parental cells showed a normal diploid number for ABCB1 in FISH analysis, whereas drug-resistant SUM159 MZ1-R cells typically had four copies of ABCB1, each residing near a 7-centromere signal, suggesting gain of part or all of two copies of the long arm of chromosome 7 (Fig. 2I). Giemsa-banded metaphase analysis from SUM159 MZ1-R cell line indicated that cells were near-triploid and confirmed the presence of four copies of 7q, with one copy residing in a derivative (7) that appears to contain 7q and all or most of 8q (fig. S2F). These findings showed the increase in ABCB1 copy number in SUM159 MZ1-R was due to polysomy rather than DNA amplification.
Hypomethylation of the ABCB1 promoter has been shown to promote drug resistance to chemotherapies through increased ABCB1 expression and drug pump activity (25). To determine if methylation of the ABCB1 promoter was altered following chronic exposure to PROTACs, we performed CpG bisulfite amplicon sequencing of the downstream promoter of ABCB1, located in exon 2 and intron 1, in parental and degrader-resistant cells, obtaining significant sequence coverage over coordinates: chr7:87,600,166–87,601,336 (fig. S2G and data file S2). Notably, relative to parental A1847 cells, we observed a marked reduction in CpG methylation of the distal portion of the ABCB1 downstream promoter (nucleotides 87,600,754–87,601,147, around exon 2) and, to a lesser degree, of the proximal portion of this promoter (nucleotides 87,600,302–87,600,753, around intron 2) in dBET6-R cells (Fig. 2J). Decreased methylation of the ABCB1 downstream promoter was also observed in Thal-R cells, however, it was limited to its proximal portion (Fig. 2J). Parental SUM159 cells had overall lower methylation than A1847 cells, and no change or perhaps only a minor increase in CpG methylation of the ABCB1 promoter was detected in SUM159 MZ1-R cells relative to parental cells (Fig. 2K). Together, these findings suggested reductions in promoter methylation of ABCB1 were contributing to the increased ABCB1 expression observed in A1847 dBET6-R and Thal-R cells but not in SUM159 MZ1-R cells.
To determine the timeline of MDR1 upregulation in degrader-resistance, we chronically exposed cells to PROTACs and measured MDR1 protein levels at 4, 24, 48, or 72 hours, as well as weekly for a one-month period. We observed no change in MDR1 levels up to 72 hours after treatment; however, we did detect increased MDR1 protein levels at 7 days post treatment with BBD or CDK9 degraders in A1847 and SUM159 cells (Fig. 2, L and M). The levels of MDR1 did not appear to further increase in A1847 cells from the 7-day time point over the 30-day period, suggesting maximal upregulation of MDR1 occurred ~7 days post-treatment with dBET6 or Thal SNS 032 (Fig. 2, N and O). In contrast, the level of MDR1 gradually increased in response to MZ1-treatment over the 30-day period in SUM159 cells (Fig. 2P), indicating that a longer period of time is required for the SUM159 cells to upregulate the maximal level of MDR1 protein compared to A1847 cells. Notably, withdrawal of the PROTACs from the degrader-resistant cell lines for 2 or 7-days did not impact MDR1 protein levels, suggesting that the upregulation of MDR1 was an adaptive but stable response (Fig. 2, Q and R).
Collectively, these findings demonstrated that chronic exposure of cancer cells to BET protein or CDK9 degraders can result in increased MDR1 expression and activity, thereby reducing intracellular levels of PROTACs. The mechanism of ABCB1 upregulation could be attributed to gene amplification and/or reduced CpG promoter methylation in A1847 cells. However, the mechanism of ABCB1 upregulation in SUM159 MZ1-R cells remains to be determined.
Genetic depletion or small molecule inhibition of MDR1 re-sensitizes degrader-resistant cells to PROTACs
Elevated levels of MDR1 have been shown to promote drug resistance in cancer cells via efflux of large hydrophobic molecules, such as chemotherapy agents (26). Notably, BET protein or CDK9 degrader-resistant cells acquired resistance to paclitaxel (fig. S3A), a known substrate of MDR1 (26), as well as were cross-resistant to PROTACs targeting other proteins (fig. S3, B and C). Knockdown of ABCB1 reduced cell viability in dBET6-R or Thal-R A1847 cells (Fig. 3A) or MZ1-R SUM159 cells (Fig. 3B), whereas it exhibited minimal effects in parental cells. As the degrader-resistant cells were continuously grown in 500 nM PROTACs, these findings suggested knockdown of ABCB1 permitted increased intracellular accumulation of BBD or CDK9 degraders. Consistent with this, genetic depletion of ABCB1 restored degradation of BET proteins or CDK9 in degrader-resistant cells but not parental cells, re-sensitizing cells to the degraders and causing apoptosis (Fig. 3, C and D). Of note, reduced protein levels of BRD2, BRD3 and BRD4 were detected in dBET6-R (Fig. 3C) or MZ1-R (Fig. 3D) cells relative to parental cells, suggesting that some target degradation was still occurring in these chronically exposed cells. However, knockdown of ABCB1 resulted in a reduction of BBD protein levels and an increase in cleavage of PARP, signifying that the degrader-resistant cells were dependent on ABCB1 to maintain the residual BRD2, BRD3 and BRD4 protein levels for survival. Additionally, we knocked down IGF2BP3, the other candidate protein commonly upregulated in both dBET6-R and Thal-R cells, and we observed no effect on BRD4 or CDK9 protein levels or induction of apoptosis, suggesting that elevated IGF2BP3 does not contribute to degrader activity in resistant cells (fig. S3D). Together, these findings demonstrate that degrader-resistant cells acquired dependency on MDR1-dependent PROTAC efflux, which permitted cells to survive in the continued presence of BBD or CDK9 degraders.
Figure 3. Blockade of MDR1 activity re-sensitizes degrader-resistant cells to PROTACs.
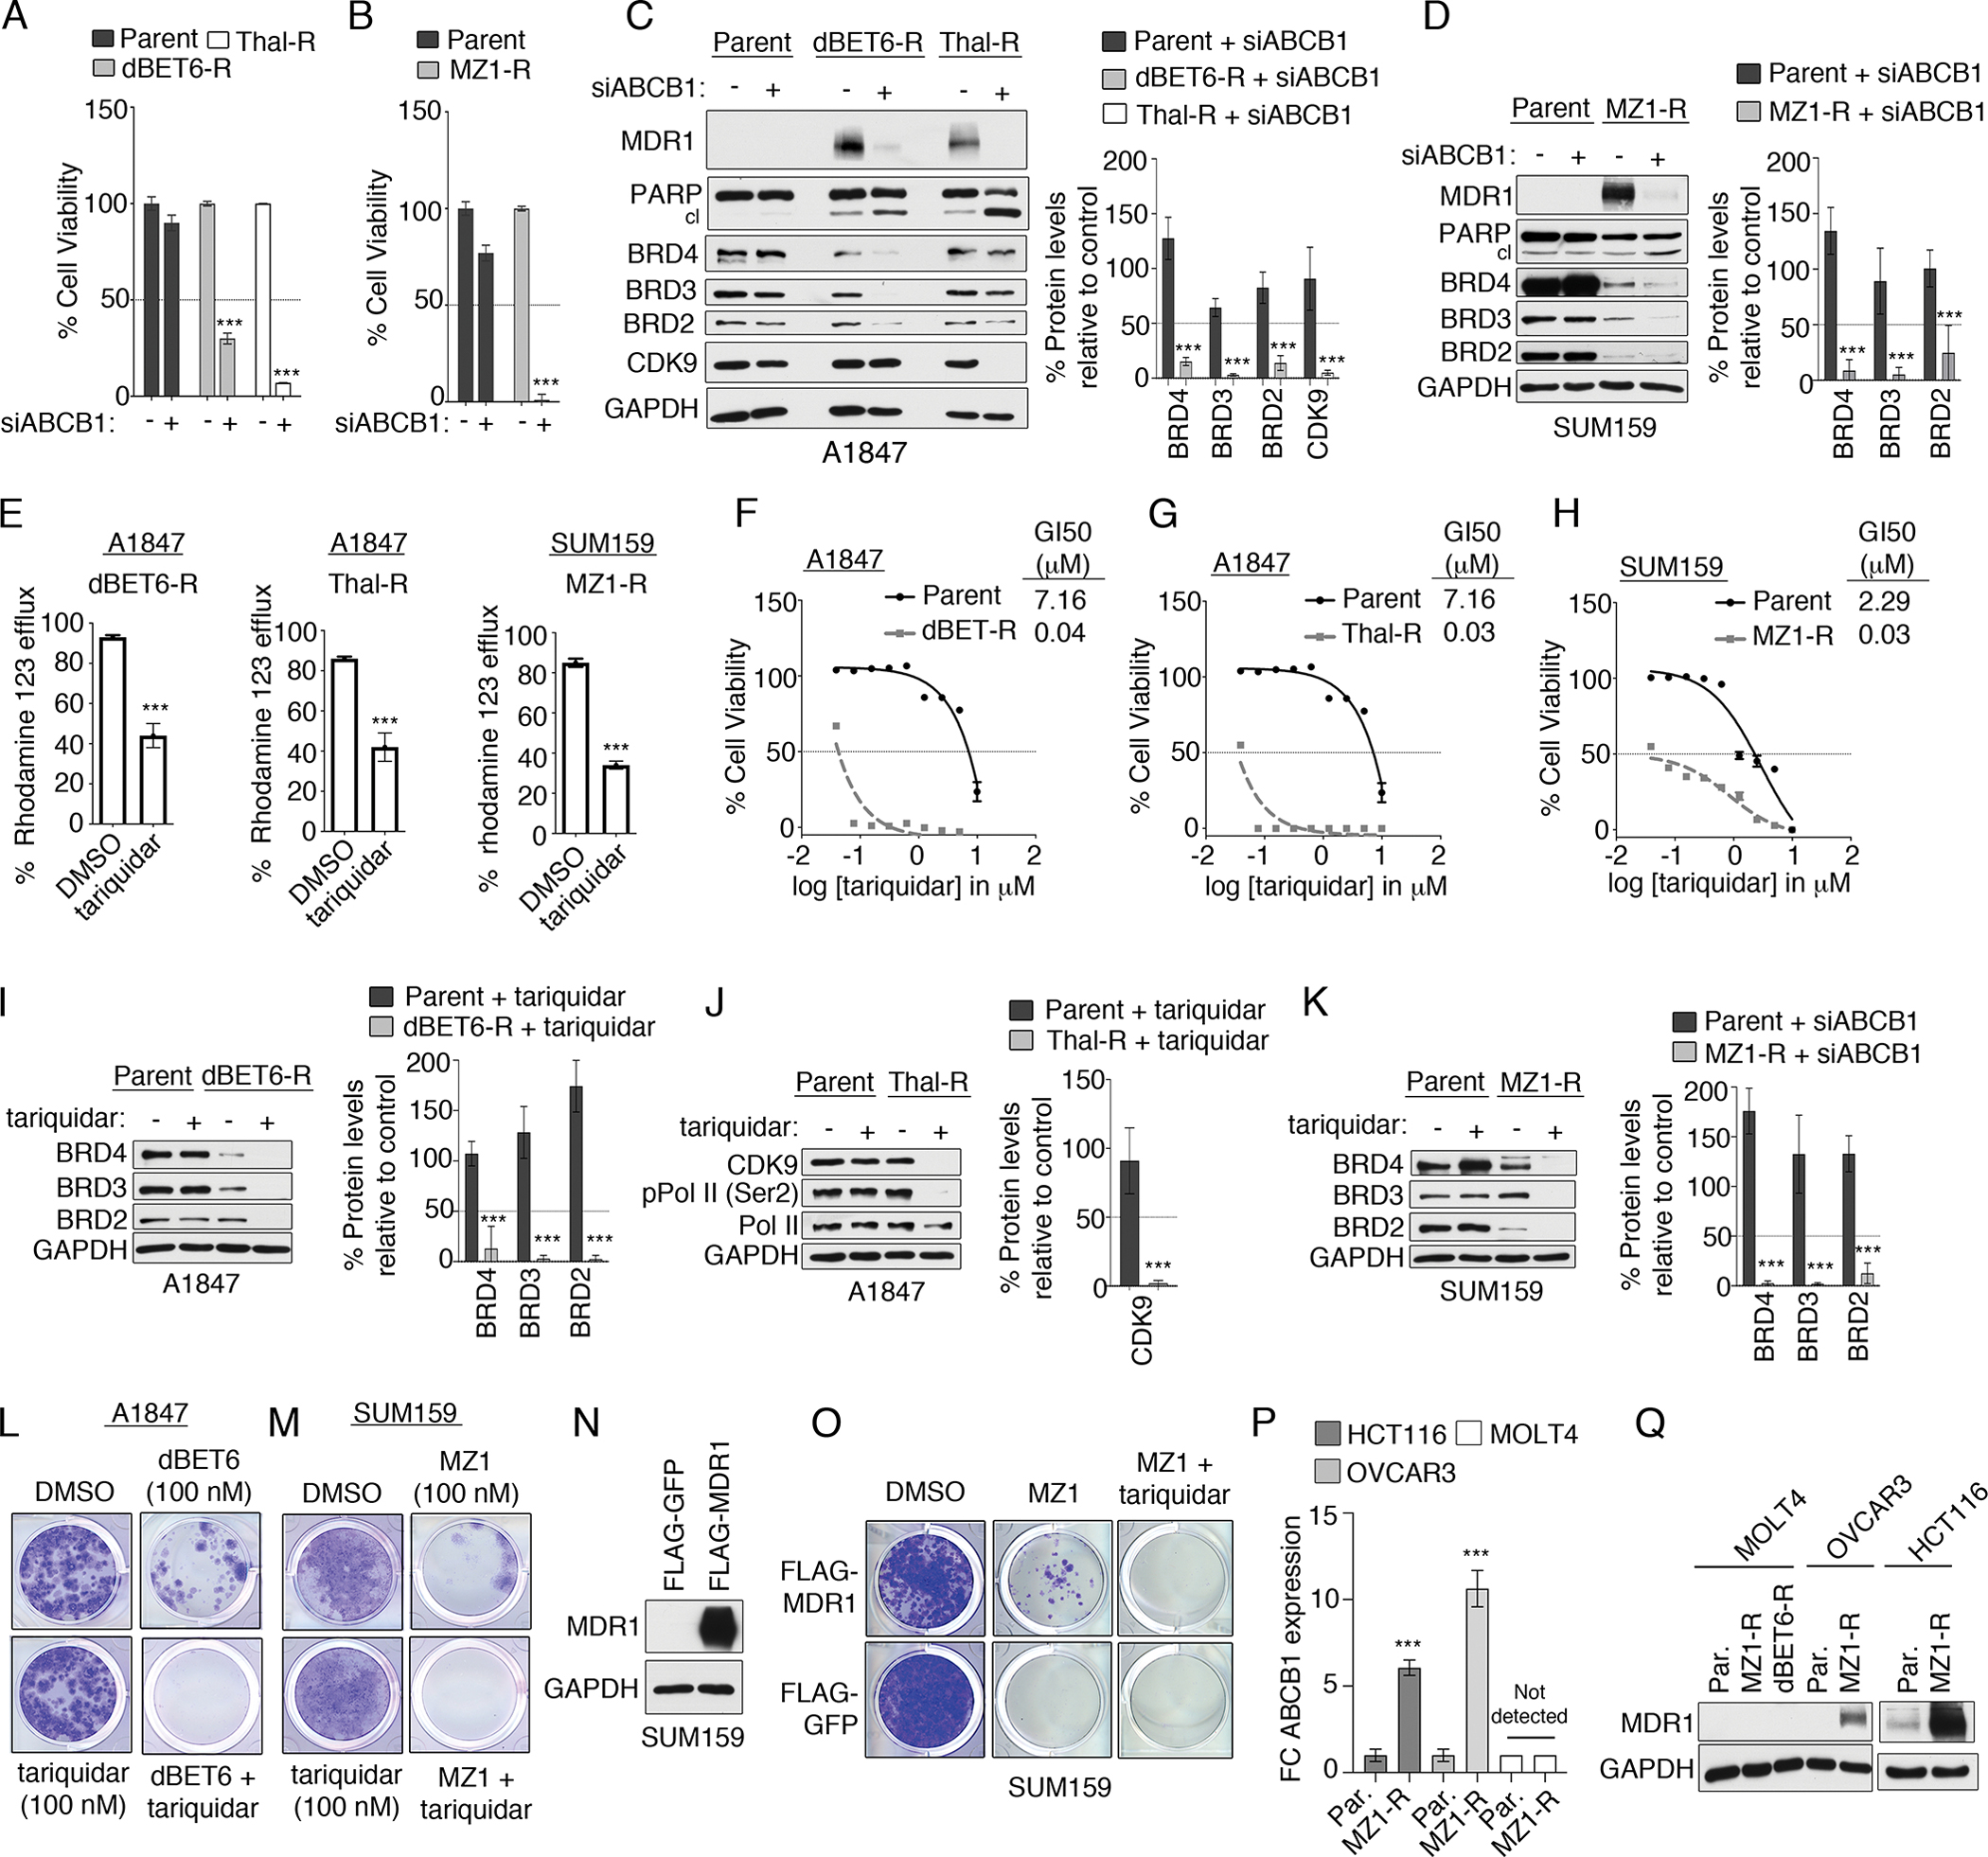
(A and B) Cell viability by CellTiter-Glo assay in parental and degrader-resistant A1847 (A) and SUM159 (B) cells transfected with control siRNA or siRNAs targeting ABCB1 and cultured for 120 hours. Data were analyzed as % of control, presented as means ± SD of 3 independent assays. ***P ≤0.001 by Student’s t-test. (C and D) Immunoblot analysis of degrader targets following ABCB1 knockdown in parental and degrader-resistant A1847 (C) and SUM159 (D) cells. Blots are representative, and densitometric analysis using ImageJ are means ± SD of 3 blots, each normalized to loading control, GAPDH. (E) Drug efflux activity, using the Rhodamine 123 efflux assay, in degrader-resistant cells after MDR1 inhibition by tariquidar (0.1 μM). Data are means ± SD of 3 independent experiments. ***P ≤0.001 by Student’s t-test. (F to H) Cell viability by CellTiter-Glo assay in parental and dBET6-R (F) or Thal-R (G) A1847 cells or MZ1-R SUM159 cells (H) treated with increasing concentrations of tariquidar. Data are % of DMSO control, presented as means ± SD of 3 independent assays. GI50 determined with Prism software. (I to K) Immunoblot analysis of degrader targets after MDR1 inhibition (tariquidar, 0.1 μM for 24 hours) in parental and degrader-resistant A1847 cells (I and J) and SUM159 (K) cells. Blots are representative, and densitometric analysis are means ± SD from 3 blots, each normalized to loading control, GAPDH. (L and M) 14-day colony formation assessed by crystal violet staining of (L) A1847 cells or (M) SUM159 cells treated with degrader (dBET6 or MZ1, respectively; 0.1 μM) and MDR1 inhibitor tariquidar (0.1 μM). Images are representative of 3 biological replicates. (N) Immunoblotting for MDR1 in SUM159 cells stably expressing FLAG-MDR1, after selection with hygromycin. (O) Long-term 14-day colony formation assay of SUM159 cells expressing FLAG-MDR1 were treated with DMSO, MZ1 (0.1 μM), or MZ1 and tariquidar (0.1 μM) for 14 days, assessed by crystal violet staining. Representative images of 3 biological replicates are shown. (P and Q) RT-PCR (P) and immunoblot (Q) analysis of ABCB1 mRNA and MDR1 protein levels, respectively, in parental or MZ1-R HCT116, OVCAR3 and MOLT4 cells. Blots are representative, and graphs present means ± SD of 3 independent experiments. ***P ≤0.001 by Student’s t-test.
Several small molecule inhibitors of MDR1 have been developed, including tariquidar (27), which is currently being evaluated in clinical trials for the treatment of MDR1-driven drug resistant disease (28). Treatment of A1847 dBET6-R, Thal-R or MZ1-R SUM159 cells with tariquidar reduced MDR1 drug efflux pump activity, as indicated by reduced efflux of Rhodamine 123 in degrader-resistant cells compared to parental cells (Fig. 3E). Moreover, degrader-resistant cells continuously grown in 500 nM PROTACs showed a greater inhibition of cell viability in response to tariquidar than parental cells (Fig. 3, F to H), and inhibition of MDR1 by tariquidar restored degradation of BET proteins or CDK9 in degrader-resistant cells (Fig. 3, I to K). Notably, chronic exposure of A1847 cells to BET inhibitor JQ1 did not cause sensitization to tariquidar, suggesting that acquired dependency on MDR1 was specific to BBD degrader-resistance (fig. S3E). Combined treatment of parental A1847 or SUM159 cells with BET protein degraders and tariquidar blocked the development of BET protein degrader-resistant colonies over a 14-day period (Fig. 3, L and M). Notably, we did not observe colonies resistant to the BBD-tariquidar treatments over the 14-day period, suggesting that co-targeting MDR1 with BBD degraders provides durable growth inhibition for at least two weeks. Moreover, forced expression of FLAG-MDR1 in SUM159 cells rescued colony formation growth in MZ1-treated cells that could be blocked by tariquidar treatment, signifying overexpression of MDR1 reduces sensitivity towards BET degraders (Fig. 3, N and O).
To further explore MDR1 upregulation in degrader-resistance in cancer cells, we chronically exposed 3 additional cancer cell lines (OVCAR3, HCT116 and MOLT4) to BET protein degraders and assessed MDR1 protein levels. OVCAR3 and HCT116 cell lines acquired resistance to MZ1 (fig. S3, F and G) that was accompanied by elevated MDR1 mRNA and protein levels in parental cells (Fig. 3, P and Q), as well as an increased sensitivity towards tariquidar-treatments (fig. S3, H and I). In contrast, we were unable to generate MZ1-resistant MOLT4 cells (fig. 3SJ) and chronic exposure to BET protein degraders did not result in upregulation of ABCB1 mRNA or protein levels (Fig. 3, P and Q). These findings suggest that not all cancer cells will upregulate MDR1 following continuous degrader exposure; in our studies, 4 out of 5 cancer cell lines induced MDR1 causing degrader-resistance.
MDR1-overexpressing cells exhibit intrinsic resistance to PROTAC therapies that can be overcome by MDR1 inhibition
Overexpression of MDR1 frequently occurs in cancers conveying intrinsic resistance to several anti-cancer therapies such as chemotherapies (19). Analysis of ABCB1 mRNA expression across the cancer cell line encyclopedia (29, 30) revealed that 13% of all cancer cell lines exhibited overexpression of ABCB1, with renal cell carcinomas, colorectal cancer, hepatobiliary (liver) cancer, and neuroblastomas showing the greatest frequency of overexpression (Fig. 4A). Similarly, querying the cancer genome atlas (TCGA) and human protein atlas databases, revealed that ABCB1 gene expression was frequently altered in tumors from renal, colorectal, and liver cancer patients, whereas elevated MDR1 protein levels were observed in >50% of liver and colorectal cancer specimens by immunohistochemistry (IHC) (31) (fig. S4, A and B).
Figure 4. Overexpression of MDR1 Conveys Intrinsic Resistance to Degrader Therapies in Cancer Cells.

(A) Frequency of ABCB1 mRNA overexpression in a panel of cancer cell lines, obtained from cBioPortal for Cancer Genomics using Z-scores values of >1.2 for ABCB1 mRNA levels (30). (B) Immunoblot for MDR1 protein levels in a panel of 10 cancer cell lines. Blots are representative of 3 independent experiments. (C) Cell viability by CellTiter-Glo assay in cancer cell lines expressing high or low MDR1 protein levels and treated with Thal SNS 032 for 5 days. Data were analyzed as % of DMSO control, presented as means ± SD of 3 independent assays. GI50 were determined with Prism software. (D to F) Immunoblot analysis of CDK9 in MDR1-low (D) or MDR1-high (E) cell lines after Thal SNS 032 treatment for 4 hours. Blots are representative, and densitometric analysis using ImageJ are means ± SD from 3 blots, each normalized to loading control, GAPDH. DC50 determined with Prism. (G and H) Immunoblotting of control and MDR1-knockdown DLD-1 cells treated for 4 hours with increasing concentrations of Thal SNS 032 (indicated in H). Blots are representative, and densitometric analysis data are means ± SD from 3 blots, each normalized to loading control, GAPDH. DC50 determined with Prism. (I) Drug efflux activity using Rhodamine 123 efflux assays in DLD-1 cells treated with DMSO or 0.1 μM tariquidar. Data are mean ± SD of 3 independent experiments. ***P ≤0.001 by Student’s t-test. (J) Intracellular Thal SNS 032 levels, using the CRBN NanoBRET target engagement assay, in MDR1-overexpressing DLD-1 cells treated with DMSO or 0.1 μM tariquidar and increasing doses of Thal SNS 032. Data are % of DMSO control, presented as means ± SD of 3 independent assays. **P ≤0.01, ***P ≤0.001 by Student’s t-test. (K to N) Immunoblotting in DLD-1 cells treated with increasing doses of Thal SNS 032 (K and L) or dBET6 (M and N) alone or with tariquidar (0.1 μM) for 4 hours. Blots are representative, and densitometric analyses are means ± SD from 3 blots, each normalized to loading control, GAPDH. DC50 of Thal SNS 032 for CDK9 reduction (L) or of dBET6 for BRD4 reduction (N) determined with Prism. (O to T) Bliss synergy scores based on cell viability by CellTiter-Glo assay, colony formation, and immunoblotting in DLD-1 cells treated with the indicated doses of Thal SNS 032 (O to Q) or dBET6 (R to T) alone or with tariquidar. Cells were treated for 14 days for colony formation assays and 24 hours for immunblotting. Data are representative of and quantified from 3 experiments.
To determine if overexpression of ABCB1 in cancer cells influences degrader activity, we compared the impact of degrader-treatment on cell viability and protein degradation using cancer cell lines with moderate to high MDR1 protein levels (COLO320, DLD-1, HCT-15, CAKI-1, SF295) or low to non-detectable MDR1 (A1847, PC-3, MDA-MB-436, MOLT4 and LNCaP) (Fig. 4B). Treatment of MDR1 overexpressing cells with Thal SNS 032 (Fig. 4C), dBET6 (fig. S4C), or MZ1 (fig. S4D) did not reduce cell viability to the extent observed in cell lines expressing low or no detectable MDR1 protein (Fig. 4C and fig. S4, C and D). Notably, MDR1 expressing cells required higher concentrations of Thal SNS 032 (Fig. 4, D to F), or dBET6 (fig. S4, E to G) to reduce target protein levels, with DC50 values overall greater in MDR1-expressing cells compared to MDR1 non-expressing cell lines.
To confirm the reduced degradation efficiency in MDR1-overexpressing cells was due to ABCB1, we knocked down ABCB1, and determined DC50s for Thal SNS 032 and dBET6. Depletion of MDR1 in DLD-1 cells improved Thal SNS 032-mediated degradation of CDK9, reducing the DC50 from 400 nM to 30 nM (Fig. 4, G and H), as well as diminishing the DC50 of dBET6 from 20 nM to 0.6 nM (fig. S4, H and I). Next, we explored whether inhibition of MDR1 using tariquidar would improve degrader efficiency in MDR1 overexpressing cells. Treatment of DLD-1 cells with tariquidar inhibited MDR1 drug efflux activity (Fig. 4I), and increased intracellular levels of Thal SNS 032, as determined by CRBN NanoBRET target engagement assay (Fig. 4J). Importantly, co-treatment of DLD-1 cells with tariquidar and either Thal SNS 032 (Fig. 4, K and L) or dBET6 (Fig. 4, M and N) reduced the DC50 of the degraders, resulting in a greater reduction in CDK9 or BET proteins at lower concentrations of the PROTACs. Additionally, co-treatment of DLD-1 cells with FAK degrader (FAK-degrader-1) (32) or MEK1/2 degrader (MS432) (33) and tariquidar enhanced the protein reduction relative to single agent therapies (fig. S4, J and K), suggesting overexpression of MDR1 can promote resistance to degrader therapies, independent of protein target.
Combination therapies involving CDK9 degraders and tariquidar in DLD-1 cells exhibited high drug synergy (Bliss synergy score 45.4) in blocking cell viability in 5-day growth assays and inhibited colony formation over a 14-day period better than single agent therapies (Fig. 4, O and P). Moreover, co-administration of Thal SNS 032 and tariquidar improved protein degradation of CDK9, reduced phosphorylation of Pol II (Ser2) and induced apoptosis uniquely in the combination (Fig. 4Q). Similarly, co-treatment of DLD-1 cells with tariquidar and dBET6 blocked cell viability and colony formation to a greater extent than single agent therapies, as well as reduced protein levels of the BRD4 target MYC and induced apoptosis (Fig. 4, R to T). The drug synergy amongst tariquidar and BET protein or CDK9 degraders was also observed in additional MDR1-overexpressing cell lines HCT-15 (fig. S4L), CAKI-1 (fig. S4M), and COLO320 (fig. S4N).
Together, our findings suggest that cancer cells expressing moderate to high MDR1 protein levels will likely exhibit intrinsic resistance to degraders requiring co-administration of MDR1 inhibitors to achieve protein degradation and therapeutic efficacy.
Repurposing dual kinase/MDR1 inhibitors to overcome degrader resistance in cancer cells
Specific inhibitors of MDR1 such as tariquidar have shown limited success in the clinic at re-sensitizing MDR1 overexpressing patients to chemotherapy due to toxicities, low drug-drug interactions and the inability to achieve desired concentrations of tariquidar in tumors (34). Notably, several kinase inhibitors have been shown to be potent inhibitors of MDR1 drug efflux activity capable of overcoming multidrug resistance in cancer cells (35). The ErbB receptor inhibitor lapatinib is an U.S. Food and Drug Administration (FDA) approved drug for the treatment of several HER2 driven cancers and has been shown to also directly inhibit the drug efflux activity of MDR1, both in cancer cells and in in vivo tumor models (36). Additionally, RAD001, an FDA-approved mTORC1 inhibitor for treatment of renal cell carcinomas, has also been shown to inhibit MDR1 function in cancer cells (37). Based on these findings, we hypothesized that the combined inhibition of ErbB receptors or mTORC1 and MDR1 drug efflux by lapatinib or RAD001, respectively, could represent a promising strategy to overcome MDR1-mediated resistance to degraders, as well as improve anti-cancer benefits of PROTACs.
Treatment of degrader-resistant dBET6-R or Thal-R cell lines with RAD001 or lapatinib reduced MDR1 drug efflux activity similar to that observed with tariquidar (Fig. 5, A and B). Degrader-resistant cell lines continuously grown in 500 nM PROTACs were more sensitive to RAD001 (Fig. 5C and fig. S5, A and B) or lapatinib (Fig. 5D and fig. S5, C and D) than parental cells. Consistent with tariquidar treatments (fig. S5E), administration of RAD001, or lapatinib had no impact on BRD4 or CDK9 protein levels in parental cells (Fig. 5E). In contrast, escalating doses of RAD001, lapatinib or tariquidar in dBET6-R cells resulted in degradation of BRD4 with DC50 values of 80 nM (RAD001), 50 nM (lapatinib) and <10 nM (tariquidar) (Fig. 5, F and G; and fig. S5, F and G). Similarly, treatment of A1847 MZ1-R cells with RAD001 or lapatinib also restored degradation of BBDs (fig. S5, H and I). Exposure of Thal-R cells to escalating doses of RAD001, lapatinib or tariquidar also enhanced CDK9 degradation reducing DC50 values for CDK9 relative to parental cells (Fig. 5, H and I; and fig. S5, J and K). Moreover, treatment of degrader-resistant cell lines with RAD001 or lapatinib resulted in apoptosis similar to tariquidar treatment (Fig. 5J), demonstrating RAD001 or lapatinib can inhibit MDR1 function overcoming MDR1-driven degrader-resistance.
Figure 5. Re-purposing dual kinase/MDR1 inhibitors to overcome degrader resistance in cancer cells.

(A and B) Drug efflux activity by Rhodamine 123 efflux assays in degrader-resistant [dBET-R (A) or Thal-R (B)] A1847 cells after treatment with tariquidar, RAD001 or lapatinib (each 2 μM). Data are ± SD of 3 independent experiments. *P ≤0.05 by Student’s t-test. (C and D) CellTiter-Glo assay for cell viability of parental, dBET6-R or Thal-R A1847 cells treated with increasing concentrations of RAD001 (C) or lapatinib (D). Data were analyzed as % of DMSO control, presented as means ± SD of 3 independent assays. GI50 were determined with Prism software. (E to I) Immunoblot analysis of degrader targets in parental (E), dBET6-R (F and G) and Thal-R (H and I) A1847 cells treated with increasing concentrations of RAD001 or lapatinib for 4 hours Blots are representative, and densitometric analyses are means ± SD from 3 blots, each normalized to loading control, GAPDH. DC50 of dBET6 for BRD4 reduction (G) or of Thal SNS 032 for CDK9 reduction (I) determined with Prism. (J) Immunoblotting for cleaved PARP in dBET6-R or Thal-R A1847 cells treated with RAD001, lapatinib, or tariquidar (each 2 μM) for 24 hours. Blots are representative of 3 independent blots. (K to N) Immunoblotting for BRD4 in DLD-1 cells treated with increasing doses of dBET6 alone or in combination with either RAD001 or lapatinib (each 2 μM; K and L) or KU-0063794 or afatinib (each 2 μM; M and N) for 4 hours. Blots are representative of 3 independent experiments, and in (L) are means ± SD from 3 blots, each normalized to loading control, GAPDH. DC50 for BRD4 reduction (L) determined in PRISM. (O) Colony formation by DLD-1 cells treated with DMSO, dBET6 (0.1 μM), lapatinib (2 μM), afatinib (2 μM), RAD001 (2 μM), KU-0063794 (2 μM), or the combination of inhibitor and dBET6 for 14 days. Images representative of 3 independent assays. (P and Q) Immunoblotting for CDK9 in DLD-1 cells treated with increasing doses of Thal SNS 032 and/or RAD001 (2 μM) or lapatinib (2 μM) for 4 hours. Blots are representative, and densitometric analysis are means ± SD from 3 blots, each normalized to loading control, GAPDH. DC50 for CDK9 reduction determined with Prism (Q). (R) Colony formation in DLD-1 cells treated with DMSO, Thal SNS 032 (0.5 μM), lapatinib (2 μM), and/or RAD001 (2 μM) as indicated for 14 days. Images representative of 3 independent assays.
Next, we explored whether RAD001 or lapatinib treatment could sensitize MDR1-overexpressing cells to degrader therapies. Treatment of DLD-1 cells with RAD001 or lapatinib reduced MDR1 drug efflux activity similar to tariquidar treatment (fig. S5L), and immunoblot analysis showed RAD001 or lapatinib treatment reduced the DC50 of dBET6 by ~30-fold, improving PROTAC-mediated degradation of BRD4 (Fig. 5, K and L). In contrast, combined treatment of DLD-1 cells with KU-0063794 (mTOR inhibitor) or afatinib (ErbB receptor inhibitor), drugs that do not inhibit MDR1 function (fig. S5M), failed to improve degradation of BRD4 (Fig. 5, M and N). Moreover, treatment of DLD-1 cells with lapatinib but not afatinib sensitized DLD-1 cells to dBET6 providing durable inhibition of colony formation over a 14-day period (Fig. 5O). Similarly, co-treatment of DLD-1 cells with KU-0063694 and dBET6 did not improve growth inhibition observed with the RAD001 and dBET6 combination, where single agent KU-0063694 treatment completely repressed colony formation. RAD001 or lapatinib treatment also sensitized DLD-1 cells to Thal SNS 032, improving the degradation of CDK9 (Fig. 5, P and Q), and enhancing growth inhibition of colonies (Fig. 5R). Together, these findings demonstrate that RAD001 or lapatinib can be utilized as MDR1 inhibitors to overcome intrinsic degrader-resistance mediated by MDR1 drug efflux.
Lapatinib treatment enhances MEK1/2-degrader therapies in KRAS-mutant colorectal cancer cells by dual blockade of MDR1 activity and ERBB receptor signaling
KRAS mutations occur in nearly 40% of colorectal cancer (CRC) patients, supporting therapies that target KRAS effectors such as the MEK-ERK signaling pathway (38). Recently, MEK1/2 degraders have been developed that show potent anti-growth properties in RAS-RAF altered cancers (33). Notably, the majority of KRAS-mutant CRC cell lines exhibit elevated ABCB1 expression (39), suggesting concomitant blockade of MDR1 may be required to achieve therapeutic efficacy with MEK1/2 degraders (Fig. 6, A and B). Moreover, resistance to MEK inhibitors in KRAS-mutant colorectal cancer cells is mediated by activation of ErbB receptors and downstream RAF-MEK-ERK and PI3K/AKT signaling (40). Based on these findings, we hypothesized combination therapies involving lapatinib and the MEK1/2 degrader MS432 could be a unique strategy to simultaneously block MDR1-mediated resistance, as well as inhibit MEK inhibitor-mediated kinome reprogramming involving activation of ERBB3 (HER3) signaling.
Figure 6. Combining MEK1/2 degraders with lapatinib synergistically kill MDR1-overexpressing KRAS-mutant CRC cells and tumors.

(A and B) ABCB1 expression in KRAS-mutant CRC cell lines from c-Bioportal (30) (A) and MDR1 abundance in select KRAS-mutant CRC cell lines (B). (C) Cell viability assessed by CellTiter-Glo in CRC cells treated with increasing doses of MS432 for 5 days, analyzed as % of DMSO control. GI50 determined with Prism software. (D) Colony formation by CRC cells 14 days after treatment with 1 μM MS432. (E) MEK1/2 protein levels assessed by immunoblot in CRC lines SKCO1 (low MDR1) or LS513 (high MDR1) treated with increasing doses of MS432 for 4 hours. (F) Rhodamine 123 efflux in LS513 cells treated with DMSO, 2 μM tariquidar, or 2 μM lapatinib. (G and H) Immunoblotting analysis in LS513 cells treated with increasing doses of MS432 alone or in combination with tariquidar (0.1 μM) or lapatinib (5 μM) for 24 hours. DC50 for MEK1 levels determined with Prism. (I) Immunoblotting in LS513 cells treated with DMSO, PD0325901 (0.01 μM), lapatinib (5 μM), or the combination for 48 hours. (J and K) Immunoblotting in LS513 cells treated either with DMSO, MS432 (1 μM), or tariquidar (0.1 μM; J) or lapatinib (5 μM; K), alone or in combination. (L) Bliss synergy scores determined from cell viability assays (CellTiter-Glo) in LS513 cells treated with increasing concentrations of MS432, lapatinib, or the combination. (M and N) Colony formation by LS513 cells (M) and others (N) treated with DMSO, lapatinib (2 μM), MS432 (1 μM), or the combination for 14 days. (O and P) Immunoblotting in LS513 cells treated with increasing doses of MS934 alone (O) or combined with lapatinib (5 μM; P) for 24 hours. (Q and R) Tumor volume of LS513 xenografts (Q) and the body weights of the tumor-bearing nude mice (R) treated with vehicle, 50 mg/kg MS934, 100 mg/kg lapatinib, or the combination. N=5 mice per treatment group. In (A to R), blots and images are representative of 3 independent experiments, and quantified data are mean ± SD (SEM in Q and R) of 3 independent experiments; ***P ≤0.001 by Student’s t-test.
As predicted, KRAS-mutant CRC cell lines with overexpressed MDR1 (LS1034, LS513, SW948 and SW1463) were more resistant to the MEK1/2 degrader MS432 than were CRC cell lines expressing low amounts of MDR1 (SKCO1, NCIH747, and SW620) (Fig. 6, C and D). Notably, KRAS-mutant cell lines showed sensitivity to the MEK inhibitor trametinib independently of MDR1 status (41) (fig. S6A). Moreover, treatment of the MDR1-overexpressing cell line LS513 with MS432 did not reduce MEK1 or MEK2 protein levels, inhibit ERK1/2 phosphorylation, or induce apoptosis that was observed with degrader-sensitive, MDR1 non-expressing cell line SKCO1 (Fig. 6E). Treatment of LS513 cells with lapatinib reduced MDR1 drug efflux activity similarly to that observed in response to tariquidar (Fig. 6F), and co-treatment of LS513 cells with MS432 and lapatinib improved the degradation efficiency of MEK1 and MEK2, as well as reduced ERK1/2 phosphorylation at lower concentrations of MS432 (Fig. 6, G and H). Furthermore, the addition of lapatinib to MS432 reduced the levels of ERK1/2-activating phosphorylation to a greater extent than did the tariquidar/MS432 combined treatment, suggesting that concurrent blockade of ErbB receptors and MDR1 may be more efficacious than inhibiting MDR1 activity alone.
Next, we explored the impact of blockade of MDR1 alone using tariquidar or MDR1 and ErbB receptors using lapatinib on KRAS effector signaling in LS513 cells. As previously reported, treatment of LS513 cells with MEK inhibitors induced HER3 and downstream AKT signaling, which could be blocked by lapatinib treatment (Fig. 6I), and combining lapatinib and PD0325901 exhibited drug synergy (fig. S6B). Co-treatment of LS513 cells with MS432 and lapatinib but not tariquidar reduced MEK inhibitor-induced HER3 and downstream AKT activation, as well as distinctly induced apoptosis (Fig. 6, J and K). Combination therapies involving MS432 and lapatinib in LS513 cells exhibited robust drug synergy with a Bliss synergy score of 38.9 (Fig. 6L), as well as provided durable inhibition of colony formation over a 14-day period (Fig. 6M). Furthermore, the combination of lapatinib and MS432 provided durable growth inhibition of other MDR1-overexpressing KRAS-mutant CRC cell lines (Fig. 6N). Next, we explored the efficacy of combining MEK degraders and lapatinib in vivo using LS513 xenograft models and the recently published MEK degrader MS934, which has optimal bioavailability for animal studies (33). Similar to the observations with MS432, combining MS934 and lapatinib enhanced MEK1/2 degradation in LS513 cells, exhibited drug synergy, and distinctly induced apoptosis (Fig. 6, O and P, and fig. S6C). Treatment of mice harboring LS513 xenografts with the MEK degrader MS934 and lapatinib distinctly reduced tumor growth with minimal impact on mice body weight, whereas single agents were ineffective (Fig. 6, Q and R), suggesting concurrent blockade of ErbB receptors and MDR1 will likely be required to achieve therapeutic response using MEK degraders in KRAS-mutant CRC.
Combining lapatinib and KRASG12C degrader LC-2 exhibits drug synergy in KRASG12C mutant CRC cells
PROTACs targeting KRASG12C mutants have recently been developed that induce rapid and sustained degradation of KRASG12C leading to inhibition of MAPK signaling in KRASG12C cancer cell lines (7). Notably, several KRASG12C cancer cell lines have been shown to be resistant to KRASG12C inhibitors but sensitive to KRAS knockdown (42), suggesting degradation of KRASG12C may be an alternative therapeutic strategy for these KRAS inhibitor-resistant cells. Similar to MEK1/2 inhibitors, however, adaptive resistance to KRASG12C inhibitors in CRC cells has also been shown to be mediated by kinome remodeling involving activation of ErbB receptor signaling bypassing KRAS inhibition (43). Therefore, we next explored whether combining lapatinib and the KRASG12C degrader LC-2 (7) would improve degradation efficiency of KRASG12C and enhance therapeutic efficacy in MDR1-overexpressing KRASG12C CRC cell lines [SW1463 (homozygous KRASG12C) and SW837 (heterozygous KRASG12C)].
SW1463 or SW837 KRASG12C CRC cells exhibited intrinsic resistance to LC-2 but were sensitive to KRASG12C inhibitor MRTX849 treatment (Fig. 7, A and B). Treatment of SW1463 cells with 1 μM LC-2 had no impact on KRASG12C protein levels, whereas combining tariquidar or lapatinib with LC-2 improved PROTAC-mediated degradation of KRASG12C reducing protein levels (Fig. 7, C and D). Combining either tariquidar or lapatinib with LC-2 reduced phosphorylation of MEK and ERK, but the lapatinib combination uniquely reduced CRAF and AKT phosphorylation, as well as induced apoptosis. Similarly, co-treatment of SW837 cells with LC-2 and lapatinib, but not single agents, reduced the phosphorylation of KRAS effectors CRAF, AKT, MEK and ERK, as well as caused apoptosis (Fig. 7E). Notably, it was difficult to observe enhanced reduction in KRASG12C protein levels in response to LC-2 and lapatinib treatment in SW837 cells, likely due to SW837 cells expressing KRASWT, which is not targeted by LC-2. Combining LC-2 and lapatinib exhibited drug synergy in 5-day cell viability assays in SW1463 and SW837 with Bliss synergy scores of 27.0 and 25.0 (Fig. 7, F and G), whereas combining LC-2 with tariquidar or afatinib (ErbB-selective) showed drug synergy but to a lesser extent than the LC-2/lapatinib combination (fig. S7, A to F). Furthermore, LC-2 in combination with lapatinib blocked colony formation in SW1463 and SW837 cells to a greater extent than LC-2/tariquidar co-treatments (Fig. 7, H and I).
Figure 7. Lapatinib treatment improves KRASG12C degrader therapies in MDR1-overexpressing CRC cell lines.

(A and B) Colony formation by SW1463 (A) or SW837 (B) cells treated with DMSO, LC-2 (1 μM), or MRTX849 (1 μM) for 14 days. Images representative of 3 independent assays. (C to E) Immunoblotting in SW1463 cells (C and D) and SW837 cells (E) treated with DMSO, LC-2 (1 μM), tariquidar (0.1 μM; C), or lapatinib (5 μM; D and E) alone or in combination for 48 hours. Blots are representative of 3 independent experiments. (F and G) Bliss synergy scores based on CellTiter-Glo assay for cell viability of SW1463 (F) or SW837 (G) cells treated with increasing concentrations of LC-2, lapatinib, or the combination. Data are 3 experiments SD. (H and I) colony formation SW1463 (H) or SW837 (I) cells treated as indicated (-, DMSO; LC-2, 1 μM; lapatinib, 2 μM; tariquidar, 0.1 μM) for 14 days. Images representative of 3 independent assays. (J) Rationale for combining lapatinib with MEK1/2 or KRASG12C degraders in MDR1-overexpressing CRC cell lines. Simultaneous blockade of MDR1 and ErbB receptor signaling overcomes degrader resistance as well as ErbB-receptor kinome reprogramming, resulting in sustained inhibition of KRAS effector signaling.
Together, our findings suggest the combination of dual MDR1/ErbB receptor inhibitor lapatinb and PROTACs targeting MEK1/2 or KRASG12C represents a promising combination therapy for MDR1-overexpressing KRAS-mutant CRC cells due to simultaneous blockade of both MDR1-and ErbB receptor driven resistance programs (Fig. 7J).
DISCUSSION
Resistance to PROTACs has previously been shown to occur through reduced expression of genes essential for target recruitment or degradation (9). Here, we observed a substantial upregulation in the expression and activity of the MDR1 drug pump following chronic exposure to BBD or CDK9 degraders, whereby MDR1-dependent drug efflux promoted resistance by decreasing intracellular levels of PROTACs. Notably, 4 out of 5 cancer cell lines we tested increased MDR1 expression in response to continuous degrader treatment, causing resistance, which strongly suggests that MDR1 upregulation could represent a common mechanism of resistance to PROTAC therapies. However, a more detailed analysis of MDR1 upregulation in additional cell lines, in response to a variety of PROTACs, will be required to determine the frequency of this resistance mechanism in cancer cells. Moreover, determining whether MDR1 upregulation or genetic repression of PROTAC-engaging proteins are mutually exclusive events or function coordinately in degrader-resistance will also be of particular interest.
PROTACs are bulky, large hydrophobic molecules representing ideal substrates for MDR1 drug pumps (44), suggesting ABCB1 expression could be a promising biomarker for PROTACs in the treatment of cancer. Notably, ABCB1 expression varies considerably across cancer types (45), with colon, renal and liver cancers commonly exhibiting elevated ABCB1 expression (31, 39), suggesting that these neoplasms will likely exhibit intrinsic resistance to degraders requiring co-administration of MDR1 inhibitors. Additionally, tumors resistant to chemotherapies often overexpress MDR1 (46), signifying PROTAC responses in the recurrent setting may also be limited, requiring co-blockade of MDR1. Notably, several cancers such as lymphomas appear to have limited expression of ABCB1 in cancer cell lines and clinical specimens (31, 39), representing a possible patient population where PROTAC therapies may provide more durable therapeutic outcomes. However, we demonstrated cancer cell lines that had no detectable MDR1 protein levels could upregulate MDR1 following chronic PROTAC exposure, acquiring resistance to PROTACs, suggesting the lack of MDR1 expression alone may not be sufficient to predict response to PROTACs.
The regulation of ABCB1 expression in cancer cells is complex, with multiple mechanisms functioning cooperatively to increase ABCB1 levels in drug resistance, including gene amplification and/or promoter hypomethylation (23, 25, 47). Unlike A1847 degrader-resistant cells, our characterization of SUM159 MZ1-R cells did not show amplification of ABCB1 nor changes in promoter methylation, suggesting other mechanisms were contributing to the observed increase in ABCB1 expression. Studies have shown epigenetic components, chromatin remodeling (48), transcriptional factors (49) and survival signaling (50) all can contribute to the regulation of ABCB1 expression in cancer cells. Notably, increased PI3K/AKT and/or Raf signaling has been associated with upregulation of ABCB1 in drug resistance (47). The SUM159 cell line harbors activating mutations in HRAS and PIK3CA (51), where activated PI3K and/or Raf signaling could contribute to ABCB1 upregulation in response to continuous PROTAC treatment. However, further studies evaluating PI3K and Raf activation in degrader-resistance cells and the impact of these pathways on ABCB1 expression and degrader activity will be required.
Upregulation of the MDR1 drug pump has been reported as a common mechanism of resistance to several chemotherapies (26). Consequently, small molecule inhibitors of MDR1 have been investigated in clinical trials as sensitizers to chemotherapies; however, these drugs have shown limited therapeutic benefit, with no MDR1 inhibitors FDA-approved for cancer therapy (34). Poor drug accumulation and drug toxicities of MDR1 inhibitors have prompted the search for alternative strategies to block MDR1-driven drug resistance (35). Several kinase inhibitors have been shown to directly inhibit MDR1 drug efflux activity, including a number of FDA-approved kinase inhibitors (35, 52). Here, we showed that the FDA-approved mTOR inhibitor, RAD001, could be used to block MDR1 activity, to overcome MDR1-mediated drug resistance in cancer cells. RAD001 is currently used to treat several cancers (53), including renal cell carcinoma (RCC) (54), which exhibits frequent overexpression of MDR1 (55). Further studies exploring whether RAD001 in combination with PROTACs targeting established drivers can enhance protein degradation and anti-tumor responses in RCC will be of interest. Moreover, exploring the impact of other dual MDR1/kinase inhibitors currently approved for cancer therapies, such as imatinib (56), or dasatinib (57), to improve PROTAC degrader therapeutic responses may represent additional avenues to pursue for the treatment of MDR1-overexpressing cancers.
ErbB receptors are frequently altered in cancers, representing promising anti-cancer targets (58). Lapatinib is a highly selective EGFR, ERBB2 and ERBB4 inhibitor that is currently FDA-approved for the treatment of a variety of malignancies (59). Notably, lapatinib has previously been shown to be a competitive inhibitor of MDR1 both in vitro and in vivo (36), and our findings showed lapatinib could be used interchangeably with tariquidar to block or overcome MDR1-mediated resistance to PROTACs. Activation of ErbB receptors has been shown to promote resistance to KRASG12C or MEK inhibitors in CRC, whereby combination therapies of lapatinib and either KRASG12C or MEK inhibitors provided more durable therapies in tumor models (40, 58). Here, we demonstrated that combining lapatinib with PROTACs targeting KRASG12C or MEK1/2 in MDR1-overexpressing CRC cells improved degradation of KRASG12C or MEK1/2 and overall therapeutic responses. Our findings establish degradation of KRASG12C or MEK1/2 similarly induces ErbB3 activity and downstream AKT-signaling that is observed with small molecule inhibition, signifying that blockade of compensatory ErbB3 signaling will also be required for KRASG12C or MEK1/2 degraders therapies to achieve durable response in CRC cells. ErbB receptor signaling has been shown to promote resistance to a variety of target agents including pan-Tyrosine Kinases (TK), AKT, RAF, MEK, and ERK inhibitors (60), and several PROTACs targeting these kinases have recently emerged. Determining whether lapatinib can globally improve degradation efficiency in combination with other PROTACs targeting KRAS effector pathways, as well as exploring lapatinib in combination with KRASG12C or MEK1/2 degraders in other KRAS-driven cancers such as lung and pancreatic cancers, will be of particular interest. Our preliminary in vivo studies suggest that combining lapatinib and MEK degrader MS934 could have anti-tumor properties in KRAS-mutant CRCs, however, more comprehensive in vivo studies exploring additional MDR1-overexpressing tumor models, as well as the potential cytotoxic effects of these combinations will be essential for therapeutic proof-of-concept studies.
MATERIALS AND METHODS
Cell Lines
Cell lines were verified by IDEXX laboratories and free of mycoplasma. A1847(CVCL_9274) cell line was obtained from the Fox Chase Cancer Center (FCCC) Cell Culture Facility (Philadelphia, PA; deposited by Dr. Thomas Hamilton). CAKI-1(CVCL_0234), COLO320(CVCL_1989), DLD-1(CVCL_0248), HCT 15(CVCL_0292), HCT-116(CVCL_0291), MDA-MB-436(CVCL_0623), NCI-H747(CVCL_1587), PC-3(CVCL_0035), SF295(CVCL_1690), SW620(CVCL_0547), SW837(CVCL_1729), SW948(CVCL_0632), SW1116(CVCL_0544), and SW1463(CVCL_1718) cell lines were maintained in roswell park memorial institute (RPMI)-1640 supplemented with 10% fetal bovine serum (FBS), 100 U/ml Penicillin-Streptomycin and 2mM GlutaMAX. A1847, SUM159PT(CVCL_5423), and OVCAR3(CVCL_0465) cell lines were maintained in RPMI-1640 supplemented with 10% FBS, 100 U/ml Penicillin-Streptomycin, 2mM GlutaMAX, and 5 μg/mL insulin. LNCaP(CVCL_0395), LS513(CVCL_1386) and LS1034(CVCL_1382) cells were maintained in RPMI-1640 supplemented with 10% FBS, 100 U/ml Penicillin-Streptomycin, 2mM GlutaMAX, 1mM Sodium Pyruvate and 10mM HEPES. SKCO1(CVCL_0626) cells were maintained in minimum essential media (MEM) supplemented with 10% FBS, 100 U/ml Penicillin-Streptomycin, 2mM GlutaMAX and 1mM Sodium Pyruvate. All PROTAC-resistant cells were maintained with 500nM PROTACs in the medium. All cells were kept at 37°C in a 5% CO2 incubator.
Compounds
MEK1/2 degraders MS432 and MS934 have been previously described (33). All other compounds used are listed in table S1.
Western Blotting
Samples were harvested in lysis buffer (50 mM HEPES (pH 7.5), 0.5% Triton X-100, 150 mM NaCl, 1 mM EDTA, 1 mM EGTA, 10 mM sodium fluoride, 2.5 mM sodium orthovanadate, 1X protease inhibitor cocktail (Roche), and 1% each of phosphatase inhibitor cocktails 2 and 3 (Sigma)). Particulate was removed by centrifugation of lysates at 21,000 rpm for 15 minutes at 4°C. Lysates were subjected to sodium dodecyl sulfate-polyacrylamide gel electrophoresis (SDS-PAGE) chromatography and transferred to PVDF membranes before western blotting with primary antibodies (table S1). Secondary HRP-anti-rabbit and HRP-anti-mouse were obtained from ThermoFisher Scientific. SuperSignal West Pico and Femto Chemiluminescent Substrates (Thermo) were used to visualize blots. Western blot images were quantified using the Analyze>Gels function in Image J open-source software (National Institutes of Health). Optical density values for total protein levels were normalized by GAPDH. DC50 (the concentration where 50% of protein has been degraded) plots and values were calculated using PRISM software. Samples were run in biological triplicates (N=3) and Student’s t-tests were performed for statistical analyses and P values ≤ 0.05 were considered significant.
Growth Assays
For short-term growth assays, 1000–5000 cells were plated per well in 96-well plates and allowed to adhere and equilibrate overnight. Drug was added the following morning and after 120 h of drug treatment, cell viability was assessed using the CellTiter-Glo Luminescent cell viability assay according to manufacturer (Promega). Samples were run in biological triplicates (N=3) and Student’s t-tests were performed for statistical analyses and p values ≤ 0.05 were considered significant. For long term colony formation assays, cells were plated in 24-well dishes (1000–5000 cells per well) and incubated overnight before continuous drug treatment for 2 weeks, with drug and medium replenished twice weekly. Following the final treatment, cells were rinsed with PBS and fixed with chilled methanol for 10 min at −20°C. Methanol was removed by aspiration, and cells were stained with 0.5% crystal violet in 20% methanol for 1 h at room temperature. Samples were run in biological triplicates (N=3).
qRT-PCR
GeneJET RNA purification kit (Thermo Scientific) was used to isolate RNA from cells according to manufacturer’s instructions. qRT-PCR on diluted cDNA was performed with inventoried TaqMan Gene Expression Assays on the Applied Biosystems 7500 Fast Real-Time PCR System. The TaqMan Gene Expression Assay probes (ThermoFisher Scientific) used to assess changes in gene expression include ABCB1 (Assay ID: Hs00184500_m1), and ACTB (control) (Cat # 4326315E). Samples were run in biological triplicates (N=3) and Student’s t-tests were performed for statistical analyses and P values ≤ 0.05 were considered significant.
CpG Bisulfite Amplicon Sequencing of ABCB1
Genomic DNA (250–500ng) was converted by sodium bisulfite using the EZ DNA Methylation-Lightning kit (Zymo Research), according to the manufacturer’s instructions. Nested PCR was used to amplify the converted DNA using the following primer pairs (61): 5’-TATTAAATAAAGGATGAATAGATGTAATTTAG-3’ plus 5’-AAAACAAACTAATTACCTTTTATTATTCAAT-3’, and 5’-TTGTTAAGTATGTTGAAGAAAGATTATTGT-3’ plus 5’-AAAACAAACTAATTACCTTTTATTATTCAAT-3’. PCR products were sent to the MGH CCIB DNA Core Facility for amplicon sequencing. After trimming adapter sequencing, the sequences of interest were aligned to the converted hg38 genome using Bowtie2 and Bismark; bedgraph files were then extracted, as they provide exact locations and percent of methylation.
RNAi-mediated knockdown
Small interfering RNAs (siRNA) transfections were performed using 25 nM siRNA duplex and the reverse transfection protocol. 3000–5000 cells per well were added to 96-well plates with media containing the siRNA (table S1) and transfection reagent (Lipofectamine RNAiMax) according to the manufacturer’s instructions. Cells were allowed to grow for 120 hours after transfection prior to CellTiter-Glo (Promega) analysis. Two to three independent experiments were performed with each cell line and siRNA. Samples were run in biological triplicates (N=3) and Student’s t-tests were performed for statistical analyses and P values ≤ 0.05 were considered significant. For Western blot (immunoblotting) studies, the same procedure was performed with volumes and cell numbers proportionally scaled to a 60mm or 10 cm dish, and cells were collected 72 hours after transfection.
Drug Synergy Analysis
Drug synergy was determined using SynergyFinder using the Bliss model and viability as the readout (https://doi.org/10.1093/nar/gkaa216). Each drug combination was tested in triplicate.
Immunofluorescence
Cells were plated in a six-well plate with an 18-mm2 glass coverslip inside each well. Cells were fixed with 4% paraformaldehyde, permeabilized with 0.1% Triton X-100, blocked with 5% goat serum, and incubated with primary antibody (1:1000, anti-MDR1, Cell Signaling Technology) overnight at 4°C. The slides were washed with PBS and treated with secondary antibody (1:1000, FITC AffiniPure Donkey Anti-Rabbit IgG, Jackson Immunoresearch) for 1 h at room temperature. Following antibody incubation, coverslips were mounted on slides using ProLong Gold Antifade Reagent with DAPI (4′,6-diamidino-2-phenylindole) (Thermo Fisher Scientific) and allowed to set overnight. Images were taken with a Nikon NI-U fluorescent microscope at 40x magnification. Images presented in Figure 2 are representative of biological triplicates analyzed.
Rhodamine 123 Efflux Assay
Efflux assay was performed according to manufacturer’s protocol (Millipore Sigma #ECM910). Cells were resuspended in cold efflux buffer and incubated with Rhodamine 123 for 1 h on ice. Cells were centrifuged and treated in warm efflux buffer with DMSO or drug for 30–60 min, washed with cold phosphate-buffered saline (PBS), and effluxed dye was quantified with a plate reader at an excitation wavelength of 485 nm and an emission wavelength of 530 nm. Samples were run in biological triplicates (N=3) and Student’s t-tests were performed for statistical analyses and P values ≤ 0.05 were considered significant.
CRBN NanoBRET Target Engagement Assays
The NanoBRET™ TE Intracellular CRBN E3 Ligase Assay (Promega) was performed according to manufacturer’s instructions in live-cell mode. Briefly, cells were transfected with DDB1 Expression Vector and NanoLuc®-CRBN Fusion Vector at a 9:1 ratio. The next day, cells were collected and seeded in 96-well white non-binding surface microplates at 17,000 cells/well. NanoBRET™ Tracer Reagent was added at a final concentration of 500 nM followed by serially diluted PROTAC. After shaking, the plate was incubated at 37°C/5% CO2 for 2 h. The plate was removed from the incubator and equilibrated at room temperature for 15 min prior to addition of the complete substrate plus inhibitor solution. BRET was measured using a PerkinElmer EnVision Multilabel Reader with the EnVision Optimized Label-NanoBRET filter set: 585 nm dichroic mirror and 460/80 nm and 647/75 nm filters approximately 3 min following addition of substrate + inhibitor solution. MilliBRET units were calculated by dividing the acceptor emission value by the donor emission value and multiplying by 1000. Units were then normalized to DMSO controls. Samples were run in biological triplicates (N=3) and Student’s t-tests were performed for statistical analyses and P values ≤ 0.05 were considered significant.
Single Run Total Proteomics and Nano LC MS/MS
Parental or PROTAC-resistant cells were lysed in a buffer containing 50 mM HEPES pH 8.0 + 4% SDS, and 100 μg of protein was digested using LysC for 3 hours and trypsin overnight. Digested peptides were isolated using C-18 and PGC columns, then dried and cleaned with ethyl acetate. Three μg of proteolytic peptides were resuspended in 0.1% formic acid and separated with a Thermo Scientific RSLC nano Ultimate 3000 LC on a Thermo Scientific Easy-Spray C-18 PepMap 75 μm x 50 cm C-18 2 μm column. A 305 min gradient of 2–20% (180 min) 20%−28% (45 min) 28%−48% (20 min) acetonitrile with 0.1% formic acid was run at 300 nL/min at 50C. Eluted peptides were analyzed by Thermo Scientific Q Exactive or Q Exactive plus mass spectrometers utilizing a top 15 methodology in which the 15 most intense peptide precursor ions were subjected to fragmentation. The AGC for MS1 was set to 3×10⁶ with a max injection time of 120 ms, the AGC for MS2 ions was set to 1×10⁵ with a max injection time of 150 ms, and the dynamic exclusion was set to 90 s.
Proteomics Data Processing
Raw data analysis of LFQ experiments was performed using MaxQuant software 1.6.0.1 and searched using Andromeda 1.5.6.0 against the Swiss-Prot human protein database (downloaded on April 24, 2019, 20402 entries). The search was set up for full tryptic peptides with a maximum of two missed cleavage sites. All settings were default and searched using acetylation of protein N-terminus and oxidized methionine as variable modifications. Carbamidomethylation of cysteine was set as fixed modification. The precursor mass tolerance threshold was set at 10 ppm and maximum fragment mass error was 0.02 Da. LFQ quantitation was performed using MaxQuant with the following parameters; LFQ minimum ratio count: Global parameters for protein quantitation were as follows: label minimum ratio count: 1, peptides used for quantitation: unique, only use modified proteins selected and with normalized average ratio estimation selected. Match between runs was employed for LFQ quantitation and the significance threshold of the ion score was calculated based on a false discovery rate of < 1%. MaxQuant normalized LFQ values were imported into Perseus software (1.6.2.3) and filtered in the following manner: Proteins identified by site only were removed, reverse, or potential contaminant were removed then filtered for proteins identified by >1 unique peptide. Protein LFQ values were log2 transformed, filtered for a minimum percent in runs (100%), annotated, and subjected to a Student’s t-test with comparing PROTAC-resistant cells vs. parental cells. Samples were run in biological triplicates (N=3). Parameters for the Student’s t-test were the following: S0=2, two-sided using Permutation-based FDR <0.05. Volcano plots depicting differences in protein abundance were generated using R studio software and Prism graphics.
Tumor xenograft experiment
Animal studies were conducted in accordance with the guidelines set forth by the Institutional Animal Care and Use Committee (Fox Chase Cancer Center institutional animal care and use committee (IACUC) # 16–16). 1 × 10⁶ LS513 cells were prepared in growth factor reduced Matrigel (Corning) 1:1 and injected into the right flank of 6- to 8-week-old male and female nude mice (Model #: NCRNU, Genotype: sp/sp, Nomenclature: CrTac:NCr-Foxn1nu) (Taconic Biosciences). Mice were randomly split into the following treatment arms: vehicle, MS934 (50 mg/kg), Lapatinib (100 mg/kg) or the combination (using the same dose as monotherapies) and treatments started when tumors reached approximately 150 mm3 and maintained for two weeks. Investigators were not blinded to group identity. Five mice (N=5) were in each treatment group. With 5 animals per group, we were able to detect a difference of 0.34 in the rates of tumor growth (between any two groups) and achieve 80% power at the 0.05 significance level. This is based on unit standard deviation for the logarithm of tumor volume and assumes a correlation of 0.5 for serial measurements for each mouse. For in vivo studies, MS934 was resuspended in 5% N-methyl-2-pyrrolidinone (NMP), 5% Kolliphor HS-15 (Sigma) and 90% saline and delivered by intraperitoneal injection daily. Lapatinib was resuspended in 0.5% hydroxypropyl methylcellulose (Sigma) and 0.2% Tween-80 in distilled water pH 8.0 and delivered by oral gavage daily. Tumor volumes were evaluated every two days using a caliper and the volume was calculated applying the following formula: [(width)2 × (length)]/2. Body weight of animals was determined to evaluate potential toxicities of drug treatments. Student’s t-tests were performed for statistical analyses on tumor volumes and body weights on day 14 comparing treatments and P values ≤ 0.05 were considered significant.
Fluorescence in situ hybridization (FISH).
For interphase FISH analysis, cells were spotted onto Shandon single circle cytoslides (Fisher Scientific, Waltham, MA). For Giemsa-banding and metaphase FISH, cells were first treated for 20 min with Colcemid (0.03 μg/ml), trypsinized, transferred to hypotonic KCI (0.075 M) for 20 min at 37°C, fixed in several changes of methanol:acetic acid (3:1), and then the metaphase slide preparations were steam-dried (62). DNA probes consisted of a prelabeled orange ABCB1 probe (7q21.12) (Empire Genomics, Williamsville, NY) and a prelabeled green XCE 7 centromere enumeration probe (MetaSystems, Medford, MA). The latter probe was used as a differentially labeled reference probe for the same chromosome as the locus of interest, to permit distinguishing between polysomy and amplification of the co-hybridized test probe (ABCB1). Denaturation, co-hybridization, and detection of the probe signals were performed basically according to the manufacturers’ instructions. Some images of interphase nuclei were captured with a MetaSystems Metafer microscope workstation, and then the raw images were extracted and processed to depict colocalization of ABCB1 signals (orange) and XCE 7 (7 centromere) signals (green) on 4′,6-diamidino-2-phenylindole (DAPI)-stained, blue-fluorescent nuclei and metaphase chromosomes. Other images of interphase nuclei and all images of metaphases were captured with a Zeiss Axio M2 microscope (Dublin, CA), computer-operated with ISIS software (MetaSystems, Medford, MA). Merged images of separate orange, green, and blue digitized photographs result in ABCB1 probe signals appearing reddish-purple (fuchsia) and XCE 7 centromere probe signals appearing cyan on blue nuclei. Electronically inverted images of FISH-labeled metaphase spreads result in simulated G-banded chromosomes, with ABCB1 probe signals appearing red and centromere 7 signals appearing green.
Statistical analysis
For statistical analyses, Student’s t-tests were performed using Microsoft Excel (Version 16.16.27) software and P values ≤ 0.05 were considered significant. Proteomics statistical analysis were performed using Perseus software (1.6.2.3) and parameters for the Student’s t-test were the following: S0=2, two-sided using Permutation-based FDR <0.05.
Supplementary Material
Funding.
This study was supported by funding from NIH CORE Grant CA06927 (Fox Chase Cancer Center), R01 CA211670 (J.S.D.), NIH T32 CA009035 (A.M.K), and Liz Tilberis Award Ovarian Cancer Research Alliance, 648813 (J.S.D). Work performed by J.J. utilized the NMR Spectrometer Systems at Mount Sinai acquired with funding from National Institutes of Health SIG grants 1S10OD025132 and 1S10OD028504. Work performed by J.R.T. was supported by NCI P30 CA06927 to Fox Chase Cancer Center. Work in the Bellacosa laboratory was supported by Melanoma Research Alliance grant 693670, American Lung Association grant 817618, and DOD LCRP grant W81XWH-21-1-0648.
Footnotes
Competing interests: J.S.D. is an inventor on patent application WO2021026349A1 for using PROTACs in combination with dual MDR1 and kinase inhibitors for the treatment of cancer. J.J. and J. H. are inventors of a patent application filed by Icahn School of Medicine at Mount Sinai. The Jin laboratory received research funds from Celgene Corporation, Levo Therapeutics, Cullgen Inc. and Cullinan Oncology. J.J. is a cofounder and equity shareholder in Cullgen Inc. and a consultant for Cullgen Inc., EpiCypher Inc., and Accent Therapeutics Inc. The other authors declare that they have no competing interests related to this project.
Data materials availability:
The proteomics data are available through the PRIDE partner repository with the dataset identifier PXD029233. All other data needed to evaluate the conclusions in the paper are present in the paper or the Supplementary Materials.
REFERENCES AND NOTES
- 1.Neklesa TK, Winkler JD, Crews CM, Targeted protein degradation by PROTACs. Pharmacol. Ther. 174, 138–144 (2017). [DOI] [PubMed] [Google Scholar]
- 2.Bondeson DP, Smith BE, Burslem GM, Buhimschi AD, Hines J, Jaime-Figueroa S, Wang J, Hamman BD, Ishchenko A, Crews CM, Lessons in PROTAC Design from Selective Degradation with a Promiscuous Warhead. Cell Chemical Biology 25, 78–87.e75 (2018). [DOI] [PMC free article] [PubMed] [Google Scholar]
- 3.Lai AC, Crews CM, Induced protein degradation: an emerging drug discovery paradigm. Nat Rev Drug Discov 16, 101–114 (2017). [DOI] [PMC free article] [PubMed] [Google Scholar]
- 4.Nalawansha DA, Crews CM, PROTACs: An Emerging Therapeutic Modality in Precision Medicine. Cell Chem Biol 27, 998–1014 (2020). [DOI] [PMC free article] [PubMed] [Google Scholar]
- 5.Yu F, Cai M, Shao L, Zhang J, Targeting Protein Kinases Degradation by PROTACs. Frontiers in Chemistry 9, (2021). [DOI] [PMC free article] [PubMed] [Google Scholar]
- 6.Vogelmann A, Robaa D, Sippl W, Jung M, Proteolysis targeting chimeras (PROTACs) for epigenetics research. Curr. Opin. Chem. Biol. 57, 8–16 (2020). [DOI] [PubMed] [Google Scholar]
- 7.Bond MJ, Chu L, Nalawansha DA, Li K, Crews CM, Targeted Degradation of Oncogenic KRAS(G12C) by VHL-Recruiting PROTACs. ACS central science 6, 1367–1375 (2020). [DOI] [PMC free article] [PubMed] [Google Scholar]
- 8.Vasan N, Baselga J, Hyman DM, A view on drug resistance in cancer. Nature 575, 299–309 (2019). [DOI] [PMC free article] [PubMed] [Google Scholar]
- 9.Ottis P, Palladino C, Thienger P, Britschgi A, Heichinger C, Berrera M, Julien-Laferriere A, Roudnicky F, Kam-Thong T, Bischoff JR, Martoglio B, Pettazzoni P, Cellular Resistance Mechanisms to Targeted Protein Degradation Converge Toward Impairment of the Engaged Ubiquitin Transfer Pathway. ACS Chem. Biol. 14, 2215–2223 (2019). [DOI] [PubMed] [Google Scholar]
- 10.Shirasaki R, Matthews GM, Gandolfi S, de Matos Simoes R, Buckley DL, Raja Vora J, Sievers QL, Brüggenthies JB, Dashevsky O, Poarch H, Tang H, Bariteau MA, Sheffer M, Hu Y, Downey-Kopyscinski SL, Hengeveld PJ, Glassner BJ, Dhimolea E, Ott CJ, Zhang T, Kwiatkowski NP, Laubach JP, Schlossman RL, Richardson PG, Culhane AC, Groen RWJ, Fischer ES, Vazquez F, Tsherniak A, Hahn WC, Levy J, Auclair D, Licht JD, Keats JJ, Boise LH, Ebert BL, Bradner JE, Gray NS, Mitsiades CS, Functional Genomics Identify Distinct and Overlapping Genes Mediating Resistance to Different Classes of Heterobifunctional Degraders of Oncoproteins. Cell Reports 34, 108532 (2021). [DOI] [PMC free article] [PubMed] [Google Scholar]
- 11.Zhang L, Riley-Gillis B, Vijay P, Shen Y, Acquired Resistance to BET-PROTACs(Proteolysis Targeting Chimeras) Caused by Genomic Alterations in Core Components of E3 ligase Complexes. Mol. Cancer Ther, molcanther.1129.2018 (2019). [DOI] [PubMed] [Google Scholar]
- 12.Fletcher JI, Williams RT, Henderson MJ, Norris MD, Haber M, ABC transporters as mediators of drug resistance and contributors to cancer cell biology. Drug resistance updates : reviews and commentaries in antimicrobial and anticancer chemotherapy 26, 1–9 (2016). [DOI] [PubMed] [Google Scholar]
- 13.Zhang C, Han X-R, Yang X, Jiang B, Liu J, Xiong Y, Jin J, Proteolysis Targeting Chimeras (PROTACs) of Anaplastic Lymphoma Kinase (ALK). Eur. J. Med. Chem. 151, 304–314 (2018). [DOI] [PMC free article] [PubMed] [Google Scholar]
- 14.Coscia F, Watters KM, Curtis M, Eckert MA, Chiang CY, Tyanova S, Montag A, Lastra RR, Lengyel E, Mann M, Integrative proteomic profiling of ovarian cancer cell lines reveals precursor cell associated proteins and functional status. Nature Communications 7, 12645 (2016). [DOI] [PMC free article] [PubMed] [Google Scholar]
- 15.Cox J, Hein MY, Luber CA, Paron I, Nagaraj N, Mann M, Accurate Proteome-wide Label-free Quantification by Delayed Normalization and Maximal Peptide Ratio Extraction, Termed MaxLFQ. Molecular & Cellular Proteomics : MCP 13, 2513–2526 (2014). [DOI] [PMC free article] [PubMed] [Google Scholar]
- 16.Winter GE, Mayer A, Buckley DL, Erb MA, Roderick JE, Vittori S, Reyes JM, di Iulio J, Souza A, Ott CJ, Roberts JM, Zeid R, Scott TG, Paulk J, Lachance K, Olson CM, Dastjerdi S, Bauer S, Lin CY, Gray NS, Kelliher MA, Churchman LS, Bradner JE, BET Bromodomain Proteins Function as Master Transcription Elongation Factors Independent of CDK9 Recruitment. Mol. Cell 67, 5–18.e19 (2017). [DOI] [PMC free article] [PubMed] [Google Scholar]
- 17.Zengerle M, Chan K-H, Ciulli A, Selective Small Molecule Induced Degradation of the BET Bromodomain Protein BRD4. ACS Chem. Biol. 10, 1770–1777 (2015). [DOI] [PMC free article] [PubMed] [Google Scholar]
- 18.Olson CM, Jiang B, Erb MA, Liang Y, Doctor ZM, Zhang Z, Zhang T, Kwiatkowski N, Boukhali M, Green JL, Haas W, Nomanbhoy T, Fischer ES, Young RA, Bradner JE, Winter GE, Gray NS, Pharmacological perturbation of CDK9 using selective CDK9 inhibition or degradation. Nat. Chem. Biol. 14, 163–170 (2018). [DOI] [PMC free article] [PubMed] [Google Scholar]
- 19.Katayama K, Noguchi K, Sugimoto Y, Regulations of P-Glycoprotein/ABCB1/MDR1 in Human Cancer Cells. New Journal of Science 2014, 476974 (2014). [Google Scholar]
- 20.Mancarella C, Scotlandi K, IGF2BP3 From Physiology to Cancer: Novel Discoveries, Unsolved Issues, and Future Perspectives. Frontiers in Cell and Developmental Biology 7, 363 (2020). [DOI] [PMC free article] [PubMed] [Google Scholar]
- 21.Jouan E, Le Vée M, Mayati A, Denizot C, Parmentier Y, Fardel O, Evaluation of P-Glycoprotein Inhibitory Potential Using a Rhodamine 123 Accumulation Assay. Pharmaceutics 8, 12 (2016). [DOI] [PMC free article] [PubMed] [Google Scholar]
- 22.Riching KM, Schwinn MK, Vasta JD, Robers MB, Machleidt T, Urh M, Daniels DL, CDK Family PROTAC Profiling Reveals Distinct Kinetic Responses and Cell Cycle–Dependent Degradation of CDK2. SLAS DISCOVERY: Advancing the Science of Drug Discovery 26, 560–569 (2020). [DOI] [PubMed] [Google Scholar]
- 23.Genovese I, Ilari A, Assaraf YG, Fazi F, Colotti G, Not only P-glycoprotein: Amplification of the ABCB1-containing chromosome region 7q21 confers multidrug resistance upon cancer cells by coordinated overexpression of an assortment of resistance-related proteins. Drug Resistance Updates 32, 23–46 (2017). [DOI] [PubMed] [Google Scholar]
- 24.Storlazzi CT, Lonoce A, Guastadisegni MC, Trombetta D, D’Addabbo P, Daniele G, L’Abbate A, Macchia G, Surace C, Kok K, Ullmann R, Purgato S, Palumbo O, Carella M, Ambros PF, Rocchi M, Gene amplification as double minutes or homogeneously staining regions in solid tumors: origin and structure. Genome Res. 20, 1198–1206 (2010). [DOI] [PMC free article] [PubMed] [Google Scholar]
- 25.Reed K, Hembruff SL, Sprowl JA, Parissenti AM, The temporal relationship between ABCB1 promoter hypomethylation, ABCB1 expression and acquisition of drug resistance. The Pharmacogenomics Journal 10, 489–504 (2010). [DOI] [PubMed] [Google Scholar]
- 26.Vaidyanathan A, Sawers L, Gannon A-L, Chakravarty P, Scott AL, Bray SE, Ferguson MJ, Smith G, ABCB1 (MDR1) induction defines a common resistance mechanism in paclitaxel- and olaparib-resistant ovarian cancer cells. Br. J. Cancer 115, 431–441 (2016). [DOI] [PMC free article] [PubMed] [Google Scholar]
- 27.Weidner LD, Fung KL, Kannan P, Moen JK, Kumar JS, Mulder J, Innis RB, Gottesman MM, Hall MD, Tariquidar Is an Inhibitor and Not a Substrate of Human and Mouse P-glycoprotein. Drug Metab. Dispos. 44, 275–282 (2016). [DOI] [PMC free article] [PubMed] [Google Scholar]
- 28.Pusztai L, Wagner P, Ibrahim N, Rivera E, Theriault R, Booser D, Symmans FW, Wong F, Blumenschein G, Fleming DR, Rouzier R, Boniface G, Hortobagyi GN, Phase II study of tariquidar, a selective P-glycoprotein inhibitor, in patients with chemotherapy-resistant, advanced breast carcinoma. Cancer 104, 682–691 (2005). [DOI] [PubMed] [Google Scholar]
- 29.Cerami E, Gao J, Dogrusoz U, Gross BE, Sumer SO, Aksoy BA, Jacobsen A, Byrne CJ, Heuer ML, Larsson E, Antipin Y, Reva B, Goldberg AP, Sander C, Schultz N, The cBio cancer genomics portal: an open platform for exploring multidimensional cancer genomics data. Cancer Discov. 2, 401–404 (2012). [DOI] [PMC free article] [PubMed] [Google Scholar]
- 30.Gao J, Aksoy BA, Dogrusoz U, Dresdner G, Gross B, Sumer SO, Sun Y, Jacobsen A, Sinha R, Larsson E, Cerami E, Sander C, Schultz N, Integrative Analysis of Complex Cancer Genomics and Clinical Profiles Using the cBioPortal. Science signaling 6, pl1–pl1 (2013). [DOI] [PMC free article] [PubMed] [Google Scholar]
- 31.Uhlén M, Fagerberg L, Hallström BM, Lindskog C, Oksvold P, Mardinoglu A, Sivertsson Å, Kampf C, Sjöstedt E, Asplund A, Olsson I, Edlund K, Lundberg E, Navani S, Szigyarto CA, Odeberg J, Djureinovic D, Takanen JO, Hober S, Alm T, Edqvist PH, Berling H, Tegel H, Mulder J, Rockberg J, Nilsson P, Schwenk JM, Hamsten M, von Feilitzen K, Forsberg M, Persson L, Johansson F, Zwahlen M, von Heijne G, Nielsen J, Pontén F, Proteomics. Tissue-based map of the human proteome. Science 347, 1260419 (2015). [DOI] [PubMed] [Google Scholar]
- 32.Cromm PM, Samarasinghe KTG, Hines J, Crews CM, Addressing Kinase-Independent Functions of Fak via PROTAC-Mediated Degradation. J. Am. Chem. Soc. 140, 17019–17026 (2018). [DOI] [PubMed] [Google Scholar]
- 33.Hu J, Wei J, Yim H, Wang L, Xie L, Jin MS, Kabir M, Qin L, Chen X, Liu J, Jin J, Potent and Selective Mitogen-Activated Protein Kinase Kinase 1/2 (MEK1/2) Heterobifunctional Small-molecule Degraders. J. Med. Chem. 63, 15883–15905 (2020). [DOI] [PMC free article] [PubMed] [Google Scholar]
- 34.Lai J-I, Tseng Y-J, Chen M-H, Huang C-YF, Chang PM-H, Clinical Perspective of FDA Approved Drugs With P-Glycoprotein Inhibition Activities for Potential Cancer Therapeutics. Front. Oncol. 10, 2336 (2020). [DOI] [PMC free article] [PubMed] [Google Scholar]
- 35.Ansbro MR, Shukla S, Ambudkar SV, Yuspa SH, Li L, Screening compounds with a novel high-throughput ABCB1-mediated efflux assay identifies drugs with known therapeutic targets at risk for multidrug resistance interference. PLoS One 8, e60334–e60334 (2013). [DOI] [PMC free article] [PubMed] [Google Scholar]
- 36.Dai C.-l., Tiwari AK, Wu C-P, Su X-D, Wang S-R, Liu D.-g., Ashby CR, Huang Y, Robey RW, Liang Y.-j., Chen L.-m., Shi C-J, Ambudkar SV, Chen Z-S, Fu L.-w., Lapatinib (Tykerb, GW572016) reverses multidrug resistance in cancer cells by inhibiting the activity of ATP-binding cassette subfamily B member 1 and G member 2. Cancer Res. 68, 7905–7914 (2008). [DOI] [PMC free article] [PubMed] [Google Scholar]
- 37.Minocha M, Khurana V, Qin B, Pal D, Mitra AK, Co-administration strategy to enhance brain accumulation of vandetanib by modulating P-glycoprotein (P-gp/Abcb1) and breast cancer resistance protein (Bcrp1/Abcg2) mediated efflux with m-TOR inhibitors. Int. J. Pharm. 434, 306–314 (2012). [DOI] [PMC free article] [PubMed] [Google Scholar]
- 38.The N Cancer Genome Atlas, Comprehensive Molecular Characterization of Human Colon and Rectal Cancer. Nature 487, 330–337 (2012). [DOI] [PMC free article] [PubMed] [Google Scholar]
- 39.Pharmacogenomic agreement between two cancer cell line data sets. Nature 528, 84–87 (2015). [DOI] [PMC free article] [PubMed] [Google Scholar]
- 40.Sun C, Hobor S, Bertotti A, Zecchin D, Huang S, Galimi F, Cottino F, Prahallad A, Grernrum W, Tzani A, Schlicker A, Wessels Lodewyk F. A., Smit Egbert F., Thunnissen E, Halonen P, Lieftink C, Beijersbergen Roderick L., Di Nicolantonio F, Bardelli A, Trusolino L, Bernards R, Intrinsic Resistance to MEK Inhibition in KRAS Mutant Lung and Colon Cancer through Transcriptional Induction of ERBB3. Cell Reports 7, 86–93 (2014). [DOI] [PubMed] [Google Scholar]
- 41.Barretina J, Caponigro G, Stransky N, Venkatesan K, Margolin AA, Kim S, Wilson CJ, Lehár J, Kryukov GV, Sonkin D, Reddy A, Liu M, Murray L, Berger MF, Monahan JE, Morais P, Meltzer J, Korejwa A, Jané-Valbuena J, Mapa FA, Thibault J, Bric-Furlong E, Raman P, Shipway A, Engels IH, Cheng J, Yu GK, Yu J, Aspesi P, de Silva M, Jagtap K, Jones MD, Wang L, Hatton C, Palescandolo E, Gupta S, Mahan S, Sougnez C, Onofrio RC, Liefeld T, MacConaill L, Winckler W, Reich M, Li N, Mesirov JP, Gabriel SB, Getz G, Ardlie K, Chan V, Myer VE, Weber BL, Porter J, Warmuth M, Finan P, Harris JL, Meyerson M, Golub TR, Morrissey MP, Sellers WR, Schlegel R, Garraway LA, The Cancer Cell Line Encyclopedia enables predictive modelling of anticancer drug sensitivity. Nature 483, 603–607 (2012). [DOI] [PMC free article] [PubMed] [Google Scholar]
- 42.Misale S, Fatherree JP, Cortez E, Li C, Bilton S, Timonina D, Myers DT, Lee D, Gomez-Caraballo M, Greenberg M, Nangia V, Greninger P, Egan RK, McClanaghan J, Stein GT, Murchie E, Zarrinkar PP, Janes MR, Li LS, Liu Y, Hata AN, Benes CH, KRAS G12C NSCLC Models Are Sensitive to Direct Targeting of KRAS in Combination with PI3K Inhibition. Clin. Cancer Res. 25, 796–807 (2019). [DOI] [PubMed] [Google Scholar]
- 43.Amodio V, Yaeger R, Arcella P, Cancelliere C, Lamba S, Lorenzato A, Arena S, Montone M, Mussolin B, Bian Y, Whaley A, Pinnelli M, Murciano-Goroff YR, Vakiani E, Valeri N, Liao WL, Bhalkikar A, Thyparambil S, Zhao HY, de Stanchina E, Marsoni S, Siena S, Bertotti A, Trusolino L, Li BT, Rosen N, Di Nicolantonio F, Bardelli A, Misale S, EGFR Blockade Reverts Resistance to KRAS(G12C) Inhibition in Colorectal Cancer. Cancer Discov. 10, 1129–1139 (2020). [DOI] [PMC free article] [PubMed] [Google Scholar]
- 44.Ambudkar SV, Kimchi-Sarfaty C, Sauna ZE, Gottesman MM, P-glycoprotein: from genomics to mechanism. Oncogene 22, 7468–7485 (2003). [DOI] [PubMed] [Google Scholar]
- 45.Szakács G, Annereau JP, Lababidi S, Shankavaram U, Arciello A, Bussey KJ, Reinhold W, Guo Y, Kruh GD, Reimers M, Weinstein JN, Gottesman MM, Predicting drug sensitivity and resistance: profiling ABC transporter genes in cancer cells. Cancer Cell 6, 129–137 (2004). [DOI] [PubMed] [Google Scholar]
- 46.Sun S, Cai J, Yang Q, Zhu Y, Zhao S, Wang Z, Prognostic Value and Implication for Chemotherapy Treatment of ABCB1 in Epithelial Ovarian Cancer: A Meta-Analysis. PLoS One 11, e0166058 (2016). [DOI] [PMC free article] [PubMed] [Google Scholar]
- 47.Chen KG, Sikic BI, Molecular pathways: regulation and therapeutic implications of multidrug resistance. Clinical cancer research : an official journal of the American Association for Cancer Research 18, 1863–1869 (2012). [DOI] [PMC free article] [PubMed] [Google Scholar]
- 48.Baker EK, Johnstone RW, Zalcberg JR, El-Osta A, Epigenetic changes to the MDR1 locus in response to chemotherapeutic drugs. Oncogene 24, 8061–8075 (2005). [DOI] [PubMed] [Google Scholar]
- 49.Chen KG, Sale S, Tan T, Ermoian RP, Sikic BI, CCAAT/enhancer-binding protein beta (nuclear factor for interleukin 6) transactivates the human MDR1 gene by interaction with an inverted CCAAT box in human cancer cells. Mol. Pharmacol. 65, 906 (2004). [DOI] [PubMed] [Google Scholar]
- 50.Liu R, Chen Y, Liu G, Li C, Song Y, Cao Z, Li W, Hu J, Lu C, Liu Y, PI3K/AKT pathway as a key link modulates the multidrug resistance of cancers. Cell Death Dis. 11, 797 (2020). [DOI] [PMC free article] [PubMed] [Google Scholar]
- 51.Saunus JM, Smart CE, Kutasovic JR, Johnston RL, Kalita-de Croft P, Miranda M, Rozali EN, Vargas AC, Reid LE, Lorsy E, Cocciardi S, Seidens T, McCart Reed AE, Dalley AJ, Wockner LF, Johnson J, Sarkar D, Askarian-Amiri ME, Simpson PT, Khanna KK, Chenevix-Trench G, Al-Ejeh F, Lakhani SR, Multidimensional phenotyping of breast cancer cell lines to guide preclinical research. Breast Cancer Res. Treat. 167, 289–301 (2018). [DOI] [PubMed] [Google Scholar]
- 52.Krchniakova M, Skoda J, Neradil J, Chlapek P, Veselska R, Repurposing Tyrosine Kinase Inhibitors to Overcome Multidrug Resistance in Cancer: A Focus on Transporters and Lysosomal Sequestration. Int J Mol Sci 21, 3157 (2020) 10.3390/ijms21093157). [DOI] [PMC free article] [PubMed] [Google Scholar]
- 53.Murugan AK, mTOR: Role in cancer, metastasis and drug resistance. Semin. Cancer Biol. 59, 92–111 (2019). [DOI] [PubMed] [Google Scholar]
- 54.Faes S, Demartines N, Dormond O, Mechanistic Target of Rapamycin Inhibitors in Renal Cell Carcinoma: Potential, Limitations, and Perspectives. Frontiers in Cell and Developmental Biology 9, 459 (2021). [DOI] [PMC free article] [PubMed] [Google Scholar]
- 55.Walsh N, Larkin A, Kennedy S, Connolly L, Ballot J, Ooi W, Gullo G, Crown J, Clynes M, O’Driscoll L, Expression of multidrug resistance markers ABCB1 (MDR-1/P-gp) and ABCC1 (MRP-1) in renal cell carcinoma. BMC Urol. 9, 6 (2009). [DOI] [PMC free article] [PubMed] [Google Scholar]
- 56.Hamada A, Miyano H, Watanabe H, Saito H, Interaction of imatinib mesilate with human P-glycoprotein. J. Pharmacol. Exp. Ther. 307, 824–828 (2003). [DOI] [PubMed] [Google Scholar]
- 57.D’Cunha R, Bae S, Murry DJ, An G, TKI combination therapy: strategy to enhance dasatinib uptake by inhibiting Pgp- and BCRP-mediated efflux. Biopharm. Drug Dispos. 37, 397–408 (2016). [DOI] [PubMed] [Google Scholar]
- 58.Uribe ML, Marrocco I, Yarden Y, EGFR in Cancer: Signaling Mechanisms, Drugs, and Acquired Resistance. Cancers (Basel) 13, (2021). [DOI] [PMC free article] [PubMed] [Google Scholar]
- 59.Opdam FL, Guchelaar H-J, Beijnen JH, Schellens JHM, Lapatinib for advanced or metastatic breast cancer. The oncologist 17, 536–542 (2012). [DOI] [PMC free article] [PubMed] [Google Scholar]
- 60.Arteaga CL, Engelman JA, ERBB receptors: from oncogene discovery to basic science to mechanism-based cancer therapeutics. Cancer Cell 25, 282–303 (2014). [DOI] [PMC free article] [PubMed] [Google Scholar]
- 61.Reed K, Hembruff SL, Laberge ML, Villeneuve DJ, Côté GB, Parissenti AM, Hypermethylation of the ABCB1 downstream gene promoter accompanies ABCB1 gene amplification and increased expression in docetaxel-resistant MCF-7 breast tumor cells. Epigenetics 3, 270–280 (2008). [DOI] [PubMed] [Google Scholar]
- 62.Testa JR, Getts LA, Salazar H, Liu Z, Handel LM, Godwin AK, Hamilton TC, Spontaneous transformation of rat ovarian surface epithelial cells results in well to poorly differentiated tumors with a parallel range of cytogenetic complexity. Cancer Res. 54, 2778–2784 (1994). [PubMed] [Google Scholar]
Associated Data
This section collects any data citations, data availability statements, or supplementary materials included in this article.
Supplementary Materials
Data Availability Statement
The proteomics data are available through the PRIDE partner repository with the dataset identifier PXD029233. All other data needed to evaluate the conclusions in the paper are present in the paper or the Supplementary Materials.