

Abstract
Objective
Abnormalities in impulse propagation and cardiac repolarization are frequent in hypertrophic cardiomyopathy (HCM), leading to abnormalities in 12-lead electrocardiograms (ECGs). Computational ECG analysis can identify electrophysiological and structural remodeling and predict arrhythmias. This requires accurate ECG segmentation. It is unknown whether current segmentation methods developed using datasets containing annotations for mostly normal heartbeats perform well in HCM. Here, we present a segmentation method to effectively identify ECG waves across 12-lead HCM ECGs.
Methods
We develop (1) a web-based tool that permits manual annotations of P, P′, QRS, R′, S′, T, T′, U, J, epsilon waves, QRS complex slurring, and atrial fibrillation by 3 experts and (2) an easy-to-implement segmentation method that effectively identifies ECG waves in normal and abnormal heartbeats. Our method was tested on 131 12-lead HCM ECGs and 2 public ECG sets to evaluate its performance in non-HCM ECGs.
Results
Over the HCM dataset, our method obtained a sensitivity of 99.2% and 98.1% and a positive predictive value of 92% and 95.3% when detecting QRS complex and T-offset, respectively, significantly outperforming a state-of-the-art segmentation method previously employed for HCM analysis. Over public ECG sets, it significantly outperformed 3 state-of-the-art methods when detecting P-onset and peak, T-offset, and QRS-onset and peak regarding the positive predictive value and segmentation error. It performed at a level similar to other methods in other tasks.
Conclusion
Our method accurately identified ECG waves in the HCM dataset, outperforming a state-of-the-art method, and demonstrated similar good performance as other methods in normal/non-HCM ECG sets.
Keywords: hypertrophic cardiomyopathy, electrocardiogram (ECG), delineation, segmentation, abnormalities
INTRODUCTION
Hypertrophic cardiomyopathy (HCM), the most common cardiac genetic disorder, is characterized by variable penetrance and phenotypic heterogeneity.1 Clinical presentation can vary from asymptomatic to exercise intolerance,2 heart failure, atrial fibrillation,3,4 and sudden cardiac death.5 The pathological hallmarks of HCM are myocyte hypertrophy, fibrosis, and arteriolar remodeling that can be reflected as abnormalities in the surface electrocardiogram (ECG).6–8 Previous studies analyzing HCM patient ECGs have reported abnormalities in the P-wave, QRS complex, ST segment and T-wave,8–12 as well as associations between ECG abnormalities and adverse outcomes.12,13
Computational ECG analysis has the potential to detect structural and electrical remodeling and assist with risk stratification for atrial and ventricular arrhythmias.13–15 The first step toward this goal is the accurate identification of the peaks and boundaries of ECG waves automatically—a process known as ECG segmentation. Various segmentation methods have been introduced to date based on machine learning, including Hidden Markov Models,16,17 Random Forests,18 deep neural networks,19–21 clustering techniques,22 Dynamic Time Warping,23–25 and specific rules.26–28 These methods were mostly developed using a well-known dataset, the QT set, containing annotations for mostly normal heartbeats in 2 leads.29 But it is unknown whether these methods perform well in HCM patients whose hearts have abnormal cardiac geometry, structural and/or electrical remodeling.30,31 Here, we present an easy-to-implement segmentation method to effectively identify the QRS complex, P, T, and U waves across 12-lead ECGs of HCM patients. We evaluate our method over 131 annotated 12-lead ECGs from HCM patients and non-HCM ECGs from the QT and Lobachevsky University Database (LUDB) datasets.29,32
MATERIALS AND METHODS
We first develop a web-based tool to collect cardiologist annotations for ECG waves in 12-lead ECGs of HCM patients. Next, we devise a segmentation method to automatically identify these waves. Figure 1 summarizes our overall study design.
Figure 1.

Overall study design. ECGs from HCM patients are first annotated by cardiologists to construct a dataset using a web-based tool that we developed. Using this dataset, we then devise a segmentation method as follows: (a) The representation of the ECG is reduced to a sequence of its significant points (shown by red circles). (b) Peak detection algorithm is applied to each heartbeat interval along the ECG to identify Q, R, S, R′, and S′ waves. (c) Boundary detection algorithm is applied to the first and last peaks in each QRS complex to identify the onset and offset (shown by red crosses). (d)–(g) Peak and boundary detection algorithms are recursively applied to the interval between each 2 consecutive QRS segments to identify T waves and then P and U waves. ECG: electrocardiogram; HCM: hypertrophic cardiomyopathy.
HCM and non-HCM ECG data
We collected 12-lead ECGs from 131 HCM patients (85 men, age 50 ± 15, 46 women, age 58 ± 13). The patients were randomly selected from a large pool of ∼1000 patients treated at the Johns Hopkins Hospital between 2005 and 2015. Each ECG was annotated by 2 physicians (from JM, GVG, SR, BS), and disagreements were resolved by a cardiologist (MRA) using our web-based tool. As shown in Figure 2, the tool enables annotation of P, P, Q, R, R, S, S, T, T, U, J, epsilon waves, slurring, atrial fibrillation, and onset/offset of P waves, QRS complexes, and T waves.
Figure 2.

Top: snippet of the web-based tool developed for expert annotation along with annotations made for lead II. Bottom: examples of irregular QRS complexes (1), biphasic T-wave (2), prominent T-wave (3), biphasic P-wave (4), fragmented P-wave (5), and atrial fibrillation (6) in the HCM dataset. HCM: hypertrophic cardiomyopathy.
The tool provides 2 modes of annotation: individual lead annotation, where each lead is annotated separately, and best lead annotation, where annotators choose the lead where waves boundaries are easiest to determine; the annotations are then automatically mapped across all leads. After mapping, the annotations can be modified for each lead separately, if needed. More details about patients’ demographics and the tool, including the URL address and access, are provided in Supplementary Material.
The HCM dataset represents several abnormalities, including fragmented or biphasic P waves, fragmentedQRS complexes containing additional waves, biphasic or prominent T waves, and atrial fibrillation. As shown in Figure 2, fragmented QRS complexes have additional waves, denoted R′, S′, J;33 P′ in biphasic or fragmented P-wave;34 T in biphasic T-wave;35 a wave of abnormally high amplitude in prominent T-wave,36 and irregular fluctuations of the baseline without distinct P-waves in atrial fibrillation.37 Notably, these abnormalities can lead to erroneous annotations by automated segmentation methods. Table 1 shows the number of heartbeats carrying each of these abnormalities within the set.
Table 1.
Distribution of heartbeats in the HCM dataset with fragmented/biphasic P-wave, QRS complex with extra waves, biphasic T-wave, and atrial fibrillation
| Characteristic | Total # of heartbeats = |
|---|---|
| QRS complex with R, S, and/or J waves | |
| Biphasic T-wave | |
| Biphasic and/or fragmented P-wave | |
| Atrial fibrillation |
HCM: hypertrophic cardiomyopathy.
We use the HCM dataset to develop and evaluate our segmentation method. We also evaluate our method using non-HCM ECGs from the QT29 and LUDB32 datasets. The QT set contains 3623 annotated heartbeats acquired via 2 leads, while LUDB contains 21 966 recorded via standard 12 leads. All annotated heartbeats in the QT set, and 72% of heartbeats in LUDB are normal sinus rhythm.
ECG segmentation method
We first denoise the ECG using the method proposed by Kumar et al38 to remove common ECG distortions, namely, baseline wander, electrode motion, and power line interference. We next reduce the ECG representation to a sequence of its significant points using the method proposed by Shatkay and Zdonik.39 This representation reduces the computational cost and sensitivity to any noise that is not removed in the denoising step. The practical implementation of any denoising method is imperfect40; as such, the denoised ECG is not guaranteed to be noise-free. Given the reduced representation, we then propose a 2-step process that recurs when detecting each ECG wave: peak and boundary detection. As shown in Figure 1, the process is first used to identify QRS complexes. It is then recursively applied to the interval between each 2 consecutive QRS segments to identify T waves and then P and U waves. In addition to its recursive property, the 2-step process is a rule-based procedure. It incorporates prior cardiology knowledge about the limits of ECG waves’ durations by defining 3 parameters, namely , , and specifying fractions of heartbeat duration as search windows for identifying ECG waves. We manually tune these parameters over 3 ECGs from the HCM dataset.
Reduce ECG representation to a sequence of significant points
A point on a time-series is defined as significant if it maximally deviates from the line intercepting the 2 endpoints of the series. To obtain significant points across the ECG, we employ the method proposed by Shatkay and Zdonik,39 which recursively breaks the signal into sub-sequences at significant points. As shown in Figure 1a, these points correspond to the local extrema of ECG waves and succinctly summarize the original signal. Our experiments demonstrate that the reduced representation lowers running time and sensitivity to noise.
Peak and boundary detection
Given an interval on the ECG, we identify the significant point forming the global extremum within the interval as the peak. Given the identified peak location , we then detect the onset and offset by defining a fixed-time interval around , as shown in Figure 3. Onset is identified as the point maximally deviating from the line intercepting the peak and left endpoint of . Similarly, offset is the point maximally deviating from the line intercepting the peak and right endpoint of . The interval W is defined as:
where specifies a fraction of the heartbeat duration as a search window for identifying a wave’s boundary. The value for is manually tuned over 3 ECGs from the HCM dataset (Supplementary Material S2.4). The heartbeat duration is calculated based on an estimated maximum heart rate within the dataset (). To estimate maximum heart rate in the HCM, QT, and LUDB datasets, which only contain ECGs recorded at rest, we randomly selected 10 ECGs from each set and observed no record exceeding 120 beats per minute. Accordingly, we fixed the heartbeat duration to 500 ms for these sets. Notably, in cases where the dataset comprises a mixture of rest and exercise ECGs, the ECGs need to be first partitioned into separate groups of rest and exercise before segmentation.
Figure 3.
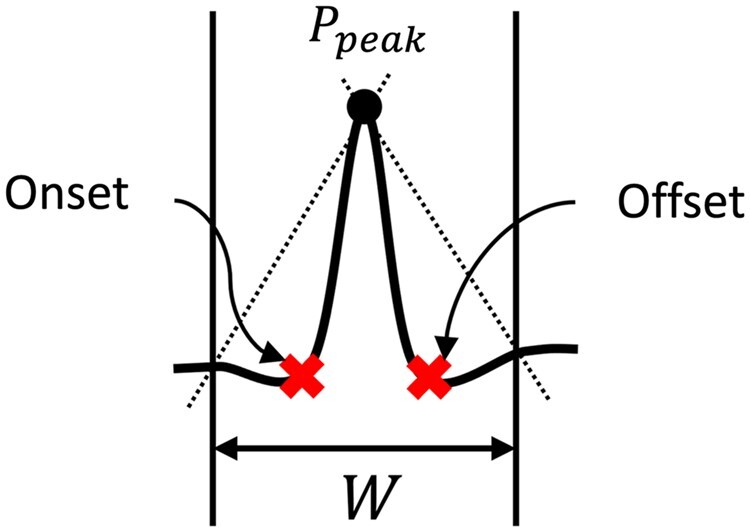
Given a wave’s peak , we identify the points maximally deviating from the lines intercepting and endpoints of (shown as dotted lines) as onset and offset. specifies a fraction of the heartbeat duration as a search window for identifying a wave’s boundary. The duration of is manually tuned over a few ECGs from the HCM datasets. ECG: electrocardiogram; HCM: hypertrophic cardiomyopathy.
QRS complex detection
QRS individual wave detection
We introduce our method for the ECG recorded via Lead I, where the QRS complex peaks at R (the maximum). For leads where QRS complexes are inverted (eg, Lead V1), each maximum in the method is substituted with a minimum. The complete method operating on 12-lead ECGs is provided in Supplementary Material.
The peak detection algorithm is first applied to each heartbeat interval throughout the ECG to identify the points forming the global maximum across each heartbeat. Let denote the reduced ECG representation as the sequence of significant points, denote a span of the heartbeat, and denote the global maximum within identified by the peak detection algorithm. Notably, may not represent the R-peak in all recorded heartbeats. In the presence of an abnormality called prominent T-wave, where the amplitude of the T-wave exceeds that of the preceding QRS complex, represents the T-peak. To distinguish the prominent T from R-wave, we note that an R-peak amplitude, unlike the prominent T, is typically at least twice as high as the local maximum occurring to its left; that is, the amplitude of —the local maximum preceding —exceeds half that of in the presence of the prominent T-wave. As such, we identify as the candidate R-peak if , where denotes the amplitude of . Otherwise, itself corresponds to the R-peak.
Next, we identify the Q and S waves. The peak detection algorithm is applied to 2 fixed-time intervals on the left and right of the candidate R-peak, denoted and , respectively. These intervals are defined as:
where denotes the time that R-peak occurs. and specify 2 fractions of the heartbeat duration as search windows for identifying Q and S waves, respectively. Their values are tuned over the HCM dataset (see Supplementary Material S2.4). In cases where no significant point falls into or , the corresponding wave is considered absent from the complex.
In cases where additional waves are present in the QRS complex, the point forming maximum within the interval between the minimum point of the Q-wave and R-peak is identified as the R. Similarly, the point forming minimum within the interval between the R-peak and minimum point of the S-wave is identified as the S′.
QRS boundary detection
The QRS complex boundary spans the interval between the onset of the Q-wave and the offset of the S-wave. As shown in Figure 1c, to identify the onset, we apply the boundary detection algorithm to the minimum point of the Q-wave. Similarly, it is applied to the minimum point of the S-wave to identify the offset. In cases where the Q-wave is absent from the QRS complex, we identify the onset of the R-wave as the onset of the complex. Similarly, in the absence of the S-wave, the R offset determines the end of the complex.
T-wave detection
We apply the peak detection algorithm to the segment between each 2 consecutive QRS segments to identify the candidate T-peak. The boundary detection algorithm is applied to the candidate T-peak to determine the boundary (see Figure 1e). Notably, in the presence of an abnormality called biphasic T-wave, the T-peak is directly preceded by a local minimum of similar or different absolute amplitude. Here, we identify the onset of this local minimum as the start of the T-wave.
P-wave and U-wave detection
We identify the P-wave as the single local maximum or minimum occurring between the end of the T-wave and the start of the following QRS complex, as shown in Figure 1f. In cases where 2 consecutive local maxima or minima occur, the leftmost is identified as the candidate U-wave, while the other forms the P-wave. A sequence of more than 2 fluctuations along this segment typically corresponds to atrial fibrillation, flutter, or other atrial arrhythmias. We apply the boundary detection algorithm to the candidate P peak to determine the P-wave boundary.
Experiments
As mentioned earlier, we use 3 ECGs from the HCM dataset to tune the parameters of our method, namely , , and . We view these 3 ECGs as the tune set and use the rest of the HCM dataset () and the full QT and LUDB sets as test data for evaluation in all the experiments below. The test data were not used during parameter tuning.
Impact of reducing ECG representation on runtime and noise sensitivity
We measure the average time (wall clock) required by our method to segment a 10-s ECG within the QT dataset and compare it to that required when processing the original ECG and also to that required by other methods, using the same hardware configuration as reported by Beraza and Romero.41
To evaluate the impact on noise sensitivity, we distort the ECG with noise that is not handled by our denoising method. For that, we add white noise to ECGs in the QT dataset with varying signal-to-noise ratios (SNRs), measure the performance of our method, and compare it to that attained when processing the original ECG. We also distort the ECGs with baseline wander, electrode motion, and power line interference to evaluate robustness in the presence of common ECG distortions. For the sake of convenience, we only present results for QRS onset and offset detection. We select these 2 because their correct or incorrect identification will affect the annotations for P, T, and U waves, as these waves are identified between every 2 QRS segments in our method.
Segmentation performance on non-HCM ECGs
We validate the annotations obtained by our method against ground-truth annotations in the QT and LUDB datasets, and compare the results to 4 state-of-the-art methods by Martinez et al,26 Moskalenko et al,20 Bote et al28 (reported from the high-accuracy mode) and Jimenez-Perez et al21 (reported from the multi-lead mode) as summarized in Table 2. The methods proposed by Martinez et al and Bote et al are heuristic, based on wavelet transformation and derivative of the ECG, respectively. The methods proposed by Moskalenko et al and Jimenez-Perez et al use deep learning; the former was trained on an extended version of the LUDB set, while the latter used the QT set.
Table 2.
Summary of the state-of-the-art ECG segmentation methods compared to our proposed approach
| Author | Year | Method | Handle 12-lead ECG? | Publicly available? | Used for HCM analysis? |
|---|---|---|---|---|---|
| Martinez et al26 | 2004 | Heuristic method based on wavelet transformation | Yes | Yes | Yes |
| Bote et al28 | 2018 | Heuristic method based on second derivative of a low-pass FIR filter | No | No | No |
| Moskalenko et al20 | 2020 | Deep neural network trained on extended version of LUDB | Yes | No | No |
| Jimenez-Perez et al21 | 2021 | Deep neural network trained on QT set | Yes | No | No |
| Our method | Recursive method based on reduced representation of ECG | Yes | Yes | Yes |
ECG: electrocardiogram; HCM: hypertrophic cardiomyopathy.
Segmentation performance on HCM ECGs
Last, we evaluate our method on the HCM dataset and compare its performance against the method by Martinez et al26 (using the publicly available implementation), which has been used as a part of feature engineering for ECG-based analysis of HCM.13 As the public implementation of the other 3 methods is not available, they are not included in this experiment. The method proposed by Martinez et al26 uses 16 parameters that were originally tuned over the QT dataset. Here, we fine-tune these parameters over the same 3 ECGs used for tuning our method.
Evaluation metrics
We measure the performance of the methods when detecting the onset, peak, and offset of P waves, QRS complexes, T waves, and U waves. We employ 3 standard assessment measures widely used in the context of ECG segmentation, namely sensitivity (), positive predictive value (), and segmentation error (), defined as:
where , , and denote True Positives, False Negatives, and False Positives, respectively. Correctly identifying an annotated point on the ECG by our method is counted as a , while failing to detect an annotated point would count as a . The methods consider a detected point to be correctly identified if it falls within 120 ms of the ground-truth annotation.28,42 We use the same threshold to calculate the sensitivity and positive predictive values. Any detected point that does not have a counterpart in the ground-truth is considered a . We denote by a point in time on the ECG where a cardiologist assigned an annotation, while denotes the corresponding point as estimated by automated methods. Notably, is only calculated for TPs and measures how close the automatic annotation is to the corresponding ground-truth. The True Negative () points are those that are neither annotated by cardiologists nor by automated methods. As the number of points is inherently very large compared to , , and (on the scale of the signal length), metrics that involve , such as specificity, are not suitable for evaluating the segmentation performance; thus, these are not reported.
RESULTS
Impact of reducing ECG representation on runtime and noise sensitivity
The average time (wall clock) required by our method to segment a 10-s ECG within the QT set is 0.14 ± 0.06 s. This time is statistically significantly lower (, calculated using Welch’s t-test) than that required by other methods, using the same hardware configuration, as reported by Beraza and Romero.41 For instance, the method proposed by Martinez et al requires 0.24 ± 0.01 s and Sun et al27 requires 3.6 ± 0.3 s. Without reducing the ECG representation, our method takes 1.08 ± 0.12 s. The differences stem from the fact that our method processes a significantly reduced representation of the ECG rather than the original signal. Moreover, it does not involve any transformation or derivative operations (except for the standard preprocessing steps shared by all the methods), thus, incurring a lower computational cost.
Figure 4 shows the average segmentation error of our method over noisy ECGs with an SNR of 1, 10, 20, and 30 dB (the lower the SNR, the higher the noise) when identifying QRS boundaries. Our approach of segmenting the reduced representation of the ECG rather than the entire signal drastically decreases the segmentation error (, calculated using Welch’s t-test) in the presence of white noise and electrode motion. We process only significant points forming ECG waves and ignore most fluctuations generated by noise, thus attaining lower error. In the presence of powerline interference, our approach significantly decreases the error when , whereas, in all levels of baseline wander, the improvements are insignificant. Baseline wander and electrode motion are effectively removed by the denoising system we use. Thus, reducing the representation would not have significant impact.
Figure 4.

Average segmentation error of our method for QRS detection over the QT dataset in the presence of baseline wander, electrode motion, powerline interference, and white noise with varying signal-to-noise ratio (SNR). Our approach of segmenting the reduced ECG representation rather than the entire signal markedly decreases the error in the presence of electrode motion and white noise.
Evaluation on the QT and LUDB datasets
Table 3 shows the performance of our method on the QT and LUDB datasets (non-HCM/normal ECGs). First, we compare our method to those developed by Martinez et al,26 Bote et al,28 and Jimenez-Perez et al21 on the QT dataset, followed by a comparison with the method developed by Moskalenko et al20 on the LUDB dataset. Our method demonstrates a statistically significant lower segmentation error when detecting QRS onset and peak over the QT dataset (, calculated using Welch’s t-test), while the positive predictive value is also higher when compared to the other 3 methods. For T-wave detection, it yields a statistically significant higher positive predictive value when detecting offset (, Wilcoxon signed-rank test), whereas for peak detection, it performs at a level comparable to the other 3 methods. Furthermore, it achieves statistically significant higher positive predictive values when detecting P-wave onset and peak, while performing at a level comparable to the other 3 methods in terms of other measures. For U-wave peak detection, it obtains a sensitivity of 89.12%, positive predictive value of 88.43%, and average segmentation error of 9.4 ± 3.6 ms; notably, the other methods do not aim to detect the U-wave.
Table 3.
Segmentation performance obtained by our method (tuned over the HCM dataset) compared to 4 state-of-the-art methods over the QT and LUDB datasets in terms of the sensitivity (), positive predictive value (PPV), and average (and standard deviation) of segmentation error (Error)
| Method | Measure | P-wave |
QRS complex |
T-wave |
||||||
|---|---|---|---|---|---|---|---|---|---|---|
| Onset | Peak | Offset | Onset | Peak | Offset | Onset | Peak | Offset | ||
| QT dataset | ||||||||||
| Martinez et al | 98.87 | 98.87 | 98.75 | 99.97 | 99.92 | 99.97 | N/A | 99.77 | 99.77 | |
| 91.03 | 91.03 | 91.03 | N/A | 99.88 | N/A | N/A | 97.79 | 97.79 | ||
| 2.0 ± 14.8 | 3.6 ± 13.2 | 1.9 ± 12.8 | 4.6 ± 7.7 | N/A | 0.8 ± 8.7 | N/A | 0.2 ± 13.9 | 1.6 ± 18 | ||
| Bote et al | 96.81 | 98.18 | 99.72 | 100 | 100 | 99.64 | N/A | 99.98 | 96.19 | |
| 93.02 | 94.34 | 95.79 | 99.51 | 99.51 | 99.23 | N/A | 97.96 | 94.82 | ||
| 20.2 ± 13.1 | 11.6 ± 6.5 | 0.9 ± 9.1 | 7.0 ± 4.3 | 6.0 ± 4.6 | 4.4 ± 9.1 | N/A | 9.3 ± 12.4 | 11 ± 12.5 | ||
| Jimenez-Perez et al | N/A | 94.17 | N/A | N/A | 99.40 | N/A | N/A | 96.36 | N/A | |
| N/A | N/A | N/A | N/A | N/A | N/A | N/A | N/A | N/A | ||
| 1.7 ± 17.8 | N/A | 4 ± 16.1 | −3.9 ± 14.6 | N/A | 5.4 ± 16.8 | N/A | N/A | 9.9 ± 46 | ||
| Our method | 97.77 | 99.38 | 98.34 | 99.97 | 99.97 | 99.87 | N/A | 99.81 | 97.1 | |
| 95.62 | 96.73 | 96.11 | 99.91 | 99.97 | 99.23 | N/A | 98.77 | 99.73 | ||
| 5.3 ± 7.1 | 2.1 ± 9.7 | 2.1 ± 10.7 | 0.3 ± 4.2 | 1.2 ± 3.4 | 2.1 ± 9.3 | N/A | 0.2 ± 5.1 | 4.5 ± 14.2 | ||
| LUDB dataset | ||||||||||
| Moskalenko et al | 98.05 | N/A | 98.01 | 100 | N/A | 100 | 99.68 | N/A | 99.77 | |
| 97.73 | N/A | 97.69 | 99.93 | N/A | 99.93 | 99.37 | N/A | 99.46 | ||
| 0.6 ± 17.5 | N/A | 2.4 ± 18.4 | 1.5 ± 11.1 | N/A | 2 ± 10.6 | 3 ± 23.7 | N/A | 2.4 ± 30.4 | ||
| Our method | 99.2 | 98.1 | 98.9 | 99.1 | 99.98 | 99.2 | 99.84 | 97.1 | 97.2 | |
| 98.54 | 99.85 | 99.72 | 98.9 | 99.98 | 99.81 | 99.41 | 96.95 | 98.81 | ||
| 5.2 ± 6.4 | 2.7 ± 8.8 | 4.3 ± 9.5 | 1.4 ± 10.5 | 0.3 ± 1.6 | 5.9 ± 11.6 | 1.4 ± 18 | 9.3 ± 12.4 | 6.8 ± 28.8 | ||
N/A: not available. Bold numbers in each column show sensitivity, positive predictive value, and segmentation error that are significantly () improved.
Over the LUDB dataset, when compared with the method developed by Moskalenko et al,20 our method performs slightly better in terms of sensitivity and positive predictive value for detection of P-onset, P-offset, and T-onset, but has similar performance for detecting QRS-onset and offset, as well as T-offset; segmentation error is lower for T-onset detection with our method.
Evaluation on the HCM dataset
Table 4 shows the performance of our method on the HCM dataset compared to that obtained by running the method developed by Martinez et al.26 Our method demonstrates statistically significant superior performance for all QRS-related tasks (, Wilcoxon signed-rank test). The positive predictive value is slightly higher for P-wave detection, but comparable results are achieved in terms of sensitivity using our method. In all T-wave-related tasks, our method has significantly higher sensitivity and lower segmentation error, as well as marginally higher positive predictive value.
Table 4.
Segmentation performance obtained by our method compared to that obtained by running and fine-tuning the method proposed by Martinez et al over the HCM dataset in terms of the sensitivity (), positive predictive value (PPV), and average (and standard deviation) of segmentation error (Error)
| Method | Measure | P-wave |
QRS complex |
T-wave |
||||||
|---|---|---|---|---|---|---|---|---|---|---|
| Onset | Peak | Offset | Onset | Peak | Offset | Onset | Peak | Offset | ||
| Martinez et al | 89.8 | 89.9 | 89.8 | 94.6 | 87.8 | 94.4 | 85.6 | 86.2 | 87.3 | |
| 84.7 | 84.8 | 85.4 | 83.2 | 81.3 | 84.0 | 96.2 | 96.1 | 95.0 | ||
| 1.7 ± 45.3 | 2.6 ± 44 | 6.2 ± 36 | 10 ± 18.5 | 3.5 ± 13.7 | 6.2 ± 16.4 | 11 ± 45.1 | 4 ± 38.5 | 3 ± 46 | ||
| Our method | 86.4 | 86.4 | 87.2 | 99.2 | 95.4 | 99.2 | 99.2 | 98.0 | 98.1 | |
| 88.4 | 88.1 | 88.1 | 92.2 | 93.8 | 91.1 | 98.5 | 95.4 | 95.3 | ||
| 0.6 ± 27.2 | 3.4 ± 32 | 3.1 ± 22.8 | 1.2 ± 12.3 | 1.1 ± 8.6 | 1.2 ± 13.1 | 0.2 ± 4.7 | 1.9 ± 12.1 | 1.8 ± 27.7 | ||
Bold numbers in each column show sensitivity, positive predictive value, and segmentation error that are significantly () improved.
We also compare the performance of our method across subgroups of sex (83 men, 45 women) and race (108 Caucasian, 20 Black). The change in performance between subgroups is not statistically significant (using Welch’s t-test). For example, our method’s error for QRS complex detection is in men, and in women. Similarly, the performance remains similar among race subgroups ( and for QRS boundary detection); however, the sample size of the black subpopulation is to small from a statstical standpoint.
Figure 5 shows the annotations made by our method in leads I, II aVL, aVF, V1, and V2 of an ECG from the HCM dataset, along with those made by the gold standard annotator. The ECG represents QRS complexes with extra waves (R′, S′, J), prominent/biphasic T waves and abnormal P waves. For the sake of convenience, we only show 3 heartbeats here. As shown, annotations made by our method for QRS complexes exactly match the ground-truth annotations. For T waves, the annotations are also very close to the ground-truth (). Our method correctly identifies prominent T waves in all QRS complexes. Except for lead V2, where our method misses P waves, it successfully detects P waves in other leads; but these are of shorter duration than those indicated by ground-truth. The P waves in this ECG either have fragmented morphologies (see leads aVL and V1) or small amplitude making it difficult to discern from baseline fluctuations (see lead V2). The inaccurate annotation by our method for such morphologies decreases the performance in P-wave detection compared to the other tasks, as reported in Table 4.
Figure 5.

An illustration of our method’s annotations for an ECG in the HCM dataset validated against cardiologists’ annotations. ECG: electrocardiogram; HCM: hypertrophic cardiomyopathy.
Figure 6 shows another illustration of annotations made by our method for an abnormal ECG within the HCM dataset compared to those made by the method by Martinez et al. Our method correctly identifies all QRS complexes and T waves, whereas the method by Martinez et al incorrectly identifies T waves as QRS complexes in leads aVL, V2, V3, and V4. Correct annotation by our method for such QRS and T morphologies improves upon Martinez et al’s method in terms of sensitivity and positive predictive value, as shown in Table 4. For P-wave detection, both methods perform similarly. In lead V4, the Martinez et al method incorrectly identifies parts of ST segments as P waves. Our method misses identifying the first P wave in leads aVL and V4.
Figure 6.

An illustration of our method’s annotations for an ECG in the HCM dataset (right) compared to those obtained by the method proposed by Martinez et al (left). Incorrect annotations are marked by red stars. ECG: electrocardiogram; HCM: hypertrophic cardiomyopathy.
DISCUSSION AND CONCLUSION
Several studies have developed machine learning methods to automatically diagnose HCM using ECG, with the prospect of identifying ECG abnormalities associated explicitly with HCM. Most recently, Ko et al15 and Siontis et al43 have trained deep neural networks on large cohorts of ECGs from HCM and control subjects and achieved high accuracies. However, a challenge with using deep learning methods for this purpose is their limited interpretability. The ECG features are extracted in a black-box, and those contributing to the model’s output are obscured. To avoid this limitation, other studies use non-deep learning methods, such as random forests and clustering.13,14,44,45 These studies extract ECG features, such as the duration of waves and amplitude of ST-segments, to train machine learning models diagnosing HCM. The contribution of these features to the model’s output is then calculated to find the top features distinguishing HCM patients from control individuals.
In the studies mentioned above, segmentation plays a fundamental role as it enables ECG feature extraction. Among the employed segmentation methods, the one proposed by Martinez et al26 has been highly effective over the QT dataset. However, our experiments show that the performance of this method is reduced when segmenting ECGs from the HCM dataset (, calculated using Mann–Whitney U-test). This is because the method was originally developed using the QT set and was not designed to handle ECG abnormalities caused by HCM. As such, to advance ECG-based analysis of HCM, a segmentation method that effectively identifies ECG waves across 12-lead ECGs of HCM patients is needed. Our proposed segmentation method aims to address this need.
Our method is specifically tailored to handle fragmented QRS complexes with additional waves (R, S, J) and biphasic and prominent T waves—frequent abnormalities in our curated HCM dataset. Almost 30% of heartbeats in the set have QRS complexes with additional waves, and 35% have biphasic or prominent T waves. Our method correctly identified 80% of the additional waves in QRS complexes and 91% of biphasic/prominent T waves. Our method is also designed to identify atrial fibrillation, which manifests as irregular baseline fluctuations without distinct P waves. Almost 10% of heartbeats in the HCM dataset have atrial fibrillation, and our method correctly captured 72% of them. Nevertheless, the performance of our method when identifying P waves is lower than that obtained for the other 2 tasks (QRS complexes, T waves). As mentioned earlier, this is due to low amplitude fragmented and biphasic P-wave morphologies caused by atrial myopathy in HCM. Our team is now working on Improving our method to handle these P wave abnormalities.
Notably, the ECG abnormalities mentioned above are not specific to HCM. Atrial fibrillation is the most common cardiac arrhythmia.37 Biphasic T waves constitute a common pattern of abnormal T waves, and the prominent T-wave is one of the earliest indications of acute myocardial infarction35,36, but can also be seen in healthy young healthy individuals. We anticipate that our method can also be useful for analyzing other cardiac diseases causing these abnormalities.
In conclusion, this is the first 12-lead ECG segmentation method designed to handle abnormalities caused by HCM. It effectively identifies ECG waves in normal and abnormal heartbeats carrying fragmented QRS complexes, biphasic and prominent T waves, atrial fibrillation, fragmented and biphasic P waves. We evaluated our method using 131 annotated ECGs from HCM patients and normal/non-HCM ECGs from the well-known QT and LUDB datasets and showed its superiority over 4 state-of-the-art methods.
FUNDING
This work was funded in part by the NSF IIS EAGER grant #1650851, an award from the John Taylor Babbitt (JTB) foundation, and startup funds from the UCSF Division of Cardiology (to MRA).
AUTHOR CONTRIBUTIONS
KN designed and implemented the segmentation system and annotation website and analyzed the data. JM, GVG, SR, and BS annotated ECGs with the supervision of MRA. MRA resolved disagreements between annotations. KN wrote the manuscript. All authors discussed the results and contributed to the final manuscript. MRA, PM, and HS supervised the project and oversaw the overall direction.
ETHICS APPROVAL
The HCM Registry is approved by the Institutional Review Boards (IRB) of the Johns Hopkins Hospital and the University of California San Francisco. Informed consent was obtained for use of medical records for research. Patients were enrolled in the Johns Hopkins HCM Registry from 2005 to 2016 at the time of their first clinic visit. All patients met the standard diagnostic criteria for HCM, namely, left ventricular hypertrophy (maximum wall thickness ≥15 mm) in the absence of other causes of hypertrophy.
SUPPLEMENTARY MATERIAL
Supplementary material is available at Journal of the American Medical Informatics Association online.
CONFLICT OF INTEREST STATEMENT
None declared.
DATA AND CODE AVAILABILITY
Code for ECG segmentation is publicly available at https://github.com/KasraNezamabadi/KNSegmentation. The QT and LUDB datasets used in this study are provided publicly by their owners and are available at https://physionet.org/content/qtdb/1.0.0/ and https://physionet.org/content/ludb/1.0.1/, respectively. Our curated HCM dataset cannot be shared publicly for the privacy of individuals that participated in the study. The data will be shared on reasonable request to the corresponding author.
Supplementary Material
Contributor Information
Kasra Nezamabadi, Computational Biomedicine Lab, Computer and Information Sciences, University of Delaware, Newark, Delaware, USA.
Jacob Mayfield, Division of Cardiology, Hypertrophic Cardiomyopathy Center of Excellence, University of California San Francisco, San Francisco, California, USA.
Pengyuan Li, Computational Biomedicine Lab, Computer and Information Sciences, University of Delaware, Newark, Delaware, USA.
Gabriela V Greenland, Division of Cardiology, Hypertrophic Cardiomyopathy Center of Excellence, University of California San Francisco, San Francisco, California, USA.
Sebastian Rodriguez, Division of Cardiology, Hypertrophic Cardiomyopathy Center of Excellence, University of California San Francisco, San Francisco, California, USA.
Bahadir Simsek, Division of Cardiology, Hypertrophic Cardiomyopathy Center of Excellence, University of California San Francisco, San Francisco, California, USA.
Parvin Mousavi, School of Computing, Queen’s University, Kingston, Ontario, Canada.
Hagit Shatkay, Computational Biomedicine Lab, Computer and Information Sciences, University of Delaware, Newark, Delaware, USA.
M Roselle Abraham, Hypertrophic Cardiomyopathy Center of Excellence, Division of Cardiology, University of California San Francisco, San Francisco, USA.
REFERENCES
- 1. Maron BJ, Maron MS.. Hypertrophic cardiomyopathy. Lancet 2013; 381 (9862): 242–55. [DOI] [PubMed] [Google Scholar]
- 2. Luo HC, Dimaano VL, Kembro JM, et al. Exercise heart rates in patients with hypertrophic cardiomyopathy. Am J Cardiol 2015; 115 (8): 1144–50. [DOI] [PMC free article] [PubMed] [Google Scholar]
- 3. Sivalokanathan S, Zghaib T, Greenland GV, et al. Hypertrophic cardiomyopathy patients with paroxysmal atrial fibrillation have a high burden of left atrial fibrosis by cardiac magnetic resonance imaging. JACC Clin Electrophysiol 2019; 5 (3): 364–75. [DOI] [PubMed] [Google Scholar]
- 4. Bhattacharya M, Lu DY, Ventoulis I, et al. Machine learning methods for identifying atrial fibrillation cases and their predictors in patients with hypertrophic cardiomyopathy: the HCM-AF-Risk Model. CJC Open 2021; 3 (6): 801–13. [DOI] [PMC free article] [PubMed] [Google Scholar]
- 5. Bhattacharya M, Lu DY, Kudchadkar SM, et al. Identifying ventricular arrhythmias and their predictors by applying machine learning methods to electronic health records in patients with hypertrophic cardiomyopathy (HCM-VAr-risk model). Am J Cardiol 2019; 123 (10): 1681–9. [DOI] [PubMed] [Google Scholar]
- 6. Corona-Villalobos CP, Saha S, Pozios I, et al. Exercise-QTc is associated with diffuse interstitial fibrosis reflected by lower approximated T1 relaxation time in hypertrophic cardiomyopathy patients. J Electrocardiol 2017; 50 (4): 484–90. [DOI] [PubMed] [Google Scholar]
- 7. Hurtado‐de‐Mendoza D, Corona‐Villalobos CP, Pozios I, et al. Diffuse interstitial fibrosis assessed by cardiac magnetic resonance is associated with dispersion of ventricular repolarization in patients with hypertrophic cardiomyopathy. J Arrhythm 2017; 33 (3): 201–7. [DOI] [PMC free article] [PubMed] [Google Scholar]
- 8. Lin X, Liang HY, Pinheiro A, et al. Electromechanical relationship in hypertrophic cardiomyopathy. J Cardiovasc Transl Res 2013; 6 (4): 604–15. [DOI] [PMC free article] [PubMed] [Google Scholar]
- 9. Montgomery JV, Harris KM, Casey SA, Zenovich AG, Maron BJ.. Relation of electrocardiographic patterns to phenotypic expression and clinical outcome in hypertrophic cardiomyopathy. Am J Cardiol 2005; 96 (2): 270–5. [DOI] [PubMed] [Google Scholar]
- 10. Calore C, Zorzi A, Corrado D.. Clinical meaning of isolated increase of QRS voltages in hypertrophic cardiomyopathy versus athlete's heart. J Electrocardiol 2015; 48 (3): 373–9. [DOI] [PubMed] [Google Scholar]
- 11. Finocchiaro G, Sheikh N, Biagini E, et al. The electrocardiogram in the diagnosis and management of patients with hypertrophic cardiomyopathy. Heart Rhythm 2020; 17 (1): 142–51. [DOI] [PubMed] [Google Scholar]
- 12. McLeod CJ, Ackerman MJ, Nishimura RA, Tajik AJ, Gersh BJ, Ommen SR.. Outcome of patients with hypertrophic cardiomyopathy and a normal electrocardiogram. J Am Coll Cardiol 2009; 54 (3): 229–33. [DOI] [PubMed] [Google Scholar]
- 13. Lyon A, Ariga R, Mincholé A, et al. Distinct ECG phenotypes identified in hypertrophic cardiomyopathy using machine learning associate with arrhythmic risk markers. Front Physiol 2018; 9: 213. [DOI] [PMC free article] [PubMed] [Google Scholar]
- 14. Tison GH, Zhang J, Delling FN, Deo RC.. Automated and interpretable patient ECG profiles for disease detection, tracking, and discovery. Circ Cardiovasc Qual Outcomes 2019; 12 (9): e005289. [DOI] [PMC free article] [PubMed] [Google Scholar]
- 15. Ko W-Y, Siontis KC, Attia ZI, et al. Detection of hypertrophic cardiomyopathy using a convolutional neural network-enabled electrocardiogram. J Am Coll Cardiol 2020; 75 (7): 722–33. [DOI] [PubMed] [Google Scholar]
- 16. Hughes N, Tarassenko L, Roberts SJ.. Markov models for automated ECG interval analysis. Adv Neural Inf Process Syst 2003; 16: 611–8. [Google Scholar]
- 17. Akhbari M, Shamsollahi MB, Sayadi O, Armoundas AA, Jutten C.. ECG segmentation and fiducial point extraction using multi hidden Markov model. Comput Biol Med 2016; 79: 21–9. [DOI] [PubMed] [Google Scholar]
- 18. Gao P, Zhao J, Wang G, Guo H. Real time ECG characteristic point detection with randomly selected signal pair difference (RSSPD) feature and random forest classifier. In: 38th International Conference of the IEEE Engineering in Medicine and Biology Society (EMBC); 2016: 732–35; Orlando, FL. [DOI] [PubMed]
- 19. Chen M, Wang G, Xie P, et al. Region aggregation network: improving convolutional neural network for ECG characteristic detection. In: 40th International Conference of the IEEE Engineering in Medicine and Biology Society (EMBC); 2018: 2559–62; Honolulu, HI. [DOI] [PubMed]
- 20. Moskalenko V, Zolotykh N, Osipov G. Deep learning for ECG segmentation. In: International Conference on Neuroinformatics; 2019: 246–54; Dolgoprudny, Russia.
- 21. Jimenez-Perez G, Alcaine A, Camara O.. Delineation of the electrocardiogram with a mixed-quality-annotations dataset using convolutional neural networks. Sci Rep 2021; 11 (1): 1–11. [DOI] [PMC free article] [PubMed] [Google Scholar]
- 22. Chen H, Maharatna K.. An automatic R and T peak detection method based on the combination of hierarchical clustering and discrete wavelet transform. IEEE J Biomed Health Inform 2020; 24 (10): 2825–32. [DOI] [PubMed] [Google Scholar]
- 23. Vullings H, Verhaegen MHG, Verbruggen HB. Automated ECG segmentation with dynamic time warping. In: Proceedings of the 20th International Conference of the IEEE Engineering in Medicine and Biology Society; 1998: 163–6; Hong Kong, China.
- 24. Shorten GP, Burke MJ.. Use of dynamic time warping for accurate ECG signal timing characterization. J Med Eng Technol 2014; 38 (4): 188–201. [DOI] [PubMed] [Google Scholar]
- 25. Lauder B, Schwerin B, McConnell M, So S. Using dynamic time warping for noise robust ECG R-peak detection. In: 13th International Conference on Signal Processing and Communication Systems, Gold Coast; 2019: 1–7; QLD, Australia.
- 26. Martinez JP, Almeida R, Olmos S, Rocha AP, Laguna P.. A wavelet-based ECG delineator: evaluation on standard databases. IEEE Trans Biomed Eng 2004; 51 (4): 570–81. [DOI] [PubMed] [Google Scholar]
- 27. Sun Y, Chan KL, Krishnan SM.. Characteristic wave detection in ECG signal using morphological transform. BMC Cardiovasc Disord 2005; 5 (1): 28. [DOI] [PMC free article] [PubMed] [Google Scholar]
- 28. Bote JM, Recas J, Rincon F, Atienza D, Hermida R.. A modular low-complexity ECG delineation algorithm for real-time embedded systems. IEEE J Biomed Health Inform 2018; 22 (2): 429–41. [DOI] [PubMed] [Google Scholar]
- 29. Laguna P, Mark RG, Goldberg A, Moody GB. A database for evaluation of algorithms for measurement of QT and other waveform intervals in the ECG. In: Computers in Cardiology; 1997: 673–76; Lund, Sweden.
- 30. Ardekani S, Jain S, Sanzi A, et al. Shape analysis of hypertrophic and hypertensive heart disease using MRI-based 3D surface models of left ventricular geometry. Med Image Anal 2016; 29: 12–23. [DOI] [PMC free article] [PubMed] [Google Scholar]
- 31. Lu D-Y, Ventoulis I, Liu H, et al. Sex-specific cardiac phenotype and clinical outcomes in patients with hypertrophic cardiomyopathy. Am Heart J 2020; 219: 58–69. [DOI] [PubMed] [Google Scholar]
- 32. Kalyakulina AI, Yusipov II, Moskalenko VA, et al. LUDB: a new open-access validation tool for electrocardiogram delineation algorithms. IEEE Access 2020; 8: 186181–90. [Google Scholar]
- 33. Das MK, Suradi H, Maskoun W, et al. Fragmented wide QRS on a 12-lead ECG: a sign of myocardial scar and poor prognosis. Circ Arrhythm Electrophysiol 2008; 1 (4): 258–68. [DOI] [PubMed] [Google Scholar]
- 34. Platonov PG. P-wave morphology: Underlying mechanisms and clinical implications. Ann Noninvasive Electrocardiol 2012; 17 (3): 161–9. [DOI] [PMC free article] [PubMed] [Google Scholar]
- 35. Malfatto G, Beria G, Sala S, Bonazzi O, Schwartz PJ.. Quantitative analysis of T wave abnormalities and their prognostic implications in the idiopathic long QT syndrome. J Am Coll Cardiol 1994; 23 (2): 296–301. [DOI] [PubMed] [Google Scholar]
- 36. Somers MP, Brady WJ, Perron AD, Mattu A.. The prominant T wave: electrocardiographic differential diagnosis. Am J Emerg Med 2002; 20 (3): 243–51. [DOI] [PubMed] [Google Scholar]
- 37. Tanaka Y, Shah NS, Passman R, Greenland P, Lloyd-Jones DM, Khan SS.. Trends in cardiovascular mortality related to atrial fibrillation in the United States, 2011 to 2018. J Am Heart Assoc 2021; 10 (15): e020163. [DOI] [PMC free article] [PubMed] [Google Scholar]
- 38. Kumar KS, Yazdanpanah B, Kumar PR.. Removal of noise from electrocardiogram using digital FIR and IIR filters with various methods. In: International Conference on Communications and Signal Processing (ICCSP). Tamil Nadu, India: IEEE, 2015: 157–62. [Google Scholar]
- 39. Shatkay H, Zdonik SB. Approximate queries and representations for large data sequences. In: Proceedings of the 12th International Conference on Data Engineering; 1996: 536–45; New Orleans, LA.
- 40. Alexander W, Williams CM.. Digital Signal Processing: Principles, Algorithms and System Design. Cambridge, MA: Academic Press; 2016.
- 41. Beraza I, Romero I.. Comparative study of algorithms for ECG segmentation. Biomed Signal Process Control 2017; 34: 166–73. [Google Scholar]
- 42.Obtaining test annotation files. PhysioNet. Updated March 2019. Accessed December 12, 2020. https://www.physionet.org/physiotools/wag/evnode8.htm.Accessed December 12, 2020..
- 43. Siontis KC, Liu K, Bos JM, et al. Detection of hypertrophic cardiomyopathy by an artificial intelligence electrocardiogram in children and adolescents. Int J Cardiol 2021; 340: 42–7. [DOI] [PubMed] [Google Scholar]
- 44. O'Mahony C, Jichi F, Pavlou M, et al. ; Hypertrophic Cardiomyopathy Outcomes Investigators. A novel clinical risk prediction model for sudden cardiac death in hypertrophic cardiomyopathy (HCM risk-SCD). Eur Heart J 2014; 35 (30): 2010–20. [DOI] [PubMed] [Google Scholar]
- 45. Rahman QA, Tereshchenko LG, Kongkatong M, Abraham T, Abraham MR, Shatkay H.. Utilizing ECG-based heartbeat classification for hypertrophic cardiomyopathy identification. IEEE Trans Nanobioscience 2015; 14 (5): 505–12. [DOI] [PMC free article] [PubMed] [Google Scholar]
Associated Data
This section collects any data citations, data availability statements, or supplementary materials included in this article.
Supplementary Materials
Data Availability Statement
Code for ECG segmentation is publicly available at https://github.com/KasraNezamabadi/KNSegmentation. The QT and LUDB datasets used in this study are provided publicly by their owners and are available at https://physionet.org/content/qtdb/1.0.0/ and https://physionet.org/content/ludb/1.0.1/, respectively. Our curated HCM dataset cannot be shared publicly for the privacy of individuals that participated in the study. The data will be shared on reasonable request to the corresponding author.