Abstract
The purpose of this research project was to improve the quantification of microvascular networks depicted in contrast-enhanced ultrasound (CEUS) images of human hepatocellular carcinoma (HCC). Due to limited anatomical information in CEUS images, grayscale B-mode ultrasound (US) data is preferred when estimating tissue motion. Transformation functions derived from the B-mode data are one solution for registering a dynamic sequence of CEUS images. Microvessel density (MVD) can then be calculated from both the original and motion corrected CEUS images as the ratio of the number of contrast-enhanced image pixels with a value greater than zero to the number of pixels of the entire tumor space. Using US images of HCC before and after treatment with transarterial chemoembolization, results revealed that affine and non-rigid motion correction improves visualization and quantitative analysis of clinical data. Using the correlation coefficient (CC) between CEUS frames as metric of tissue motion, our motion correction strategy produced a 20% increase in the average CC from motion corrected frames compared to the data before correction (p < 0.001). Furthermore, enhanced visualization of microvascular networks in the treated liver tumor space may improve determination of treatment efficacy and need for any repeat procedures.
Keywords: cancer, contrast-enhanced ultrasound, image registration, microbubble contrast agents, microvascular networks, motion correction
I. INTRODUCTION
Dynamic contrast-enhanced ultrasound (CEUS) is a noninvasive imaging modality commonly used to quantify tissue microvascular networks, e.g. tumor angiogenesis [1], [2]. Analysis of tissue microvascular structures depicted in CEUS images of cancerous tissue is an emerging strategy for determining an early response to anticancer treatment [3]–[6]. During ultrasound (US) imaging, inevitable motion artifacts caused by probe motion, patient breathing, and cardiac pulsations, can degrade the accuracy of any image quantification. To improve image quantification, these motion artifacts should be properly addressed and removed, which is a process known as motion correction.
One motion correction strategy that has been applied to magnetic resonance (MR) images uses non-rigid registrations to align images with motion artifacts to a preselected reference frame [7]. In short, a global motion correction strategy first registers images by applying a series of affine transformations, e.g. rotations, translations, shearing, and scaling. To then correct for local motion, free-form deformations derived from basis spline (B-spline) functional analysis were used. A similarity measure defined by mutual information, e.g. cross-correlation coefficient (CC), can be used to help evaluate the degree of image registration (i.e. corrected motion). A more recent study demonstrated that this non-rigid registration approach to motion correction can be used to improve the quality of clinical CEUS images and quantification [8].
Another strategy for motion estimation and correction in US images is to discard the frames based on correlation between two consecutive frames [9]. Assuming that the frames have one dominant motion artifact, such as due to respiratory or cardiac motion, the image correction values can be computed and analyzed. Assuming that a lower CC is observed during certain periods of the respiratory or cardiac cycles, these frames can be discarded to help eliminate any CEUS image frames corrupted by subject motion. In this paper, we demonstrate improved quantification of CEUS images using a combination of the two varying methods mentioned above.
II. MATERIALS AND METHODS
A. Ultrasound Imaging
A retrospective analysis of CEUS images of human HCC was performed (N = 8) [10]. All US examinations were performed using a Logiq E9 scanner equipped with a C1-6-D transducer (GE Healthcare, Wauwatosa, WI). After acquiring baseline images, subjects received a bolus injection of 0.2–0.3 ml of a microbubble (MB) contrast agent (Definity, Lantheus Medical Imaging, N Billerica, MA) followed by a 10 ml saline flush. CEUS imaging was performed using a dual imaging mode, enabling side-by-side visualization of the grayscale B-mode and CEUS images at a rate of 8 to 9 frames per sec. Each subject underwent CEUS exams at three time points: prior to a transarterial chemoembolization (TACE) treatment procedure, 1 to 2 wk post TACE, and again about 4 wk post TACE treatment. During scanning, the transducer was being rotated for 90° after the peak intensity point was reached and sweep through the region to be able to see all the other sides of the tumor region. Our analysis of the microvascular morphology was restricted by only one plane, so we discarded the frames after 30 to 40 sec as these contained mostly out-of-plane motions.
B. Image Processing
CEUS images of HCC corrupted with motion artifacts caused by respiratory, cardiac, and probe motions were analyzed. B-Mode US images were used for motion estimation. As seen in Fig. 1, the first step in the image processing pipeline was to remove the frames with out-of-plane motion prior to in-plane motion correction. According to the scanning protocol, consistent imaging was performed on plane at midline of lesion of interest for at least 10 sec after peak contrast enhancement was reached (about 30 sec after injection) was maintained. For this reason, the first 255 – 355 in-plane frames were remaining after we discarded the frames with out-of-plane motions. Full cine length was not the same across all the time points and subjects. Therefore, the number of frames that were discarded was not the same for all subjects and time points. As an example, the images in the second row of Fig. 2 were created using maximum intensity projection (MIP) of the first 255 in-plane frames out of 787 frames. Here, the first frame of each image sequence was chosen as a reference frame and all subsequent frames were motion corrected and registered to that reference. Next, affine transformations were used to compensate for global motion and free-form deformations adjusted the motion on local regions in CEUS images. We customized the parts of the MATLAB code from [11] for using parallel processing in Texas Advanced Computing Center (TACC). The limited memory Broyden Fletcher Goldfarb Shanno (L-BFGS) optimization was used to minimize the squared pixel distance (SD) between static and moving images. Subsequently, both, original and motion corrected images were filtered to remove clutter signal using a singular value filter (SVF) which was based on principle component analysis signal separation for medical US images [12] and to localize MBs using the methods from [13]. In addition, a multiscale vessel enhancement filter was applied for better visualization of vessels, e.g. tubular structures in the image were enhanced [14]. As a therapy response metric, we quantified the microvessel density (MVD) that should indicate the changes in the tumor vasculature. MVD was calculated as follows:
where Vp was used as an estimate of number of vascular points and M and N were the axial and lateral dimensions of the region of interest (ROI) [3].
Fig. 1.
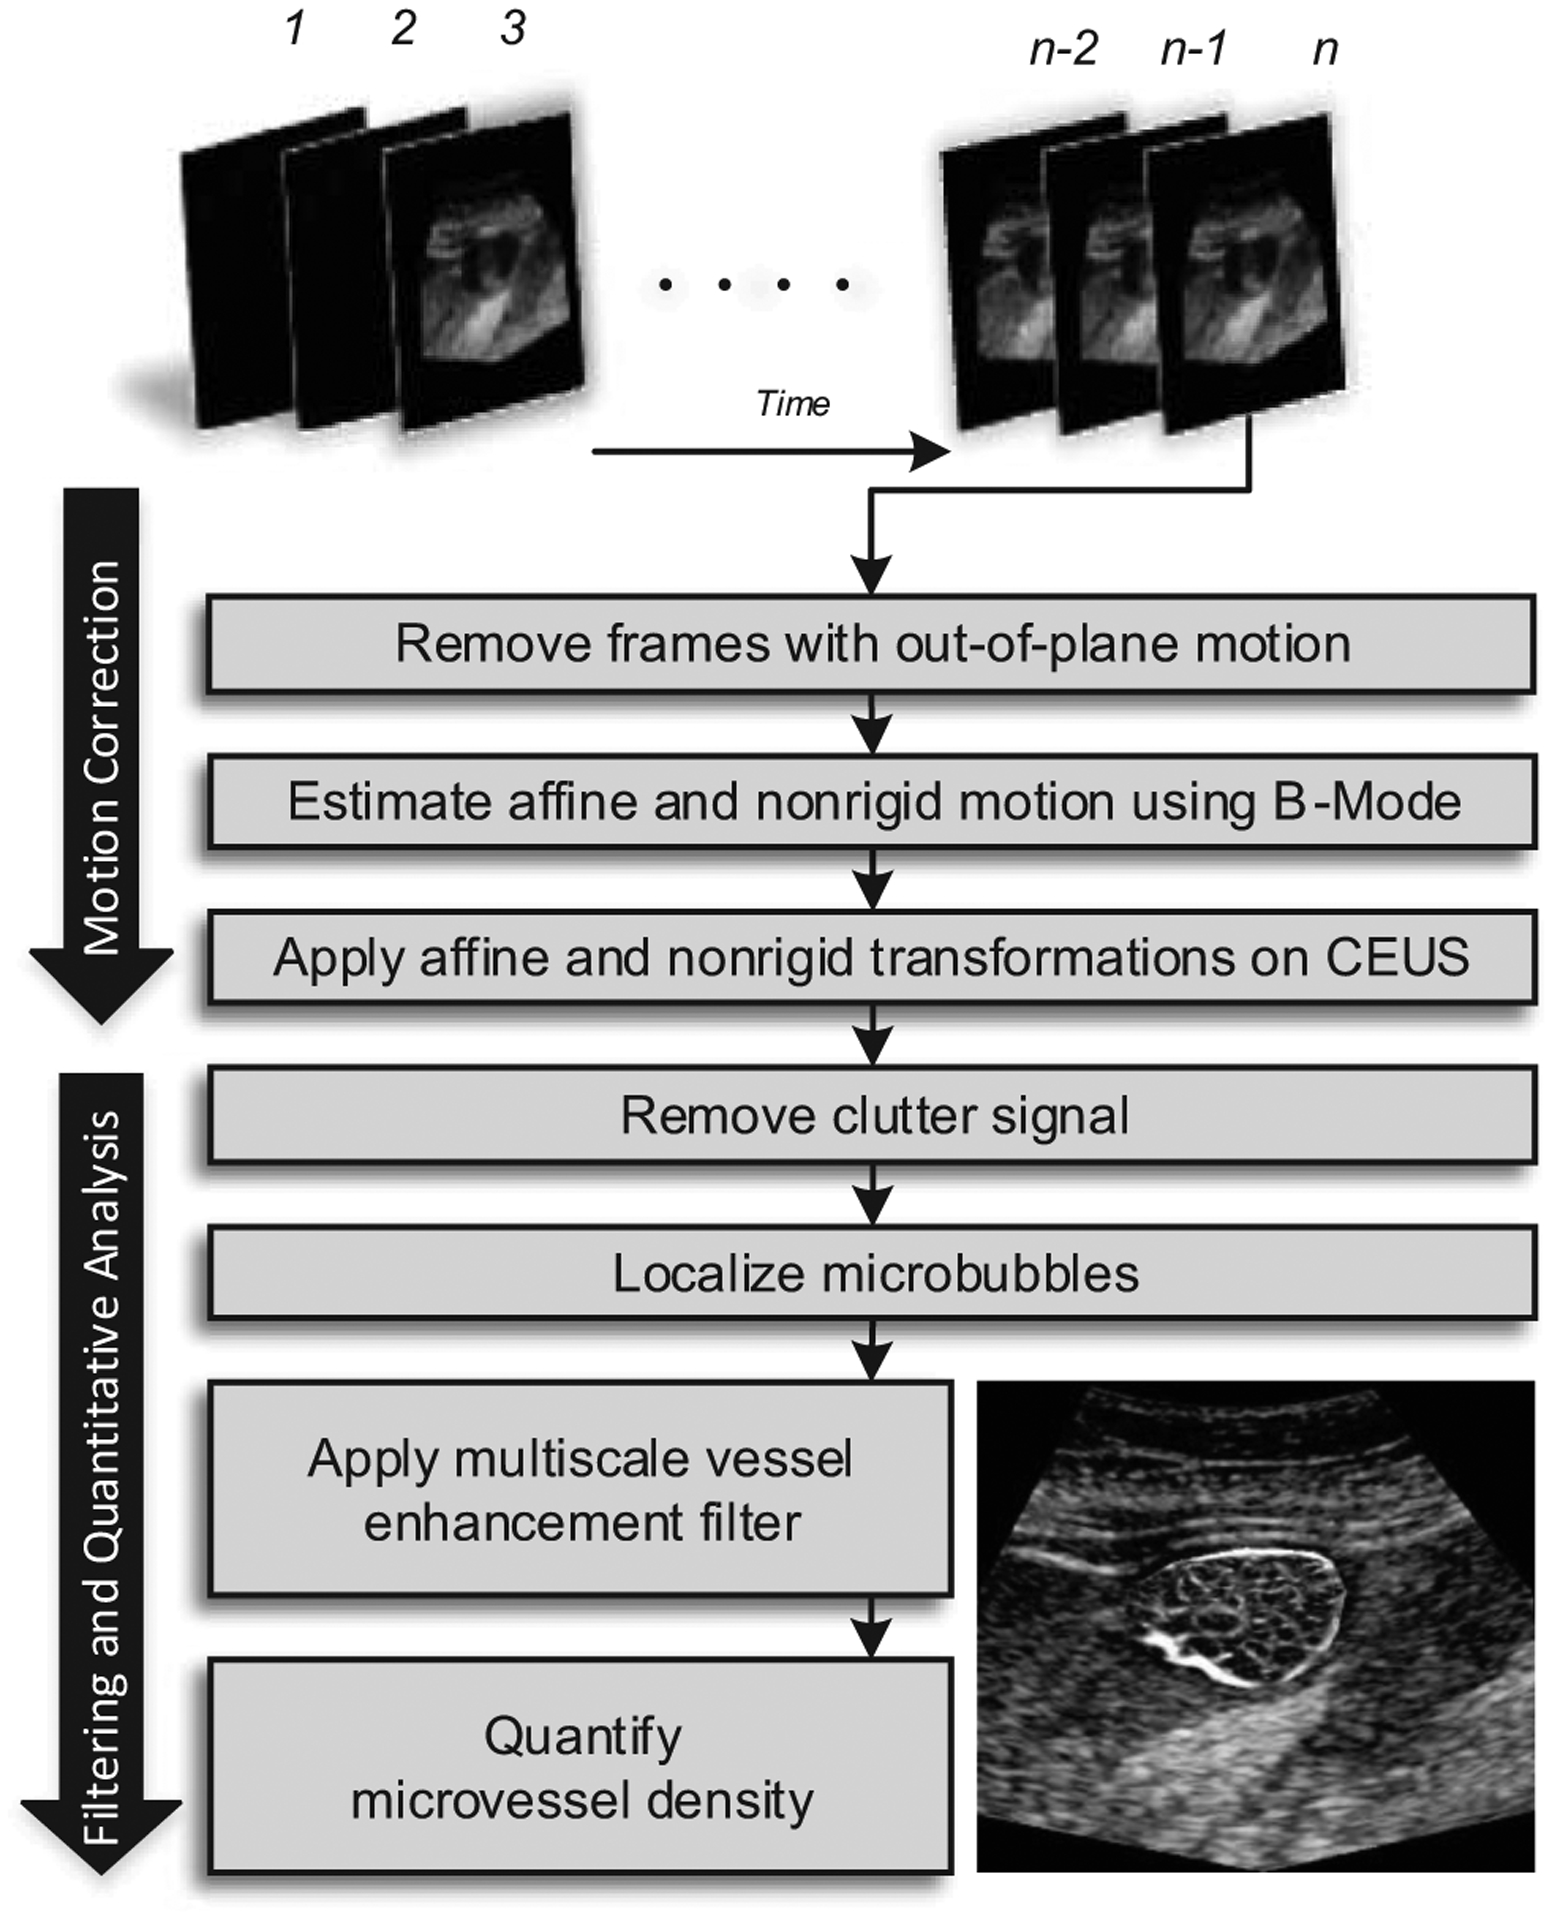
Diagram of the data processing strategy used for the improved quantification of microvascular structures depicted in contrast-enhanced ultrasound (CEUS) images.
Fig. 2.
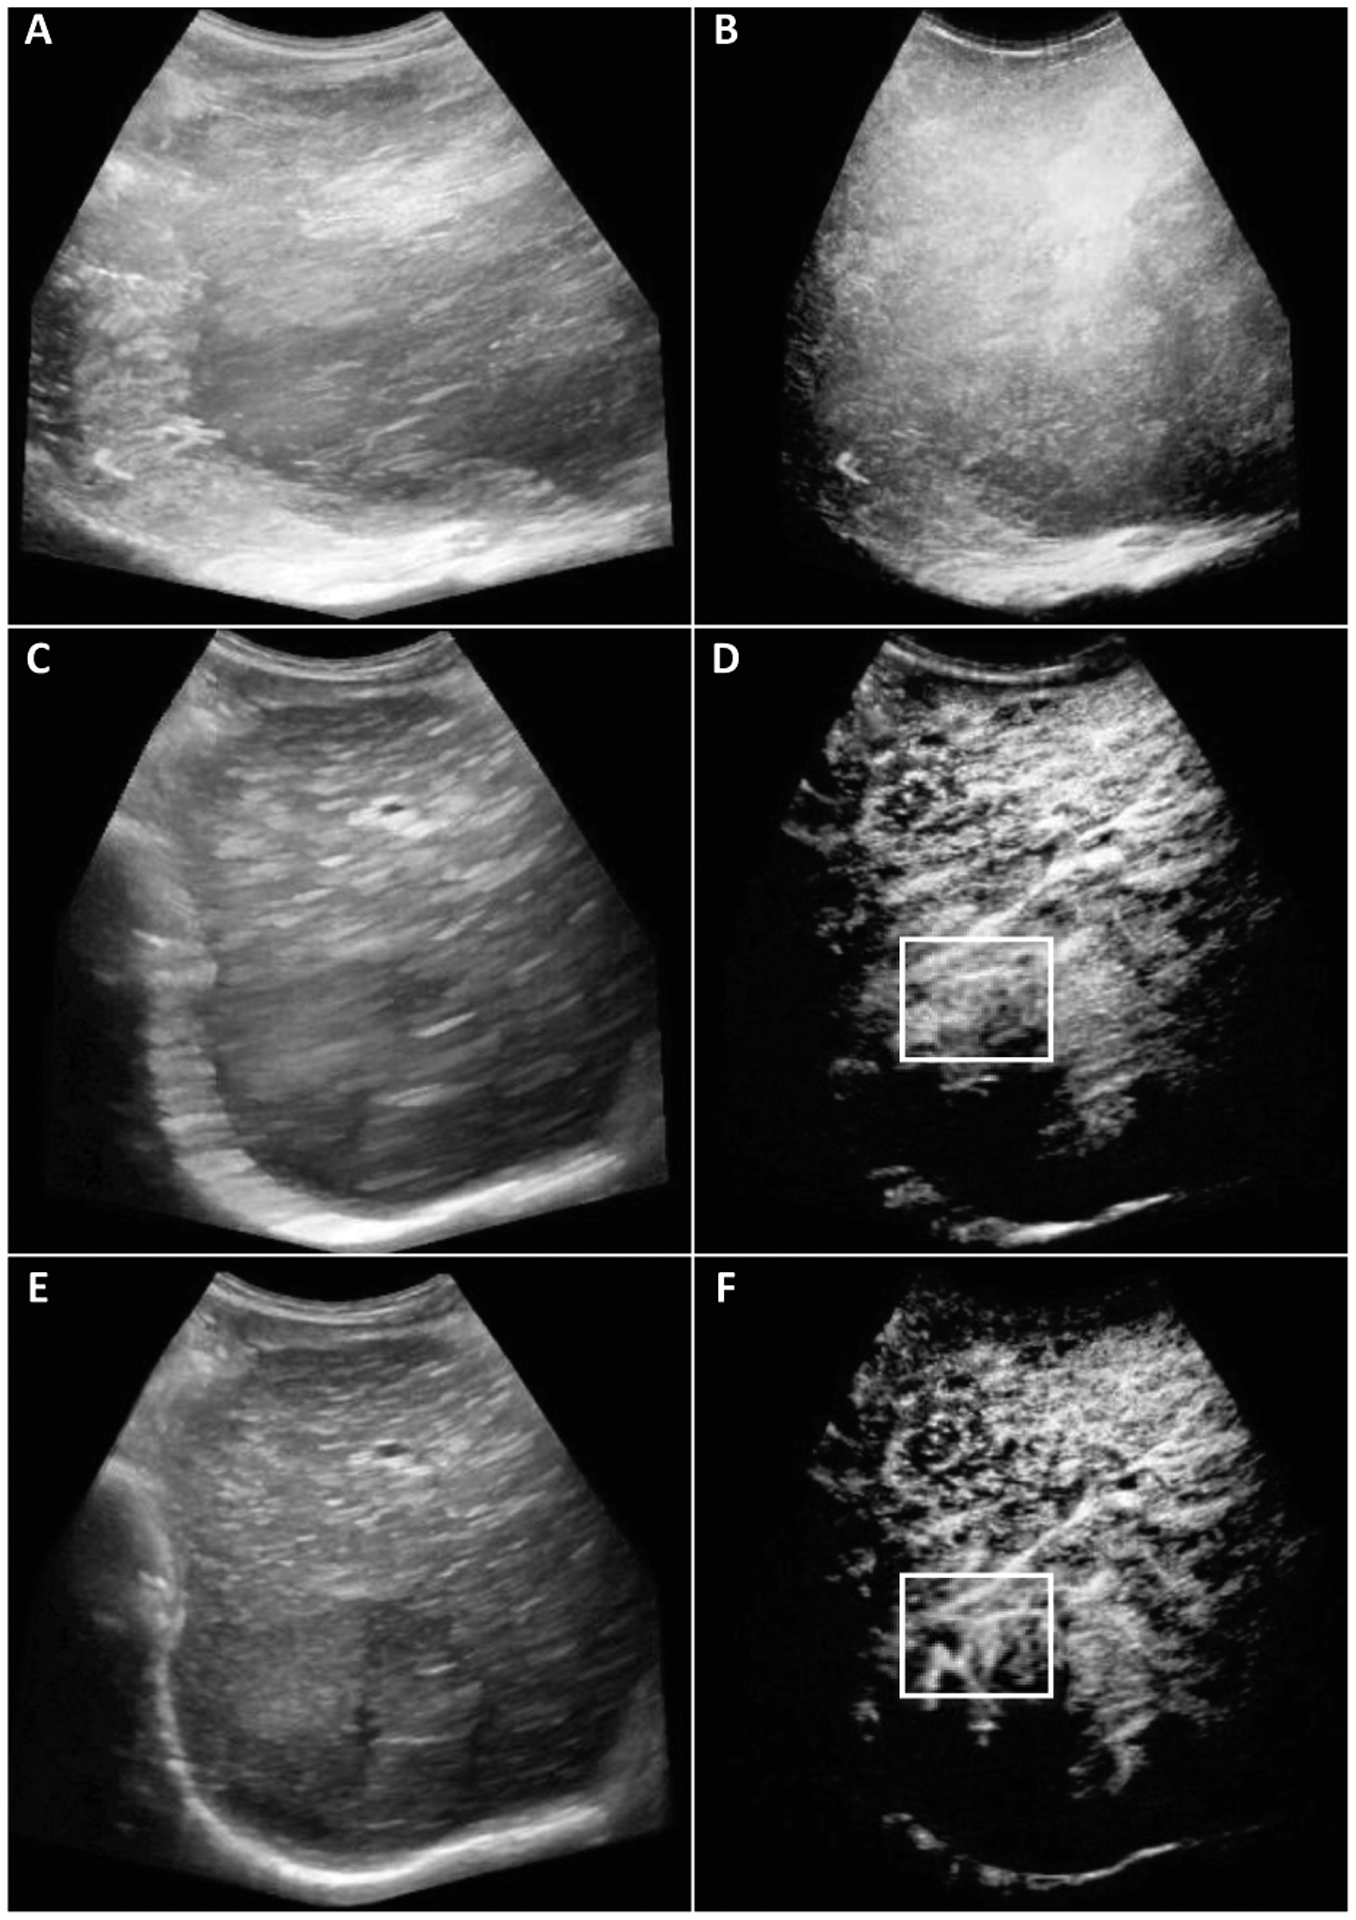
Original (A-B), out-of-plane frames eliminated (C-D), the resulting motion corrected (E-F) B-Mode (left) and CEUS (right) maximum intensity projection (MIP) images from 787, 255, and 255 frames respectively. Image size was 649×585 pixels. Highlighted changes in the white box did not contain any vessels for the original image while the corrected image shows the vessels, bifurcations, and tortuosity.
C. Evaluation Metric
The CC was used as performance metric to demonstrate improvement after motion correction of CEUS images and given by:
where A and B are images, m and n are pixel coordinates, and , are the mean intensity values A and B respectively. MVD levels were then calculated to see if these will reflect the therapy response assessed by clinical results [10].
III. RESULTS AND DISCUSSION
From 8 subjects, the patient outcome of 3 subjects were incomplete and 5 subjects of them were complete response assessed by clinical criteria and MR imaging results [10]. Representative B-mode and CEUS images of human HCC are depicted in Fig. 2. Before motion correction, vessels were not visible in certain image regions. Note that subject motion is akin to image smoothing (blurring) and masks some smaller vascular structures. However, after applying our motion correction strategy, more vascular structures were visible, allowing for quantification of certain morphological features, e.g. vessel length, number of bifurcations, vessel tortuosity and diameter.
Longitudinal CEUS images from an example of a complete HCC response to TACE treatment was depicted in Fig. 3. Relative changes in MVD values were more pronounced after motion correction of the CEUS images due to a fundamental improvement in vascular network visualization. Fig. 4 shows images from a representative incomplete response. The vascularity in the ROI from original images have high intensity values in every pixel because of motion artifacts. The motion corrected version of the same ROI has clearer visualized vascular network. Compared to the images in Fig 2., the motion corrected images from Fig. 3 and Fig. 4 had higher intensity values, because the latter were processed with the vessel enhancement filter after motion correction.
Fig. 3.
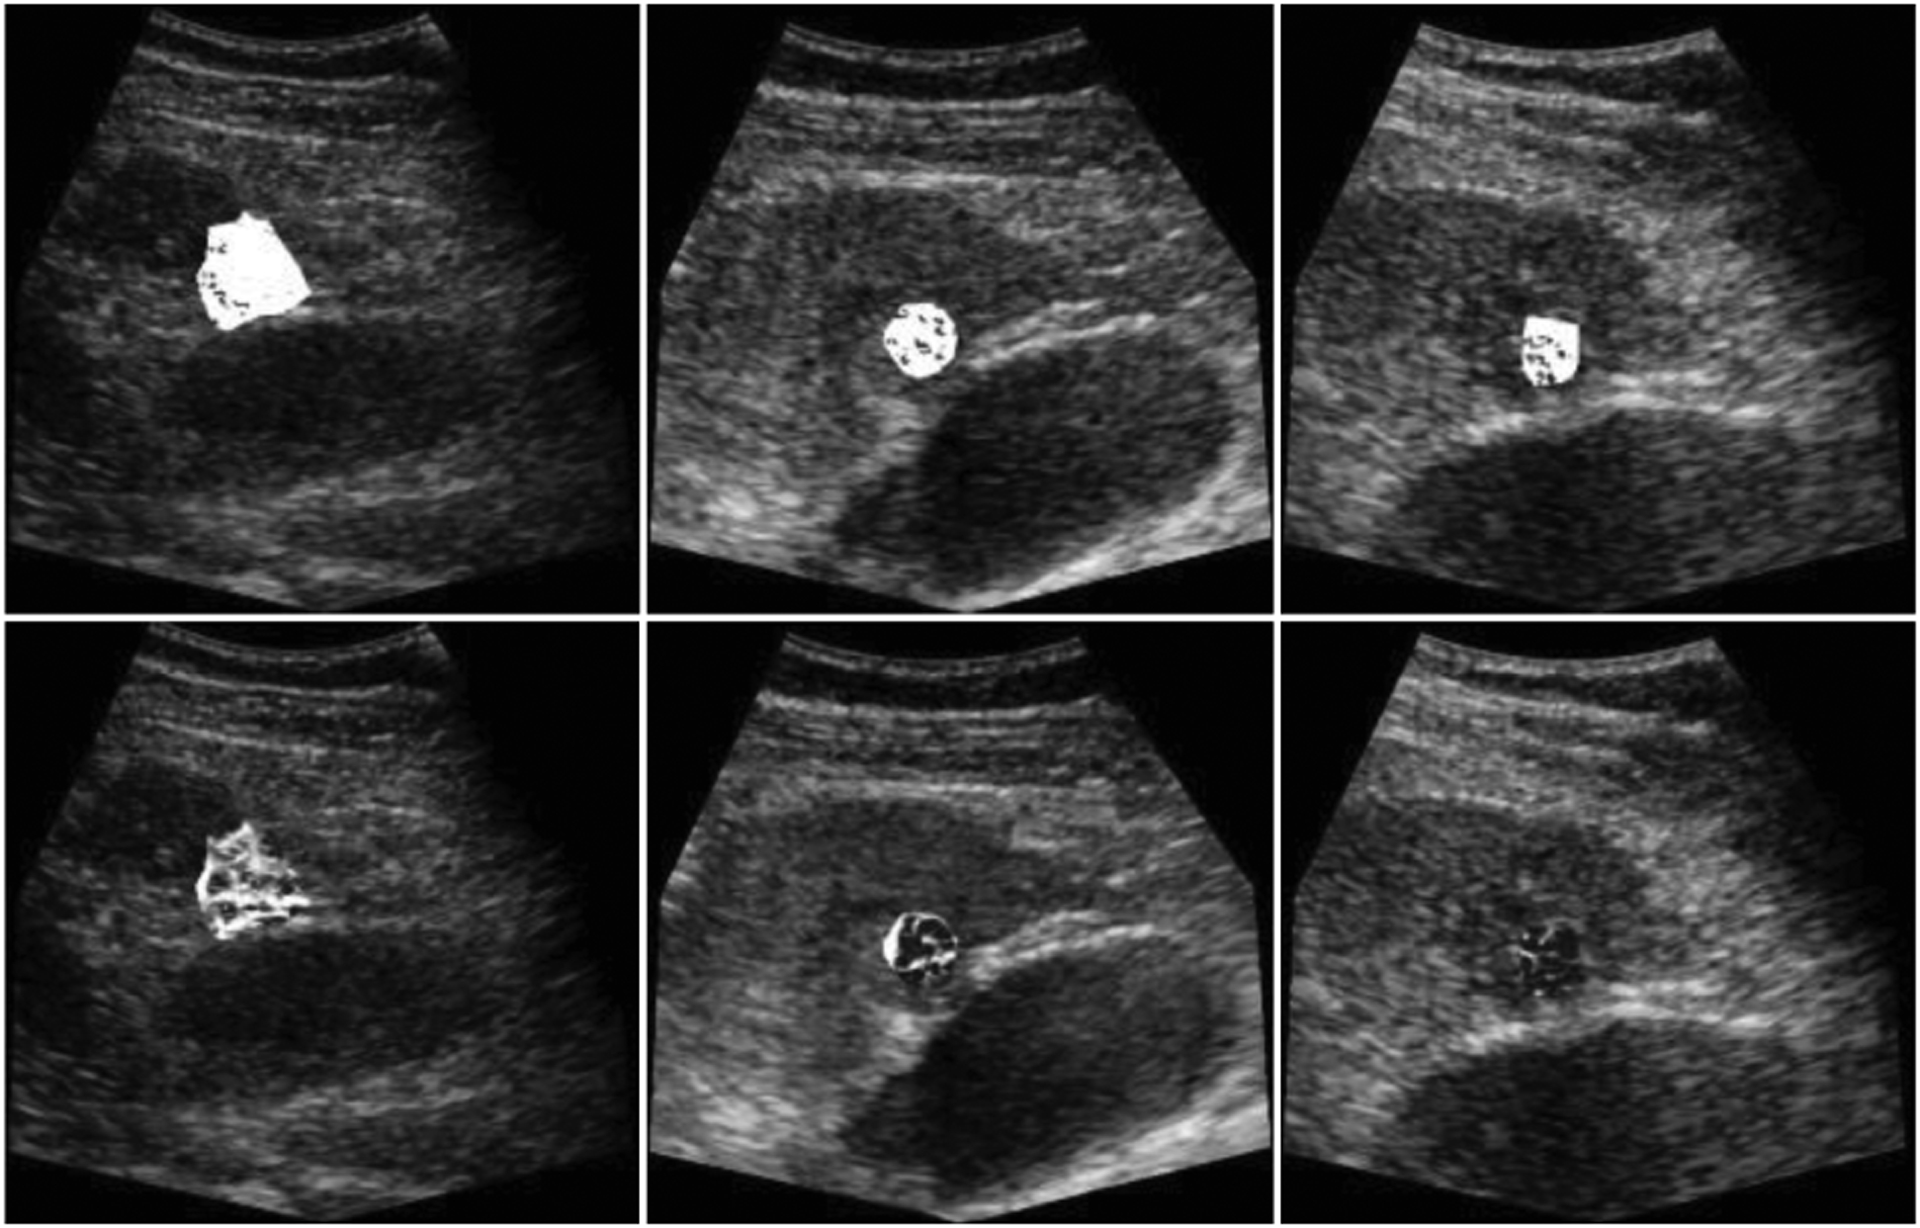
Vessel enhancement from region-of-interests (ROIs) were performed on the MIP of 255 frames and overlaid on a single B-Mode image for baseline (left), after two-wk (middle), and four-wk (right). The complete response from the clinical results were in line with the images (bottom). Dense vascularity on the baseline decreased after two- and four-wk. These temporal changes of the vascular morphology were not observable from the images (top) corrupted with motion.
Fig. 4.
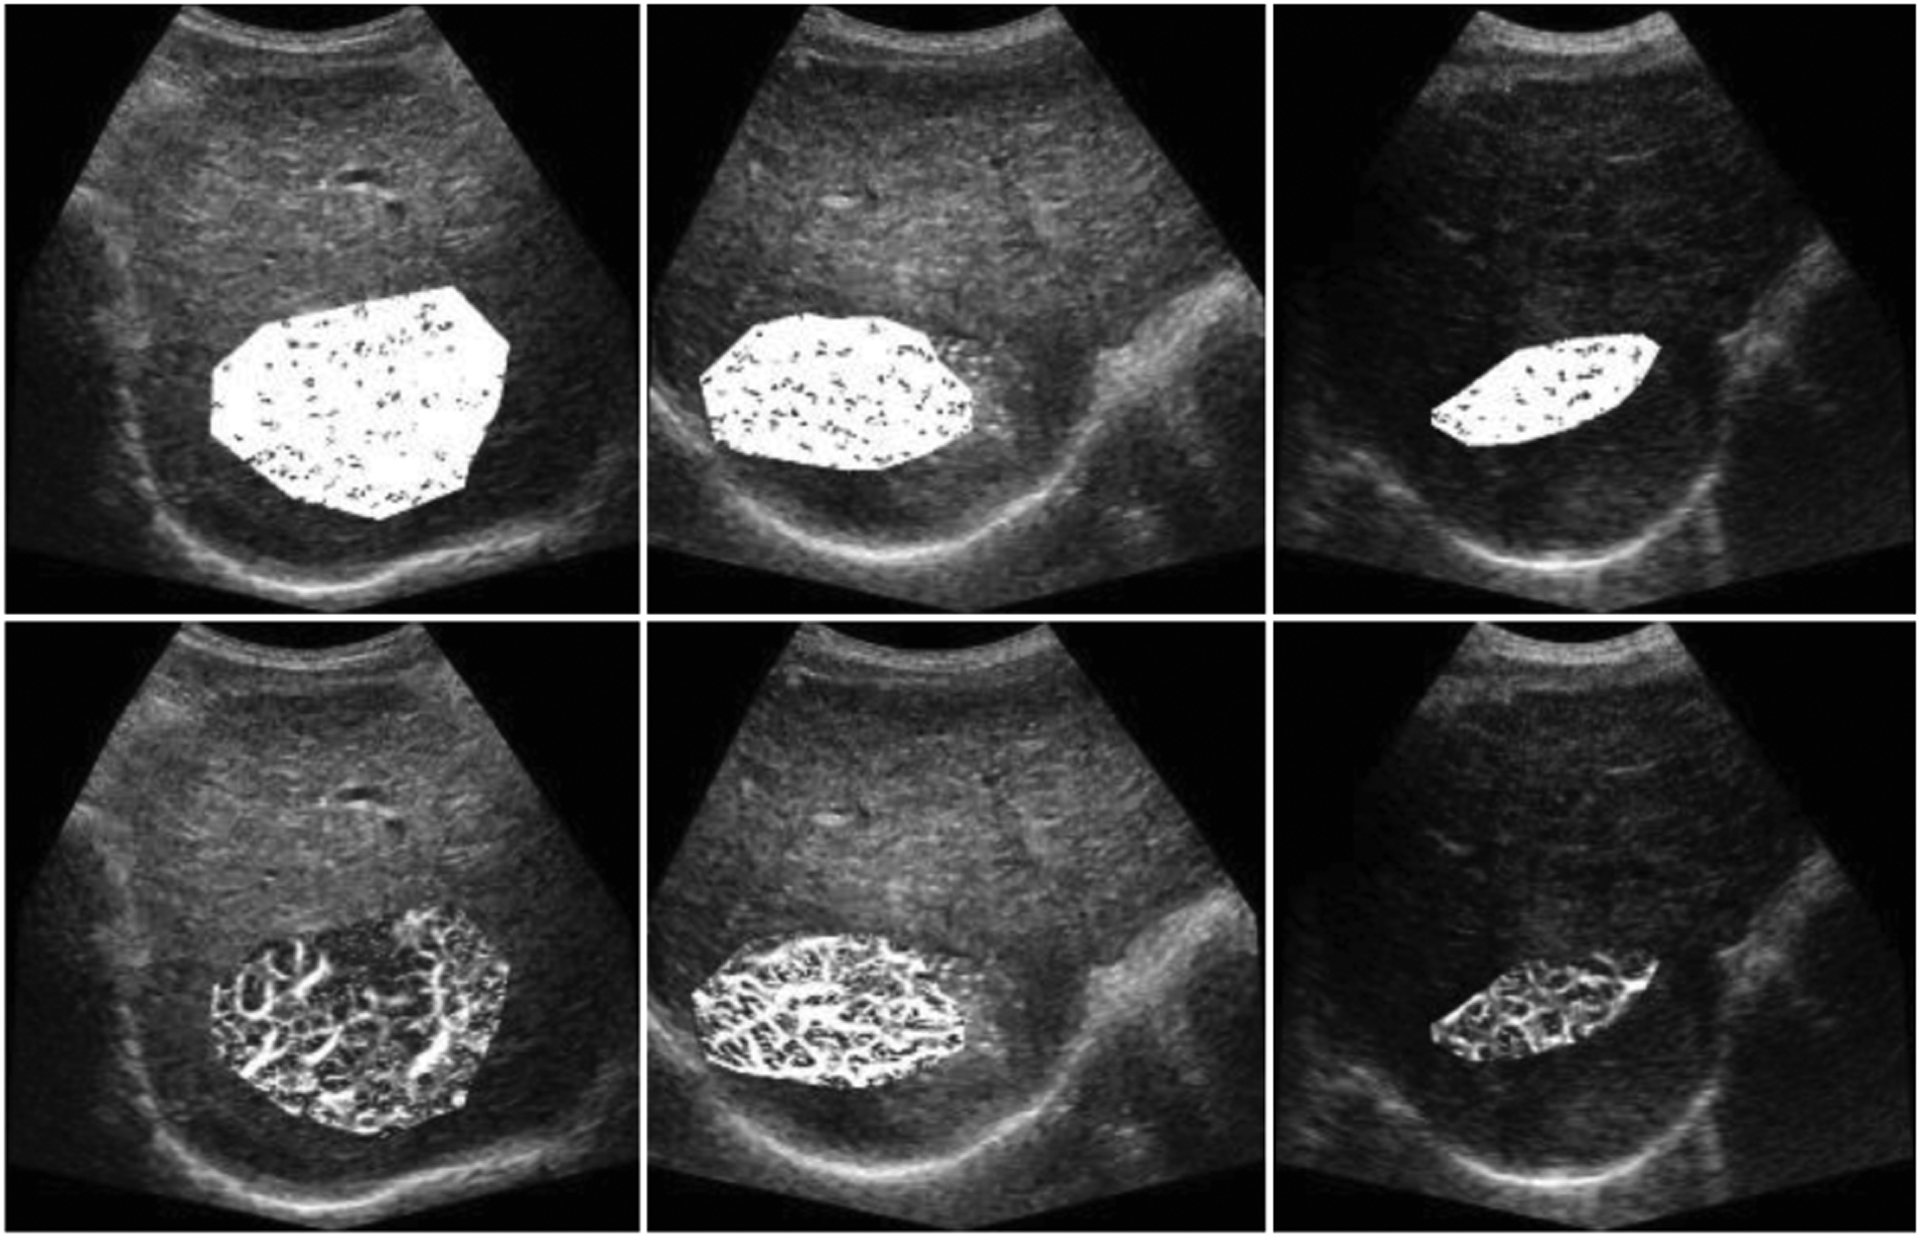
Vessel enhancement of ROIs was performed on the MIP of 255 frames and overlaid on a single B-Mode images for baseline (left), after two-wk (middle), and four-wk (right). Images (top) contain motion artifacts. The incomplete response from the clinical results was reflected on the images (bottom). Densely vascularized tumor on the baseline was preserved after two and four wk.
Results from complete response subjects showed rapidly decreasing MVD values after TACE treatment at the second and fourth wk when using motion corrected images. MVD values 0.92, 0.82, 0.80 at first, second, and fourth wk from the original data while motion corrected MVDs, e.g. 0.66, 0.35, 0.19 were in line with the therapy response as it can be seen in Fig. 5. The original MVD values were 0.91, 0.89, 0.89, while motion corrected MVDs were first decreasing and then increasing, e.g. 0.52, 0.61, 0.55, that can explain the incomplete therapy response.
Fig. 5.
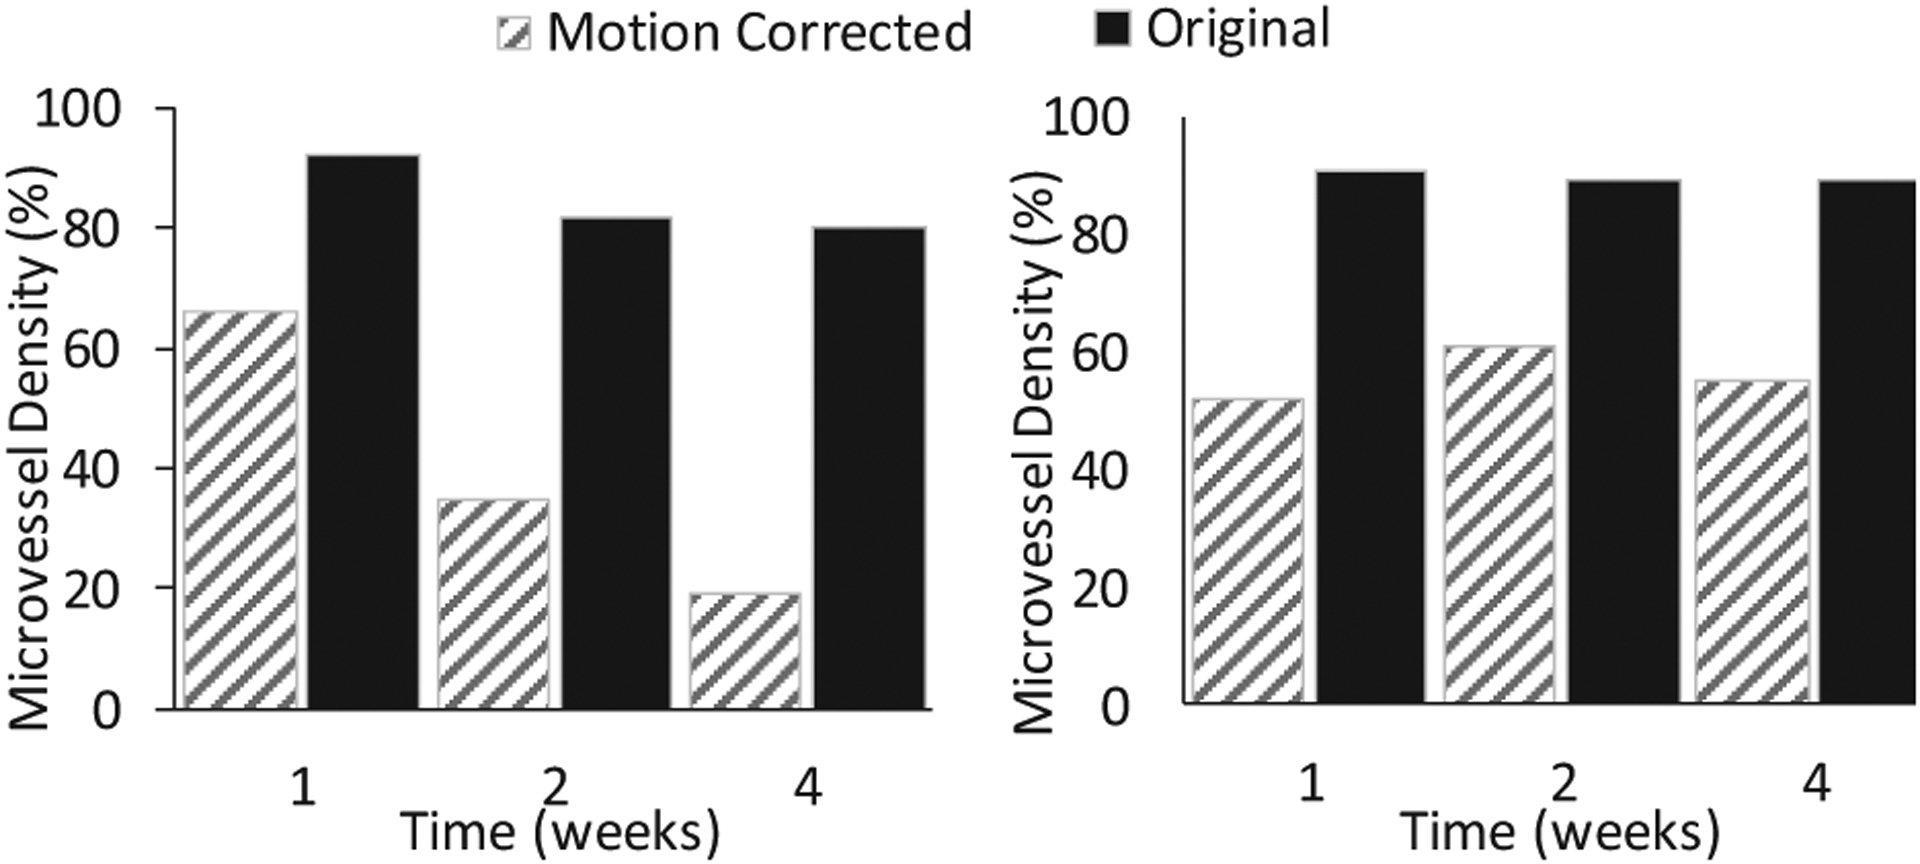
Higher relative changes in MVD values for complete response subject when motion was corrected (left). Consistent MVD values indicating the incomplete response to the therapy (right).
Fig. 6 illustrates improved CC for each time point from the representative subject. CCs between reference frame and subsequent frames of the entire cine were computed for corrected and noncorrected cines. Higher CC values represent higher similarities between the ROIs from the images.
Fig. 6.
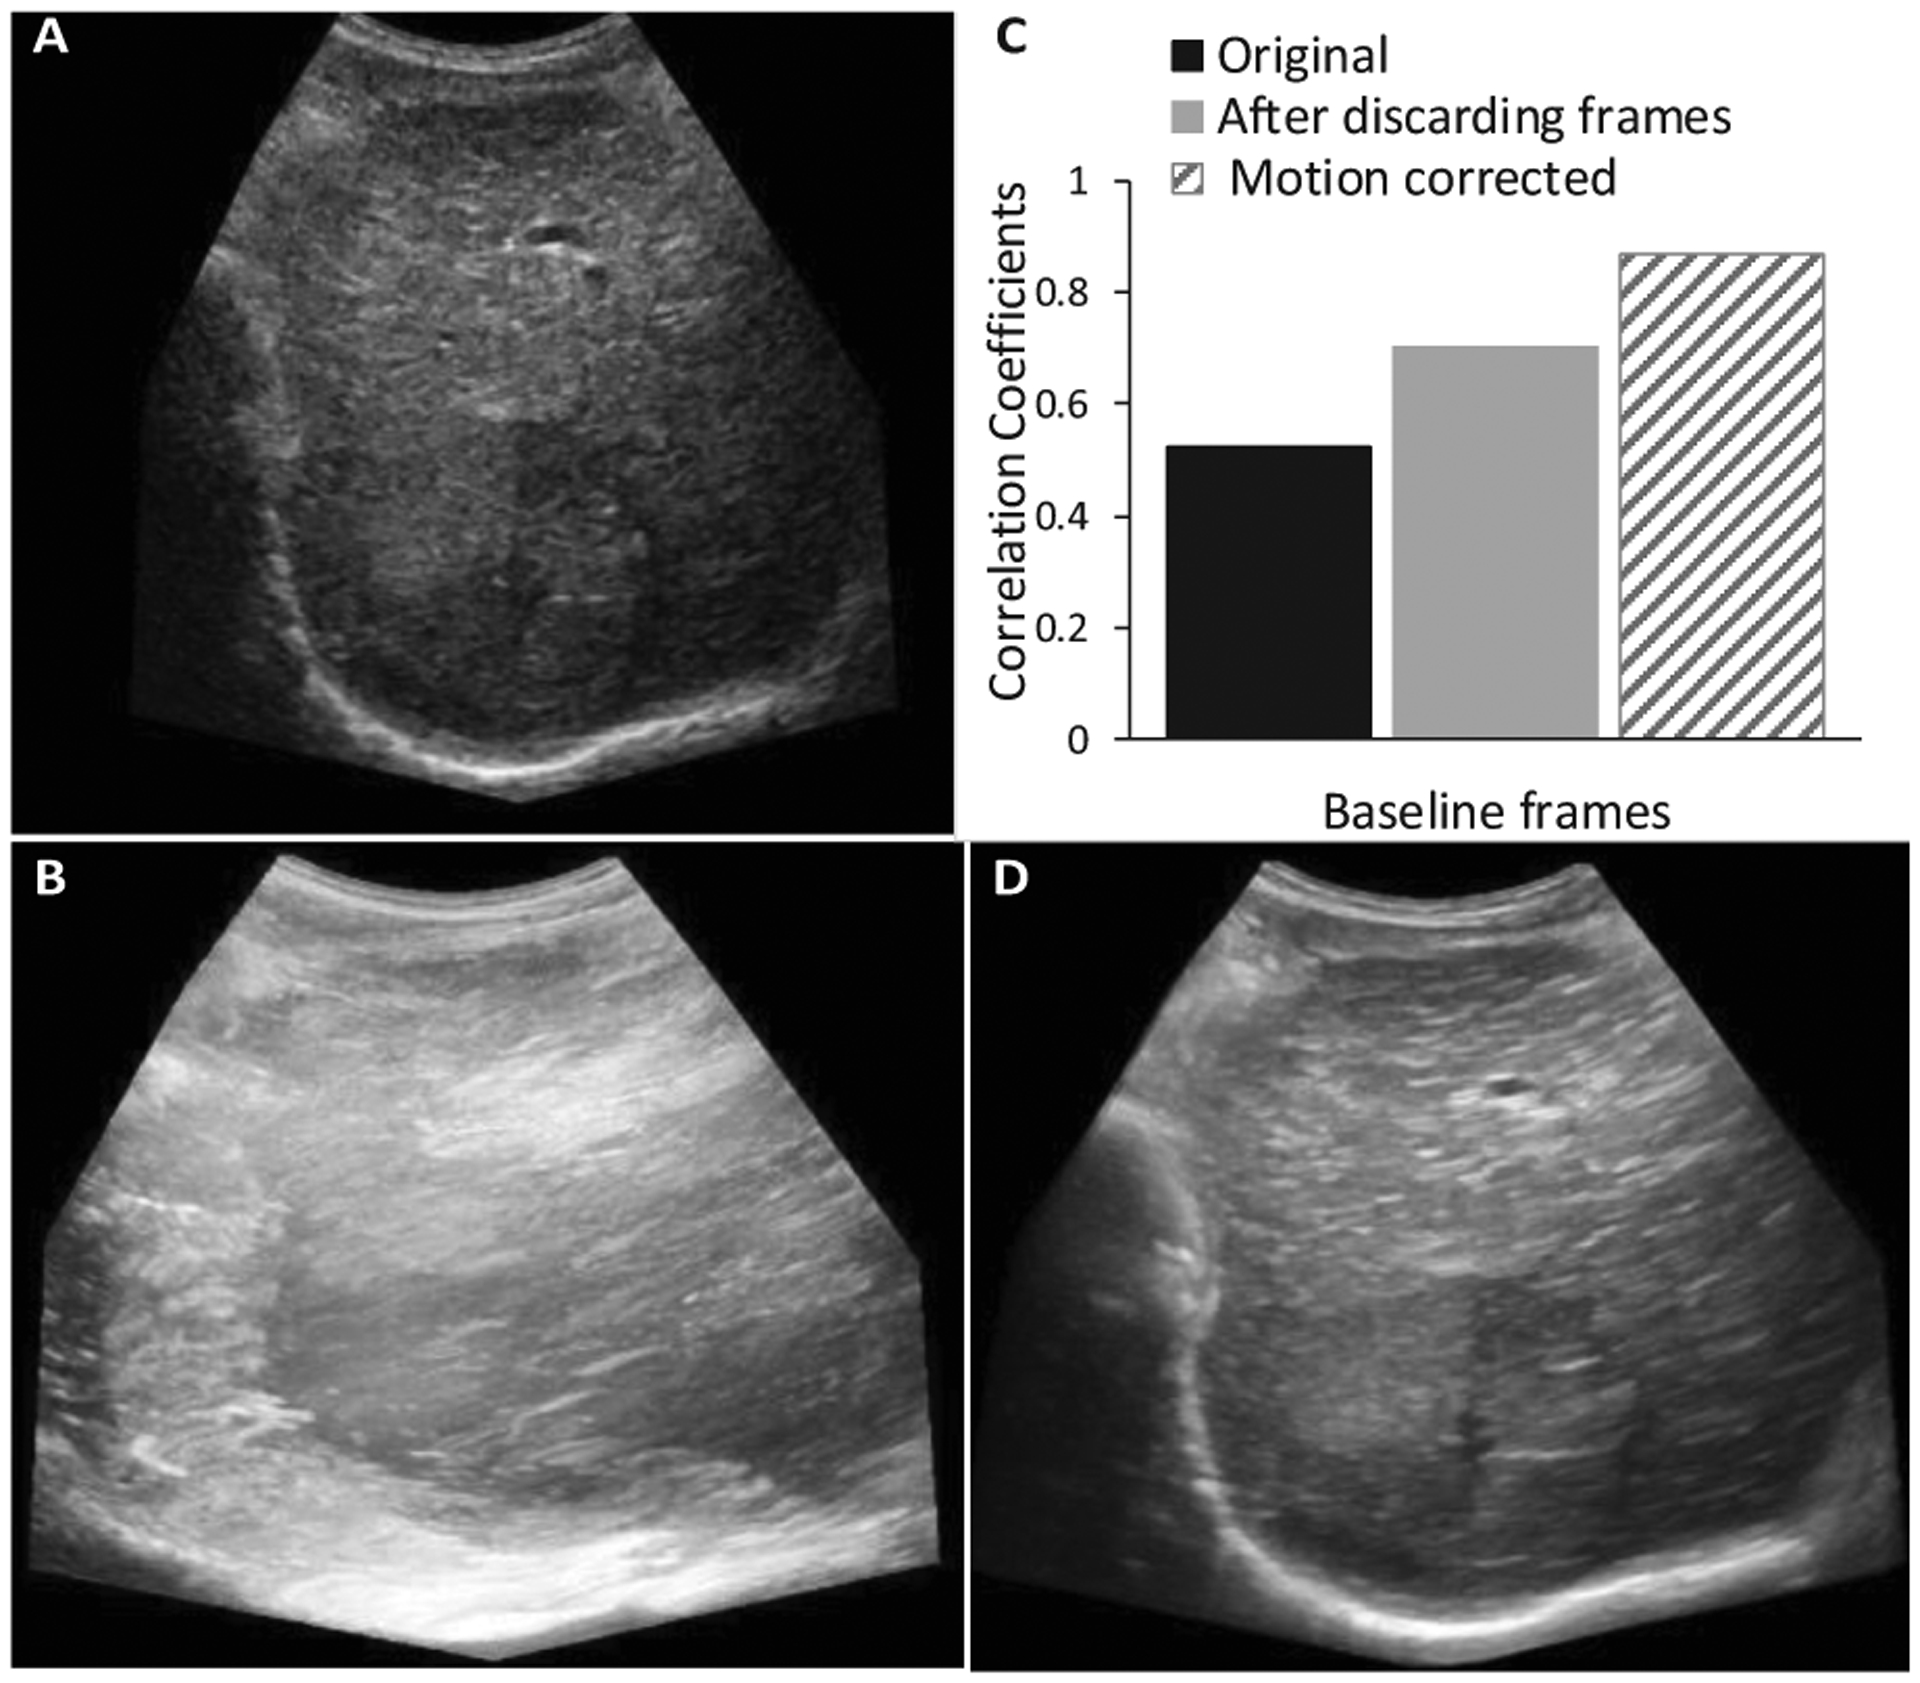
Single B-Mode as reference (A), MIP before (B) and after (D) motion correction. The CC values (C) were obtained for original full number of frames (787), for the frames (255) after discarding the out-of-plane motion, and for the corrected frames (255).
Finally, CC values from all frames of the eight subjects imaged at three time points each, were taken and compared with and without motion correction. The summary statistics from what a two-sample t-test was performed resulted in a significant (p < 0.001) difference between all original and motion corrected frames based on CC values.
IV. CONCLUSIONS
After TACE treatment, detection of intratumoral vascular structures during CEUS imaging can help inform additional procedures. Overall, motion correction of CEUS images improves visualization of the tumor microvasculature and any subsequent quantification of these structures. Future work will investigate the relationship between tumor microvascular morphology features at baseline and following both partial and complete TACE treatment successes.
ACKNOWLEDGMENT
This work was supported in part by NIH grants R01CA194307, R21CA212851, K25EB017222 and Cancer Prevention and Research Institute of Texas (CPRIT) grant RP180670. The authors also acknowledge the Texas Advanced Computing Center (TACC) at the University of Texas at Austin for providing HPC resources that have contributed to the research results reported within this paper. URL: http://www.tacc.utexas.edu.
REFERENCES
- [1].Saini R and Hoyt K, “Recent developments in dynamic contrast-enhanced ultrasound imaging of tumor angiogenesis,” Imaging Med, vol. 6, no. 1, pp. 41–52, 2014. [DOI] [PMC free article] [PubMed] [Google Scholar]
- [2].Hoyt K, Sorace A, and Saini R, “Quantitative mapping of tumor vascularity using volumetric contrast-enhanced ultrasound,” Invest Radiol, vol. 47, no. 3, pp. 167–174, 2012. [DOI] [PMC free article] [PubMed] [Google Scholar]
- [3].Hoyt K, Umphrey H, Lockhart M, Robbin M, and Forero-Torres A, “Ultrasound imaging of breast tumor perfusion and neovascular morphology,” Ultrasound Med Biol, vol. 41, no. 9, pp. 222292–2302, Sep. 2015. [DOI] [PMC free article] [PubMed] [Google Scholar]
- [4].Hoyt K et al. , “Determination of breast cancer response to bevacizumab therapy using contrast-enhanced ultrasound and artificial neural networks,” J Ultrasound Med, vol. 29, no. 4, pp. 577–585, 2010. [DOI] [PMC free article] [PubMed] [Google Scholar]
- [5].Ghosh D et al. , “Monitoring early tumor response to vascular targeted therapy using super-resolution ultrasound imaging,” Proc IEEE Ultrason Symp, pp. 1–4, 2017. [Google Scholar]
- [6].Hoyt K, Sorace A, and Saini R, “Volumetric contrast-enhanced ultrasound imaging to assess early response to apoptosis-inducing anti-death receptor 5 antibody therapy in a breast cancer animal model,” J Ultrasound Med, vol. 31, no. 11, pp. 1759–1766, 2012. [DOI] [PMC free article] [PubMed] [Google Scholar]
- [7].Rueckert D, Sonoda LI, Hayes C, Hill DLG, Leach MO, and Hawkes DJ, “Nonrigid registration using free-form deformations: application to breast MR images,” IEEE Transactions on Medical Imaging, vol. 18, no. 8, pp. 712–721, Aug. 1999. [DOI] [PubMed] [Google Scholar]
- [8].Harput S et al. , “Two-Stage Motion Correction for SuperResolution Ultrasound Imaging in Human Lower Limb,” IEEE Transactions on Ultrasonics, Ferroelectrics, and Frequency Control, vol. 65, no. 5, pp. 803–814, May 2018. [DOI] [PubMed] [Google Scholar]
- [9].Foiret J, Zhang H, Ilovitsh T, Mahakian L, Tam S, and Ferrara KW, “Ultrasound localization microscopy to image and assess microvasculature in a rat kidney,” Scientific Reports, vol. 7, no. 1, p. 13662, Oct. 2017. [DOI] [PMC free article] [PubMed] [Google Scholar]
- [10].Nam K et al. , “Evaluation of hepatocellular carcinoma transarterial chemoembolization using quantitative analysis of 2D and 3D real-time contrast enhanced ultrasound,” Biomedical Physics & Engineering Express, vol. 4, no. 3, p. 035039, Apr. 2018. [DOI] [PMC free article] [PubMed] [Google Scholar]
- [11].“B-spline Grid, Image and Point based Registration - File Exchange - MATLAB Central.” [Online]. Available: https://www.mathworks.com/matlabcentral/fileexchange/20057. [Accessed: 23-Dec-2018].
- [12].Mauldin FW, Lin D, and Hossack JA, “The Singular Value Filter: A General Filter Design Strategy for PCA-Based Signal Separation in Medical Ultrasound Imaging,” IEEE Transactions on Medical Imaging, vol. 30, no. 11, pp. 1951–1964, Nov. 2011. [DOI] [PMC free article] [PubMed] [Google Scholar]
- [13].Ghosh D et al. , “Super-resolution ultrasound imaging of the microvasculature in skeletal muscle: A new tool in diabetes research,” in 2017 IEEE International Ultrasonics Symposium (IUS), 2017, pp. 1–4. [Google Scholar]
- [14].Frangi AF, Niessen WJ, Vincken KL, and Viergever MA, “Multiscale vessel enhancement filtering,” in SpringerLink, 1998, pp. 130–137. [Google Scholar]


