

Abstract
Microarray technology has been successfully used in many biology studies to solve the protein–protein interaction (PPI) prediction computationally. For normal tissue, the cell regulation process begins with transcription and ends with the translation process. However, when cell regulation activity goes wrong, cancer occurs. Microarray data can precisely give high accuracy expression levels at normal and cancer-affected cells, which can be useful for the identification of disease-related genes. First, the differentially expressed genes (DEGs) are extracted from the cancer microarray dataset in order to identify the genes that are up-regulated and down-regulated during cancer progression in the human body. Then, proteins corresponding to these genes are collected from NCBI, and then the STRING web server is used to build the PPI network of these proteins. Interestingly, up-regulated proteins have always a higher number of PPIs compared to down-regulated proteins, although, in most of the datasets, the majority of these DEGs are down-regulated. We hope this study will help to build a relevant model to analyze the process of cancer progression in the human body.
Supplementary Information
The online version contains supplementary material available at 10.1007/s10930-022-10081-6.
Introduction
Understanding the biological and molecular processes connected to various disease networks, such as cancer, depends heavily on the study of protein–protein interaction (PPI). Genes produce proteins as their end result. Consequently, PPI can benefit from the information that a microarray gene expression dataset can provide [1]. It provides the expression levels of thousands of genes in the tumor as well as in normal cells at a specific time and condition. Microarrays have been used extensively in the study of biological mechanisms, the discovery of new therapeutic targets, and the assessment of medication responses [2]. Many research papers published to date have primarily concentrated on identifying differentially expressed genes(DEGs) between tumors and normal cells, which does not directly reveal gene-gene connections [3]. However, PPI is a critical methodology for identifying gene-gene interactions [4], which can help us better comprehend complex biological mechanisms. It has been established by many researchers that PPI can identify key genes and pathways in a variety of human malignancies [5].
Data and Methods
Datasets
Four independent cancer gene expression dataset, namely, Gastric Cancer, Lung Cancer (Squamous cell carcinoma and Adenocarcinoma), Prostate Cancer and Hypopharyngeal Cancer, are downloaded from (http://www.biolab.si/supp/bi-cancer/projections). The microarray dataset contains the gene expression data of genes and samples. These samples consist of cancer samples, and normal tissue samples. Detailed information of datasets are listed in Table 1.
Table 1.
Characteristics of datasets in this study
| Dataset | Cancer type | Platform | Sample | Number of genes | |
|---|---|---|---|---|---|
| Tumor | Normal | ||||
| GSE1987 | Lung cancer | Affymetrix GeneChip Human Genome U95 Version [1 or 2] Set HG-U95A | 25 | 9 | 10541 |
| GSE2685 | Gastric cancer | Affymetrix GeneChip Human Full Length Array HuGeneFL | 22 | 8 | 4522 |
| Singh et al. | Prostate cancer | Affymetrix Human Genome U95Av2 Array | 52 | 50 | 12533 |
| GSE2379 | Hypophary-ngeal cancer | Affymetrix GeneChip Human Genome U95 Version [1 or 2] Set HG-U95A | 34 | 4 | 9021 |
Differential Gene Expression Dataset
The microarray data contains the expression patterns of thousands of distinct genes under different conditions. A diagrammatic representation of microarray gene expression data is depicted in Fig. 1 below. When a statistically significant difference in expression levels between two experimental circumstances, such as a disease state and a healthy state, is seen, the differential gene expressions are determined. Finding the differentially expressed genes (DEGs) is crucial to determining which genes are activated or deactivated as a result of a specific disease’s invasion of the human body. A very effective technique to comprehend the roles of the genes and their potential regulatory mechanisms for disease onset and development is to investigate the DEGs linked to cancer. In the present research, we used the R packages edgeR [6] and limma package [7] to evaluate the DEGs between lung cancer and healthy tissues. To identify the significant DEGs, the criterion of log2|FC| with a threshold of 1.5 and p = 0.05 was utilized.
Fig. 1.
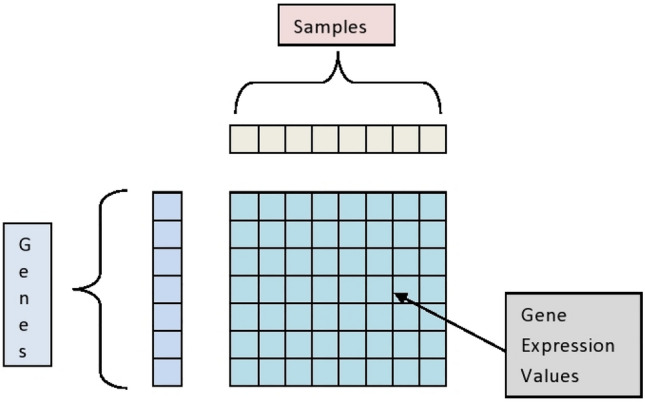
The diagrammatic representation of the microarray gene expression data
Construction of Protein–Protein Interaction Network
The probes are first translated into the Entrez gene ID using R programming. The probes that had no Entrez ID are repositioned. Then the PPI network is created from the Search Tool for the Retrieval of Interacting Genes (STRING) by mapping the set of up-regulated and down-regulated genes to related proteins using R programming. The PPI networks were built using text mining, experiments, and databases, and species limited to “Homo sapiens”.
Results
Identification of DEGs
All the cancer samples and normal samples of different dataset are analyzed in our study [8]. According to our cutoff criteria (adjust value<0.05), the up-regulated and the down-regulated DEGs are identified between the cancer group and the normal group. The complete list is mentioned in Table 2 and its graphical representation is shown in Fig. 2.
Table 2.
Number of differentially expressed genes in different cancer dataset
| Cancer type | Up-regulated | Down-regulated |
|---|---|---|
| Lung | 461 | 738 |
| Gastric | 621 | 691 |
| Prostate | 1338 | 1876 |
| Hypopharyngeal | 394 | 473 |
Fig. 2.
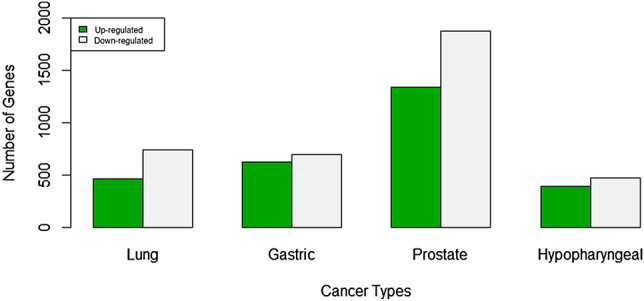
Up-regulated vs. Down-regulated DEGs
PPI Network
The up-regulated and down-regulated proteins’ respective DGEs are used to build the PPI network. There are 3 types of thresholds offered by STRING to create a PPI network: low(value 0.4), medium (value 0.7), and high (value 0.9). We have considered these three interaction scores as the threshold to build the PPI network. We have noted that the number of down-regulated proteins is higher than the up-regulated proteins in each and every case (Table 2). However, the up-regulated proteins have more PPIs compared to the down-regulated ones in all cancer microarray datasets we have considered in this study Table 3, 4, 5, 6, and Figs. 3, 4, 5, and 6 show that the down-regulated proteins have many fewer PPIs compared to the up-regulated proteins.
Table 3.
Number of PPIs of up-regulated and down-regulated proteins of lung cancer considering three thresholds 0.4, 0.7 and 0.9
| Lung cancer | ||
|---|---|---|
| Threshold | Up | Down |
| 0.9 | 146 | 53 |
| 0.7 | 999 | 161 |
| 0.4 | 1311 | 361 |
Table 4.
Number of PPIs of up-regulated and down-regulated proteins of gastric cancer considering three thresholds 0.4, 0.7 and 0.9
| Gastric cancer | ||
|---|---|---|
| Threshold | Up | Down |
| 0.9 | 453 | 22 |
| 0.7 | 809 | 137 |
| 0.4 | 1449 | 357 |
Table 5.
Number of PPIs of up-regulated and down-regulated proteins of prostate cancer considering three thresholds 0.4, 0.7 and 0.9
| Prostate cancer | ||
|---|---|---|
| Threshold | Up | Down |
| 0.9 | 340 | 48 |
| 0.7 | 553 | 152 |
| 0.4 | 1775 | 455 |
Table 6.
Number of PPIs of up-regulated and down-regulated proteins of hypo-pharyngeal cancer considering three thresholds 0.4, 0.7 and 0.9
| Hypo-pharyngeal cancer | ||
|---|---|---|
| Threshold | Up | Down |
| 0.9 | 27 | 5 |
| 0.7 | 52 | 17 |
| 0.4 | 257 | 95 |
Fig. 3.
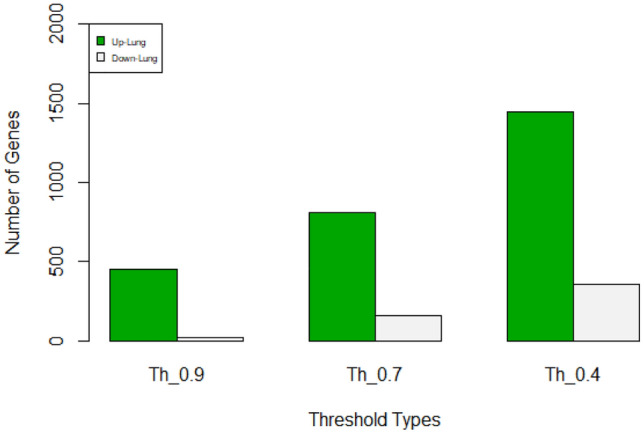
Up-regulated and down-regulated proteins of lung cancer considering three thresholds 0.4, 0.7 and 0.9. Green color represents up-regulated and grey color represents down-regulated proteins
Fig. 4.
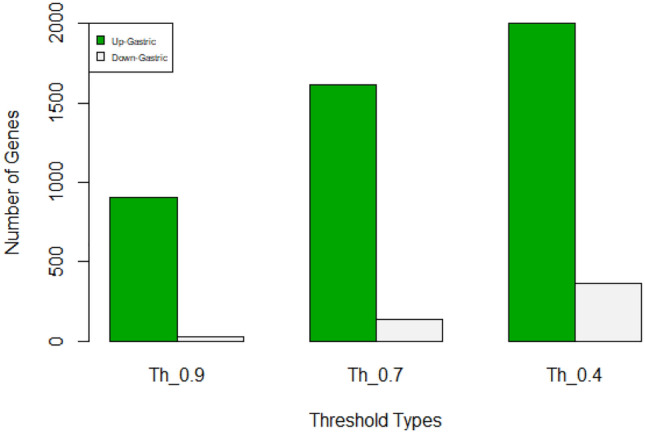
Up-regulated and down-regulated proteins of gastric cancer considering three thresholds 0.4, 0.7 and 0.9. Green color represents up-regulated and grey color represents down-regulated proteins
Fig. 5.
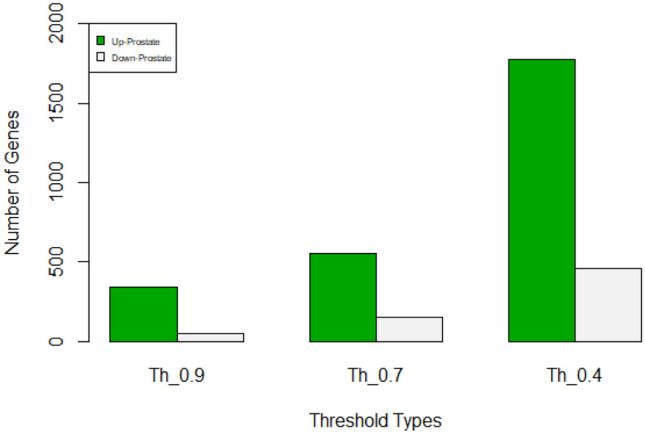
Number of PPIs of up-regulated and down-regulated proteins of prostate cancer considering three thresholds 0.4, 0.7 and 0.9. Green color represents up-regulated and grey color represents down-regulated proteins
Fig. 6.
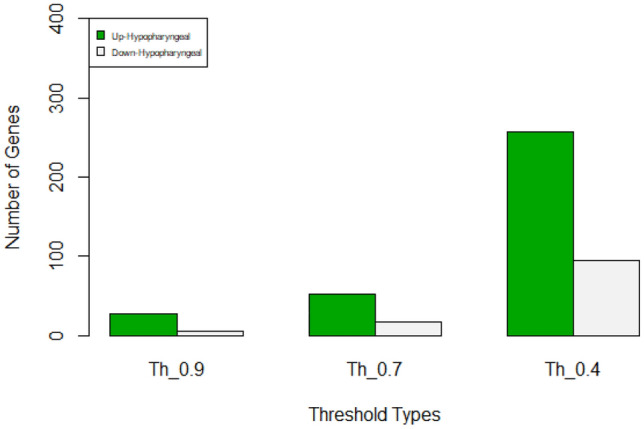
Number of PPIs of up-regulated and down-regulated proteins of hypo-pharyngeal cancer considering three thresholds 0.4, 0.7 and 0.9. Green color represents up-regulated and grey color represents down-regulated proteins
Biological Significance
Gene expression profiling using microarrays has been recognized as a valuable method for the physiological processes involved in response to a specific stimulus. Therefore, understanding the up-regulated and down-regulated proteins helps to handle metabolism-related and pathogen-responsive functions. It is interesting to note that, up-regulated proteins have more PPIs compared to down-regulated proteins. These PPI network helps to identify biomarkers and pathways of several human tumors. In order to understand human diseases, it is necessary to comprehend the network that forms these major biological processes, which are mediated by protein interactions. Although, both the PPI networks build from up and down-regulated proteins are important, up-regulated proteins have much more significance compared to down-regulated ones as up-regulated proteins interact with more human proteins. We have performed a case study on the PPI network of Gastric cancer dataset considering a threshold of 0.7. The up- and down-regulated proteins and their corresponding PPIs are given in supplementary files S1 and S2. We have performed KEGG pathway analysis using David (https://david.ncifcrf.gov/) on the proteins present in the up- and down-regulated PPI network separately and the results are shown in Tables 7 and 8. It can be noted that up-regulated PPI network is mainly involved in DNA replication, Alzheimer disease, Proteasome, Spinocerebellar ataxia, Ribosome, Amyotrophic lateral sclerosis, Mismatch repair etc., where the down-regulated PPI network exhibits Chemokine signaling pathway, Prion disease, Thyroid hormone signaling pathway, Diabetic cardiomyopathy, Human immunodeficiency virus 1 infection etc. In [9] the authors reveal that proteasome function suppression in gastric cancer cells causes apoptosis and these proteasomal inhibitors may be useful as novel anticancer medications in the treatment of gastric cancer. Otabor et al. described some cases patient with ataxia-telangiectasia who had a gastric adenocarcinoma that manifested as a total obstruction of the gastric outlet in [10]. Many studies had shown that Gastric cancer is linked to diabetes mellitus (DM), which has been deemed a risk factor [11].
Table 7.
KEGG enrichment analysis for up-regulated PPI network
| KEGG term | Count | p value |
|---|---|---|
| Proteasome | 16 | 2.20E−13 |
| DNA replication | 12 | 8.70E−10 |
| Cell cycle | 19 | 2.90E−09 |
| Spinocerebellar ataxia | 18 | 1.30E−07 |
| Alzheimer disease | 29 | 5.10E−07 |
| Ribosome | 18 | 5.60E−07 |
| Amyotrophic lateral sclerosis | 28 | 6.00E−07 |
| Mismatch repair | 8 | 1.20E−06 |
| Prion disease | 23 | 1.80E−06 |
| Human papillomavirus infection | 25 | 4.00E−06 |
| Pathways of neurodegeneration—multiple diseases | 31 | 4.10E−06 |
| Parkinson disease | 22 | 4.40E−06 |
| Spliceosome | 16 | 5.20E−06 |
| Viral carcinogenesis | 18 | 1.90E−05 |
| Coronavirus disease—COVID-19 | 19 | 2.80E−05 |
Table 8.
KEGG enrichment analysis for down-regulated PPI network
| KEGG term | Count | p value |
|---|---|---|
| Chemokine signaling pathway | 13 | 4.60E−07 |
| Prion disease | 14 | 3.20E−06 |
| Thyroid hormone signaling pathway | 10 | 3.40E−06 |
| Diabetic cardiomyopathy | 12 | 5.80E−06 |
| Human immunodeficiency virus 1 infection | 12 | 8.80E−06 |
| Serotonergic synapse | 9 | 2.00E−05 |
| Carbon metabolism | 9 | 2.00E−05 |
| MAPK signaling pathway | 13 | 3.80E−05 |
| AGE-RAGE signaling pathway in diabetic complications | 8 | 6.50E−05 |
Apart from that, we have also calculated the degrees of the proteins present in up- and down-regulated PPI network with respect to HPRD database release 9. The Table 9 shows the top 20 hub proteins with their degree and regulation type. Apart from PPIs, identification of hub genes is one of the important use of the microarray datasets. The proteins with the highest degree of connectedness is referred to as the hub gene. Due to the hub genes’ significant connectivity within the disease network, they are involved in crucial biological processes and have high clinical importance. It can be noted that out of 20 hub proteins, 13 proteins are from up-regulated and 7 proteins are from down-regulated PPI network.
Table 9.
The top 20 hub proteins with their degree and regulation
| Regulation type | Protein name | Degree |
|---|---|---|
| Up | CREBBP | 200 |
| Up | CTNNB1 | 135 |
| Down | CASP3 | 132 |
| Up | YWHAB | 126 |
| Down | YWHAZ | 124 |
| Up | EWSR1 | 119 |
| Down | MAPK3 | 119 |
| Up | RELA | 115 |
| Down | LCK | 107 |
| Down | PRKCD | 104 |
| Up | ACTB | 103 |
| Up | HSP90AA1 | 92 |
| Up | YWHAQ | 79 |
| Up | STAT1 | 78 |
| Up | CDK2 | 76 |
| Up | PCNA | 76 |
| Down | BCL2 | 76 |
| Up | FN1 | 74 |
| Down | PTK2B | 71 |
| UP | XRCC6 | 70 |
Conclusion
In this paper, we have conducted an integrative analysis of large-scale microarray gene expression to generate the PPIs of differentially expressed genes. The vast majority of differentially expressed genes are, however, down-regulated. This means that rather than switching on the expression of novel genes, the main route to malignancy is to toggle genes off. In spite of that, when the PPI network is generated from these genes, it has been seen that the up-regulated proteins have more PPIs compared to the down-regulated ones. Therefore, the majority of potential key genes and tumor pathways can be generated from the up-regulated proteins as they interact more with the other human proteins in the PPI network. As the main molecular targets for drugs are proteins, these up-regulated proteins will surely help biologists to create anti-cancer drugs.
Supplementary Information
Below is the link to the electronic supplementary material.
Footnotes
Publisher's Note
Springer Nature remains neutral with regard to jurisdictional claims in published maps and institutional affiliations.
References
- 1.Liu W, Rajapakse JC. Fusing gene expressions and transitive protein-protein interactions for inference of gene regulatory networks. BMC systems biology. 2019;13(2):37. doi: 10.1186/s12918-019-0695-x. [DOI] [PMC free article] [PubMed] [Google Scholar]
- 2.Guo T, Ma H, Zhou Y. Bioinformatics analysis of microarray data to identify the candidate biomarkers of lung adenocarcinoma. PeerJ. 2019;7:e7313. doi: 10.7717/peerj.7313. [DOI] [PMC free article] [PubMed] [Google Scholar]
- 3.Tian L, Chen T, Lu J, Yan J, Zhang Y, Qin P, Ding S, Zhou Y. Integrated protein-protein interaction and weighted gene co-expression network analysis uncover three key genes in hepatoblastoma. Frontiers in cell and developmental biology. 2021;9:372. doi: 10.3389/fcell.2021.631982. [DOI] [PMC free article] [PubMed] [Google Scholar]
- 4.Yuan L, Chen L, Qian K, Qian G, Wu C-L, Wang X, Xiao Y. Co-expression network analysis identified six hub genes in association with progression and prognosis in human clear cell renal cell carcinoma (ccrcc) Genomics data. 2017;14:132–140. doi: 10.1016/j.gdata.2017.10.006. [DOI] [PMC free article] [PubMed] [Google Scholar]
- 5.Shin E, Lee K-B, Park S-Y, Kim S-H, Ryu H-S, Park Y-N, Yu E, Jang J-J. Gene expression profiling of human hepatoblastoma using archived formalin-fixed and paraffin-embedded tissues. Virchows Archiv. 2011;458(4):453–465. doi: 10.1007/s00428-011-1043-8. [DOI] [PubMed] [Google Scholar]
- 6.Robinson MD, McCarthy DJ, Smyth GK. edger: a bioconductor package for differential expression analysis of digital gene expression data. Bioinformatics. 2010;26(1):139–140. doi: 10.1093/bioinformatics/btp616. [DOI] [PMC free article] [PubMed] [Google Scholar]
- 7.Smyth GK (2005) Limma: linear models for microarray data. In: Bioinformatics and computational biology solutions using R and bioconductor. Springer, Berlin. pp 397–420
- 8.Dehan E, Ben-Dor A, Liao W, Lipson D, Frimer H, Rienstein S, Simansky D, Krupsky M, Yaron P, Friedman E, et al. Chromosomal aberrations and gene expression profiles in non-small cell lung cancer. Lung cancer. 2007;56(2):175–184. doi: 10.1016/j.lungcan.2006.12.010. [DOI] [PubMed] [Google Scholar]
- 9.Fan XM, Wong BCY, Wang WP, Zhou XM, Cho CH, Yuen ST, Lam SK. Inhibition of proteasome function induced apoptosis in gastric cancer. International journal of cancer. 2001;93(4):481–488. doi: 10.1002/ijc.1373. [DOI] [PubMed] [Google Scholar]
- 10.Otabor IA, Abdessalam SF, Erdman SH, Hammond S, Besner GE. Gastric outlet obstruction due to adenocarcinoma in a patient with Ataxia-Telangiectasia syndrome: a case report and review of the literature. World journal of surgical oncology. 2009;7(1):1–5. doi: 10.1186/1477-7819-7-29. [DOI] [PMC free article] [PubMed] [Google Scholar]
- 11.Yang HJ, Kang D, Chang Y, Ahn J, Ryu S, Cho J, Sohn CI. Diabetes mellitus is associated with an increased risk of gastric cancer: a cohort study. Gastric Cancer. 2020;23(3):382–390. doi: 10.1007/s10120-019-01033-8. [DOI] [PubMed] [Google Scholar]
Associated Data
This section collects any data citations, data availability statements, or supplementary materials included in this article.