

SUMMARY
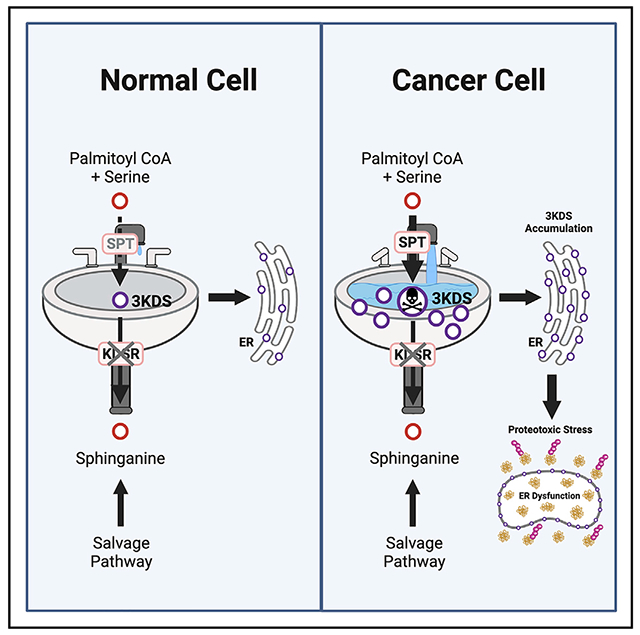
Sphingolipids play important signaling and structural roles in cells. Here, we find that during de novo sphingolipid biosynthesis, a toxic metabolite is formed with critical implications for cancer cell survival. The enzyme catalyzing the first step in this pathway, serine palmitoyltransferase complex (SPT), is upregulated in breast and other cancers. SPT is dispensable for cancer cell proliferation, as sphingolipids can be salvaged from the environment. However, SPT activity introduces a liability as its product, 3-ketodihydrosphingosine (3KDS), is toxic and requires clearance via the downstream enzyme 3-ketodihydrosphingosine reductase (KDSR). In cancer cells, but not normal cells, targeting KDSR induces toxic 3KDS accumulation leading to endoplasmic reticulum (ER) dysfunction and loss of proteostasis. Furthermore, the antitumor effect of KDSR disruption can be enhanced by increasing metabolic input (via high-fat diet) to allow greater 3KDS production. Thus, de novo sphingolipid biosynthesis entails a detoxification requirement in cancer cells that can be therapeutically exploited.
Graphical abstract
In brief
Spears et al. show that serine palmitoyltransferase, the enzyme catalyzing the first step in sphingolipid biosynthesis, is elevated in breast and other cancer types. This activity produces a toxic intermediate metabolite, 3-ketodihydrosphingosine (3KDS), that must be cleared by the enzyme 3-ketodihydrosphingosine reductase (KDSR), introducing a selective liability for cancer cells.
INTRODUCTION
Sphingolipids are a class of lipid molecules that contain a long chain “sphingoid” base backbone and undergo complex metabolism (Gault et al., 2010; Carreira et al., 2019). As bioactive lipids, they have established roles in many cellular processes, for example as signaling molecules (ceramides and sphingosine 1-phosphate) or membrane components (sphingomyelin) (Hannun and Obeid, 2008, 2018). Sphingolipids can regulate various cancer-associated processes, both pro- and anti-tumorigenic, including cell proliferation, survival, migration, and death (Ogretmen, 2018; Hannun and Obeid, 2018). Sphingolipids can be produced de novo through an endoplasmic reticulum (ER)-localized biosynthesis pathway or obtained through salvage pathways (Kitatani et al., 2008). Because of this redundancy in obtaining sphingolipids, we wondered about the importance of their de novo biosynthesis in cancer cells.
De novo sphingolipid biosynthesis is initiated by the condensation of serine and palmitoyl-coenzyme A (CoA) to produce 3-ketodihydrosphingosine (3KDS) through the serine palmitoyltransferase (SPT) enzyme complex (Hannun and Obeid, 2018). This rate-limiting enzyme complex consists of the structural subunit SPLTC1 and the catalytic subunit SPTLC2 (Li et al., 2021); a second catalytic subunit with more limited expression (SPTLC3) has been identified (Hornemann et al., 2006). 3KDS is subsequently converted to sphinganine by 3KDS reductase (KDSR), leading to the downstream production of a complex array of sphingolipids (Gault et al., 2010; Hannun and Obeid, 2018) (Figure 1A).
Figure 1. De novo sphingolipid biosynthesis is dispensable, yet the enzyme KDSR is required in a subset of cancer cells but not normal cells.
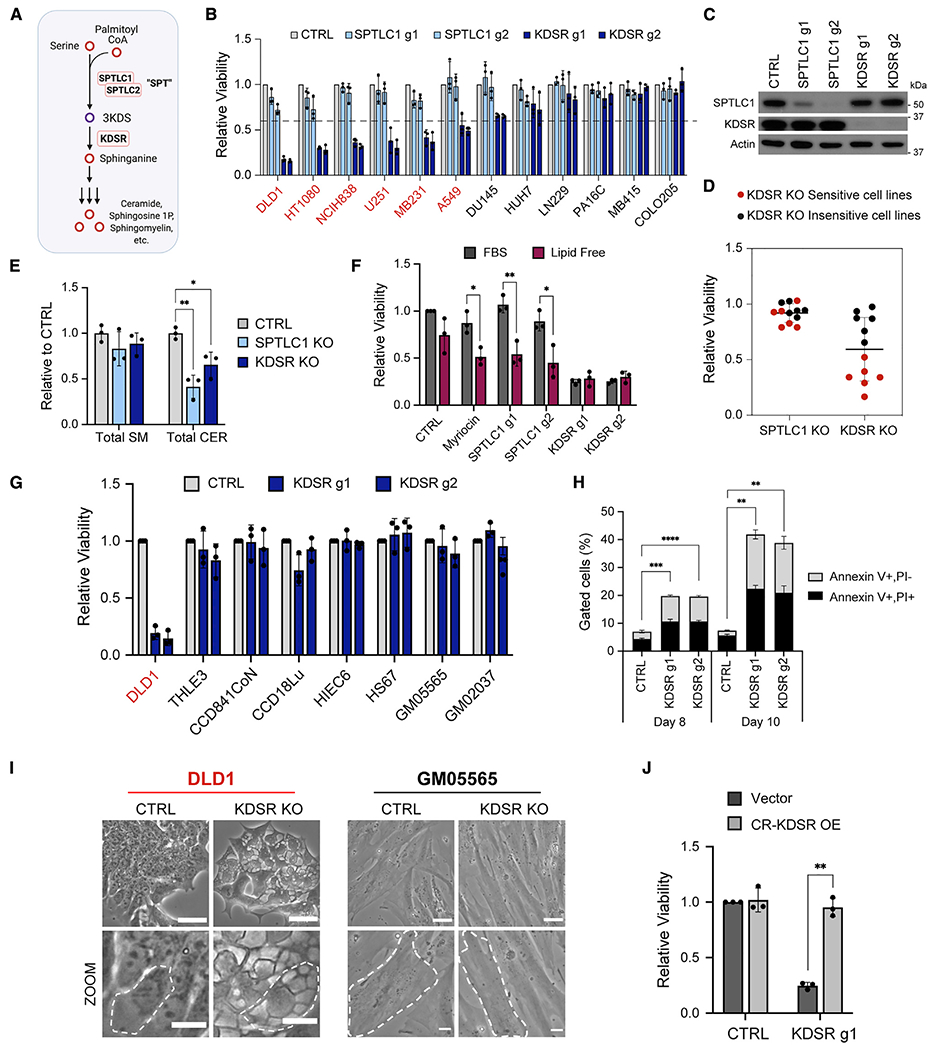
(A) The de novo sphingolipid biosynthesis pathway.
(B) Viabilities of 12 cancer cell lines of various tissue origins following CRISPR-Cas9-mediated gene KO of SPTLC1 (light blue) or KDSR (dark blue) with 2 guide RNAs (g1 and g2) relative to a non-targeting control guide (CTRL; light gray, =1.0) at 12 days after lentiviral transduction. Cell lines that are sensitive to KDSR disruption are labeled in red, with greater than 40% loss of viability (indicated by dotted line).
(C) Western blot of SPTLC1 and KDSR protein in CTRL, SPTLC1 KO, and KDSR KO DLD1 cells at 9 days after lentiviral transduction.
(D) Dot plot summarizing the viabilities of 12 cancer cell lines (depicted in B) following SPTLC1 or KDSR KO (average of effects of the 2 guides), relative to CTRL (=1.0). Each dot represents one cell line and is depicted as KDSR KO sensitive (greater than 40% loss of viability, red) or insensitive (less than 40% loss of viability, black).
(E) Total sphingomyelin (SM) and ceramide (CER) levels in SPTLC1 KO and KDSR KO DLD1 cells relative to CTRL (=1.0) at 8 days after lentiviral transduction.
(F) Viability of DLD1 cells subjected to 15 μM myriocin, CTRL, SPTLC1, or KDSR KO grown in media with 10% FBS or 10% charcoal stripped (lipid-free) serum. Values are relative to the viability of CTRL cells grown in 10% FBS (=1.0).
(G) Viabilities of 7 non-cancer (primary and immortalized normal) cell lines following KDSR KO relative to CTRL at 12 days after lentiviral transduction. Sensitive cancer line DLD1 is shown as a positive control.
(H) Percentages of Annexin V+/PI− (light gray) and Annexin V+/PI+ (black) DLD1 cells subjected to CTRL or KDSR KO at days 8 and 10 after lentiviral transduction. Gating strategy/flow data are shown in Figures S2D and S2E.
(I) Light microscope images of DLD1 cancer cells and GM05565 non-transformed skin fibroblast cells with CTRL or KDSR KO, displaying the morphology of the cells at 2 magnifications. In the zoomed images (bottom row), a single cell is outlined in white for each condition. Top row scale bar: 40 μm, bottom row scale bar: 15 μm.
(J) Viability of DLD1 cells overexpressing empty pLV vector or g1-resistant KDSR subjected to CTRL gRNA or KDSR g1 gene KO. Viabilities are shown relative to CTRL cells expressing empty vector (=1.0).
For (B), (E)–(H), and (J), n = 3 biological replicates. Data are shown as mean + SD. p values were calculated using two-tailed Student’s t test (*p < 0.05, **p < 0.01, ***p < 0.001, ****p < 0.0001).
RESULTS
To determine whether de novo sphingolipid biosynthesis is required in cancer cells, we examined the effect of CRISPR-Cas9-mediated disruption of the genes encoding the first two enzymes in the pathway, SPT and KDSR, in 12 cancer cell lines of varying origin. Disruption of the required SPT subunit SPTLC1 did not strongly affect the viability of any of the lines, relative to a non-targeting control guide (CTRL) (Figures 1B, 1C, and S1A). In contrast, disruption of KDSR impaired the viability of many of the lines (Figures 1B, 1C, and S1B). We designated lines with greater than 40% reduction in viability upon knockout (KO) as “sensitive” and those with less than 40% reduction as “insensitive” (Figure 1D).
As SPTLC1 and KDSR are both sequential, irreplaceable enzymes in de novo sphingolipid biosynthesis, it was surprising that disruption of KDSR, but not SPTLC1, impacted cancer cell viability (Figure 1D). We considered the possibility that cancer cells may not require SPT because they can salvage sphingolipids from their environment. We measured various species of ceramides and sphingomyelins, major downstream products of sphingolipid biosynthesis, in cells with SPTLC1 or KDSR KO. In the colorectal cancer cell line DLD1, which is highly sensitive to KDSR KO, the level of total sphingomyelins did not significantly decrease following either SPTLC1 or KDSR KO (Figures 1E and S2A; Table S1). Total ceramide levels decreased somewhat under both KO conditions but decreased to a greater extent under the non-toxic SPTLC1 KO, suggesting that this decrease is not detrimental to the cells (Figures 1E and S2B; Table S1). However, when we replaced fetal bovine serum in the media with lipid-free serum, which precludes salvage of extracellular sphingolipids, SPTLC1 disruption or pharmacological inhibition of SPT with myriocin (Miyake et al., 1995) became detrimental (Figure 1F). Furthermore, adding the downstream product sphinganine did not significantly protect KDSR KO cells (Figure S2C). These findings indicate that cancer cells normally do not require de novo sphingolipid biosynthesis through SPT/KDSR because they can salvage sphingolipids from the extracellular environment. Importantly, this also suggested that the toxic effect of KDSR disruption is not due to reduced sphingolipid biosynthesis.
Intriguingly, we knocked out KDSR in a panel of seven non-cancer (primary or immortalized) cell lines of varying tissue origin and found that normal cells did not suffer from toxic effects, despite efficient KO across the population (Figures 1G and S1C). Our focus thus turned to understanding why KDSR is essential to some cancer cells. In contrast to the normal cells, loss of KDSR had distinct and severe effects on a subset of cancer cell lines, including an aberrant morphology followed by apoptotic cell death (Figures 1H, 1I, S2D, and S2E). KDSR disruption induced the formation of irregular, distended subcellular structures visible by light microscope in the sensitive lines but not in the insensitive cancer lines and normal lines (Figures 1I and S1D). Overexpression of KDSR with CRISPR-resistant silent mutations fully rescued against both the toxicity and aberrant morphology caused by KDSR KO, validating that these effects were on target (Figures 1J and S1E–S1G).
We hypothesized that KDSR may be required specifically in cancer cells not for its product but for removal of its substrate, 3KDS. Indeed, disruption of KDSR (but not SPTLC1) caused a 200-fold accumulation of 3KDS (Figures 2A and 2F). Exogenous treatment with 3KDS resulted in time- and dose-dependent toxicity, suggesting that 3KDS itself has toxic properties (Figures 2B, S3A, and S3B). These findings suggested that 3KDS is a toxic intermediate that requires clearance by KDSR.
Figure 2. KDSR is required expressly to detoxify the 3KDS that is generated by SPT.
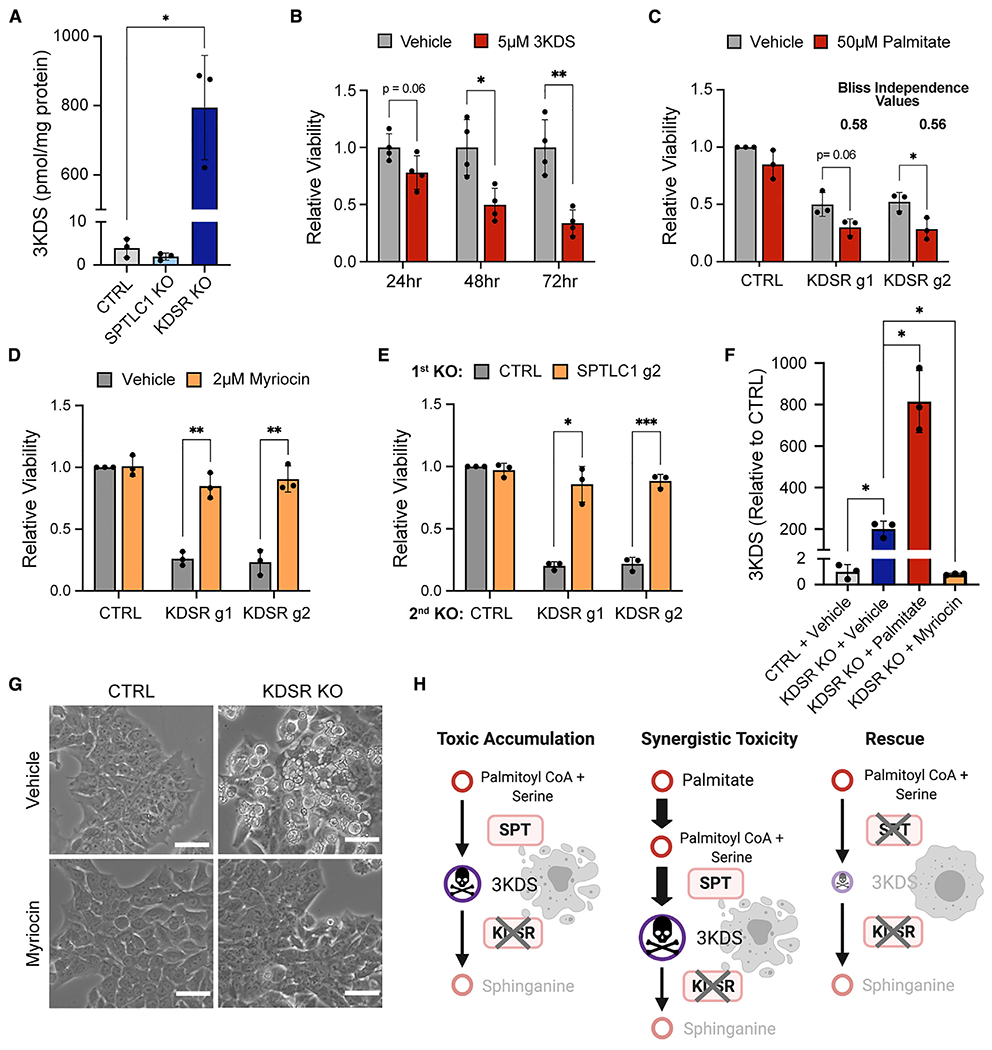
(A) LC-MS quantification of 3KDS in DLD1 cells subjected to CTRL, SPTLC1 KO, or KDSR KO at 8 days after lentiviral transduction.
(B) Viability of DLD1 cells treated with 5 μM 3KDS for 24, 48, and 72 h relative to vehicle treatment (=1.0).
(C) Viability of CTRL, KDSR g1, and KDSR g2 KO DLD1 cells treated with EtOH vehicle (gray) or 50 μM palmitate (red) for 48 h. Viabilities are relative to CTRL DLD1 cells treated with EtOH vehicle (=1.0). See STAR Methods for calculation of Bliss independence synergy values.
(D) Viability of DLD1 cells subjected to CTRL, KDSR g1 or g2 KO treated with DMSO vehicle (gray), or 2 μM myriocin (orange) for 72 h. Viabilities are relative to CTRL DLD1 cells treated with DMSO vehicle (=1.0).
(E) Viability of DLD1 cells subjected to sequential gene KO with gRNA against CTRL or SPTLC1 g2 (first KO), followed by KO with gRNA against CTRL, KDSR g1, or g2 (second KO). Viabilities are relative to cells with CTRL KO followed by CTRL KO (=1.0) at 10 days after lentiviral transduction for the second gene KO.
(F) Relative 3KDS levels in DLD1 CTRL cells treated with vehicle (gray), KDSR KO cells treated with vehicle (dark blue), KDSR KO cells treated with 50 μM Palmitate (red), and KDSR KO cells treated with 15 μM myriocin (orange) for 48 h. The values for CTRL- and KDSR KO vehicle-treated conditions are the same as those used in (A) but here are shown relative to CTRL vehicle (=1.0) to display additional changes induced by palmitate and myriocin treatment.
(G) Light microscope images of DLD1 CTRL and KDSR KO cells treated with DMSO vehicle or 15 μM myriocin for 48 h. Scale bar: 50 μm.
(H) Proposed toxicity models for KDSR KO, including synergy of palmitate treatment representing data in (C), and rescue effect of disruption of 3KDS production through SPT inhibition, representing data in (D) and (E).
For (B), n = 4 biological replicates, and for (A) and (C)–(F), n = 3 biological replicates. Data are shown as mean + SD. p values were calculated using two-tailed Student’s t test (*p < 0.05, **p < 0.01, ***p < 0.001).
The toxic 3KDS accumulation model implies that the effects of KDSR disruption could be enhanced by increasing the production of 3KDS (Figure 2H). Indeed, treatment of cancer cells with palmitate, a precursor for the SPT substrate palmitoyl-CoA (Merrill et al., 1988; Louie et al., 2013), synergized with the toxicity of KDSR KO and induced even greater accumulation of 3KDS than KDSR KO alone (Figures 2C, 2F, and S3C). We next tested the toxic accumulation model with the opposite approach, by precluding 3KDS accumulation in KDSR KO cells. Both KO and inhibition of SPT prevented the toxicity of KDSR disruption in cancer cells (Figures 2D, 2E, and S3D–S3F). Furthermore, SPT inhibition prevented 3KDS accumulation (Figure 2F) and the aberrant morphological phenotype in KDSR KO cells (Figures 2G and S3G). Collectively, these data confirm a toxic gain-of-function mechanism where SPT activity creates a demand for 3KDS detoxification via KDSR (Figure 2H).
To gain insight into the mechanism of toxicity for 3KDS, we performed next-generation sequencing of mRNA and unsupervised hierarchical clustering from two sensitive (DLD1, NCIH838) and one insensitive (HUH7) cancer lines with or without KDSR KO. The KDSR KO expression profiles of the two sensitive lines showed broad overlaps in over- and under-expressed genes and clustered with each other but not with the insensitive line (Figure 3A). The gene clusters that were over-expressed in both DLD1 and NCIH838 cells following KDSR KO were highly enriched for ER stress response, unfolded protein response, and ubiquitin-dependent protein degradation (Figure 3B; Table S2). For example, genes such as the hallmark ER stress chaperone HSPA5 (Hetz, 2012; Chen and Cubillos-Ruiz, 2021) and the stress-regulated polyubiquitin gene UBC (Ryu et al., 2007; Bianchi et al., 2018) were upregulated in response to KDSR KO specifically in the sensitive lines (Figure S4A). We confirmed the induction of various ER stress markers (Hetz, 2012) at the protein level (Figure 3D). The downregulated gene clusters were enriched for metabolic processes and lipid biosynthesis functions that are dependent on ER (Schwarz and Blower, 2016) and genes involved in the cell cycle, which can be arrested by ER stress (Bourougaa et al., 2010) (Figures 3C and S4B; Table S3). These findings suggested that ER function and proteostasis are being negatively impacted in KDSR KO cells, leading to secondary effects such as loss of lipid biosynthesis and cell-cycle progression.
Figure 3. Loss of KDSR disrupts ER structure and function, resulting in misfolded protein overload and loss of proteostasis.
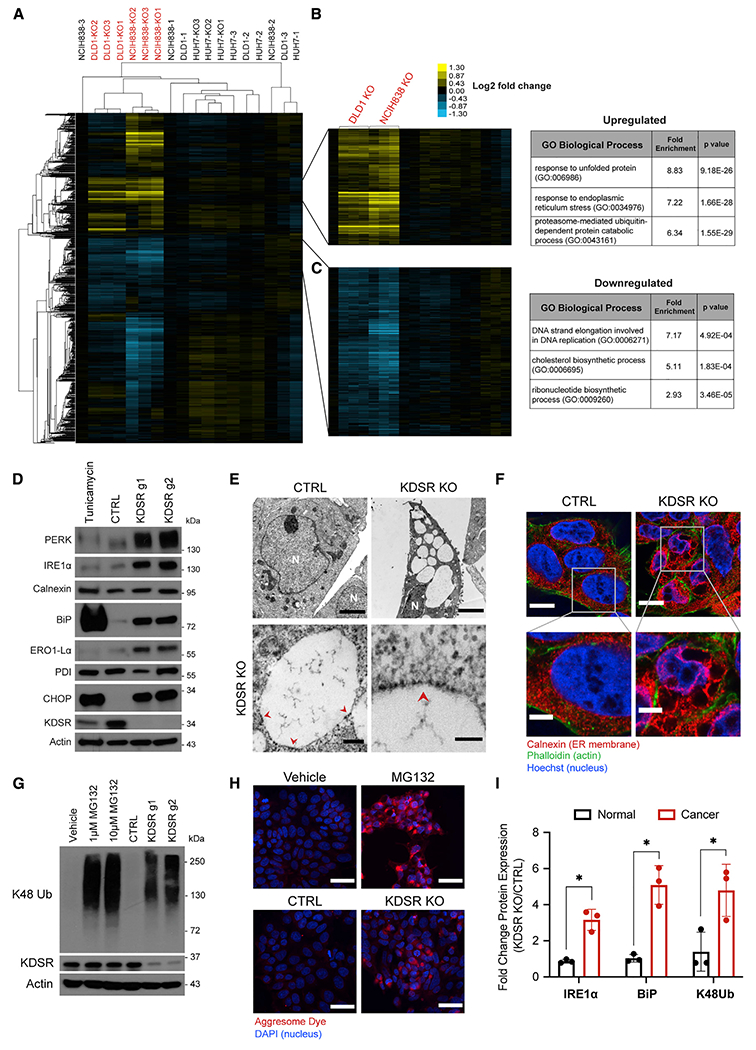
(A) Heatmap of unsupervised hierarchical clustering analysis of the mRNA expression patterns of 2 KDSR KO-sensitive (DLD1 and NCIH838) and 1 -insensitive (HUH7) cancer cell line following CTRL or KDSR KO. Numbers at the end of each label are biological repeat identifier. Sensitive lines with KDSR KO are labeled in red.
(B and C) Gene clusters that are upregulated (B, yellow) or downregulated (C, blue) specifically in DLD1 and NCIH838 KDSR KO (sensitive) cells. Tables list examples of Gene Ontology (GO) biological processes that are significantly enriched in each gene cluster.
(D) Western blot showing protein levels of characteristic markers of ER stress in DLD1 cells subjected to CTRL or KDSR g1- or g2-mediated KO at 9 days after lentiviral transduction. DLD1 cells treated with 2 μM tunicamycin for 24 h were used as a positive control for ER stress induction.
(E) Top row, representative electron microscope images of DLD1 CTRL and KDSR KO cells, depicting an overview of the aberrant morphology observed in KDSR KO cells. N indicates nucleus; scale bar: 3 μm. Bottom row, higher magnification images displaying specific features of the subcellular structures in KDSR KO cells. Red arrows point to areas where ribosomes line the edges of the structures. Left image scale bar: 0.2 μm, right image scale bar: 0.1 μm.
(F) Immunofluorescent images of CTRL and KDSR KO cells stained for calnexin (ER membrane, red), phalloidin (actin, green), and Hoechst 33342 (nucleus, blue). Bottom rows show zoomed-in view of ER structures. Top row scale bar: 10 μm, bottom row scale bar: 4 μm.
(G) Western blot of K48 ubiquitinated proteins in DLD1 cells treated with 1 or 10 μM of the proteasome inhibitor MG132 (18 h) or with KDSR KO with g1 or g2 (10 days) compared with vehicle and CTRL conditions, respectively.
(H) Representative immunofluorescent images of DLD1 cells subjected to CTRL or KDSR KO or treated with vehicle or 3 μM MG132 and stained with aggresome dye (red), which binds beta-sheet structures found in protein aggregates. Nuclei were stained with DAPI (blue). Scale bar: 40 μm.
(I) Fold change in protein levels of ER stress markers (IRE1a and BiP) and K48 ubiquitinated proteins in KDSR KO cells (average of g1 and g2) relative to CTRL cells in 3 non-cancer (GM05565, THLE3, CCD841CoN) and 3 sensitive cancer (DLD1, NCIH838, U251) cell lines. Each point represents an independent cell line as n = 3 replicates. Band intensities were quantified from westerns that are shown in (D) and (G) and Figures S4F and S4G and were normalized to actin band intensity. For RNA sequencing, RNA was extracted from n = 3 biological replicates for each condition. GO enrichment analysis was performed using the PANTHER overrepresentation test.
Data are shown as mean + SD. p values were calculated using two-tailed Student’s t test (*p < 0.05, **p < 0.01, ns = not significant).
Providing morphological evidence of ER pathology, electron microscopy of KDSR KO cancer cells revealed that the large, dilated structures that we initially observed by light microscope were disrupted remnants of the ER, identified by the ribosomes studding the membrane edges (Figure 3E). The ER membrane protein calnexin outlined these aberrant structures in KDSR KO cells, further indicating that 3KDS accumulation disrupts ER structure (Figure 3F).
SPTLC1 and KDSR are both ER membrane proteins (Mandon et al., 1992; Li et al., 2021), which logically supports this organelle being the site of KDSR KO pathology. Previous studies have shown that similar sphingoid bases such as sphinganine and sphingosine are important components of organellar membranes and can affect membrane structure and permeability (Contreras et al., 2006; Hwang et al., 2019; Jiménez-Rojo et al., 2014). We conducted subcellular fractionation (Figure S4C), which revealed that upon KDSR KO, 3KDS accumulation occurs in the (ER membrane enriched) microsomal fractions relative to whole cells (Figure S4D). 3KDS enrichment was also seen in the mitochondrial and nuclear fractions. This may be due to the normal association of ER with mitochondria and nucleus (Phillips and Voeltz, 2016), and indeed we observe ER marker in these fractions. Overall, these results support the notion that 3KDS accumulates in the ER, although accumulation in other organelles cannot be ruled out.
The RNA sequencing analyses also indicated that KDSR KO induces unfolded protein response and proteasomal protein degradation signatures. These responses are consistent with compromised ER function, as the ER is critical for protein folding and processing (Wang and Kaufman, 2016), and the ubiquitin proteasome system (UPS) plays a key role in protein turnover and clearance of misfolded proteins (Pohl and Dikic, 2019). Cancer cells have increased dependency on the UPS, and proteasome inhibitors such as MG132 and bortezomib are being explored as cancer therapeutics (Manasanch and Orlowski, 2017; Almond and Cohen, 2002). KDSR KO resulted in a striking accumulation of K48 ubiquitinated proteins (Chau et al., 1989), proteins targeted for proteasomal degradation, indicating a loss of proteostasis similar to that seen by treatment with MG132 (Figure 3G). This suggested that KDSR KO overwhelms the UPS. KDSR KO also induced intracellular aggregation of misfolded proteins in a similar manner to MG132 (Figure 3H), providing further evidence of loss of proteostasis. Interestingly, exogenous 3KDS treatment did not induce ER stress and accumulation of ubiquitinated proteins as seen with KDSR KO, which may suggest that endogenous 3KDS accumulation in the ER (rather than exogenous route of accumulation) is important to trigger ER dysfunction and loss of proteostasis (Figure S4E). On the other hand, compared with KDSR-sensitive cancer cells, KDSR loss in non-cancer cells induced neither ER stress nor accumulation of ubiquitinated proteins (Figures 3I, S4F, and S4G). Collectively, these data support a model for KDSR KO toxicity in which 3KDS accumulation in the ER leads to its disruption, resulting in misfolded protein overload and proteotoxic stress in cancer cells.
The effect of palmitate input on enhancing the toxicity of KDSR KO and the effect of serum sphingolipids on preventing SPTLC1 KO toxicity highlight the critical influence of the metabolic environment on the essentiality of metabolic enzymes (Figures 1F and 2C). Therefore, it was imperative to examine the essentiality of KDSR and SPTLC1 in the metabolic environment of a tumor in vivo. Supporting our earlier results, in a subcutaneous xenograft mouse model of colorectal cancer (DLD1), KO of KDSR, but not SPTLC1, significantly impaired tumor growth (Figures 4A–4C). Interestingly, feeding a high-fat diet (HFD) to provide additional palmitate input for 3KDS production significantly enhanced the inhibitory effect of KDSR KO on tumor growth compared with the control diet (CD), validating our model in an in vivo context (Figures 4B, 4C, and 4E) and suggesting a means for increasing therapeutic efficacy. Although tumors in the CTRL HFD group trended toward a larger average tumor volume then those in the CTRL CD group, the KDSR KO tumors under HFD grew to half the volume of those under CD (Figure 4E). Additionally, the levels of 3KDS measured in tumors collected at the endpoint of the experiment were significantly increased in KDSR KO tumors compared with CTRL in both the CD and HFD groups (Figure 4D). These results validate the toxic accumulation model and demonstrate the therapeutic potential for targeting KDSR in vivo.
Figure 4. SPT upregulation and high fat-driven 3KDS production in tumors suggest a therapeutic window for targeting KDSR.
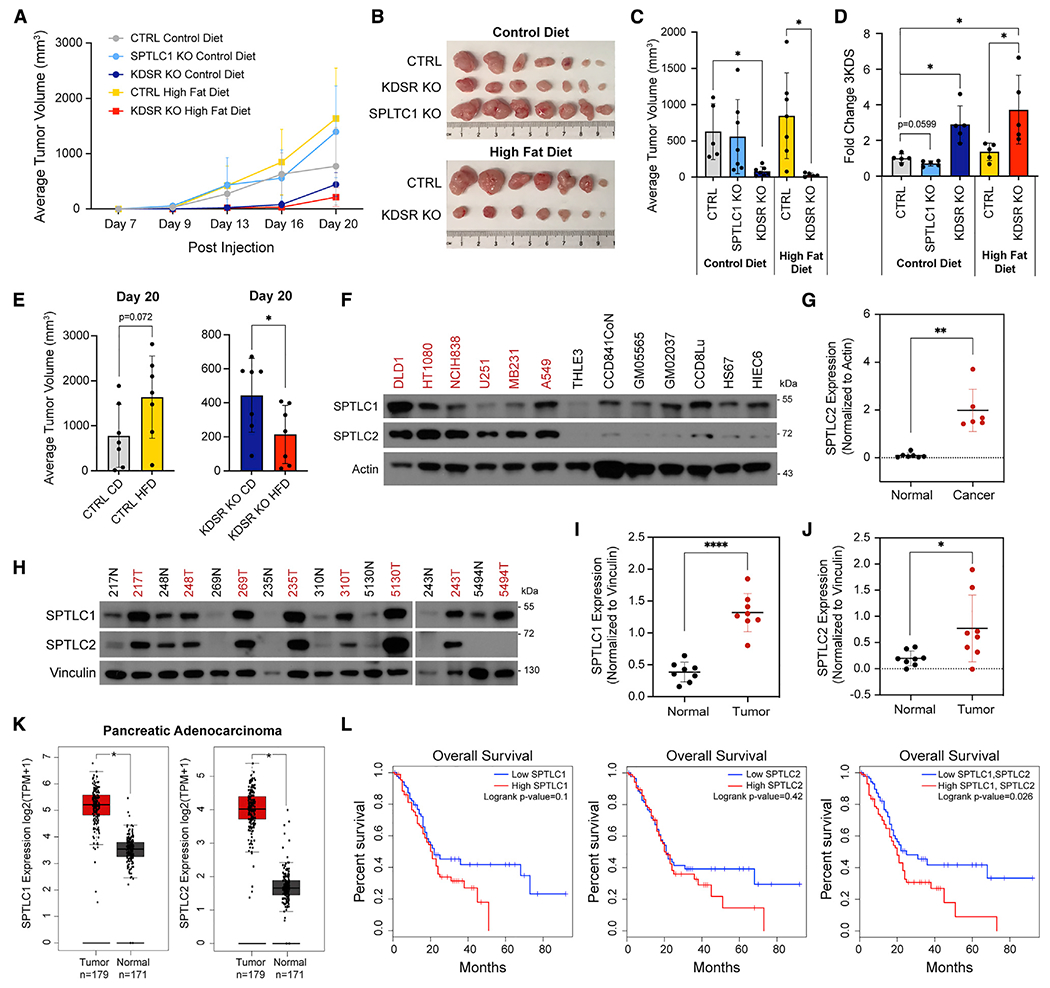
(A) Growth curve of DLD1 xenograft tumors. Average volume of tumors formed over the course of 20 days after subcutaneous injection of CTRL (gray), SPTLC1 KO (light blue), and KDSR KO (dark blue) DLD1 cells into mice fed a control diet and CTRL (yellow) and KDSR KO (red) DLD1 cells into mice fed a high-fat diet, n = 7 mice per group.
(B) Ex vivo images of n = 7 tumors in each group at the endpoint (20 days).
(C) Average tumor volume from mice in each of the 5 groups at day 16 post subcutaneous injection.
(D) LC/MS quantification of relative 3KDS levels in tumors collected at the experiment endpoint from mice in each of the 5 groups. 3KDS levels are shown relative to CTRL control diet tumors (=1.0). Quantification of 3KDS was normalized to the weight of each tumor; n = 5 tumors in each group.
(E) Average tumor volume of CTRL tumors (left) and KDSR KO tumors (right) in mice fed control diet versus those fed high-fat diet at 20 days post injection, n = 7 mice per group.
(F) Western blot of SPTLC1 and SPTLC2 protein levels in 6 KDSR KO-sensitive cancer cell lines (red) and 7 -insensitive non-cancer (normal) cell lines (black) with actin as the loading control. We noted that despite careful total protein normalization, actin levels are higher in some of the normal cell lines. While we normalize SPTLC2 to actin for quantification purposes, even without actin normalization, the expression levels of SPTLC2 are dramatically lower in the normal cells.
(G) Quantification of SPTLC2 band intensities in normal and cancer cell lines from (F) normalized to actin.
(H) Western blot of SPTLC1 and SPTLC2 protein levels in 8 pairs of matched normal breast tissue (black) and breast tumor tissue (red) from patients with breast cancer. Vinculin was used as a loading control.
(I and J) Quantification of SPTLC1 and SPTLC2 band intensities from (H) normalized to vinculin.
(K) Boxplots of SPTLC1 and SPTLC2 mRNA expression profiles in pancreatic adenocarcinoma tissue and normal pancreas tissue from TCGA and GTEx data.
(L) Overall survival estimates for patients with pancreatic adenocarcinoma based on expression of SPTLC1 alone, SPTLC2 alone, or a signature of SPTLC1 and SPTLC2 (median cutoff, high n = 89, low n = 89).
Boxplots in (K) and survival plots in (L) were created using GEPIA2. For (A), (C)–(E), (G), (I), and (J), data are shown as mean + SD, and p values were calculated using two-tailed Student’s t test (*p < 0.05, **p < 0.01, ****p < 0.0001).
To further examine the therapeutic implications of KDSR as a cancer-specific detoxifier, we wondered whether expression of the 3KDS-producing SPT complex may explain the differential requirements of KDSR between cancer and normal cells (Figure 1G). Importantly, protein expression of the subunit SPTLC2 was significantly lower in non-cancer lines than in KDSR KO-sensitive cancer lines, explaining why non-cancer cells can tolerate loss of KDSR while these cancer cells cannot (Figures 4F and 4G). At the patient level, analyses of mRNA sequencing data from The Cancer Genome Atlas and GTEX, using the Gene Expression Profiling Interactive Analysis program (GEPIA2) (Tang et al., 2019), indicate that the mRNA expression of both SPTLC1/2 are increased in multiple tumor types compared with normal tissue (Figures S5A and S5B). We further examined a panel of tumor tissues from patients with breast cancer and validated that both SPTLC1 and SPTLC2 protein levels are significantly increased compared with adjacent normal breast tissues (Figures 4H–4J and S5C–S5F). Together, our results indicate that multiple types of cancer, due to increased expression of SPT, may be selectively dependent on KDSR for 3KDS detoxification. Intriguingly, in pancreatic cancers, which have elevated expression of SPTLC1/2 (Figure 4K), high expression of both SPTLC1 and SPTLC2 predicts poor overall survival (Figure 4L), suggesting that these cases may benefit from KDSR targeting. Collectively, our data suggest a future therapeutic approach in which the elevated expression of SPTLC1/2 could be utilized as a biomarker to indicate tumors that would respond to KDSR inhibition.
DISCUSSION
Sphingolipids such as ceramides and sphingomyelin can be obtained via salvage, which leaves uncertain the importance of the de novo biosynthesis pathway in cancer cells. In particular, little is known about the sphingolipid precursor 3KDS and its processing enzyme KDSR in any biological context, let alone in cancer. KDSR has recently been reported as a cancer target in leukemia (Liu et al., 2022). Here, we find that the SPT complex, which produces 3KDS, is overexpressed in some cancers and that it is surprisingly expendable due to salvage. However, SPT activity is not without consequence—it creates a liability, a requirement to eliminate the toxic 3KDS that it produces via KDSR. We show that this can be exploited to selectively poison cancer cells and even enhance the effect through dietary modulation of upstream input (palmitate).
Our observations of a toxic accumulation mechanism indicate that the enzyme KDSR is a de facto detoxifier, with implications beyond cancer. Loss-of-function mutations in KDSR cause keratinization disorders and thrombocytopenia in patients; however, the mechanisms for this are unclear (Boyden et al., 2017; Liu et al., 2020; Takeichi et al., 2017; Bariana et al., 2019). Our gain-of-function model for KDSR warrants further investigation in the context of KDSR disorders, such as examination of fibroblasts from patients for ER and UPS defects, as well as myriocin and prevention of 3KDS accumulation as a potential therapeutic option in this context.
Our findings also demonstrate crosstalk between 3KDS production and ER structure/function that may have biological implications in cancer cells and beyond. Maintaining correct levels of long chain bases such as sphinganine is critical for maintaining normal nuclear morphology, and deregulation may be a factor in trisomies such as Down syndrome (Hwang et al., 2019). We envision a similar scenario in which maintenance of correct 3KDS levels regulates ER morphology either via direct biomechanical or yet to be characterized signaling mechanisms and that KDSR disruption is a manifestation of the deregulation of this process.
Finally, our findings show KDSR to be an attractive target for cancer therapy whose loss kills cancer cells via toxic 3KDS accumulation. SPTLC1/2, which imposes a requirement for 3KDS detoxification via KDSR, is upregulated in or associated with poor prognosis in subsets of cancer cells. While it is unclear at this point why SPTLC1/2 are upregulated in cancer cells, these findings raise the possibility that certain subtypes of tumors, or even tumors examined on an individual basis for SPTLC1/2 expression, may be treatable by KDSR inhibition. The KDSR disruption-induced impairment of ER/proteostasis also provides scenarios for targeting cancers based on their known dependence on these processes (Chen and Cubillos-Ruiz, 2021; Manasanch and Orlowski, 2017; Almond and Cohen, 2002). Additionally, the HFD enhancement of KDSR KO toxicity shows how a metabolic target therapy approach can be modulated with diet. This suggests that KDSR treatment strength can be dosed via the composition of the diet. This is of additional potential importance, as fatty acid (palmitate) uptake is correlated with metastatic and/or refractory cancer subtypes (Pascual et al., 2017; Nath et al., 2015; Koundouros and Poulogiannis, 2020), with our data suggesting that these may be particularly vulnerable to KDSR targeting.
In conclusion, our work reveals KDSR as a cancer target in the de novo sphingolipid biosynthesis pathway whose critical function in cancer cells lies in 3KDS detoxification rather than in producing sphingolipids. The cancer-selective requirement of KDSR lies in the increased expression of the 3KDS producing enzyme SPT in multiple cancer types. These cells depend on KDSR to maintain 3KDS homeostasis, which in turn is required for ER function and proteostasis. Our findings shed light on the interplay between the sphingolipid biosynthesis pathway and ER biology/proteostasis and how deregulation of this process can be used for therapeutic means in cancer.
Limitations of the study
Our fractionation protocol produces microsomal fractions that are enriched for ER membranes but cannot be considered a highly purified ER fraction. Higher purity methods involve detergents, which are likely to interfere with liquid chromatography/mass spectrometry (LC/MS) analyses. We observe significant 3KDS accumulation in the mitochondrial and nuclear fractions, which may either be due to their known association with ER (Phillips and Voeltz, 2016) or accumulation in these organelles themselves.
While we provide evidence for a cancer-selective requirement for KDSR that is explained by the increased expression of SPT in various cancers relative to normal tissues or cells, the true validation of the therapeutic potential for KDSR depends on the future development of specific KDSR inhibitors. Additionally, while we observe increased expression of SPT in multiple cancers including breast cancer, the reason for this—i.e., whether increased SPT provides a selective advantage to cancer cells under certain conditions—is unclear and a future direction to pursue.
STAR★METHODS
RESOURCE AVAILABILITY
Lead contact
All requests for further information, reagents, and resources should be directed to and will be fulfilled by the lead contact, Dohoon Kim (dohoon.kim@umassmed.edu).
Materials availability
Materials used in this study are available publicly or will be made available upon reasonable request to the lead contact.
Data and code availability
RNA sequencing data have been deposited to the Gene Expression Omnibus database and are publicly available upon the date of publication. The GEO accession number is listed in the key resources table. Lipidomics data for all sphingomyelin and ceramide species measured by LC-MS are provided in Table S1.
This paper does not report original code.
Any additional information required to reanalyze the data reported in this paper is available from the lead contact upon request.
KEY RESOURCES TABLE
| REAGENT or RESOURCE | SOURCE | IDENTIFIER |
|---|---|---|
| Antibodies | ||
| Rabbit polyclonal Anti-SPTLC1 | Abcam | Cat#ab176706 |
| Rabbit polyclonal Anti-SPTLC2 | Abcam | Cat#ab23696; RRID:AB_447617 |
| Rabbit polyclonal Anti-KDSR | Sigma-Aldrich | Cat#HPA044884; RRID:AB_2679131 |
| Mouse Monoclonal Anti-β-actin | Sigma-Aldrich | Cat#A5541 |
| Rabbit monoclonal Anti-Vinculin | Abcam | Cat#ab129002; RRID:AB_11144129 |
| Rabbit monoclonal Anti-PERK, Clone D11A8 | Cell Signaling Technology | Cat#5683; RRID:AB_10841299 |
| Rabbit monoclonal Anti-IRE1α, Clone 14C10 | Cell Signaling Technology | Cat#3294 RRID:AB_823545 |
| Rabbit monoclonal Anti-Calnexin, Clone C5C9 | Cell Signaling Technology | Cat#2679; RRID:AB_2228381 |
| Rabbit monoclonal Anti-BiP, Clone C50B12 | Cell Signaling Technology | Cat#3177; RRID:AB_2119845 |
| Rabbit polyclonal Anti-Ero1-Lα | Cell Signaling Technology | Cat#3264; RRID:AB_823684 |
| Rabbit monoclonal Anti-PDI, Clone C81H6 | Cell Signaling Technology | Cat#3501; RRID:AB_2156433 |
| Mouse monoclonal Anti-CHOP, Clone L63F7 | Cell Signaling Technology | Cat#2895; RRID:AB_2089254 |
| Rabbit monoclonal Anti-Ubiquitin, Lys48-Specific, Clone Apu2 | EMD Millipore | Cat#05-1307; RRID:AB_11213655 |
| Mouse monoclonal Anti-NDUFS3, Clone 3F9DD2 | Abcam | Cat#ab110246; RRID:AB_10861972 |
| Rabbit polyclonal Anti-Lamin B1 | Abcam | Cat#ab16048; RRID:AB_443298 |
| Anti-mouse IgG, HRP-linked | Cell Signaling Technology | Cat#7076; RRID:AB_330924 |
| Mouse Anti-rabbit IgG-HRP | Santa Cruz Biotechnology | Cat#sc-2357; RRID:AB_628497 |
| For ICC: Rabbit polyclonal Anti-Calnexin | Proteintech | Cat#10427-2-AP; RRID:AB_2069033 |
| For ICC: Goat Anti-Rabbit IgG H&L AlexaFluor555 | Abcam | Cat#ab150078; RRID:AB_2722519 |
| Bacterial and virus strains | ||
| XL10-Gold Ultracompetent Cells | Agilent | Cat#200315 |
| Biological samples | ||
| Patient matched normal and tumor breast tissues | UMCCTS Biospecimen, Tissue and Tumor Bank (Biorepository) | https://www.umassmed.edu/tissue-and-tumor-bank/ |
| Chemicals, peptides, and recombinant proteins | ||
| 3-keto-Dihydrosphingosine HCl | Matreya | Cat#1876 |
| Myriocin (ISP-1) | Santa Cruz Biotechnology | Cat#sc-201397 |
| Palmitic Acid | Millipore Sigma | Cat#P0500 |
| MG-132 | Millipore Sigma | Cat#474790 |
| Sphinganine (d18:0) | Cayman Chemical | Cat#10007945 |
| Tunicamycin | Cayman Chemical | Cat#11445 |
| Fetal Bovine Serum | Millipore Sigma | Cat#F2442 |
| Fetal Bovine Serum, charcoal stripped | Thermo Fisher Scientific | Cat#A3382101 |
| DMEM, high glucose, pyruvate | Gibco | Cat#11995073 |
| Eagles Minimum essential media | ATCC | Cat#30-2003 |
| Opti-MEM™ I Reduced Serum Medium | Gibco | Cat#31985070 |
| BEGM Bronchial Epithelial Cell Growth Medium BulletKit | Lonza | Cat#CC-3170 |
| X-tremeGene 9 DNA Transfection Reagent | Millipore Sigma | Cat#6365779001 |
| Polybrene | Millipore Sigma | Cat#TR-1003-G |
| BsmBI Restriction Enzyme | New England Biolabs | Cat#R0739 |
| Phalloidin-iFluor 488 | Abcam | Cat#ab176753 |
| Hoechst 33342 Nucleic acid stain | Invitrogen | Cat#H3570 |
| ProLong Gold Antifade Mountant with DAPI | Thermo Fisher Scientific | Cat#P36941 |
| Critical commercial assays | ||
| CellTiter-Glo 2.0 Cell Viability Assay | Promega | Cat#G9242 |
| PROTEOSTAT Aggresome Detection Kit | Enzo Life Sciences | Cat#ENZ-51035 |
| BD Annexin V: FITC Apoptosis Detection Kit I | Thermo Fisher Scientific | Cat#BDB556547 |
| PureYield Plasmid Miniprep System | Promega | Cat#A1222 |
| Rneasy Mini Kit | Qiagen | Cat#74104 |
| e-Myco plus Mycoplasma PCR Detection Kit | LiliF Diagnostics | Cat#25237 |
| Deposited data | ||
| RNA-Sequencing analysis of control and KDSR KO cancer cell lines | This paper | GEO: GSE182179 |
| Experimental models: Cell lines | ||
| DLD-1, Human Colorectal adenocarcinoma | Laboratory of David Sabatini (MIT, USA) | ATCC Cat#CCL-221; RRID:CVCL_0248 |
| HT-1080, Human Fibrosarcoma | Laboratory of David Sabatini (MIT, USA) | ATCC Cat#CCL-121; RRID:CVCL_0317 |
| NCI-H838, Human Lung adenocarcinoma | Laboratory of David Sabatini (MIT, USA) | ATCC Cat#CRL-5844; RRID:CVCL_1594 |
| U-251MG, Human Astrocytoma | Laboratory of David Sabatini (MIT, USA) | RRID:CVCL_0021 |
| MDA-MB-231, Human Breast adenocarcinoma | Laboratory of David Sabatini (MIT, USA) | ATCC Cat#CRM-HTB-26; RRID:CVCL_0062 |
| A-549, Human Lung adenocarcinoma | Laboratory of David Sabatini (MIT, USA) | ATCC Cat#CRM-CCL-185; RRID:CVCL_0023 |
| DU145, Human Prostate carcinoma | Laboratory of David Sabatini (MIT, USA) | RRID:CVCL_0105 |
| LN229, Human Glioblastoma | Laboratory of David Sabatini (MIT, USA) | ATCC Cat#CRL-2611; RRID:CVCL_0393 |
| MDA-MB-415, Human Breast adenocarcinoma | Laboratory of David Sabatini (MIT, USA) | ATCC Cat#HTB-128; RRID:CVCL_0621 |
| COLO205, Human Colon adenocarcinoma | Laboratory of David Sabatini (MIT, USA) | ATCC Cat#CCL-222; RRID:CVCL_0218 |
| Pa16c (Panc 10.05), Human Pancreatic ductal adenocarcinoma | Laboratory of Brian Lewis (UMMS, USA) | ATCC Cat#CRL-2547; RRID:CVCL_1639 |
| Huh-7, Human Hepatocellular carcinoma | Laboratory of Kwan Yong Choi (POSTECH, Korea) | RRID:CVCL_0336 |
| THLE-3, Human Normal liver | Laboratory of Kwan Yong Choi (POSTECH, Korea) | ATCC Cat#CRL-11233; RRID:CVCL_3804 |
| CCD-841CoN, Human Normal colon | ATCC | ATCC Cat#CRL-1790; RRID:CVCL_2871 |
| CCD18-Lu, Human Normal lung | ATCC | ATCC Cat#CCL-205; RRID:CVCL_2380 |
| HS-67, Human Normal thymus | ATCC | ATCC Cat#HTB-163; RRID:CVCL_0833 |
| HIEC-6, Human Normal small intestine | ATCC | ATCC Cat#CRL-3266 |
| GM05565, Human Healthy Skin fibroblast | Corriel Institute | Cat#GM05565; RRID:CVCL_7432 |
| GM02037, Human Healthy Skin fibroblast | Corriel Institute | Cat#GM02037; RRID:CVCL_7349 |
| Experimental models: Organisms/strains | ||
| Athymic Nude Mice, Crl:NU(NCr)-Foxn1nu | Charles River Laboratories | Strain Code #490 |
| Rodent Diet with 10% Kcal Fat (matching sucrose to D12492) | Research Diets Inc. | Cat#D12450J |
| Rodent Diet with 60% Kcal Fat | Research Diets Inc. | Cat#D12492 |
| Oligonucleotides | ||
| CRISPR targeting guide sequence CTRL: ACTATCATGGCACCCAATTG | Wang et al. (2014) | N/A |
| CRISPR targeting guide sequence SPTLC1 g1: GTGCTACTCACCTTAACCCT | Wang et al. (2014) | N/A |
| CRISPR targeting guide sequence SPTLC1 g2: TTGGATTGTTGGATAACCCT | Wang et al. (2014) | N/A |
| CRISPR targeting guide sequence KDSR g1: TGTGTGCAAACCAGAACAGG | Wang et al. (2014) | N/A |
| CRISPR targeting guide sequence KDSR g2: GGCAAACTTGGATGCAGAGT | Wang et al. (2014) | N/A |
| Recombinant DNA | ||
| lentiCRISPR v2 | Sanjana et al. (2014) | Addgene Plasmid #52961 |
| pLV-EF1a-IRES-Blast | Hayer et al. (2016) | Addgene Plasmid #85133 |
| PMD154 | Laboratory of Scot Wolfe (UMMS, USA) | N/A |
| Software and algorithms | ||
| Graphpad Prism Version 9.1.1 | GraphPad | https://www.graphpad.com/ |
| Adobe Illustrator Version 23.1.1 | Adobe | N/A |
| Microsoft Excel Version 16.16.5 | Microsoft | N/A |
| FIJI ImageJ Version 2.0.0-rc-69/1.52p | Schindelin et al. (2012) | https://fiji.sc/ |
| BioRender | N/A | https://biorender.com/ |
| The Gene Ontology Resource | Ashburner et al. (2000) | http://geneontology.org/ |
| PANTHER Version 16.0 | Mi et al. (2019) | http://www.pantherdb.org/ |
| Java Treeview Version 1.1.6r2 | N/A | http://jtreeview.sourceforge.net/ |
| GEPIA 2 | Tang et al. (2019) | http://gepia2.cancer-pku.cn/#index |
| DTX880 Multimode Detector and Software | Beckman Coulter | N/A |
| Zen 2012 SP1 (black edition) Version 8.1 | Zeiss | N/A |
| FlowJo Version 10 | FlowJo, BD Biosciences | https://www.flowjo.com/solutions/flowjo/downloads |
| Sciex Multiquant | Sciex | https://sciex.com/products/software/ultiquanta-software |
| Sciex Analyst | Sciex | https://sciex.com/products/software/analyst-software |
| LipidSearch Sofware | Thermofisher Scientific | Cat#OPTON-30879 |
| Lipid Data Analyzer | Hartler et al. (2020) | N/A |
| Other | ||
| Thermo Vanquish UPLC | Thermofisher Scientific | N/A |
| Q Exactive Mass Spectrometer | Thermofisher Scientific | N/A |
| Acquity UPLC System | Waters | N/A |
| QTRAP 6500 LC-MS/MS System | Sciex | https://sciex.com/products/mass-spectrometers/qtrap-systems/qtrap-6500-system |
EXPERIMENTAL MODEL AND SUBJECT DETAILS
Cancer cell lines
All cancer cell lines used were cultured at 37°C under 5% CO2 and 20% oxygen. Human cancer cell lines DLD1 and COLO205 (colorectal adenocarcinoma), HT1080 (fibrosarcoma), NCIH838 and A549 (lung adenocarcinoma), U251MG (astrocytoma), LN229 (glioblastoma), MDA-MB-231 and MDA-MB-415 (breast adenocarcinoma), and DU145 (prostate carcinoma) were a kind gift of the David Sabatini Lab (MIT, USA), Pa16c (pancreatic ductal adenocarcinoma) were a kind gift of the Brian Lewis Lab (UMMS, USA), and HUH7 (hepatocellular carcinoma) were a kind gift of the Kwan Yong Choi Lab (POSTECH, Korea). All cancer cell lines used were cultured in Dulbecco’s Modified Eagle Medium (DMEM, high glucose, pyruvate) (Gibco #11995073) supplemented with 10% fetal bovine serum (FBS) (Sigma #F2442), 100 units/ml Penicillin-Streptomycin (Gibco #15140122), and 2mM L-Glutamine (Gibco #25030081). All cancer lines were authenticated by short tandem repeat (STR) profiling through the Duke University Human Cell Line Authentication Service, except for Pa16c, which was not profiled. All lines were tested for mycoplasma infection using the e-Myco plus Mycoplasma PCR Detection Kit (LiliF Diagnostics Cat#25237).
Non-cancer cell lines
All non-cancer cell lines used were human and were cultured at 37°C under 5% CO2 and 20% oxygen. THLE3 (normal liver) cells were a kind gift of the Kwan Yong Choi Lab (POSTECH, Korea). CCD841CoN (normal colon), CCD18Lu (normal lung), HS67 (normal thymus), HIEC6 (normal small intestine) were purchased from ATCC, and GM05565 and GM02037 (normal skin fibroblasts) were purchased from the Corriel Institute. THLE3 cells were cultured in BEBM Bronchial Epithelial Cell Growth Basal Medium (Lonza Cat#CC-3171) supplemented with the BEGM SingleQuots (Lonza Cat#CC-4175), 5ng/mL EGF, 70ng/mL Phosphoethanolamine, and 10% FBS. CCD841CoN, CCD18Lu, GM05565, and GM02037 were cultured in Eagle’s Minimum Essential Medium (ATCC Cat#30–2003) with 10% FBS (Sigma #F2442) and 100 units/ml Penicillin-Streptomycin. HS67 were cultured in Dulbecco’s Modified Eagle Medium (DMEM, high glucose, pyruvate) supplemented with 10% FBS, 100 units/ml Penicillin-Streptomycin, and 2mM L-Glutamine. HIEC6 were cultured in OptiMEM 1 Reduced Serum Medium (Gibco Cat#31985), 20 mM HEPES, 10 mM GlutaMAX (Gibco Cat#35050061), 10ng/ml EGF, 4% FBS, and 100 units/ml Penicillin-Streptomycin.
Patient tissues
Patient tissue samples were obtained from the University of Massachusetts Center for Clinical and Translational Science (UMCCTS) Biospecimen, Tissue, and Tumor Bank. Breast tumor tissues and adjacent normal tissues were obtained with informed consent from female patients ranging in age from 46 to 74 years old. Additional deidentified information can be made available upon request. Patient samples were collected during surgical tumor resections that took place at the UMass Memorial Health Care in Worcester MA, which is the clinical partner of the University of Massachusetts Medical School. The samples were collected in accordance with approval by the University of Massachusetts Medical School Institutional Review Board (IRB).
Animal models
Male and female athymic nude mice Crl:NU(NCr)-Foxn1nu (Charles Laboratories, Strain #490) were used for tumor xenograft experiments. Mice were housed in the animal facility at University of Massachusetts Medical School and were 6-8 weeks of age at the time of tumor implantation. Mice were randomly assigned to the 5 experimental groups, with males and females divided among the groups (4 males and 3 females or 3 males and 4 females in each group). Mice were monitored regularly for appearance, activity, and body weight throughout the experiment. All animal studies and procedures were done in compliance with a protocol approved by the Institutional Animal Care and Use Committee (IACUC) at University of Massachusetts Medical School.
METHOD DETAILS
Compounds
All compounds used were ordered from commercial sources and dissolved in the appropriate solvents. 3-Ketodihydrosphingosine HCl (Matreya #1876) and Sphinganine d18:0 (Cayman Chemical #10007945) were dissolved in 100% ethanol to stock concentrations of 20mM. Palmitic Acid (Millipore Sigma # P0500) was dissolved in 100% ethanol to a stock concentration of 250mM. Myriocin (Santa Cruz Biotechnology #sc-201397) and MG-132 (Millipore Sigma #474790) were dissolved in DMSO to stock concentrations of 10mM. Tunicamycin (Cayman Chemical #11445) was dissolved in DMSO to a stock concentration of 6mM.
Cloning of CRISPR constructs
Guide RNA sequences for targets of interest were obtained from a study described previously to identify optimal guide sequences for all genes (Wang et al., 2014). The guide RNA sequences used are listed in the key resources table. Forward and reverse oligos for each guide were phosphorylated and annealed and subsequently ligated into the lentiCRISPR v2 (pLCv2) construct digested with restriction enzyme BsmBI (New England Biolabs #R0739) (Sanjana et al., 2014; Shalem et al., 2014). Ligated DNA constructs were then transformed using XL10-Gold Ultracompetent Cells (Agilent #200315) and DNA was miniprepped with the PureYield Plasmid Miniprep System (Promega #A1222) for lentiviral transfection.
Lentivirus production and CRISPR gene KO in cell lines
Lentiviruses were produced by co-transfection of HEK293T cells with lentiCRISPR v2 containing guide sequences of interest, dvpr lentiviral packaging plasmid, and VSV-G envelope plasmid, with X-tremeGene 9 DNA Transfection Reagent (Sigma #6365779001). HEK293T cells were changed into fresh media at 18-20hr post transfection, and the media containing lentivirus was collected from the cells at 24hr post media change. Collected viruses were used directly for infections without concentration, and the viral titer for each virus was determined so that target cells could be infected with a <1 multiplicity of infection to avoid nonspecific toxicity of Cas9. A population of target cells was infected with lentivirus and 10 μg/mL polybrene (Millipore Sigma #TR-1003-G) for 24hr and then changed into media containing puromycin (1–2 μg/mL) to select for the population of cells that were successfully transduced and therefore obtained puromycin resistance. Cells were grown in the presence of puromycin for 4-5 days to ensure full selection.
Cell viability assay
Cell viability was measured using CellTiter-Glo 2.0 Cell Viability Assay (Promega #G9242), which measures viable (metabolically active) cells in culture by quantitating the amount of ATP present. CellTiter-Glo (CTG) Reagent and 96 well plates containing the cells were equilibrated to room temperature, 20ul of CTG reagent was added to each well of cells and incubated for 20 min protected from light. Luminescence was read with an integration time of 1.0 s using the Beckman Coulter DTX880 Multimode Detector plate reader and software.
For determination of relative viability as depicted in figures, CTG was measured at 2 different timepoints. The first viability measurement was taken as the baseline on the day after cells were plated to 96 wells, and the second viability measurement was taken at a later timepoint (1–5 days after baseline) to calculate the fold change viable cells over time for each condition (Day X CTG / Baseline CTG). These fold change values were then divided by the fold change of the control condition (=1.0) to determine the relative viability.
Determination of the effect of CRISPR gene KO on cell viability
The target cell line was plated to a 6 well plate and infected with lentiviruses containing pLCv2 CTRL (nontargeting guide) or pLCv2 with a guide targeting the gene of interest. Cells were changed into fresh media with puromycin (1–2 μg/mL) at 24hr post virus infection and selected for 4-5 days to obtain the population of infected cells that were successfully transduced. At 6 days post infection, the selected cells were counted and plated to 96 well plates (each condition was plated to 3–6 technical replicate wells, depending on the format of the experiment). CTRL and KO cells were plated to 96 wells at equal concentrations (typically 400–1200 cells/well, depending on the growth rate of the cell line) to allow for consistent baseline CTG values across conditions. Baseline viability was measured by CTG at day 7 post infection (the day after cells were plated to 96 wells), and subsequently at day 12 post infection. Cell viability was calculated as the fold change CTG values over the course of 5 days of growth (day 12 CTG / Day 7 CTG). The effect of each gene KO was then determined by calculating the viability (day 12/7 ratio) of each CRISPR guide relative to that of the CTRL nontargeting guide.
Comparing effects of KDSR KO on cell viability across cell lines
We have developed a system for comparing KDSR KO effects across the different cancer and non-cancer cell lines despite their varying growth rates and infectivity. Each cell line was first tested for a threshold degree of infectivity to lentivirus as well as for full selectivity in puromycin within 4 days; cells that are not infectable or puromycin selectable were not utilized in our studies. Next, cells are infected with lentiCRISPR v2 expressing either 1 of the 2 KDSR guides, or the nontargeting CTRL guide, at sub 1 multiplicity in 6 well format. Cells are selected for 4 days, then replated to 96 wells at a low confluency. One plate of these cells at 24h after plating is used as the baseline reading using CTG, and another equivalent plate CTG measured 5 days later is the ‘effect determining’ timepoint. By calculating growth under each condition over the baseline, for the KDSR KO and comparing to the CTRL KO, the relative effect of KDSR on cell viability can be measured across different cell lines. We noted that as a group, the non-cancer cell lines had lower proliferation rate than the cancer lines but feel this is reflective of the biological situation of normal somatic cells versus cancer cells, and we have verified effective KO of KDSR in these lines (Figures 1C, S1B, and S1C). We also note that THLE3 cells in the normal group have been immortalized via SV40 Large T antigen which can be considered a transformational change, but importantly, these cells are not capable of tumor formation (Pfeifer et al., 1993).
LC-MS quantification of sphingolipids
DLD1 cells were plated to 6 wells and infected for lentiviral transduction of lentiCRISPR v2 with nontargeting CTRL guide, KDSR g1, or SPTLC1 g1, with each condition infected in biological triplicate. Cells were selected with puromycin for 5 days and collected for analysis at 8 days post lentiviral infection. Cells were trypsinized, quickly washed 2x in cold PBS, centrifuged, and the cell pellet was collected for analysis. Lipid analysis was performed at the UCSD Lipidomics Core (Quehenberger et al., 2010). For quantification of sphingomyelin and ceramide species, samples were extracted via Butanol-Methanol (BUME) with 100ul/sample. The lipid (top) layer was collected, solvent was removed, and samples were reconstituted in 100ul LC solvent (18:1:1, IPA/DCM/MeOH). Samples were run on Reverse Phase-Ultra Performance Liquid Chromatography (Thermo Vanquish UPLC) on the Cortecs T3 C18 column. Mass spectrometry was performed on the Thermo Q Exactive Mass Spectrometer with MS/MS data dependent acquisition scan mode and analyzed with LipidSearch software and Lipid Data Analyzer (LDA). All data are expressed as normalized intensities relative to exactly measured internal standards and constitute relative abundances per mg protein. For the identification of each lipid molecular species including its exact fatty acid composition, MS/MS footprinting techniques were used. Details of methods and nomenclature used were adapted from a previous study (Hartler et al., 2020).
Total sphingomyelin levels under each condition were calculated as the sum of 121 analytes and total ceramide levels as the sum of 81 analytes. The ratio of total sphingomyelin and ceramide levels in KDSR and SPTLC1 KO cells were calculated relative to CTRL cells as shown in Figure 1E. The select species of sphingomyelins and ceramides shown in Figures S2A and S2B represent the top 10 most abundant species that were detected in all 3 biological replicate samples of the CTRL condition to show the effect of SPTLC1 and KDSR KO on the most abundant sphingolipids compared to CTRL. LC-MS quantification data of all sphingomyelin and ceramide species and further details of methods and nomenclature are shown in Table S1.
Lipid free viability assay
DLD1 cells were grown in media with 10% FBS (normal growth condition) or 10% charcoal stripped serum (Thermofisher #A3382101) (lipid free condition) for 1 week prior to lentiviral infection for CRISPR-mediated gene KO. Cells were infected in 6 wells, selected with puromycin, and plated to 96 wells, as described previously, in the appropriate serum conditions throughout the entirety of the experiment. Baseline CTG was measured at day 7 post infection, and subsequently at day 10 post infection. For the myriocin treated condition, CTRL cells were treated with 15uM myriocin at day 7 post infection and were treated for 72hr at the time of day 10 CTG measurement. Viability was measured over the course of 3 days of growth and calculated relative to CTRL untreated condition.
Western blotting
Cells were washed in cold PBS and resuspended in1% Triton-X 100 containing protease inhibitor cocktail and lysed on ice. Following cell lysis, samples were centrifuged at 13,000 rpm at 4°C for 10 min to remove cell debris and the supernatant (cell lysate) was collected. The protein concentration of each lysate was measured by Bradford Assay. Western blot samples were prepared by diluting lysates in 6x Laemmli Buffer and boiled at 95°C for 10 min. Samples were loaded to polyacrylamide gels at equal protein concentrations and analyzed by standard SDS-PAGE western blotting techniques. Protein levels were detected using HRP-conjugated secondary antibodies and chemiluminescent substrates. We found that not boiling the samples prior to gel electrophoresis was required to detect KDSR protein levels (Tsuji, 2020). All antibodies used for western blot protein analysis are listed in the key resources table.
Cell death analysis
Cell death was measured using the Annexin V-FITC Apoptosis Detection Kit for flow cytometry (BD Biosciences #BDB556547). DLD1 cells were analyzed for cell death following KDSR KO at 8 and 10 days post lentiviral infection to induce CRISPR KO with CTRL nontargeting guide and 2 guides targeting KDSR. Briefly, cells were washed in PBS and stained with Annexin V-FITC and propidium iodide (PI) for 15 min protected from light. Cells were analyzed for the expression of Annexin V and PI immediately after staining by fluorescence associated cell sorting (FACS) using the BD LSR II flow cytometer. Each condition was infected and analyzed by flow cytometry in in biological triplicate. Flow cytometry data were analyzed using FlowJo Version 10, and the gating strategy and representative flow cytometry plots are shown in Figures S2D and S2E.
CRISPR resistant KDSR rescue experiment
A mutated version of the KDSR gene was designed to be resistant to targeting with KDSR g1 by the addition of 3 silent mutations: 1 mutation in the Protospacer Adjacent Motif (PAM) sequence, and 2 mutations in the seed sequence. This CRISPR Resistant version of the KDSR gene (CR KDSR) was synthesized by GenScript with the addition of BamHI and NotI restriction sites. CR KDSR was digested with BamHI and NotI and ligated into the expression vector pLV-EF1a-IRES-Blast (Hayer et al., 2016). Lentiviruses were produced as described above containing blank pLV vector or pLV-CR KDSR.
To ensure the specificity of the phenotype induced by KDSR KO, we assessed the effects of KDSR KO in cells expressing blank pLV or CRISPR resistant KDSR to determine whether preventing targeting of KDSR with KDSR g1 rescues the effects of KDSR g1. We first transduced cells with lentivirus containing pLV Blank or pLV-CR KDSR and selected cells with blasticidin for 5 days. At day 6 post pLV (first) infection, we infected pLV Blank and pLV-CR KDSR cells with lentivirus containing pLCv2 CTRL or KDSR g1 and selected cells with puromycin for 5 days. At day 6 post pLCv2 (second) infection, cells were counted and plated to 96 wells at equal concentrations (400–600 cells/well). The baseline CTG measurement was taken at day 7 post pLCv2 (second) infection, and subsequent CTG timepoints were measured at days 10 and 12 post pLCv2 infection to determine cell viability over the course of 3 and 5 days of growth relative to cells expressing pLV Blank with CTRL KO.
LC-MS quantification of 3KDS
The levels of 3-ketodihydrosphingosine (3KDS) were quantified both in cells grown in culture and in tumor tissues from the in vivo xenograft experiment. Lipid analysis was performed at the UCSD Lipidomics Core (Quehenberger et al., 2010). For the in vitro experiment, DLD1 cells were infected for lentiviral transduction of pLCv2 with nontargeting CTRL guide, KDSR g1, or SPTLC1 g1. Cells were selected with puromycin for 5 days and were treated with the appropriate conditions (vehicle, 50uM palmitate, 15uM myriocin) at 6 days post infection. Cells were trypsinized, quickly washed 2x in cold PBS, centrifuged, and the cell pellet was collected for analysis at 8 days post lentiviral infection and 48hr post treatment. 3KDS quantification was normalized to the protein content of n = 3 independently prepared cell extracts for each condition.
For quantification of 3KDS in tumor samples, DLD1 xenograft tumors were collected and snap frozen at the endpoint of the in vivo experiment at 20 days post subcutaneous injection into mice. 3KDS was quantified in CTRL, KDSR KO, and SPTLC1 KO tumors in mice fed control diet and CTRL and KDSR KO tumors in mice fed high fat diet, in n = 5 tumors from each group. The quantification of 3KDS was normalized to the weight of each tumor analyzed.
Samples were extracted with DCM/MeOH (1:1) and 1x internal standards were added to extracts. Samples were vortexed, sonicated for 10 min, and then centrifuged at 5000 rpm for 5 min. Samples were re-extracted, combined, and dried down in a speed vac. Samples were then reconstituted in solvent and run on the ACQUITY UPLC System (Waters) on a Phenomenex Kinetex C18 column. Mass spectrometry analysis was performed on the Sciex 6500 Qtrap mass spectrometer and data were analyzed using Sciex Analyst and Multiquant software packages.
KDSR KO rescue and synergy experiments
Cells were plated to 6 wells and infected with lentiviruses containing pLCv2 CTRL or guides targeting KDSR. Cells were selected with puromycin for 4–5 days and were then counted and plated to 96 well plates at 6 days post lentiviral infection at 600–800 cells/well in technical triplicate or quadruplicate. Baseline cell viability was read at 7 days post infection, at which time the other 96 well plates (to be read at later timepoints) were treated with DMSO vehicle, 2uM myriocin, EtOH vehicle, or 2uM sphinganine for rescue experiments or with EtOH vehicle or 50uM palmitate for synergy experiments. For rescue experiments, subsequent CTG readings were taken at days 3 and 5 post treatment (10 and 12 days post infection) to determine the effect of SPT inhibition or sphinganine supplementation on KDSR KO toxicity. For synergy experiments, subsequent CTG readings were taken at 24, 48, and 72hr post treatment (8, 9, and 10 days post infection) to measure the effect of KDSR KO and palmitate treatment on cell viability relative to CTRL vehicle treated cells.
To determine whether KDSR KO and 50uM palmitate have a synergistic toxic effect on cells (Figure 2C), we used the Bliss Independence Model. Bliss independence values were calculated using the equation EC = EA + EB− EA x EB, where EC is the expected loss of viability if the effect of 2 conditions act independently of each other, EA is the loss of viability with KDSR KO, and EB is the loss of viability with palmitate treatment. Using this equation, synergy is defined as Eobserved > EC, where the observed effect of the 2 conditions together is greater than the effect predicted if the 2 conditions act independently of each other.
Double knockout rescue experiment
To induce the first gene KO, cells were plated to 6 wells and infected with lentivirus containing pLCv2 CTRL or guides targeting SPTLC1 and selected with puromycin. For second KO, guide RNAs were cloned into the PMD154 construct (Gift from the Scot Wolfe Lab, UMMS), which contains a site for the gRNA and hygromycin resistance, but does not contain Cas9, which is already stably expressed in cells from the first infection with pLCv2. Upon full selection, the cells were infected with PMD154 lentivirus containing CTRL guides or a guide targeting KDSR to induce the second gene KO. Cells were selected with hygromycin (500ug/ml) for 5 days and the double KO cells were plated to 96 wells at 400–600 cells/well in technical triplicate at 6 days after second infection. Baseline CTG was read at day 7 post second infection, and subsequent CTG readings for viability were measured at days 10 and 12 post second infection. The viability of double KO cells was therefore measured over the course of 3 and 5 days relative to cells targeted with CTRL nontargeting guides for both KOs.
RNAseq analysis
DLD1, NCIH838, and HUH7 cells were infected in 6 wells in biological triplicate with lentivirus containing pLCv2 CTRL or KDSR g1. Cells were selected with puromycin for 5 days and were changed into fresh media at 48hr prior to the collection time point. DLD1 and HUH7 cells were collected at day 8 post lentiviral infection and NCIH838 cells were collected at day 10 post infection and RNA was isolated from the cells for n = 3 for each condition (CTRL and KDSR KO for 3 cell lines) using the Rneasy RNA Isolation Kit (Qiagen #74104). Collection timepoints for DLD1 and NCIH838 were chosen so that RNA was isolated from the cells when their morphology was visibly affected by KDSR KO, but before they start undergoing significant levels of cell death.
For analysis of RNAseq data, all reads were normalized to the total number of reads per experiment (T.P.M. transcripts per million reads). To calculate the fold changes among all cell lines, the average T.P.M per gene was calculated for all the control reference samples and the average T.P.M was used as a reference genome. Log2 (T.P.M. per gene/ T.P.M of reference) was obtained for each sample. We included FC for genes that were detected in all samples and a cutoff of 1 T.P.M. or greater in our analysis. Unsupervised hierarchical clustering analysis was performed, and gene expression data were clustered by a Pearson correlation metric with equal weighting given to all data.
GO biological process Enrichment Analysis of RNAseq
Selection of gene clusters to analyze for enrichment were selected using Java TreeView Version 1.1.6r2 to visualize the hierarchical clustering analysis and identify clusters that are upregulated and downregulated specifically in the NCIH838 and DLD1 KDSR KO samples. To identify cellular responses specific to the sensitive lines under KDSR KO, we used the Gene Ontology Resource (Ashburner et al., 2000) and PANTHER16.0 to identify GO Biological Processes that are significantly enriched in the selected upregulated and downregulated clusters. We used the list of genes in each cluster to perform the PANTHER Overrepresentation Test using the Fisher’s Exact Test to identify significantly enriched GO Biological Processes (Mi et al., 2019). The full list of genes in each cluster and the full lists of enriched GO Biological Processes are provided in Tables S2 and S3.
Transmission electron microscopy (TEM)
Cell cultures of DLD1 CTRL and KDSR KO cells at day 8 after lentiviral infection were fixed by adding 2.5% glutaraldehyde in 0.1 M Na Cacodylate buffer (pH 7.2) to the culture plates one drop at a time until the initial volume of media was doubled. The cell cultures were allowed to stabilize in this solution for 10 min, then all the media/glutaraldehyde was removed and fresh 2.5% glutaraldehyde in the same buffer was added and the cells were allowed to fix for 60 min at room temperature. After this primary fixation, the cells were rinsed three times in fresh fixation buffer for 10 min each time and were secondarily fixed with 1.0% osmium tetroxide in ddH2O for 1hr at room temperature. The cell cultures were washed again three times in ddH2O and then the cells were gently scrapped from the culture plates and transferred to microfuge tubes. The cells were then dehydrated through a graded series of ethanol (10%–100%; 3 changes) and then transferred to ethanol 100%: SpiPon 812/Araldite 502 resin (50:50 /V:V) for 12hr at room temperature. Following infiltration in the resin, the cells were transferred through 3 changes of pure SpiPon 812/Araldite 502 epoxy resin each 1hr long. The cells were then changed to a final step of embedding resin mixture, pelleted and polymerized for two days at 68°C in the microfuge tubes. Ultrathin sections (approx. 70 nm thick) were collected onto 200 mesh copper support grids and contrasted with Uranyl Acetate and Lead Citrate and then imaged using a FEI Tecnai Spirit 12 Transmission electron microscope, under 120 KV accelerating voltage. Images were recorded with a Gatan RIO 9 CCD Digital camera.
Subcellular fractionation and fraction measurements of 3KDS
The overall fractionation protocol involves utilization both common differential centrifugation technique to collect nuclear and mitochondrial fractions, and also an additional sucrose layer step (Williamson et al., 2015), which combined with ultracentrifugation aids in the enrichment of ER.
For each set (4 sets total for biological quadruplicate), approximately 3 × 10⁷ DLD1 cells per condition (CTRL KO or KDSR KO) were harvested, washed, and resuspended in 1mL of buffer A (10mM HEPES/ 10mM KCl/ 1.5mM MgCl2/ 0.5mM Dithiothreitol / protease inhibitors), with 5% of starting material collected as ‘Whole Cell’ fraction. Remaining cells were lysed via 20 gentle passages through a 25G-5/8” syringe on ice, which resulted in >80% lysis (indicated by trypan blue) without excessive shearing of organelles and debris formation. Lysates were centrifuged for 9100 g × 10 min, which is sufficient to pellet nuclei and mitochondria (“initial pellet”) but not ER material, as confirmed by western blotting. The supernatant from this initial centrifugation (“initial supernatant”) is processed for ER-enriched microsomes as described in the next paragraph. The “initial pellet” was resuspended in buffer A and spun down at 400 g × 5 min. The 400g spindown pellet was resuspended in 0.25M sucrose / 10mM MgCl2 / protease inhibitor buffer, which was overlaid on a layer of 0.86M sucrose / 0.5mM MgCl2 / protease inhibitor buffer then spun down 2800 g × 10 min to collect the ‘nuclear’ pellet. Meanwhile, the 400g spindown supernatant was transferred and spun down at 7000g for 10 min, to collect the ‘mitochondrial’ pellet.
Meanwhile, the 9100g spindown “initial supernatant” was applied on top of a 1.3M/ 1.5M/ 2.0M sucrose gradient that was overlaid on a polyallomer tube. This was subjected to ultracentrifugation at 152,000g for 80 min, resulting in a supernatant layer which corresponds to the ‘cytosolic’ fraction, and a white band at the interface of the 1.3M sucrose layer. This white band was carefully transferred, resuspended in buffer A, and subjected to ultracentrifugation at 126,000 g × 50 min to pellet the ‘microsome’ fraction.
All pellets (whole cell/ nucleus/ mitochondria/ microsome) were resuspended in buffer A and along with the cytosolic supernatant analyzed for protein content (Bradford) and for 3KDS quantification (“LC-MS Quantification of 3KDS” section). 10μg protein equivalent of each sample were run in western blots to verify fractionation performance as shown in Figure S4C. 3KDS values shown in Figure S4B are normalized to total protein content of each fraction.
Immunocytochemistry
DLD1 cells were infected with lentivirus with pLCv2 containing CTRL or KDSR g1, selected with puromycin, and seeded to coverslips coated with poly-D-lysine (PDL) and laminin. At day 9 post lentiviral infection, cells were fixed with 4% paraformaldehyde (PFA) and permeabilized with 0.2% Triton-X Buffer and washed with PBS. After permeabilization, cells were stained for ER membrane with primary antibody against Calnexin at 1:500 (Proteintech #10427-2-AP), Actin with Phalloidin-iFluor488 (Abcam #ab176753), and Nuclei with Hoechst 33342 at 5ug/ml (Invitrogen #H3570) and washed with PBS. Cells were then stained with goat-anti rabbit AlexaFluor555 secondary antibody against Calnexin (Abcam #ab150078) and washed with PBS after staining. Coverslips were mounted to slides and imaged using the Nikon Eclipse Ti2 confocal microscope.
Protein aggresome staining
Cells were grown on coverslips coated with PDL/laminin and were stained for protein aggresomes at 9 days post lentiviral infection for CTRL or KDSR KO or 18hr post treatment with vehicle or 3μM MG132. Protein aggresomes were detected using the PROTOEOSTAT Aggresome detection kit (Enzo Life Sciences #ENZ-51035), which contains a dye that fluoresces upon intercalation into the cross-beta spine of protein structures found in misfolded and aggregated proteins. For aggresome staining, cells were fixed in 4% PFA, washed in PBS, and permeabilized in 0.5% TXBon ice with gentle shaking for 30 min. Cells were washed in PBS following permeabilization and were subsequently incubated with the Aggresome Detection Reagent diluted 1:2000 in PBS for 45 min at room temperature protected from light. Cells were washed with PBS after staining and coverslips were mounted to microscope slides using ProLong Gold Antifade Mountant containing DAPI (Thermofisher #P36941). Cells were imaged using the Zeiss LSM700 confocal microscope and Zen Black 2012 Software.
Tumor xenograft model
Six-week-old male and female athymic nude mice were purchased from Charles River Laboratories and were housed in the animal facility at the University of Massachusetts Medical School. The growth of DLD1 (colorectal cancer) tumors were compared under CTRL, KDSR KO, and SPTLC1 KO in mice fed a control diet (Research Diets Inc., D12450J) and CTRL and KDSR KO in mice fed a high fat diet (Research Diets Inc., D1492). This study was performed with n = 7 mice in each of the 5 experimental groups. The mice were put onto the control and high fat diet 2 days prior to tumor injection. DLD1 cells transduced with pLCv2 CTRL, SPTLC1 g1, or KDSR g1 were resuspended in PBS and 1 × 10⁶ cells were injected subcutaneously into the right flank of mice after puromycin selection at 6 days after lentiviral infection. Tumors were measured every 3–4 days using a Vernier caliper and the mice were monitored for health and weighed regularly through the course of the experiment. Mice were euthanized at 20 days after tumor injection and tumors were isolated, weighed, and snap frozen for further analysis. Tumor volume was measured using the formula 4/3 π x (Length x Width x Depth)/2. This study was done in compliance with a protocol approved by the Institutional Animal Care and Use Committee (IACUC) at University of Massachusetts Medical School.
SPTLC1 and SPTLC2 protein quantification in patient breast tissues
Matched breast tumor tissue and normal tissue from patients were snap frozen and stored at −80°C upon surgical removal with informed consent under IRB approved protocol. We obtained these patient tissues from the Biospecimen, Tissue, and Tumor Bank at the University of Massachusetts Medical School. The frozen tissues were homogenized and lysed in RIPA buffer supplemented with protease inhibitor cocktail on ice. After lysis, samples were centrifuged at 13000 rpm at 4°C for 10 min, and supernatants were collected. Bradford assay was used to measure the protein concentration of each sample. Matched sample pairs were run side by side using standard SDS PAGE to detect SPTLC1 and SPTLC2 protein levels in normal and tumor tissue from the same patient. Vinculin was used as a loading control, and the samples were run multiple times to optimize equal detection of vinculin within each normal-tumor pair. One patient normal-tumor tissue pairing was excluded from SPTLC1/2 protein analyses, as no loading protein could be detected, rendering objective quantification impossible in this pair. Proteins were quantified using ImageJ by measuring band intensity and subtracting out background measurements. The band intensities of SPTLC1 and SPTLC2 were normalized to that of vinculin in the same sample to obtain a vinculin-normalized quantification of SPTLC1/2 protein levels.
QUANTIFICATION AND STATISTICAL ANALYSIS
For all experiments with relative viability data, each condition was measured in at least 3 technical replicates within each experiment and each experiment was repeated at least 3 separate times (represented by individual points in bar graphs), unless otherwise indicated. FACS analysis, RNAseq analysis, and LC-MS lipid quantification were all done in biological triplicate from 3 separately infected/treated and analyzed samples. Data are presented as mean + standard deviation. Statistics were calculated using the two-tailed Student’s t-test. p < 0.05 is considered statistically significant, and data were marked with statistical significance as follows: *p < 0.05, **p < 0.01, ***p < 0.001, ****p < 0.0001, ns = not significant. Information on experiment replicates, definition of center and dispersion, data normalization, and statistical tests can be found in the figure legends, and for some experiments, more detail can be found in the method details section of the STAR Methods. Statistics and graphs were prepared using Microsoft Excel Version 16.16.5 and Graphpad Prism Version 9.1.1. Light microscope images were taken using the Leica Dmi1 Light Microscope. Image preparation and western blot band intensity quantification were done using FIJI Image J Version 2.0 (Schindelin et al., 2012). Graphs of analyzed patient data from TCGA and GTEx showing normal vs. tumor mRNA expression (Figures 4K, S5A, and S5B), survival analysis plots (Figure 4L), and SPTLC1/2 mRNA correlation plot (Figure S5D) were made with GEPIA2 (Tang et al., 2019). Figures were prepared using Adobe Illustrator Version 23.1.1. Schematics in Figures 1A, 2H, and S1E were created using Biorender.com.
Supplementary Material
Highlights.
Serine palmitoyltransferase (SPT) is elevated in breast and other cancer tissues
The metabolite 3KDS produced by serine palmitoyltransferase is toxic at high levels
3KDS overload induces ER dysfunction and loss of proteostasis
KDSR is selectively required in SPT-expressing cancer cells to detoxify 3KDS
ACKNOWLEDGMENTS
We thank E.H. Baehrecke, A.M. Mercurio, M.J. Lee, L.M. Shaw, and B.C. Lewis for their advice, assistance, and feedback. We thank D.M. Sabatini, S.A. Wolfe, and K.Y. Choi for sharing materials including cell lines and vectors. We thank J. Baek for assistance with statistics. We also thank G. Hendricks and L. Strittmatter at the UMMS Core Electron Microscopy Facility for assistance with electron microscopy, supported by NIH S10 OD021580 and S10 OD025113-01. This work was supported by the Suh Kyungbae Foundation (SUHF) Young Investigator Award to D.K., NIH T32 CA130807-8 to M.E.S., NIH T32GM107000 to J.G., NIH R01GM118481 to E.M.T., and fellowships from the Searle Scholars Program and the Rita Allen Foundation and NIH DP2 OD027719-01 to P.L.G.
Footnotes
SUPPLEMENTAL INFORMATION
Supplemental information can be found online at https://doi.org/10.1016/j.celrep.2022.111415.
DECLARATION OF INTERESTS
M.E.S., N.L., and D.K. are authorson a patent application on targeting KDSR in cancer therapy, which is filed by University of Massachusetts Medical School.
REFERENCES
- Almond JB, and Cohen GM (2002). The proteasome: a novel target for cancer chemotherapy. Leukemia 16, 433–443. [DOI] [PubMed] [Google Scholar]
- Ashburner M, Ball CA, Blake JA, Botstein D, Butler H, Cherry JM, Davis AP, Dolinski K, Dwight SS, Eppig JT, et al. (2000). Gene ontology: tool for the unification of biology. The Gene Ontology Consortium. Nat. Genet 25, 25–29. [DOI] [PMC free article] [PubMed] [Google Scholar]
- Bariana TK, Labarque V, Heremans J, Thys C, De Reys M, Greene D, Jenkins B, Grassi L, Seyres D, Burden F, et al. (2019). Sphingolipid dysregulation due to lack of functional KDSR impairs proplatelet formation causing thrombocytopenia. Haematologica 104, 1036–1045. [DOI] [PMC free article] [PubMed] [Google Scholar]
- Bianchi M, Crinelli R, Arbore V, and Magnani M (2018). Induction of ubiquitin C (UBC) gene transcription is mediated by HSF1: role of proteotoxic and oxidative stress. FEBS Open Bio 8, 1471–1485. [DOI] [PMC free article] [PubMed] [Google Scholar]
- Bourougaa K, Naski N, Boularan C, Mlynarczyk C, Candeias MM, Marullo S, and Fåhraeus R (2010). Endoplasmic reticulum stress induces G2 cell-cycle arrest via mRNA translation of the p53 isoform p53/47. Mol. Cell 38, 78–88. [DOI] [PubMed] [Google Scholar]
- Boyden LM, Vincent NG, Zhou J, Hu R, Craiglow BG, Bayliss SJ, Rosman IS, Lucky AW, Diaz LA, Goldsmith LA, et al. (2017). Mutations in KDSR cause recessive progressive symmetric erythrokeratoderma. Am. J. Hum. Genet 100, 978–984. [DOI] [PMC free article] [PubMed] [Google Scholar]
- Carreira AC, Santos TC, Lone MA, Zupancic E, Lloyd-Evans E, de Almeida RFM, Hornemann T, and Silva LC (2019). Mammalian sphingoid bases: biophysical, physiological and pathological properties. Prog. Lipid Res, 100995. [DOI] [PubMed] [Google Scholar]
- Chau V, Tobias JW, Bachmair A, Marriott D, Ecker DJ, Gonda DK, and Varshavsky A (1989). A multiubiquitin chain is confined to specific lysine in a targeted short-lived protein. Science 243, 1576–1583. [DOI] [PubMed] [Google Scholar]
- Chen X, and Cubillos-Ruiz JR (2021). Endoplasmic reticulum stress signals in the tumour and its microenvironment. Nat. Rev. Cancer 21, 71–88. [DOI] [PMC free article] [PubMed] [Google Scholar]
- Contreras FX, Sot J, Alonso A, and Goñi FM (2006). Sphingosine increases the permeability of model and cell membranes. Biophys. J 90, 4085–4092. [DOI] [PMC free article] [PubMed] [Google Scholar]
- Gault CR, Obeid LM, and Hannun YA (2010). An overview of sphingolipid metabolism: from synthesis to breakdown. Adv. Exp. Med. Biol 688, 1–23. [DOI] [PMC free article] [PubMed] [Google Scholar]
- Hannun YA, and Obeid LM (2008). Principles of bioactive lipid signalling: lessons from sphingolipids. Nat. Rev. Mol. Cell Biol 9, 139–150. [DOI] [PubMed] [Google Scholar]
- Hannun YA, and Obeid LM (2018). Sphingolipids and their metabolism in physiology and disease. Nat. Rev. Mol. Cell Biol 19, 175–191. [DOI] [PMC free article] [PubMed] [Google Scholar]
- Hartler J, Armando AM, Trötzmülle R,M, Dennis EA, Köfeler HC, and Quehenberger O (2020). Automated annotation of sphingolipids including accurate identification of hydroxylation sites using MS(n) data. Anal. Chem 92, 14054–14062. [DOI] [PMC free article] [PubMed] [Google Scholar]
- Hayer A, Shao L, Chung M, Joubert LM, Yang HW, Tsai FC, Bisaria A, Betzig E, and Meyer T (2016). Engulfed cadherin fingers are polarized junctional structures between collectively migrating endothelial cells. Nat. Cell Biol 18, 1311–1323. [DOI] [PMC free article] [PubMed] [Google Scholar]
- Hetz C (2012). The unfolded protein response: controlling cell fate decisions under ER stress and beyond. Nat. Rev. Mol. Cell Biol 13, 89–102. [DOI] [PubMed] [Google Scholar]
- Hornemann T, Richard S, Rütti MF, Wei Y, and von Eckardstein A (2006). Cloning and initial characterization of a new subunit for mammalian serine-palmitoyltransferase. J. Biol. Chem 281, 37275–37281. [DOI] [PubMed] [Google Scholar]
- Hwang S, Williams JF, Kneissig M, Lioudyno M, Rivera I, Helguera P, Busciglio J, Storchova Z, King MC, and Torres EM (2019). Suppressing aneuploidy-associated phenotypes improves the fitness of trisomy 21 cells. Cell Rep. 29, 2473–2488.e5. [DOI] [PMC free article] [PubMed] [Google Scholar]
- Jiménez-Rojo N, Sot J, Viguera AR, Collado MI, Torrecillas A, Gómez-Fernández JC, Goñi FM, and Alonso A (2014). Membrane permeabilization induced by sphingosine: effect of negatively charged lipids. Biophys. J 106, 2577–2584. [DOI] [PMC free article] [PubMed] [Google Scholar]
- Kitatani K, Idkowiak-Baldys J, and Hannun YA (2008). The sphingolipid salvage pathway in ceramide metabolism and signaling. Cell. Signal 20, 1010–1018. [DOI] [PMC free article] [PubMed] [Google Scholar]
- Koundouros N, and Poulogiannis G (2020). Reprogramming of fatty acid metabolism in cancer. Br. J. Cancer 122, 4–22. [DOI] [PMC free article] [PubMed] [Google Scholar]
- Liu C, Chen XY, Wu WQ, and Zhu XF (2020). A homozygotic mutation in KDSR may cause keratinization disorders and thrombocytopenia: a case report. Chin. Med. Sci. J 35, 278–282. [DOI] [PubMed] [Google Scholar]
- Li S, Xie T, Liu P, Wang L, and Gong X (2021). Structural insights into the assembly and substrate selectivity of human SPT-ORMDL3 complex. Nat. Struct. Mol. Biol 28, 249–257. [DOI] [PubMed] [Google Scholar]
- Liu Q, Chan AKN, Chang WH, Yang L, Pokharel SP, Miyashita K, Mattson N, Xu X, Li M, Lu W, et al. (2022). 3-Ketodihydrosphingosine reductase maintains ER homeostasis and unfolded protein response in leukemia. Leukemia 36, 100–110. [DOI] [PMC free article] [PubMed] [Google Scholar]
- Louie SM, Roberts LS, Mulvihill MM, Luo K, and Nomura DK (2013). Cancer cells incorporate and remodel exogenous palmitate into structural and oncogenic signaling lipids. Biochim. Biophys. Acta 1831, 1566–1572. [DOI] [PMC free article] [PubMed] [Google Scholar]
- Manasanch EE, and Orlowski RZ (2017). Proteasome inhibitors in cancer therapy. Nat. Rev. Clin. Oncol 14, 417–433. [DOI] [PMC free article] [PubMed] [Google Scholar]
- Mandon EC, Ehses I, Rother J, van Echten G, and Sandhoff K (1992). Subcellular localization and membrane topology of serine palmitoyltransferase, 3-dehydrosphinganine reductase, and sphinganine N-acyltransferase in mouse liver. J. Biol. Chem 267, 11144–11148. [PubMed] [Google Scholar]
- Merrill AH Jr., Wang E, and Mullins RE (1988). Kinetics of long-chain (sphingoid) base biosynthesis in intact LM cells: effects of varying the extracellular concentrations of serine and fatty acid precursors of this pathway. Biochemistry 27, 340–345. [DOI] [PubMed] [Google Scholar]
- Mi H, Muruganujan A, Ebert D, Huang X, and Thomas PD (2019). PANTHER version 14: more genomes, a new PANTHER GO-slim and improvements in enrichment analysis tools. Nucleic Acids Res. 47, D419–D426. [DOI] [PMC free article] [PubMed] [Google Scholar]
- Miyake Y, Kozutsumi Y, Nakamura S, Fujita T, and Kawasaki T (1995). Serine palmitoyltransferase is the primary target of a sphingosine-like immunosuppressant, ISP-1/myriocin. Biochem. Biophys. Res. Commun 211, 396–403. [DOI] [PubMed] [Google Scholar]
- Nath A, LI I, Roberts LR, and Chan C (2015). Elevated free fatty acid uptake via CD36 promotes epithelial-mesenchymal transition in hepatocellular carcinoma. Sci. Rep 5, 14752. [DOI] [PMC free article] [PubMed] [Google Scholar]
- Ogretmen B (2018). Sphingolipid metabolism in cancer signalling and therapy. Nat. Rev. Cancer 18, 33–50. [DOI] [PMC free article] [PubMed] [Google Scholar]
- Pascual G, Avgustinova A, Mejetta S, Martin M, Castellanos A, Attolini CS, Berenguer A, Prats N, Toll A, Hueto JA, et al. (2017). Targeting metastasis-initiating cells through the fatty acid receptor CD36. Nature 541, 41–45. [DOI] [PubMed] [Google Scholar]
- Pfeifer AM, Cole KE, Smoot DT, Weston A, Groopman JD, Shields PG, Vignaud JM, Juillerat M, Lipsky MM,Trump BF, et al. (1993). Simian virus 40 large tumor antigen-immortalized normal human liver epithelial cells express hepatocyte characteristics and metabolize chemical carcinogens. Proc. Natl. Acad. Sci. USA 90, 5123–5127. [DOI] [PMC free article] [PubMed] [Google Scholar]
- Phillips MJ, and Voeltz GK (2016). Structure and function of ER membrane contact sites with other organelles. Nat. Rev. Mol. Cell Biol 17, 69–82. [DOI] [PMC free article] [PubMed] [Google Scholar]
- Pohl C, and Dikic I (2019). Cellular quality control by the ubiquitin-proteasome system and autophagy. Science 366, 818–822. [DOI] [PubMed] [Google Scholar]
- Quehenberger O,Armando AM, Brown AH, Milne SB, Myers DS, Merrill AH, Bandyopadhyay S, Jones KN, Kelly S, Shaner RL, et al. (2010). Lipidomics reveals a remarkable diversity of lipids in human plasma. J. Lipid Res 57, 3299–3305. [DOI] [PMC free article] [PubMed] [Google Scholar]
- Ryu KY, Maehr R, Gilchrist CA, Long MA, Bouley DM, Mueller B, Ploegh HL, and Kopito RR (2007). The mouse polyubiquitin gene UbC is essential for fetal liver development, cell-cycle progression and stress tolerance. EMBO J. 26, 2693–2706. [DOI] [PMC free article] [PubMed] [Google Scholar]
- Sanjana NE, Shalem O, and Zhang F (2014). Improved vectors and genome-wide libraries for CRISPR screening. Nat. Methods 77, 783–784. [DOI] [PMC free article] [PubMed] [Google Scholar]
- Schindelin J, Arganda-Carreras I, Frise E, Kaynig V, Longair M, Pietzsch T, Preibisch S, Rueden C, Saalfeld S, Schmid B, et al. (2012). Fiji: an open-source platform for biological-image analysis. Nat. Methods 9, 676–682. [DOI] [PMC free article] [PubMed] [Google Scholar]
- Schwarz DS, and Blower MD (2016). The endoplasmic reticulum: structure, function and response to cellular signaling. Cell. Mol. Life Sci 73, 79–94. [DOI] [PMC free article] [PubMed] [Google Scholar]
- Shalem O, Sanjana NE, Hartenian E, Shi X, Scott DA, Mikkelson T, Heckl D, Ebert BL, Root DE, Doench JG, and Zhang F (2014). Genome-scale CRISPR-Cas9 knockout screening in human cells. Science 343, 84–87. [DOI] [PMC free article] [PubMed] [Google Scholar]
- Takeichi T, Torrelo A, Lee JYW, Ohno Y, Lozano ML, Kihara A, Liu L, Yasuda Y, Ishikawa J, Murase T, et al. (2017). Biallelic mutations in KDSR disrupt ceramide synthesis and result in a spectrum of keratinization disorders associated with thrombocytopenia. J. Invest. Dermatol 737, 2344–2353. [DOI] [PMC free article] [PubMed] [Google Scholar]
- Tang Z, Kang B, Li C, Chen T, and Zhang Z (2019). GEPIA2: an enhanced web server for large-scale expression profiling and interactive analysis. Nucleic Acids Res. 47, W556–W560. [DOI] [PMC free article] [PubMed] [Google Scholar]
- Tsuji Y (2020). Transmembrane protein western blotting: impact of sample preparation on detection of SLC11A2 (DMT1) and SLC40A1 (ferroportin). PLoS One 15, e0235563. [DOI] [PMC free article] [PubMed] [Google Scholar]
- Wang M, and Kaufman RJ (2016). Protein misfolding in the endoplasmic reticulum as a conduit to human disease. Nature 529, 326–335. [DOI] [PubMed] [Google Scholar]
- Wang T, Wei JJ, Sabatini DM, and Lander ES (2014). Genetic screens in human cells using the CRISPR-Cas9 system. Science 343, 80–84. [DOI] [PMC free article] [PubMed] [Google Scholar]
- Williamson CD, Wong DS, Bozidis P, Zhang A, and Colberg-Poley AM (2015). Isolation of endoplasmic reticulum, mitochondria, and mitochondria-associated membrane and detergent resistant membrane fractions from transfected cells and from human cytomegalovirus-infected primary fibroblasts. Curr. Protoc. Cell Biol 68, 3.27.1–3.27.33. [DOI] [PMC free article] [PubMed] [Google Scholar]
Associated Data
This section collects any data citations, data availability statements, or supplementary materials included in this article.
Supplementary Materials
Data Availability Statement
RNA sequencing data have been deposited to the Gene Expression Omnibus database and are publicly available upon the date of publication. The GEO accession number is listed in the key resources table. Lipidomics data for all sphingomyelin and ceramide species measured by LC-MS are provided in Table S1.
This paper does not report original code.
Any additional information required to reanalyze the data reported in this paper is available from the lead contact upon request.
KEY RESOURCES TABLE
| REAGENT or RESOURCE | SOURCE | IDENTIFIER |
|---|---|---|
| Antibodies | ||
| Rabbit polyclonal Anti-SPTLC1 | Abcam | Cat#ab176706 |
| Rabbit polyclonal Anti-SPTLC2 | Abcam | Cat#ab23696; RRID:AB_447617 |
| Rabbit polyclonal Anti-KDSR | Sigma-Aldrich | Cat#HPA044884; RRID:AB_2679131 |
| Mouse Monoclonal Anti-β-actin | Sigma-Aldrich | Cat#A5541 |
| Rabbit monoclonal Anti-Vinculin | Abcam | Cat#ab129002; RRID:AB_11144129 |
| Rabbit monoclonal Anti-PERK, Clone D11A8 | Cell Signaling Technology | Cat#5683; RRID:AB_10841299 |
| Rabbit monoclonal Anti-IRE1α, Clone 14C10 | Cell Signaling Technology | Cat#3294 RRID:AB_823545 |
| Rabbit monoclonal Anti-Calnexin, Clone C5C9 | Cell Signaling Technology | Cat#2679; RRID:AB_2228381 |
| Rabbit monoclonal Anti-BiP, Clone C50B12 | Cell Signaling Technology | Cat#3177; RRID:AB_2119845 |
| Rabbit polyclonal Anti-Ero1-Lα | Cell Signaling Technology | Cat#3264; RRID:AB_823684 |
| Rabbit monoclonal Anti-PDI, Clone C81H6 | Cell Signaling Technology | Cat#3501; RRID:AB_2156433 |
| Mouse monoclonal Anti-CHOP, Clone L63F7 | Cell Signaling Technology | Cat#2895; RRID:AB_2089254 |
| Rabbit monoclonal Anti-Ubiquitin, Lys48-Specific, Clone Apu2 | EMD Millipore | Cat#05-1307; RRID:AB_11213655 |
| Mouse monoclonal Anti-NDUFS3, Clone 3F9DD2 | Abcam | Cat#ab110246; RRID:AB_10861972 |
| Rabbit polyclonal Anti-Lamin B1 | Abcam | Cat#ab16048; RRID:AB_443298 |
| Anti-mouse IgG, HRP-linked | Cell Signaling Technology | Cat#7076; RRID:AB_330924 |
| Mouse Anti-rabbit IgG-HRP | Santa Cruz Biotechnology | Cat#sc-2357; RRID:AB_628497 |
| For ICC: Rabbit polyclonal Anti-Calnexin | Proteintech | Cat#10427-2-AP; RRID:AB_2069033 |
| For ICC: Goat Anti-Rabbit IgG H&L AlexaFluor555 | Abcam | Cat#ab150078; RRID:AB_2722519 |
| Bacterial and virus strains | ||
| XL10-Gold Ultracompetent Cells | Agilent | Cat#200315 |
| Biological samples | ||
| Patient matched normal and tumor breast tissues | UMCCTS Biospecimen, Tissue and Tumor Bank (Biorepository) | https://www.umassmed.edu/tissue-and-tumor-bank/ |
| Chemicals, peptides, and recombinant proteins | ||
| 3-keto-Dihydrosphingosine HCl | Matreya | Cat#1876 |
| Myriocin (ISP-1) | Santa Cruz Biotechnology | Cat#sc-201397 |
| Palmitic Acid | Millipore Sigma | Cat#P0500 |
| MG-132 | Millipore Sigma | Cat#474790 |
| Sphinganine (d18:0) | Cayman Chemical | Cat#10007945 |
| Tunicamycin | Cayman Chemical | Cat#11445 |
| Fetal Bovine Serum | Millipore Sigma | Cat#F2442 |
| Fetal Bovine Serum, charcoal stripped | Thermo Fisher Scientific | Cat#A3382101 |
| DMEM, high glucose, pyruvate | Gibco | Cat#11995073 |
| Eagles Minimum essential media | ATCC | Cat#30-2003 |
| Opti-MEM™ I Reduced Serum Medium | Gibco | Cat#31985070 |
| BEGM Bronchial Epithelial Cell Growth Medium BulletKit | Lonza | Cat#CC-3170 |
| X-tremeGene 9 DNA Transfection Reagent | Millipore Sigma | Cat#6365779001 |
| Polybrene | Millipore Sigma | Cat#TR-1003-G |
| BsmBI Restriction Enzyme | New England Biolabs | Cat#R0739 |
| Phalloidin-iFluor 488 | Abcam | Cat#ab176753 |
| Hoechst 33342 Nucleic acid stain | Invitrogen | Cat#H3570 |
| ProLong Gold Antifade Mountant with DAPI | Thermo Fisher Scientific | Cat#P36941 |
| Critical commercial assays | ||
| CellTiter-Glo 2.0 Cell Viability Assay | Promega | Cat#G9242 |
| PROTEOSTAT Aggresome Detection Kit | Enzo Life Sciences | Cat#ENZ-51035 |
| BD Annexin V: FITC Apoptosis Detection Kit I | Thermo Fisher Scientific | Cat#BDB556547 |
| PureYield Plasmid Miniprep System | Promega | Cat#A1222 |
| Rneasy Mini Kit | Qiagen | Cat#74104 |
| e-Myco plus Mycoplasma PCR Detection Kit | LiliF Diagnostics | Cat#25237 |
| Deposited data | ||
| RNA-Sequencing analysis of control and KDSR KO cancer cell lines | This paper | GEO: GSE182179 |
| Experimental models: Cell lines | ||
| DLD-1, Human Colorectal adenocarcinoma | Laboratory of David Sabatini (MIT, USA) | ATCC Cat#CCL-221; RRID:CVCL_0248 |
| HT-1080, Human Fibrosarcoma | Laboratory of David Sabatini (MIT, USA) | ATCC Cat#CCL-121; RRID:CVCL_0317 |
| NCI-H838, Human Lung adenocarcinoma | Laboratory of David Sabatini (MIT, USA) | ATCC Cat#CRL-5844; RRID:CVCL_1594 |
| U-251MG, Human Astrocytoma | Laboratory of David Sabatini (MIT, USA) | RRID:CVCL_0021 |
| MDA-MB-231, Human Breast adenocarcinoma | Laboratory of David Sabatini (MIT, USA) | ATCC Cat#CRM-HTB-26; RRID:CVCL_0062 |
| A-549, Human Lung adenocarcinoma | Laboratory of David Sabatini (MIT, USA) | ATCC Cat#CRM-CCL-185; RRID:CVCL_0023 |
| DU145, Human Prostate carcinoma | Laboratory of David Sabatini (MIT, USA) | RRID:CVCL_0105 |
| LN229, Human Glioblastoma | Laboratory of David Sabatini (MIT, USA) | ATCC Cat#CRL-2611; RRID:CVCL_0393 |
| MDA-MB-415, Human Breast adenocarcinoma | Laboratory of David Sabatini (MIT, USA) | ATCC Cat#HTB-128; RRID:CVCL_0621 |
| COLO205, Human Colon adenocarcinoma | Laboratory of David Sabatini (MIT, USA) | ATCC Cat#CCL-222; RRID:CVCL_0218 |
| Pa16c (Panc 10.05), Human Pancreatic ductal adenocarcinoma | Laboratory of Brian Lewis (UMMS, USA) | ATCC Cat#CRL-2547; RRID:CVCL_1639 |
| Huh-7, Human Hepatocellular carcinoma | Laboratory of Kwan Yong Choi (POSTECH, Korea) | RRID:CVCL_0336 |
| THLE-3, Human Normal liver | Laboratory of Kwan Yong Choi (POSTECH, Korea) | ATCC Cat#CRL-11233; RRID:CVCL_3804 |
| CCD-841CoN, Human Normal colon | ATCC | ATCC Cat#CRL-1790; RRID:CVCL_2871 |
| CCD18-Lu, Human Normal lung | ATCC | ATCC Cat#CCL-205; RRID:CVCL_2380 |
| HS-67, Human Normal thymus | ATCC | ATCC Cat#HTB-163; RRID:CVCL_0833 |
| HIEC-6, Human Normal small intestine | ATCC | ATCC Cat#CRL-3266 |
| GM05565, Human Healthy Skin fibroblast | Corriel Institute | Cat#GM05565; RRID:CVCL_7432 |
| GM02037, Human Healthy Skin fibroblast | Corriel Institute | Cat#GM02037; RRID:CVCL_7349 |
| Experimental models: Organisms/strains | ||
| Athymic Nude Mice, Crl:NU(NCr)-Foxn1nu | Charles River Laboratories | Strain Code #490 |
| Rodent Diet with 10% Kcal Fat (matching sucrose to D12492) | Research Diets Inc. | Cat#D12450J |
| Rodent Diet with 60% Kcal Fat | Research Diets Inc. | Cat#D12492 |
| Oligonucleotides | ||
| CRISPR targeting guide sequence CTRL: ACTATCATGGCACCCAATTG | Wang et al. (2014) | N/A |
| CRISPR targeting guide sequence SPTLC1 g1: GTGCTACTCACCTTAACCCT | Wang et al. (2014) | N/A |
| CRISPR targeting guide sequence SPTLC1 g2: TTGGATTGTTGGATAACCCT | Wang et al. (2014) | N/A |
| CRISPR targeting guide sequence KDSR g1: TGTGTGCAAACCAGAACAGG | Wang et al. (2014) | N/A |
| CRISPR targeting guide sequence KDSR g2: GGCAAACTTGGATGCAGAGT | Wang et al. (2014) | N/A |
| Recombinant DNA | ||
| lentiCRISPR v2 | Sanjana et al. (2014) | Addgene Plasmid #52961 |
| pLV-EF1a-IRES-Blast | Hayer et al. (2016) | Addgene Plasmid #85133 |
| PMD154 | Laboratory of Scot Wolfe (UMMS, USA) | N/A |
| Software and algorithms | ||
| Graphpad Prism Version 9.1.1 | GraphPad | https://www.graphpad.com/ |
| Adobe Illustrator Version 23.1.1 | Adobe | N/A |
| Microsoft Excel Version 16.16.5 | Microsoft | N/A |
| FIJI ImageJ Version 2.0.0-rc-69/1.52p | Schindelin et al. (2012) | https://fiji.sc/ |
| BioRender | N/A | https://biorender.com/ |
| The Gene Ontology Resource | Ashburner et al. (2000) | http://geneontology.org/ |
| PANTHER Version 16.0 | Mi et al. (2019) | http://www.pantherdb.org/ |
| Java Treeview Version 1.1.6r2 | N/A | http://jtreeview.sourceforge.net/ |
| GEPIA 2 | Tang et al. (2019) | http://gepia2.cancer-pku.cn/#index |
| DTX880 Multimode Detector and Software | Beckman Coulter | N/A |
| Zen 2012 SP1 (black edition) Version 8.1 | Zeiss | N/A |
| FlowJo Version 10 | FlowJo, BD Biosciences | https://www.flowjo.com/solutions/flowjo/downloads |
| Sciex Multiquant | Sciex | https://sciex.com/products/software/ultiquanta-software |
| Sciex Analyst | Sciex | https://sciex.com/products/software/analyst-software |
| LipidSearch Sofware | Thermofisher Scientific | Cat#OPTON-30879 |
| Lipid Data Analyzer | Hartler et al. (2020) | N/A |
| Other | ||
| Thermo Vanquish UPLC | Thermofisher Scientific | N/A |
| Q Exactive Mass Spectrometer | Thermofisher Scientific | N/A |
| Acquity UPLC System | Waters | N/A |
| QTRAP 6500 LC-MS/MS System | Sciex | https://sciex.com/products/mass-spectrometers/qtrap-systems/qtrap-6500-system |