. 2022 Sep 8;11:e78074. doi: 10.7554/eLife.78074

Figure 2. Distinct tuft cell populations derived from Krt5+ cells arise in the lung following influenza clearance.

(A) Single-cell RNA-Seq UMAP clustering of sorted tuft cells (Epcam+Trpm5-GFP+) from Trpm5-GFP reporter mice at day 28 post influenza. (B) Heatmap comparing the gene expression profile between the tuft cell clusters identified in A. (C) Trpm5 expression highlighted in all analyzed cells, confirming all analyzed cells are tuft cells and not contaminating cells. (D) Marker gene expression highlighted within the different tuft cell UMAP clusters. (E) Representative immunostaining of tamoxifen-treated Krt5-CreER tdTomato lungs 25 days post influenza. Nuclear stain (DAPI) in blue, DCKL1 in green, Krt5-CreER tdTomato lineage label in red. Lineage traced tuft cells (tdTomato+DCKL1+) appear yellow. (F) Representative immunostaining for Gnb3 (Tuft-1 signature) in the Trpm5-GFP reporter mice 35 days post influenza. Nuclear stain in blue, Gnb3+ cells in red, Trpm5-GFP+ cells in green, and double positive cells (Gnb3+ and Trpm5+) in yellow. Single color insets shown (i, ii).

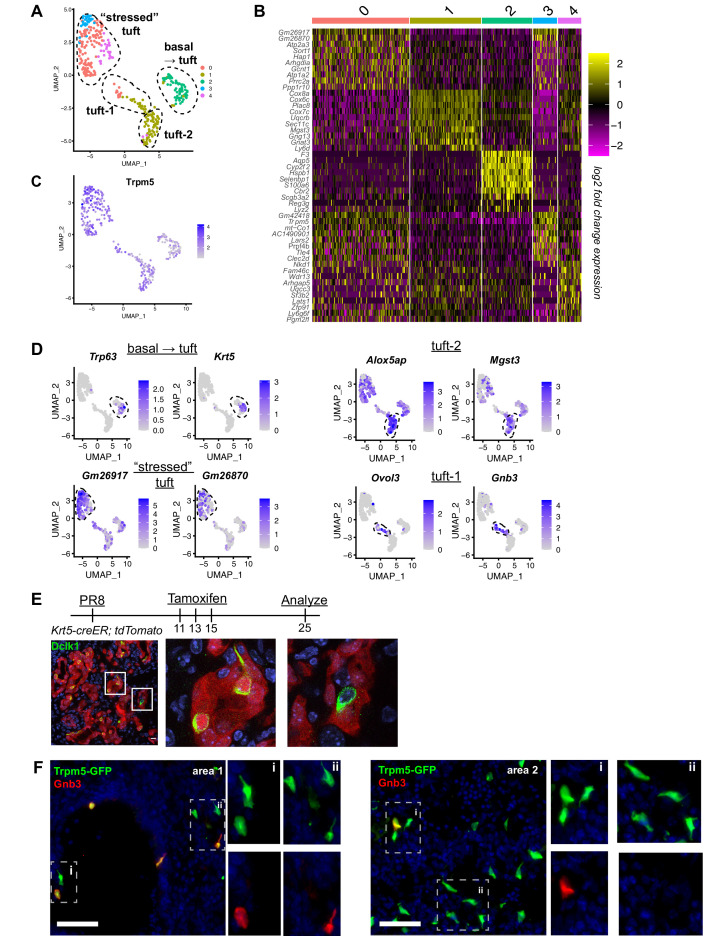
Figure 2.

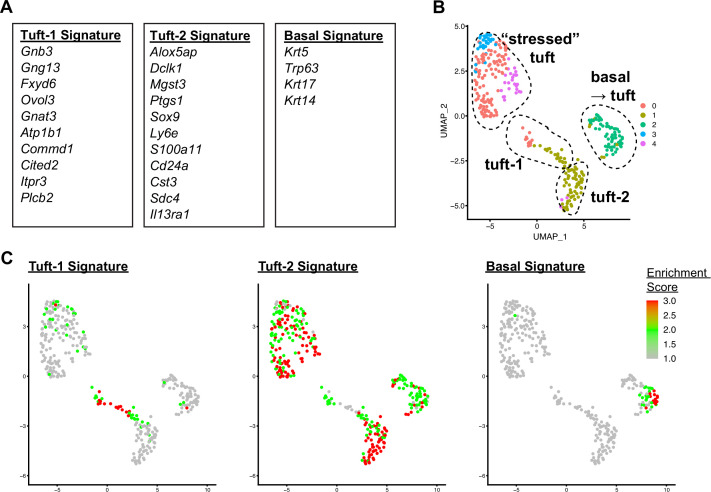
Figure 2—figure supplement 1. Further analysis of the different tuft cell clusters utilizing previously identified transcriptomic signatures.

Figure 2—figure supplement 1.

(A) Published gene set associated with Tuft-1, Tuft-2, and basal cell signatures. (B) UMAP clustering as in Figure 2A, shown again for reference/comparison for tuft cell signature module enrichment in C. (C) Enrichment score for each gene module from A is highlighted on the UMAP tuft cell clusters identified in the single-cell RNA sequencing (RNA-Seq) from the Trpm5-GFP reporter mice at day 28 post influenza (Figure 2).
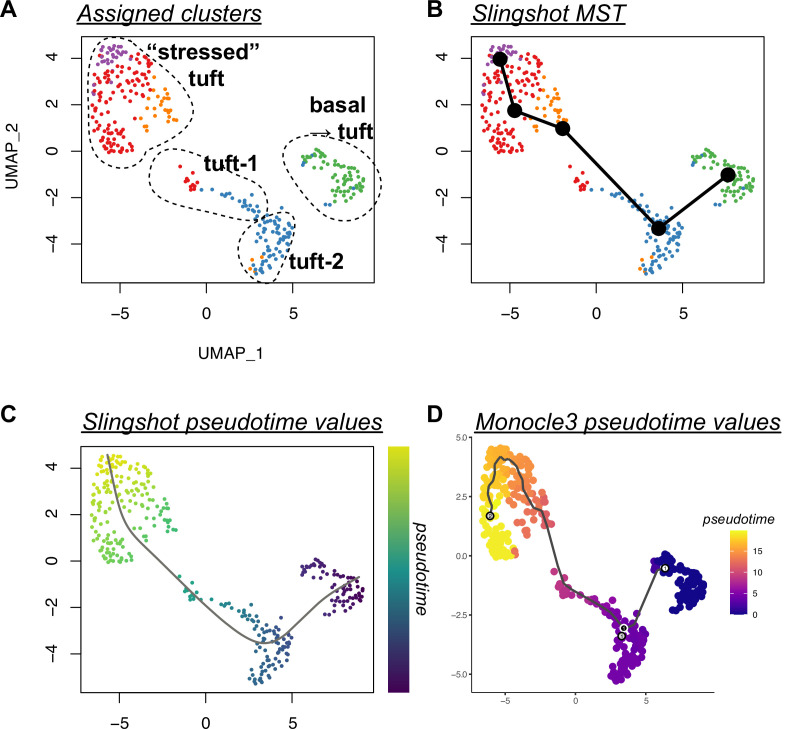
Figure 2—figure supplement 2. Trajectory analysis of influenza A virus (IAV)-induced lung tuft cells from single-cell data.

Figure 2—figure supplement 2.

(A) Clusters assigned to UMAP of single-cell RNA sequencing of post-IAV lung tuft cells (also see Figure 2). (B) Slingshot minimum spanning tree (MST) trajectory. (C) Slingshot trajectory with pseudotime color bar, demonstrating the trajectory begins at the ‘basal ->tuft’ cluster and ends at the ‘stressed’ tuft cluster. (D) Trajectory analysis using Monocle3 with pseudotime color bar.