

Abstract
To describe the safety rules of various industrial process data and explore the characteristics of unsafe behaviour, the association rules of unsafe behaviour based on pan-scene were proposed in this study. First, based on the scene data theory, unsafe behaviour was described by eight dimensions (time, location, behavioural individual, unsafe action, behavioural attribute, behavioural trace, professional category and risk level) to achieve scene data description and structural transformation. Second, the Apriori algorithm was used to explore the distribution rules of unsafe behaviour dimensions and the interaction between different dimensions from two perspectives: single-dimensional statistical analysis and multidimensional association rule mining. Finally, through SPSS Modeler software, an empirical analysis of pan-scene data for subway construction was conducted, and the association rules between type of work, construction stage, working time and unsafe action were identified. Some strong association rules were produced by the association analysis. For example, during the 13:00–17:00 of the excavation floor stage, the most frequent unsafe action of machine operators is the irregular binding of lifting objects. This result could explain why some unsafe actions are prone to occur in different construction stages and working times for workers of different types, which can be controlled and managed in a targeted manner, thus reducing the possibility of accidents.
Keywords: Pan-scene data, Unsafe behaviour, Data mining, Association rules, Apriori algorithm
Introduction
In recent years, the safety and health of workplaces have gradually become the focus in the development of industry [1–3]. The reliability of humans introduces considerable uncertainty into complex human–machine–environment systems. Approximately 80% of accidents have been attributed to individuals’ unsafe behaviour [4]. Reducing the number of accidents and improving safety performance can only be achieved by systematically focusing on unsafe behaviour [5]. For various industrial processes, there are differences in the type and frequency of unsafe behaviour at different stages and locations. Therefore, looking for association rules can help reduce unsafe behaviour and the accident rate, which is critical to ensure the safety of process industries.
Current research on behaviour has focused on a theoretical and methodological perspective. Some studies used the behaviour-based safety to observe, analyse and correct workers' unsafe behaviour [6]. Other studies analysed the cognitive mechanism of workers' unsafe behaviour from the planned behaviour theory [7]. Methods such as system dynamics and neural networks have also been used by scholars to study behavioural safety [8, 9]. These theories and methods were proposed based on aspects of the behaviour generation mechanism, development mode and change strategy, and follow a top-down and theory-driven approach to research.
At present, the wave of information development centred on the internet has penetrated various fields of economic society, and the amount of data in all walks of life are increasing [10]. Data mining, as a new research field, is an emerging interdisciplinary subject that connects statistics, database technology, machine learning, pattern recognition, data visualisation and high-performance parallel computing [11]. Thus, bottom-up data-driven research has become more popular, among which association rules can be considered. Particularly, in the fight against the novel coronavirus, the population migration in key epidemic areas can be effectively described by mining and analysing big data describing traffic, and the activity range of imported infections can be identified. However, many enterprises have rich data that describe the use and mining of work safety but also have a low utilisation rate. From the perspective of unsafe behaviour data mining, abundant data can describe the relationship between unsafe behaviour and people, machines and the environment, but the utilisation rate is only 5% to 10%. The utilisation of data mining methods restricts the effect of controlling human risk and preventing accidents based on the rule of unsafe behaviour.
With the continuous expansion of the data volume of safety information, analysing and mining the hidden value of the data have become increasingly important in behavioural research. In the field of computer vision, images are used as similarity and vivid descriptions of the objective object in a specific scene, and the scene refers to the sum of the relationship between people and the surrounding scenery [12]. For on-site safety management, the working state is shown as an image scene. It has become the subject for many scholars to improve safety management by analysing scene data, mining behaviour rules and forming effective management strategies. Guo et al. introduced big data-based behavioural observation to develop a personalised behavioural safety training system by identifying workers’ unsafe behaviour in subway construction picture scenes [13]. Xu and Luo collected more than 60,000 photographs of hidden dangers, formed over 8000 construction behaviour scene data and then sorted them into safety training materials [14]. Yin et al. combined behaviour safety model with gas explosion accident reports as a way of analysing the underlying causes of accidents [15]. Kumar and Toshniwal proposed a framework of data mining for road traffic accidents in the analysis and research of road traffic accidents [16]. The inherent laws and hidden characteristics of road traffic accidents were analysed by cluster analysis and other data processing methods. Tong et al. developed a job burnout scale based on the Maslach Burnout Inventory-General Survey and employed structural equation model to investigate the influencing factors of unsafe behaviour for 238 front-line oil workers [17]. However, there is still a lot of room for development in the study of unsafe behaviour characteristics based on scene data.
To identify safety rules in various industrial process databases and explore the characteristics of unsafe behaviour, the associations of unsafe behaviour based on pan-scene were described in this study. First, this study considers the inherent characteristics of workers’ unsafe behaviour via data mining to describe the dimensional information of time, location, behavioural individual, unsafe action, behavioural attribute, behavioural trace, professional category and risk level. Then, association rules are used to mine and analyse the internal relations between each dimension. Finally, considering the unsafe behaviour of subway construction workers as an example, scene data are described and structurally transformed, and the characteristics of unsafe behaviour are obtained via correlation analysis. The results of this study provide references for mining unsafe behaviour data that are more comprehensive and systematically derived, and fill the gap in the literature regarding use and excavate scene data.
Theoretical framework
Pan-scene data theory
Scene theory was developed under the social background of post-industrial society. Silver et al. considered scene theory as a new paradigm of urban research, expanding urban space research from natural and social attributes into consumption practice [18]. In 2014, Scoble and Israe proposed the concept of scenes and believed that the five technology trends of the scene era are wearable devices, big data, sensors, social media and positioning systems [19]. They also predicted that the internet would enter the scene era in the next 25 years. Subsequently, the concept of scenes was widely used in software engineering, media, marketing, electricity and computer vision.
Connotation of pan-scene data
Scene data are the core of scene theory. Scenes have specific statistical boundaries and dimensions; thus, scene data can be understood as statistical data with specific statistical boundaries and dimensions. The term 'dimension' in this paper differs significantly from the field of mathematics and physics. It does not refer to the number of independent parameters or space–time coordinates, but rather to the starting point, perspective or important elements of the description or analysis of an event or problem. Simply speaking, the scene can be described by when, where, who and what; in other words, someone does something at a certain time and place. By considering unsafe behaviour data with scene-based thinking, statistical data boundaries can be clarified, thus enabling the standardisation of unsafe behaviour data. In the field of safety management, some scholars have analysed unsafe behaviours based on scene data. Wang et al. proposed the concept of emergency scene and realised structural transformation of subway accident data in the study of traffic dispatcher error behaviour [20]. Tong et al. proposed a theoretical framework for analysis of miners' unsafe behaviour characteristics based on pan-scene data [21].
The word “pan” is the transliteration of the English prefix pan-, which means the entire region or the entire range or category. Pan-scene data can be understood to describe unsafe behaviour data from multiple dimensions. By acquiring richer pan-scene data on unsafe behaviour, the value of the data can be explored and expanded, and monitoring models can be built to predict the trend of unsafe behaviour. The theory of pan-scene data provides a theoretical basis for comprehensive analysis and deep mining of work safety data.
Pan-scene data can widely mine the internal information of scene data. Based on the four scene description dimensions of time, place, character and action, pan-scene data are a multidimensional description of a scene. Whether hazard photographs, inspection records or accident investigation reports, the hidden data are mostly in the form of text and pictures, rather than structured data. Therefore, it is important to explore the unified data structured expression of unsafe behaviour for the visualisation, normalisation, and quantification of scene data. Structured descriptions of unsafe behaviour pan-scene data need to meet the requirement of describing unsafe behaviour from multiple dimensions.
The unsafe behaviour pan-scene data structured description should reflect the behaviour itself as comprehensively as possible. Based on Lasswell's 5W1H analysis method [22], this study explores the multidimensional description of unsafe behaviour. It means reason (Why), object (What), place (Where), time (When), person (Who) and method (How), which specifically means a scientific and detailed analysis and comprehensive description of the event. Lots of violation photos, safety inspection records and accident investigation reports were collected via web crawler for research and analysis. At the same time, the research team followed the safety managers of the subway construction project for daily safety inspection and communicated with on-site safety managers and workers. Combining with related literature to study and summarise, after continuous experimentation and long-term practice [23, 24], this paper finally determines the description dimension of unsafe behaviour from the characteristics of unsafe behaviour itself. Consequently, in this study, the pan-scene data on unsafe behaviour were described by eight dimensions: time, location, behavioural individual, unsafe action, behavioural attribute, behavioural trace, professional category and risk level.
Source of pan-scene data
The occurrence of unsafe behaviour is shown as a scene. According to the method of data acquisition, pan-scene data sources can be divided into static and dynamic data. Static data include hazard photos, inspection records, accident reports, law enforcement records, etc. Dynamic data refer to accident videos, monitoring records, sensors and various terminal upload data collected through the Internet of Things.
The most easily accessible hazard photographs and video surveillance in daily inspection are real scenes. This information describes first-hand accounts in pan-scene data of unsafe behaviour, recording the occurrence time of the event, the behaviour process of the subject and the state of things so that the event can be replayed accurately. Correspondingly, accident reports issued by the official authority are abstract scenes, which record the brief process of the accident, direct and indirect reasons, corrective and preventive measures, and the results of treatment. These are important sources of pan-scene data on unsafe behaviour, including unsafe behaviour of people and unsafe conditions of objects.
Description of pan-scene data
The structured description of unsafe behaviour in pan-scene data should describe the behaviour itself as comprehensively as possible. The pan-scene data of unsafe behaviour are divided into eight dimensions in this study. The dimension division of unsafe behaviour pan-scene data is shown in Table 1.
Table 1.
Dimension division of unsafe behaviour pan-scene data
| Dimension | Abbreviation | Explanation |
|---|---|---|
| Time | T | The time when the unsafe behaviour occurs |
| Location | L | The location where unsafe behaviour occurs |
| Behavioural individual | BI | The individual who commits unsafe behaviour |
| Unsafe action | UA | The specific unsafe behaviour |
| Behavioural attribute | BA | The type of unsafe behaviour |
| Behavioural trace | BT | The traceability of unsafe behaviour |
| Professional category | PC | Industry characteristics and production stages of unsafe behaviour |
| Risk level | RL | The severity of unsafe behaviour |
Time (T) is the time when an unsafe behaviour occurs, and according to different scene characteristics, it can be divided into quarters, months, days, hours and shifts. Location (L) is the specific location where unsafe behaviour occurs. Similarly, according to different scene characteristics, the specific location is also different. Behavioural individual (BI) is the individual who commits unsafe action, usually on-site workers and managers. When acquiring pan-scene data, different individual attributes can be set, such as age, length of service and type of work. Unsafe action (UA) is a specific unsafe behaviour, and the behavioural attribute (BA) describes the type of unsafe behaviour. Combined with relevant research, BA is divided into three parts: violate operation, violate action and non-violate unsafe action [25]. Behavioural trace (BT) indicates the traceability of unsafe behaviour. Based on behavioural traces, behaviour can be divided into traced unsafe action and non-traced unsafe action. The professional category (PC) represents industry characteristics and production stages of unsafe behaviour. Risk level (RL) reflects the severity of unsafe behaviour. Based on the direct or indirect potential severity of the consequences of unsafe behaviour, RL is divided into five levels: serious risk, major risk, medium risk, general risk and low risk.
Association rules method
Data mining was first proposed at the Conference on Knowledge Discovery and Data Mining and was defined as the process of extracting implicit, valid, novel, potentially useful and ultimately understandable patterns from large, incomplete, noisy data [26]. Association rules, as one of the core technologies of data mining, describe the interdependence and correlation between things.
Theory and important parameters
Agrawal first proposed association rule analysis to mine item sets in customer transaction databases [27]. The core of association rule analysis is to explore the correlation relation with causal direction in large datasets. Thus, the sets of attribute values, which frequently appeared in dataset recognition, are also referred to as frequent item sets. Then, these frequent item sets are used to create a process that describes relevant association rules.
Association rules provide information in the form of "if–then" statements. These rules are calculated from the data, and unlike the if–then rules of logic, association rules are probabilistic in nature. An association rule is an expression of “X → Y”, wherein both X and Y are item sets contained in the database. X is the left-hand side (LHS), and Y is the right-hand side (RHS). In addition to the antecedent and the consequent, an association rule has three parameters (Support, Confidence, and Lift) that express the degree of uncertainty about the rule.
(1) Support is the probability that both X and Y appear in the database, which is expressed as a percentage of the total number of records and describes the strength of association rules. The minimum Support (Supmin) is the minimum Support threshold of the item set:
| 1 |
(2) Confidence is the conditional probability of the occurrence of Y subsequent to X and represents the probability that a successor Y can be derived from the association rule "X → Y" with the lead item X. During association rule mining, only association rules with high Support and Confidence can be considered valuable association rules, and the minimum confidence is denoted Confmin. When association rule A⇒B satisfies Support ≥ Supmin and Confidence ≥ Confmin, A⇒B is called the strong association rule:
| 2 |
(3) Lift is the ratio of Confidence to expected Confidence and thus describes the ratio of the probability that Y appears in the occurrence of X to the probability that only Y appears. When Lift ≥ 1, the rule "X → Y" is defined as a strong rule. In contrast, when Lift ≤ 1, the probability of Y under the condition of X influence is smaller than the probability that only Y appears, and this association rule does not make any sense. When Lift = 1, X and Y are independent, and there is no relationship between them:
| 3 |
Empirical studies
The three most important fields of research that are related to association rule mining are statistics, machine learning and large databases. Association rule mining is most closely related to database research, as the object of association rule mining is databases, and database technology plays an important role in association rule mining research.
Association rules are one of the most frequently used and widely applied data mining techniques for extracting correlations between valuable data items from large amounts of data. In terms of commercial fraud, Melih and Cuneyt studied the identification of fraud detection in health insurance by data mining [28]. In the retail industry, Kaur and Kang used possible targeted marketing strategies by analysing purchasing behaviour patterns [29]. Kwang used association rule mining to study the commodity layout in retail and found an association between different commodities to arrange goods with high correlation [30]. In the medical field, Ibrahim et al. proposed a causal association rule discovery algorithm for drug–drug interaction problems [31]. Liang studied the application of data mining in customer value analysis of the automobile industry, which can be used for potential customer analysis and existing customer value assessment [32]. In psychological research, Perwez et al. used association rules to predict the link between human personality and behaviour [33]. In the traffic safety field, Das et al. identified the patterns of key factors involving fatal pedestrian crashes at intersections using association rules [34].
Apriori algorithm
The most classic algorithm of association rule mining is the Apriori algorithm, which is based on the breadth-first search idea. The influence of the Apriori algorithm is profound, and many variant mining algorithms are based on its optimisation. Its basic principle is to obtain all frequent item sets in the data set by an iterative algorithm and then construct association rules according to their Confidence.
The Apriori algorithm is suitable for mining Boolean association rules and is divided into three steps. The first step is to find all the item sets whose Support is greater than the minimum Support, which form the frequent item sets. The second step is to find strong rules from frequent itemsets, and the items that generate strong rules satisfy both Supmin and Confmin. The third step is to verify the validity of strong association rules by Lift (i.e. Lift (X → Y) > 1); otherwise, the rule is identified as an invalid strong association rule.
Empirical analysis
Subway construction runs through the urban underground and is typically performed in narrow sites and complex environments. The high speed and intensity of construction tasks can lead to accidents, and the unsafe behaviour of workers is an important factor in causing accidents. This paper investigates the B subway construction project of a construction company in Beijing as a case study to verify the effectiveness of the research on unsafe behaviour association rules based on pan-scene data.
The research team was stationed in project B for 10 months, and field research, stuff interviews, data collection and meeting discussion were performed to fully understand the project B. The research team followed the project safety managers for daily safety inspection and took photographs and videos using mobile phones, cameras, video recorders and other equipment. In particular, over 1,000 photographs of on-site hazards and daily safety inspections were eventually collected as original data. The analysis of association rules based on pan-scene data focuses on the distribution of unsafe behaviour and the interaction between various dimensions to clarify the interaction relationship. Considering the unsafe behaviour of subway workers as an example, the specific process of the analysis on association rules of unsafe behaviour based on pan-scene data is shown in Fig. 1.
Fig. 1.

Process of analysing the association rules of unsafe behaviour based on pan-scene data
Sample analysis of scene data
Structured processing of original scene data
Hazard photographs and safety inspection records were collected as original scene data. The dimensional information contained in each photo and record was extracted by determining the unsafe behaviour reflected in the photographs and records. During structured processing of the original scene data, the eight dimensions could not be fully described due to the differences in the description of photos and records by the safety manager. Almost all of them do not reflect the four dimensions of location, behavioural attribute, behavioural trace, and risk level. Therefore, data collation was therefore a difficult task. The original sample can largely accurate in reflecting the specific unsafe action, type of work, occurrence time and construction stage. After a long period of fieldwork and extensive data retrieval, only four key dimensions—time, behavioural individual, unsafe action and professional category—were selected for correlation analysis in this paper. After structured processing of original scene data, the description of unsafe behaviour eventually became more systematic and standardised. To facilitate subsequent data analysis and mining, each dimension is encoded by quantitative methods, as shown in Table 2.
Table 2.
Coding processing of T, BI and PC dimensions
| Dimension | Coded representation |
|---|---|
| T | T1 08:00–12:00 |
| T2 13:00–17:00 | |
| T3 18:00–22:00 | |
| T4 00:00–06:00 | |
| BI | BI1 General worker |
| BI2 Scaffolder | |
| BI3 Welder | |
| BI4 Electrician | |
| BI5 Bar-setter | |
| BI6 Form fixer | |
| BI7 Mechanical operator | |
| PC | PC1 Enclosure structure |
| PC2 Excavation precipitation | |
| PC3 Erection support | |
| PC4 Excavation floor | |
| PC5 Floor pouring | |
| PC6 Middle plate pouring | |
| PC7 Roof pouring | |
| PC8 Support removal |
The relevant Chinese laws govern the timing of building construction. In an urban area where noise-sensitive structures are concentrated, construction operations that produce environmental noise pollution are forbidden at night, with the exception of rush repairs, rescue operations or continued operations required by production techniques or by special needs. Combined with the real construction of project B, shift is set as the T dimension in the structured processing of scene data, which is specifically divided into four shift time periods.
To facilitate statistics and analysis and determine the key positions that are prone to unsafe behaviour, only the type of work is set as the attribute of the BI dimension. Combined with the real situation of subway construction site, BI can be divided into general worker, scaffolder, welders, electrician, bar setter, form fixer and mechanical operator.
PC describes industry characteristics and production stages of unsafe behaviour. Project B used the open-cut construction method, and the enclosure structure was constructed using drilled grouting pile, inter-pile net spray and prestressed steel support technology. The primary project of open-cut stations is divided into eight primary construction stages: enclosure structure, excavation precipitation, erection support, excavation floor, floor pouring, middle plate pouring, roof pouring and support removal.
The UA dimension describes the specific unsafe behaviour that may lead to accidents, casualties and environmental disruption. From the perspective of language expression, whether it is photograph description or inspection records, there must be some differences in the language description of the same unsafe action. Therefore, it is necessary to unify and simplify the description of unsafe actions and extract general statements from complex and lengthy action descriptions. After structured processing of the original scene data, a total of 358 pieces of structured scene data were obtained. Through unification and simplification, 65 standard descriptions of unsafe action were sorted out, as shown in Table 3.
Table 3.
Standardised unsafe actions in subway construction
| Code of unsafe action | Unsafe actions | Number of unsafe actions |
|---|---|---|
| UA1 | Insufficient safety warning signs | 2 |
| UA2 | Irregular binding of lifting objects | 12 |
| UA3 | Improper parking of large full-load platform vehicle | 1 |
| UA4 | Soldering terminal exposed in welding machine | 1 |
| UA5 | Welder terminal without protective cover | 2 |
| UA6 | Welding rod not removed after welding machine used | 2 |
| UA7 | No secondary no-load protector for welding machine | 1 |
| UA8 | Illegal use of socket in welding | 2 |
| UA9 | More damaged cable joints | 3 |
| UA10 | Cable is not fixed overhead | 7 |
| UA11 | Overlapping objects on cable lines | 5 |
| UA12 | Irregular arrangement of lifting objects | 12 |
| UA13 | Lifting operation is still performed in poor weather | 4 |
| UA14 | Nonstandard wearing of protective articles | 39 |
| UA15 | No protection for platforms work at heights | 10 |
| UA16 | Workers take a shortcut during lifting operations | 8 |
| UA17 | Fire welding bucket in welding operations | 1 |
| UA18 | Mechanical equipment without protective devices | 18 |
| UA19 | Foundation pit over-break | 1 |
| UA20 | Excavation of foundation pit is too steep | 1 |
| UA21 | Irregular tie between frame and building structure | 10 |
| UA22 | Inspection and maintenance are not timely | 6 |
| UA23 | Scaffold operating platform not fully fixed | 3 |
| UA24 | Standing water on the scaffolding floor | 1 |
| UA25 | Scaffold bottom bar is not connected | 3 |
| UA26 | Upright stanchions of scaffold do not meet the specification | 3 |
| UA27 | Upright stanchions of scaffold hang in the air | 1 |
| UA28 | Sweeping rod of scaffold is not connected | 4 |
| UA29 | External scaffold bolts are not tightened | 4 |
| UA30 | Crossing the armrest | 2 |
| UA31 | Crossing the guardrail | 4 |
| UA32 | Template erection is uneven and irregular | 7 |
| UA33 | Inspection record of distribution box is incomplete | 5 |
| UA34 | Illegal socket in distribution box | 7 |
| UA35 | Illegal wiring of distribution box | 10 |
| UA36 | Distribution box is not grounded | 4 |
| UA37 | Distribution box without responsibility card | 6 |
| UA38 | Damage of distribution box body | 3 |
| UA39 | Partial shedding during spraying operation | 2 |
| UA40 | Operate when the crane is unstable | 9 |
| UA41 | Crane overloading | 8 |
| UA42 | Cleaning the working concrete mixer | 1 |
| UA43 | Use equipment without acceptance | 8 |
| UA44 | Illegal accumulation of earthwork | 1 |
| UA45 | Illegal accumulation of clutter | 9 |
| UA46 | Illegal reinforcement welding operation | 1 |
| UA47 | Illegal entry into dangerous areas | 17 |
| UA48 | Leakage protector not installed or malfunction | 4 |
| UA49 | No wall stabilisation measures | 2 |
| UA50 | Work without valid certificates | 10 |
| UA51 | Climbing without permission | 4 |
| UA52 | No safety helmet | 10 |
| UA53 | No fire extinguisher | 2 |
| UA54 | Operate without signal operator's command | 7 |
| UA55 | Oxygen cylinders are placed upside down | 1 |
| UA56 | Insufficient spacing between oxygen and acetylene cylinders | 1 |
| UA57 | One gate for multiple machines | 6 |
| UA58 | Acetylene bottle without backfire prevention device | 1 |
| UA59 | Pressure gauge of acetylene bottle is damaged | 2 |
| UA60 | Relying on the guardrail | 4 |
| UA61 | Sleep in the construction area | 6 |
| UA62 | Smoke in the construction area | 3 |
| UA63 | Standing on a concrete mixer truck at work | 2 |
| UA64 | Loaders carry people illegally | 3 |
| UA65 | Unqualified protective measures for operating platform | 19 |
Establishment of pan-scene dataset
To analyse the data accurately and mitigate various issues, this paper only selects four key dimensions for correlation analysis. The original samples can accurately reflect the specific unsafe action, work type, occurrence time, and construction stage. In turn, the dimension information of {T, BI, PC, UA} is extracted to construct the pan-scene dataset. Partial pan-scene datasets are shown in Table 4.
Table 4.
Partial pan-scene datasets
| Number | Pan-scene attributes | |||
|---|---|---|---|---|
| T | BI | PC | UA | |
| 001 | 13:00–17:00 | Scaffolder | Middle plate pouring | Nonstandard wearing of protective articles |
| T2 | BI2 | PC6 | UA14 | |
| 002 | 13:00–17:00 | Electrician | Erection support | One gate for multiple machines |
| T2 | BI4 | PC3 | UA57 | |
| 003 | 08:00–12:00 | Form fixer | Excavation floor | Illegal accumulation of clutter |
| T1 | BI6 | PC4 | UA45 | |
| 004 | 00:00–06:00 | Mechanical operator | Excavation precipitation | Operate without signal operator’s command |
| T4 | BI7 | PC2 | UA54 | |
| 005 | 18:00–22:00 | Welder | Enclosure structure | Welder terminal without protective cover |
| T3 | BI3 | PC1 | UA5 | |
Single-dimensional statistical analysis of pan-scene data
T-dimension analysis
The distribution of unsafe behaviour of subway construction workers in different shifts was analysed. The visualisation chart of the T dimension is shown in Fig. 2.
Fig. 2.
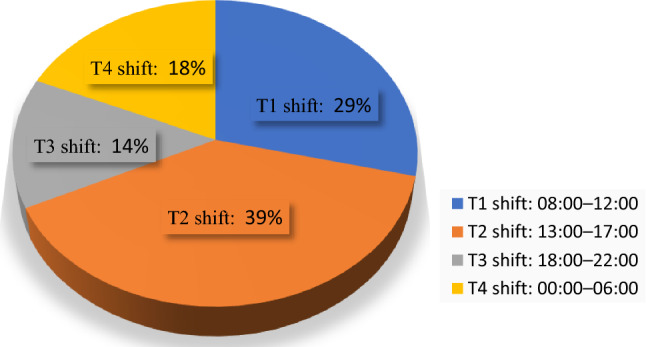
Number of unsafe actions per shift
Results show that the number of unsafe actions in the T2 shift is the largest. The temperature in the afternoon is relatively high and is a time when workers' intellectual, physical and emotional lows overlap. Brain function may be weakened, and the concentration may decrease, making accidents more likely. Next, the T1 shift reported the next highest number of unsafe actions. In the morning, when workers are just getting into the working state, there is a lot of crossover work and heavy workloads, which can easily lead to accidents. The T4 shift is a special situation that must catch up with the construction period but still accounts for 18% of unsafe actions. This result likely occurs because overtime work is too long and may lead to drowsiness and inattention, which can easily lead to confusion, operational errors and thus unsafe actions.
BI dimension analysis
Figure 3 shows the distribution of the number of unsafe behaviours in different types of work. Mechanical operators performed the most unsafe actions (82, 23%). Mechanical operators include crane drivers, excavator drivers and crane signal operators. Cranes are important and indispensable machines that are used frequently on construction sites. Common crane accidents include falling items, collapse, object strike, etc. Workers can only operate cranes after passing the training and examination and obtaining the operation certificate of special operation personnel. Electricians performed 68 unsafe actions (19% of the total). The equipment and wiring work involving temporary use of electricity at the construction site must be completed by electricians. The temporary electricity technologies used at construction sites are complex, and there are many details of using safe electricity. This fact can explain the number of unsafe behaviours performed by electricians.
Fig. 3.

Number of unsafe behaviour in different types of work
PC dimension analysis
The statistical analysis of the professional category dimension is the construction stage. Frequency statistics were performed according to the division of the construction stage in the scene data structure processing, as shown in Fig. 4.
Fig. 4.

Number of unsafe behaviours in different construction stages
As shown in Fig. 4, excavation floor has the largest number of unsafe actions. This stage is a foundation construction, which requires careful and detailed measurement to control the depth and location to avoid over-excavation and random excavation. The second highest number of unsafe actions occurred during erection support, which primarily uses scaffolding and formwork, and work at heights is the focus of prevention and control of unsafe behaviour. Enclosure structure and support removal involve multiple types of cross-operations, and general workers and mechanical operators have more behaviours to perform. The stage with the fewest unsafe actions is floor pouring.
UA dimension analysis
The 65 standard descriptions of unsafe action can be divided into seven categories: civilised construction, fire operation, work at heights, electrical operation, vehicle, machinery and lifting. In accordance with the Chinese National Standard “Classification of work at heights” (GB/T 3608–2008), “work at heights” is the work carried out at a height of 2 m or more from the datum plane for highness with the possibility of falling [35]. According to the types and quantities of unsafe actions involved, these categories are divided into three levels. The first level includes work at heights and electrical operation, and the numbers are 17 and 15, respectively. The second level includes civilised construction and fire operation, and the numbers are 11 and 9. The third level includes vehicle, machinery and lifting, all of which are less than 6.
Multidimensional interactive analysis of association rules
Multidimensional interactive content
The interactive analysis of different dimensions of pan-scene data aims to explore the deep regularity of unsafe behaviour to obtain the internal characteristics of unsafe behaviour and improve safety management efficiency. Theoretically, any two or more dimensions can be analysed. Based on the dimension information of {T, BI, PC, UA} extracted to construct the pan-scene dataset, UA is considered to be the core to explore the real significance of the interaction between time, individual behaviour and professional category. The interactive contents of multiple dimensions are shown in Table 5.
Table 5.
Interactive analysis on different variables
| Interaction dimension | Explanation | Practical significance |
|---|---|---|
| T → UA | What type of unsafe actions are most likely to occur on different shifts? | Identify unsafe actions that can occur easily in different shifts, and then strengthen the safety inspection of this shift |
| BI → UA | What type of unsafe actions are most likely to occur on different types of work? | Identify unsafe actions that can occur easily in different types of work, and then strengthen the attention and management of this type of work |
| PC → UA | What type of unsafe actions are most likely to occur on different construction stages? | Identify unsafe actions that can occur easily in different construction stages, and then strengthen the safety inspection of the construction stage |
| T, BI → UA | What type of unsafe actions are most likely to occur for different types of work on different shifts? | Identify unsafe actions that can occur easily, and then strengthen the safety inspection of this shift and type of work |
| T, PC → UA | What type of unsafe actions are most likely to occur on different shifts and construction stages? | Identify unsafe actions that can occur easily, and then strengthen the safety inspection of this shift and construction stage |
| BI, PC → UA | What type of unsafe actions are most likely to occur for different types of work on different construction stages? | Identify unsafe actions that can occur easily, and then strengthen the safety inspection of type of work and construction stage |
| T, BI, PC → UA | What type of unsafe actions are most likely to occur for different types of work on different shifts and construction stages? | Identify unsafe actions that can occur easily, and then strengthen the safety inspection of this shift, type of work and construction stage |
Two-dimensional interactive analysis
IBM SPSS Modeler 24.0 software was used for association rule mining and is a multialgorithm data mining tool that supports the entire data mining process from data acquisition, conversion, modelling, evaluation to final deployment [36, 37]. Using the trial-and-error method, the Supmin and the Confmin of association rules were set to 10%. The most representative behaviour individuals and unsafe actions were selected for interactive analysis to show the complete process of pan-scene data mining in detail. Using the Apriori algorithm, BI is set as the LHS, and UA is the RHS.
Construction of Boolean matrices
The Boolean matrix was developed using the information contained in the pan-scene data, as shown in Table 6. The row representation dimension in the matrix included BI {BI1, BI2…, BI7} and UA {UA1, UA2…, UA65}. The sequence number in the matrix is the real scene number, which describes the information of each pan-scene datapoint. The letter Y in the matrix indicates that the item appears, N indicates that the item does not appear, and items containing the number Y in each row indicate that they appear concurrently.
Table 6.
Interaction Boolean matrix between BI and UA
| Number | Behavioural Individual | Unsafe action | ||||
|---|---|---|---|---|---|---|
| BI1 | BI2 | … | UA1 | UA2 | … | |
| 1 | Y | N | N | Y | N | N |
| 2 | N | Y | N | N | Y | N |
| 3 | N | N | Y | N | N | Y |
| … | … | … | … | … | … | … |
Finally, a 358 × 72 Boolean matrix is formed, and the constructed Boolean matrix is imported into the software. Using the relational network model, the Support and Confident of unsafe action in different types of work are calculated, as shown in Table 7.
Table 7.
Association rule results of {BI→UA}
| Number | LHS | RHS | Support/% | Confident/% |
|---|---|---|---|---|
| 1 | BI7 | UA40 | 22.35 | 11.25 |
| 2 | BI7 | UA2 | 22.35 | 12.50 |
| 3 | BI7 | UA12 | 22.35 | 11.25 |
| 4 | BI7 | UA47 | 22.35 | 10.00 |
| 5 | BI4 | UA35 | 18.99 | 10.29 |
| 6 | BI6 | UA65 | 18.16 | 10.77 |
| 7 | BI6 | UA18 | 18.16 | 15.38 |
| 8 | BI2 | UA21 | 14.25 | 11.76 |
| 9 | BI2 | UA14 | 14.25 | 21.57 |
| 10 | BI1 | UA65 | 10.61 | 10.53 |
| 11 | BI1 | UA14 | 10.61 | 13.16 |
| 12 | BI5 | UA15 | 10.34 | 10.81 |
| 13 | BI5 | UA65 | 10.34 | 13.51 |
| 14 | BI5 | UA18 | 10.34 | 13.51 |
Output of relational network
The interactive relationship network of different types of work and unsafe actions can be output successively. The three types of work with abundant quantities and stronger relationships are selected to show their internal relationships, as shown in Fig. 5. The thickness of the line in the figure represents the strength of the correlation.
Fig. 5.

Interaction between mechanical operators, electricians, form fixers and unsafe actions
The line colour between BI7 and UA2, UA12, UA40 is the darkest, which shows that mechanical operators are prone to irregular binding of lifting objects, irregular arrangement of lifting objects and operation when the crane is unstable. The line colour between BI4 and UA35 is the darkest, which also shows that electricians have the most frequent occurrence of illegal wiring of distribution box. Similarly, there is a strong correlation between BI6 and UA18, and the most likely unsafe action of form fixers is mechanical equipment without protective devices.
Association rule mining
To obtain more valuable association rules, Supmin and Confmin were adjusted to 15%. Similarly, using the same method and steps, taking other dimensions as LSH and UA as RSH. After model construction and parameter setting, valid strong rules were identified. The results of the primary association rules are shown in Table 8.
Table 8.
Primary association rules in other dimensions
| Interaction Dimension | LHS | RHS | Support/% | Confident/% | Lift |
|---|---|---|---|---|---|
| BI → UA | BI6 | UA18 | 18.16 | 15.38 | 2.75 |
| BI2 | UA14 | 14.25 | 21.57 | 2.09 | |
| T → UA | T4 | UA14 | 21.23 | 17.11 | 1.66 |
Calculations yielded three association rules. For {BI6 → UA18}, the Lift of the association rule is 2.75, which is greater than 1; thus, this association rule is a valid strong rule and shows that the most likely unsafe action for form fixers is using mechanical equipment without protective devices. For {T4 → UA14}, the Lift of association rules is verified to be 1.66, which is greater than 1, indicating a valid strong rule. This result shows that the most likely unsafe action during 00:00–06:00 is nonstandard wearing of protective articles. There are no eligible {PC → UA} association rules, which indicates that the number and types of unsafe actions occurring in each construction stage are relatively balanced, and no certain unsafe action occurs in a certain construction stage.
Three-dimensional interaction analysis
Interaction analysis of BI, T and UA is used to explore which type of workers is most likely to perform unsafe actions in which construction stage. The main relationship rules with abundant quantity and stronger relationships are selected to highlight their internal relationship, as shown in Fig. 6. Based on the depth of the connections, there is a strong correlation between {BI6, T2}, {BI4, T2} and {BI7, T4}. This means that 13:00–17:00 is the time period when form fixers and electricians are prone to unsafe actions, which is explained by hot weather in the afternoon and the reduced strength and concentration of workers. Mechanical operators are prone to unsafe actions during 00:00–06:00.
Fig. 6.

Primary interactive relationship network of BI, T and UA
Similarly, using the same method and steps with {BI, T}, {BI, PC}, {PC, T} as LSH and UA as RSH, ten association rules are identified, as shown in Table 9. For {BI4, T1 → UA48}, the Lift of association rule is 14.92, indicating a valid strong rule. This shows that the most common unsafe action for electricians in 08:00–12:00 is that the leakage protector is not installed or faulty. The Lifts of association rules of {PC, T → UA} are all greater than 1, which indicate valid strong associations. Excavation floor is thus the stage with most frequent unsafe actions. The most likely unsafe actions corresponding to 08:00–12:00, 13:00–17:00, and 00:00–06:00 are irregular binding of lifting objects, mechanical equipment without protective devices and nonstandard wearing of protective articles, respectively. However, there is no valid association rule output about {BI, PC → UA} at 5% Confmin and 5% Supmin.
Table 9.
Primary association rules in other dimensions
| Interaction dimension | LHS | RHS | Support/% | Confident/% | Lift |
|---|---|---|---|---|---|
| BI, T → UA | BI4, T1 | UA48 | 5.03 | 16.67 | 14.92 |
| BI4, T1 | UA33 | 5.03 | 16.67 | 11.93 | |
| BI7, T4 | UA2 | 8.66 | 22.58 | 7.35 | |
| BI7, T2 | UA40 | 6.15 | 18.18 | 7.23 | |
| BI4, T2 | UA35 | 7.82 | 17.86 | 6.39 | |
| BI7, T2 | UA14 | 6.15 | 18.18 | 1.76 | |
| PC, T → UA | PC4, T4 | UA2 | 8.10 | 17.24 | 5.61 |
| PC4, T1 | UA18 | 6.42 | 17.39 | 3.11 | |
| PC4, T2 | UA14 | 8.10 | 20.69 | 2.00 |
Four-dimensional interaction analysis
The interaction analysis between BI, T, PC and UA also be explored, and the results of association rules are shown in Table 10. Relationship rules with abundant quantity and strong relationships were selected to show the internal relationships of BI, PC, T and UA. The interactive relationship network is shown in Fig. 7.
Table 10.
Primary association rules in other dimensions
| Interaction dimension | LHS | RHS | Support/% | Confident/% | Lift |
|---|---|---|---|---|---|
| BI, PC, T → UA | BI7, PC4, T4 | UA2 | 5.03 | 27.78 | 9.04 |
| BI6, PC3, T2 | UA18 | 5.03 | 16.67 | 2.98 |
Fig. 7.
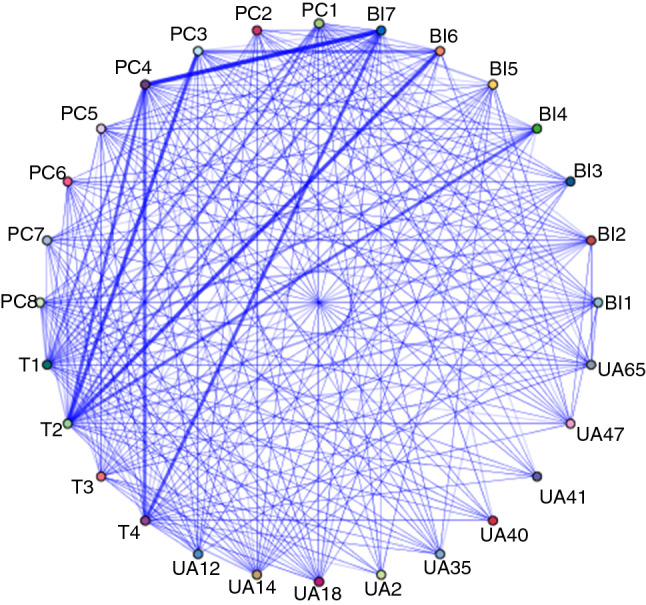
Interaction network of BI, PC, T and UA
The strong association rule {BI7, PC4, T4 → UA2} can be expressed as {mechanical operator, excavation floor, 00:00–06:00 → irregular binding of lifting objects}. In the construction stage of excavation floor, the most common unsafe action of the mechanical operator during 00:00–06:00 is the irregular binding of lifting objects. Large lifting equipment is frequently used during excavation floor stage, which in turn causes mechanical operators to work overtime at night. When working at night, mechanical operators become tired, which may lead to unsafe actions when bundling and lifting objects.
The strong association rule {BI6, PC3, T2 → UA18} can be expressed as {form fixer, erection support, 13:00–17:00 → mechanical equipment without protective devices}. During the construction of erection support, the unsafe action that is most likely to occur by form fixers during 13:00–17:00 is using mechanical equipment without protective devices. The construction stage of erection support is the primary working time of form fixers. In the afternoon, the weather is typically hot and muggy, which can affect the psychology and physiology of workers, resulting in unsafe actions. This situation may lead to form fixers relaxing their safety awareness in the use of mechanical equipment, which can lead to unsafe actions.
Results and discussion
The analysis of unsafe behaviour based on pan-scene data provides insight into the characteristics of subway construction workers from different perspectives and dimensions. Combined with the meaning of unsafe behaviour targeted intervention, research team proposed some targeted behaviour intervention measures [38].
Targeted intervention measures
The targeted intervention aims to clarify the intensity and direction of intervention; optimise the allocation of intervention resources; and improve the efficiency of behavioural safety management. Based on the characteristics of unsafe behaviour, targeted intervention measures in subway construction are described below.
T dimension perspective
The highest frequency of unsafe actions occurred during 13:00–17:00. The temperature is high in the afternoon, and workers are prone to accidents as their mental, physical and emotional abilities are at a low point of overlap. The second highest frequency of unsafe actions occurred during 08:00–12:00. In the morning, workers have just entered the working state, and there are multiple types of tasks being performed concurrently. The 00:00–06:00 shift includes late-night work. Due to lax management, workers' inattention and drowsiness create a period of frequently unsafe actions.
The targeted intervention measures in this category primarily include four aspects. First, safety managers should remind workers to carry out safe actions and supervise them intently. The characteristics of workers’ psychological activities and associated safety education must be considered so that workers perform safe actions more frequently. Second, when arranging work tasks, managers should not add tasks or shorten the duration at will and ignore safety issues in order to complete tasks quickly. Third, subway construction primarily occurs outdoors, and severe weather, such as snow, rain, fog, and scorching heat, can increase working difficulty. In poor weather, outdoor operations should be suspended in strict accordance with safety regulations. Fourth, night operations should have more inspections to highlight key locations and positions to ensure that problems are identified and dealt with in a timely manner.
BI dimension perspective
The analysis of the characteristics of individual behaviour found that more unsafe actions were performed by mechanical operators, electricians, form fixers and scaffolders. Mechanical operators performed the most unsafe actions, which may cause accidents such as falling items, collapsing structures, or object strikes. Temporary electricity at a construction site is complex, and the standard operation requirements for electricians are stricter. The number of unsafe actions by form fixer and scaffolder followed closely behind. Most of their tasks include work at heights, which are prone to falling and collapsing.
Targeted intervention measures for unsafe behaviour of individuals include the following. First, workers must be familiar with the operating procedures of the equipment and strictly abide by various safety operating procedures and labour disciplines. Second, it is necessary to strictly implement a certificate management system, perform targeted safety training regularly and continuously improve the professional and technical level of workers. Third, focus on mechanical operators and electricians, strengthen daily supervision and inspections and control unsafe behaviour to reduce accidents. Fourth, the form fixer and scaffolder must wear qualified safety helmets when entering the construction site, and personal labour protection equipment must also be used in a regulated manner.
PC dimension perspective
Excavation floor belongs to foundation construction and has the highest number of unsafe actions, followed by erection support. Work at heights is the focus of the prevention and control of unsafe behaviour at the erection support stage. Enclosure structure and support removal stages involve many cross-working tasks of multiple jobs, which require more attention.
The subway construction process contains a series of dangerous steps. First, the corresponding construction plan must be compiled, which must be reviewed and approved by relevant engineers and experts in strict accordance with established processes. Second, there are many types of mechanical equipment used in each stage of subway construction, and their operations are complex. It is thus necessary to improve the management system of mechanical equipment; clarify the scope and instructions for use; and ensure that daily equipment maintenance occurs. Third, a complete monitoring network must be used to record and track the entire construction process. Fourth, particularly during the excavation floor and erection support stages, key management steps must be performed, including more inspections and more frequent monitoring.
UA dimension perspective
By analysing the types of unsafe actions, there are 17 unsafe actions involving work at heights and 15 electrical operations. In terms of the number of occurrences of unsafe actions, nonstandard wearing of protective equipment was the most frequent, followed by unqualified protective measures for operating platform.
First, workers should correctly wear and use protective equipment to ensure personal safety and health. Then, the work platform must be set up firmly, and piled materials must not exceed the specification requirements. Protective railings and safety nets must set up as required, and safety signs must be suspended to ensure safe and reliable operation. Third, the protective devices of mechanical equipment should be simple in structure and reasonable in layout without sharp edges and lines. Also, education and training must be improved along with safety awareness, and the danger of unsafe locations should be emphasised. Workers should be supervised and urged to perform operations in strict accordance with established operating procedures.
Practical applications
This study contributes to an understanding of the occurrences of unsafe actions of subway construction workers. These findings can be used when implementing targeted behavioural interventions within organisations to increase their efficiency and effectiveness. Because the goal of an intervention is to reduce unsafe behaviour, the real effect must be described by changes in behaviour. According to the intervention measures submitted by the research team, the managers of project B implemented behavioural intervention at the construction site and observed the effect of the intervention.
The intervention measures were distilled into six intervention items: system construction, safety culture, safety management, safety awareness, safety education, and skill improvement. In order to test whether intervention items were statistically significant after the implementation of the intervention, paired sample t-test was conducted before and after the intervention. The research team randomly selected project managers, safety managers, team leaders, front-line employees to measure the unsafe behaviour interventions. Each targeted intervention was evaluated one by one, with 1 point for each achievement and 0 points for non-achievement. Then, the average score of each intervention item was obtained. The intervention measurement was divided into two periods, that is, after the determination of the intervention plan and six months after the implementation of the intervention. The test results are shown in Table 11.
Table 11.
Paired-sample t-test results for dimension
| Intervention item | Difference 95% confidence interval | t | Significance | |
|---|---|---|---|---|
| Lower limit | Upper limit | |||
| System construction | 0.2949116 | 0.5569402 | 6.683 | 0.000 |
| Safety culture | 0.5277749 | 0.7685214 | 11.068 | 0.000 |
| Safety management | 0.3521046 | 0.5367843 | 9.894 | 0.000 |
| Safety awareness | 0.4325945 | 0.6538252 | 10.094 | 0.000 |
| Safety education | 0.3639189 | 0.5990441 | 8.418 | 0.000 |
| Skill improvement | 0.4823698 | 0.7028154 | 11.051 | 0.000 |
The minimum value of the discriminant index t was 6.683. The larger the t value indicated that the greater difference between the mean values of the paired samples. And the significance was less than 0.05, indicating that the paired samples were significantly different. In other words, for the six intervention items, the mean differences before and after the intervention were all significant at the 95% confidence level. Therefore, it can be considered that the implementation of the intervention program can significantly improve unsafe behaviour. Results showed that the targeted interventions proposed by the research team can effectively promote safety management and reduce unsafe behaviour. In practice, the analysis results of unsafe behaviour characteristics can provide a scientific basis for the rational allocation of resources for safety management and accident prevention.
Standardise construction safety management and implement a safety responsibility system.
Due to the large number of people involved in subway construction, engineering accidents caused by poor safety awareness, poor technical education and other reasons are more common. The formulation and implementation of safety management systems form the basic premise for subway construction. System construction can clarify the responsibilities of personnel at all levels and form a reasonable responsibility sharing system, which is conducive to giving full play to the capabilities and enthusiasm of workers.
-
(2)
Improve the intensity of on-site construction inspections.
During on-site construction, safety managers must strengthen the supervision and inspection during excavation floor and erection support stages. By increasing the frequency of inspections for 00:00–6:00 and 13:00–17:00 shifts, the unsafe actions can be detected and corrected quickly. The necessary safety inspection and troubleshooting of mechanical equipment are performed to prevent accidents from the source.
-
(3)
Strengthen training to improve the professional quality of workers.
First, ideological safety education should be strengthened to lay the foundation for work safety. Safety awareness can be improved via education about safety guidelines, policies and laws. Second, safety knowledge education must be considered. Basic safety knowledge of subway construction technology, mechanical equipment, safety protection and civilised construction should be popularised for all workers. Third, safety skills education should be performed to ensure that workers are familiar with safety technology and operating procedures. Focusing on mechanical operators and electricians, it is necessary to obtain qualified certificates after professional training and regularly perform safety technical examinations.
Conclusions
Unsafe behaviour is the most direct cause of accidents, which not only brings serious health and safety hazards to workers themselves, but also brings safety threats to the development of enterprises and social stability. In response to the current problem of inadequate application and mining of unsafe act data, this study conducts structured processing of unsafe behaviour data based on the pan-scene data theory, so as to provide a reference for more comprehensive and systematic mining of unsafe behaviour data information. Association rule analysis is used to describe the characteristics of unsafe behaviour, and the strong association rules between the type of work, time, construction stage and unsafe action in subway construction are constructed. This method can be used to explore the unsafe actions of subway construction workers and lays the foundation for discovering the inherent essence of unsafe behaviour.
This study makes the following contributions. (1) Based on pan-scene data theory, standardised description and structural transformation of unsafe behaviour are achieved. The unsafe behaviour based on pan-scene data was described by eight dimensions: time, location, behavioural individual, unsafe action, behavioural attribute, behavioural trace, professional category and risk level. (2) This study introduced data mining technology in methodology and described the core interaction relationship of unsafe behaviour through association rule analysis. These results confirmed the applicability of association rule analysis in behavioural safety research, which provides a reference for the application of the data mining method in future research. (3) Based on the pan-scene dataset, the analysis method of unsafe behaviour characteristics is constructed. The distribution differences of a specific dimension and the interaction between different dimensions were explored from two aspects: single-dimensional statistical analysis and multi-dimensional association rule mining.
In addition, this study realises the structural transformation of data based on the theory of pan-scene data and introduces the analysis method of unsafe behaviour characteristics into the field of subway construction. Although the data were collected from a subway construction project in Beijing, the method also has reference value for the analysis of unsafe behaviour in other construction industries and even other industrial processes.
However, there are some limitations in this study. (1) As a data mining method, association rule analysis shows its advantages in large databases. Nevertheless, the database used is not sufficiently large in this study. Thus, the amount of data must be supplemented in future studies, and sufficient data can further reflect the characteristics of unsafe behaviour. (2) The Apriori algorithm was chosen for association rule analysis in this study, but the algorithm is continually improved. Therefore, more advanced algorithms of data mining should be considered to achieve more targeted and valuable rules. (3) The structured process of scene data from hazard photos and inspection records is somewhat uncertain, because the analysis, transformation and representation of data mainly rely on manual operation, which is inefficient and subjective. In subsequent studies, computer technology, artificial intelligence and machine learning should be considered to identify images and texts and extract effective information.
Acknowledgements
The work was supported by the Beijing Natural Science Foundation [No. 8212015] and the National Natural Science Foundation of China [No. 52074302].
Author contributions
All authors contributed to the study's conception and design. Material preparation and data collection were performed by Jianting Yao and Dachen Lei; data analysis and research design were performed by Bingqian Fan and Ruipeng Tong; the first draft of the manuscript was written by Bingqian Fan, and all authors commented on previous versions of the manuscript. All authors read and approved the final manuscript.
Declarations
Conflict of interest
The authors declare that they have no known competing financial interests or personal relationships that could have appeared to influence the work reported in this paper.
Footnotes
Publisher's Note
Springer Nature remains neutral with regard to jurisdictional claims in published maps and institutional affiliations.
References
- 1.Rachid C, Ion V, Irina C, Mohamed B. Preserving and improving the safety and health at work: case of hamma bouziane cement plant (algeria) Saf Sci. 2015;76:145–150. doi: 10.1016/j.ssci.2015.01.014. [DOI] [Google Scholar]
- 2.Besserman J, Mentzer RA. Review of global process safety regulations: United States, European Union, United Kingdom, China. India J Loss Prev Process Ind. 2017;50:165–183. doi: 10.1016/j.jlp.2017.09.010. [DOI] [Google Scholar]
- 3.El-Said E, Awad MM, Abdulaziz M. A comprehensive review on pressurized thermal shock: predictive, preventive and safety issues. J Therm Anal Calorim. 2021;146:525–544. doi: 10.1007/s10973-020-10030-4. [DOI] [Google Scholar]
- 4.Health and Safety Executive. Strategies to promote safe behavior as part of a health and safety management system. UK: Contract Research Report, 2002.
- 5.Choudhry RM, Fang D. Why operatives engage in unsafe work behavior: investigating factors on construction sites. Saf Sci. 2008;46:566–584. doi: 10.1016/j.ssci.2007.06.027. [DOI] [Google Scholar]
- 6.Zhang M, Fang D. A continuous behavior-based safety strategy for persistent safety improvement in construction industry. Autom Constr. 2013;34:101–107. doi: 10.1016/j.autcon.2012.10.019. [DOI] [Google Scholar]
- 7.Yue H, Li C, Liu M, Jin R, Bao H. Validity test of the theory of planned behavior in college students' withdrawal from smartphone dependence. Curr Psychol. 2020;5:1–8. doi: 10.1007/s12144-020-01068-6. [DOI] [Google Scholar]
- 8.Jiang Z, Fang D, Zhang M. Understanding the causation of construction workers’ unsafe behaviors based on system dynamics modeling. J Manage Eng. 2015 doi: 10.1061/(ASCE)ME.1943-5479.0000350. [DOI] [Google Scholar]
- 9.Patel DA, Jha KN. Neural network model for the prediction of safe work behavior in construction projects. J Constr Eng Manage. 2014 doi: 10.1061/(ASCE)CO.1943-7862.0000922. [DOI] [Google Scholar]
- 10.Ajna A, Rp A, Gdg A, Ga B, Np C. Investigating occupational and operational industrial safety data through business intelligence and machine learning. J Loss Prev Process Ind. 2021 doi: 10.1016/j.jlp.2021.104608. [DOI] [Google Scholar]
- 11.Jiao Z, Hu P, Xu H, Wang Q. Machine learning and deep learning in chemical health and safety: a systematic review of techniques and applications. ACS Chem Health Saf. 2020;7(6):316–334. doi: 10.1021/acs.chas.0c00075. [DOI] [Google Scholar]
- 12.Serrano N, Savakis A, Luo J. A computationally efficient approach to indoor/outdoor scene classification. Int Conf Pattern Recognit. 2002 doi: 10.1109/ICPR.2002.1047420. [DOI] [Google Scholar]
- 13.Guo S, Luo H, Yong L. A big data-based workers behavior observation in China metro construction. Procedia Eng. 2015;123:190–197. doi: 10.1016/j.proeng.2015.10.077. [DOI] [Google Scholar]
- 14.Xu S, Luo H. Worker behavior safety training system based on graphic language. J Civ Eng Manag. 2014;3:51–55. [Google Scholar]
- 15.Yin W, Fu G, Zhu K, Yang C. Reason analysis of gob gas explosion based on behavioral safety. Safety in Coal Mines. 2015;46(07):239–241. doi: 10.13347/j.cnki.mkaq.2015.07.067. [DOI] [Google Scholar]
- 16.Kumar S, Toshniwal D. A data mining framework to analyze road accident data. J Big Data. 2015;2(1):1–18. doi: 10.1186/s40537-015-0035-y. [DOI] [Google Scholar]
- 17.Tong R, Yang X, Parker T, Zhang B, Wang Q. Exploration of relationships between safety performance and unsafe behavior in the Chinese oil industry. J Loss Prev Process Ind. 2020;66(1):104167. doi: 10.1016/j.jlp.2020.104167. [DOI] [Google Scholar]
- 18.Silver DA, Clark TN, Rothfield L. A Theory of Scenes. University of Chicago; 2007.
- 19.Scoble R, Israel S. Age of context: mobile, sensors, data and the future of privacy. Charlestone: Patrick Brewster Press; 2014. [Google Scholar]
- 20.Wang L, Cheng Y, Liu H. An analysis of fatal gas accidents in Chinese coal mines. Saf Sci. 2014;62:107–113. doi: 10.1016/j.ssci.2013.08.010. [DOI] [Google Scholar]
- 21.Tong R, Zhang Y, Cui P, Zhai C, Shi M, Xu S. Characteristic analysis of unsafe behavior by coal miners: multi-dimensional description of the pan-Scene data. Int J Environ Res Public Health. 2018;15(8):1608. doi: 10.3390/ijerph15081608. [DOI] [PMC free article] [PubMed] [Google Scholar]
- 22.Lasswell HD. The structure and function of communication in society. Commun Ideas. 1948;37:215–228. [Google Scholar]
- 23.Zhou Z, Guo W. Applications of item response theory to measuring the safety response competency of workers in subway construction projects. Saf Sci. 2020 doi: 10.1016/j.ssci.2020.104704. [DOI] [Google Scholar]
- 24.Xue X, Zhang R, Zhang X, Yang R, Li H. Environmental and social challenges for urban subway construction: an empirical study in China. Int J Proj Manag. 2015;33(3):576–588. doi: 10.1016/j.ijproman.2014.09.003. [DOI] [Google Scholar]
- 25.Yin W, Fu G, Yang C, Jiang Z, Zhu K, Gao Y. Fatal gas explosion accidents on Chinese coal mines and the characteristics of unsafe behaviors: 2000–2014. Saf Sci. 2017;92:173–179. doi: 10.1016/j.ssci.2016.09.018. [DOI] [Google Scholar]
- 26.Fayyad UM, Piatetsky-Shapiro G, Smyth P. Knowledge discovery and data mining: towards a unifying framework. Proceedings of the 2nd International Conference on Knowledge Discovery and Data Mining. AAAI Press; 1996.
- 27.Agrawal R. Mining association rules between sets of items in large databases. Acm Sigmod Conference on Management of Data; 1993.
- 28.Melih K, Cuneyt A. A fraud detection approach with data mining in health insurance. Procedia Soc Behav Sci. 2012;62:989–994. doi: 10.1016/j.sbspro.2012.09.168. [DOI] [Google Scholar]
- 29.Kaur M, Kang S. Market basket analysis: identify the changing trends of market data using association rule mining. Procedia Comput Sci. 2016;85:78–85. doi: 10.1016/j.procs.2016.05.180. [DOI] [Google Scholar]
- 30.Ahn KI. Effective product assignment based on association rule mining in retail. Expert Syst Appl. 2012;39(16):12551–12556. doi: 10.1016/j.eswa.2012.04.086. [DOI] [Google Scholar]
- 31.Ibrahim H, Saad A, Abdo A, Eldin AS. Mining association patterns of drug-interactions using post marketing FDA's spontaneous reporting data. J Biomed Inform. 2016 doi: 10.1016/j.jbi.2016.02.009. [DOI] [PubMed] [Google Scholar]
- 32.Liang YH. Integration of data mining technologies to analyze customer value for the automotive maintenance industry. Expert Syst Appl. 2010;12(37):7489–7496. doi: 10.1016/j.eswa.2010.04.097. [DOI] [Google Scholar]
- 33.Perwez SK, Zubair HM, Ghalib MR, Ahmed K, Iftekhar M. Association rule mining technique for psychometric personality testing and behaviour prediction. Int J Eng Technol. 2013;5(5):4349–4361. [Google Scholar]
- 34.Das S, Tamakloe R, Zubaidi H, Obaid I, Alnedawi A. Fatal pedestrian crashes at intersections: Trend mining using association rules. Accid Anal Prev. 2021 doi: 10.1016/j.aap.2021.106306. [DOI] [PubMed] [Google Scholar]
- 35.National public service platform for standards information (2022). http://std.samr.gov.cn; 2022
- 36.Wendler T. Data mining with spss modeler theory, exercises and solutions. Springer International Publishing; 2016.
- 37.Ma Z, Zhang C, Wang R, Zang Q, Yu X, Wang J, et al. Microcalorimetry combined with chemometics for antibacterial evaluation of Sophora alopecuroides on Staphylococcus aureus. J Therm Anal Calorim. 2018;134:1883–1891. doi: 10.1007/s10973-018-7358-9. [DOI] [Google Scholar]
- 38.Tong R, Zhang Y, Yang Y, Jia Q, Ma X, Shao G. Evaluating targeted intervention on coal miners' unsafe behavior. Int J Environ Res Public Health. 2019 doi: 10.3390/ijerph16030422. [DOI] [PMC free article] [PubMed] [Google Scholar]