Abstract
Recent evidences have shown that glycoprotein V (GP5) protein, which is initially considered as an important adhesion molecule unique to the megakaryocyte line, was also specifically expressed in malignant human breast epithelial cells. However, its expression level and function are not clear. This study aimed to reveal the abnormal expression of GP5 in breast cancer (BC), research the associations between the GP5 abnormal expression and BC progression, and explore the molecular mechanism of GP5 in BC. Immunohistochemistry, Western blot (WB), and quantitative reverse transcription–polymerase chain reaction (RT-PCR) assays were used to determine the expression patterns of GP5 in BC tissues and cells. The expression profiles of GP5 in the Cancer Genome Atlas databases were analyzed by UALCAN. The GP5 knockdown and over-expression BC cell lines were constructed and confirmed by RT-PCR and WB. Transcriptome sequencing and KEGG database were performed to screen cellular processes and signal pathways. Phosphatidylinositol 3-kinase (PI3K)/AKT pathway was verified by RT-qPCR, and epithelial–mesenchymal transition (EMT) was confirmed by WB. The results indicated GP5 was highly expressed in BC tissues and might play an important role as a cancer-promoting gene in BC. The high expression of GP5 was significantly associated with higher nuclear grade, higher TNM stage, and human epidermal growth factor receptor 2 (HER2) negativity. GP5 may promote the proliferation, invasion, and metastasis of BC cells by activating PI3K/AKT signaling pathway to up-regulate the EMT. This study provides a new idea that GP5 was expected to become a potential molecular target for early BC clinic diagnosis and treatment.
Keywords: GP5, PI3K, AKT, EMT, breast cancer, metastasis
Impact Statement
Breast cancer (BC) mortality is principally due to tumor recurrence and metastasis. Epithelial–mesenchymal transition (EMT) is a critical step in epithelial tumor progression and metastasis. Glycoprotein V (GP5) is initially considered as an important adhesion molecule during the platelet formation. However, the role of GP5 in tumor prognosis is still unknown. Our results indicated GP5 was highly expressed in BC tissues and might play an important role as a cancer-promoting gene in BC. GP5 may promote the proliferation, invasion, and metastasis of BC cells by activating phosphatidylinositol 3-kinase (PI3K)/AKT signaling pathway to up-regulate the EMT. This study increases understanding of GP5 on BC EMT and increases knowledge of the processes involved in BC metastasis that may be targetable.
Introduction
Breast cancer (BC) is a malignant tumor originating from the epithelial cells of the terminal ductal and lobule of the breast. In recent years, the incidence rate and mortality rate of BC in China are higher, which rank first and fifth, respectively, in the cancer spectrum. 1 Currently, the main treatment methods of BC are surgery, radiotherapy, chemotherapy, and target therapy. 2 Although big progress has been made in the diagnosis and therapy recently, recurrence and distant metastasis remain major obstacles to the successful treatment of BC. 3 Therefore, investigation of the molecular mechanisms underlying BC to identify novel treatment targets and improve the survival rate of patients with BC is required.
Glycoprotein V (GP5) gene is located on chromosome 3 and encodes membrane GP5. GP5 protein mainly plays its biological function by forming the GPIb-V-IX complex. 4 The GPIb-V-IX complex is composed of four different transmembrane protein subunits and plays a key role in the process of platelet activation, adhesion, and aggregation by binding to a variety of ligands such as the von Willebrand factor (vWf), thrombin, coagulation factors XI and XII, P-selectin, and integrin Mac-1.5,6 At present, the research on GP5 protein mainly focuses on megakaryocyte lineage. 7 More importantly, Catherine found that GP5 protein was also expressed in BC cells, and had a 100% homology gene sequence with the GP5 protein in the platelet membrane. 8 However, as a control, GP5 protein was not expressed in normal breast myoepithelial cells and colon cancer cell lines, indicating that the expression of GP5 protein is a tissue-specific expression, not in all types of tumors. Further studies are needed on the GP5 expression in BC and related mechanisms.
In our research, we confirmed that GP5 is highly expressed in BC and contributes to the proliferation and invasion of tumor cells. Our further results showed that GP5 could promote the progression of BC via the phosphatidylinositol 3-kinase (PI3K)/AKT/epithelial–mesenchymal transition (EMT) signaling pathways based on in vitro experiments and bioinformatic analysis. Taken together, these findings provide a new directions and insights for the diagnosis and treatment of BC.
Materials and methods
Patients and tissue samples
A total of 41 BC patients receiving treatment at The Second Affiliated Hospital of Kunming Medical University (Kunming, China) from January 2015 to December 2019 were enrolled in this study (The clinical data and histological grade were listed in Supplementary Materials, Table S1). The inclusion criteria included the newly pathological diagnosed BC patients in Yunnan province without any other malignant tumor. The exclusion criteria included severe hepatorenal insufficiency, hematopoietic system disease, severe infectious disease, and undergone presurgical chemotherapy or radiotherapy. Of these, 41 cases of BC and 41 cases of paracancerous tissue were sampled. In addition, 15 lymph node metastasis (LN metastasis), 19 cases of ductal carcinoma in situ (DCIS) and 20 cases of benign breast nodules (BBN) tissues were collected. All samples derived from human subjects were collected in accordance with the hospital regulations and were approved by the Ethics Committee of The Second Affiliated Hospital of Kunming Medical University. Written informed consent was obtained from each subject. All patients were followed up by telephone, outpatient, or inpatient visits. The death, last follow-up, or lost follow-up sessions were recorded up to the termination of the study. The follow-up deadline was 18 May 2020.
Cell culture and lentivirus packaging
The immortal human breast epithelial cell line MCF-10A, BC cell line MCF-7, and MDA-MB-231 were purchased from the Kunming Institute of Zoology Chinese Academy of Sciences (Kunming, China). The 293T cell that used for lentivirus packaging was awarded by the Huang Xinwei research group of the central laboratory. MCF-10A cells were maintained in Dulbecco’s Modified Eagle Medium (DMEM) (Corning, USA), MCF-7 cells were maintained in 90% Modified Eagle Medium (MEM) (BI, Israel), MDA-MB-231 cells were maintained in DMEM/F12 (BI), 293T cells were maintained in DMEM (Corning) containing 10% fetal bovine serum (Gibco, USA) and 1% double antibody (Fuzhou Maixin Co., Ltd, China) at 37°C in a sterile Cell incubator (Thermo Corporation, USA) with 5% CO2.
Plasmids that constitutively expressed GP5 shRNA or GP5 mRNA were constructed by cloning GP5 shRNA or GP5 cDNA into the pLKO.1-puro or pLVX-puro vectors (Gene Pharma Inc., China). The plasmids were amplified in Escherichia coli DH5α (Qinke Biotechnology Co., Ltd, China), and the inserted sequence was verified by the Sanger sequence (The sequence result was shown in Supplementary Materials, Figure S1).
Lentiviruses were packaged in 293T cells by cotransfecting cells with constructed plasmids (pLKO.1 – GP5 shRNA plasmids and pLVX-puro – GP5 cDNA) and package help vectors (pHelper1.0 and pHelper2.0, Gene Pharma Inc., China). Lentiviruses were concentrated by ultracentrifugation package vectors and stored at −80°C. The lentiviruses’ titer was determined by quantitative polymerase chain reaction (q-PCR). For transfection of BC cells, lentiviruses were rapidly thawed in 37°C water bath and added into cell cultures with the multiplicity of infection value (MOI) 100.
Real-time quantitative reverse transcription–polymerase chain reaction analysis of GP5 mRNA expression in breast tumors or cells
Total RNA was extracted from 5 to 10 slices of 5 µm thick, formalin-fixed, paraffin-embedded tissues (breast tumor and paracancerous tissues) and cultured cells (MCF-7, MDA-MB-231, and MCF-10A) using RNAiso plus (Takara Bio, Japan). Reverse transcription of the total RNA was performed using a PrimeScript™ RT Reagent Kit with gDNA Eraser (Perfect Real Time) (Takara Bio).
The q-PCR was performed with TB Green Premix Ex Taq II (2×) kit (Takara Bio) according to the manufacturer’s instruction manual. Glyceraldehyde 3-phosphate dehydrogenase (GAPDH) was used as the mRNA endogenous control (Primers used in the research were listed in Supplementary Materials, Table S2).
Immunohistochemistry
The tissues were sliced into 8- to 10-μm thick paraffin-embedded sections. After deparaffinization and rehydration of the samples with xylene, ethanol and water, the antigen was retrieved via ethylenediaminetetraacetic acid (EDTA) antigen repair solution (Omega, USA) under high pressure for 3 min and washed with phosphate-buffered saline (PBS) buffer several times. After drying, the sections were incubated with anti-GP5 antibody (Santa, USA) in an incubator for 1 h. After removing the primary antibody gently by washing with PBS buffer, the slide was incubated with horseradish peroxidase (HRP)-labeled sheep anti-mouse/rabbit IgG polymer (Fuzhou Maixin Co., Ltd) in an incubator for 30 min. After washing with PBS again, the sections were developed with DAB chromogen (Fuzhou Maixin Co., Ltd), observe the color development under the microscope, and dry the seal after terminating the color development. Then, collect immunohistochemical images of five areas with the best color rendering effect for each sample, ensure the same image acquisition conditions, and use Image Pro Plus 6.0 software for quantitative analysis of image optical density.
UALCAN analysis
UALCAN (http://ualcan.path.uab.edu/index.html) is the Cancer Genome Atlas (TCGA) database visual web portal that provides analysis of transcriptional expressions. 9 In this study, UALCAN was used to evaluate the GP5 expressions level analysis of the subclasses and TP53 mutation status. The difference was compared by Student’s t-test, and the P value was set as 0.05.
Construction of GP5 gene knockdown/over-expression stable cell line
To construct GP5 down/over-expression stable cell lines, we transfected the MDA-MB-231 cell with the target gene lentivirus and screened cells with 0.1% puromycin (Solarbio Co., Ltd, Beijing, China). The empty vector lentivirus transfected cells were used as the control. After two weeks screen, the cells were collected for q-PCR detection (Thermo Fisher Corporation, USA) to identify the expression level of the target gene.
Cell Counting Kit-8 cell proliferation
The cells of the experimental group and the control group in the logarithmic growth stage were digested and resuspended in the new medium. The resuspended cells were seeded into 96-well plates at a density of 200 μL or 1 × 10⁴ cells per well, six repeat wells were set in each group. The cells were cultured in a 37°C incubator with 5% CO2 for 4 h to make the cells adhere to the wall. Add 10 μL Cell Counting Kit (CCK)-8 solution (Solarbio Co., Ltd) into each hole before testing, and incubate in a 37°C, 5% CO2 incubator for 4 h. The cell adhesion was recorded as 0 h, and the absorbance was measured at 450 nm at 24, 48, and 72 h, respectively.
Cell cycle assay
After digestion, the cells of each group in the logarithmic growth stage were collected, fixed, and permeabilized with 3 mL 70% precooled ethanol in a 4°C refrigerator for 24 h. After fixing overnight, cells were then washed with PBS two times and incubated with 1 μL 10 mg/mL propidium iodide (PI) and 1 μL 100 mg/mL RNase A (KeyGen Biotech Co., Ltd, Jiangsu, China) for 30 min in the dark. Add 400 μL 0.6% NP-40 before starting the machine. Cell cycle analysis was performed using the BD FACSCalibur flow cytometer in a dark place. Data were acquired using FloMax 2.8 software.
Cell apoptosis assay
Cells were centrifuged at 600 r/min at 4°C for 10 min to remove the supernatant and then washed with PBS. Subsequently, 100 μL binding buffer was added to resuspend the cells. Add 5 μL fluorescein isothiocyanate (FITC)-labeled Annexin-V dye liquor (4A Biotech Co., Ltd, Beijing, China) into per 1 × 10⁶ cells, dark dyeing it at 4°C for 30 min. Before starting the machine, 5 μL PI dye liquor and 400 μL binding buffer were added to each well and filtered with nylon membrane. Cell apoptosis was detected on the BD FACSCalibur flow cytometer and analyzed using FloMax 2.8 software. The apoptosis rate (%) is calculated using the formula: (Annexin-V positive cells/total cells of the main group analyzed) × 100%.
Cell migration assay
Cell migration was evaluated by a cell scratch assay. The cells were counted after complete suspension of culture medium, and 5 × 10⁵ cells were passaged evenly into each well of six-well plate. Cells grown over 95% confluence were gently scratched three straight lines with a pipette tip. After scratching, the wells were gently washed with PBS to remove detached cells. The wells were replenished with fresh medium and continue cultured in the incubator. Then, observe and take photos under an inverted microscope at 0, 24, and 48 h, respectively. The software image J6.0 was used to calculate the cell migration area within 24 and 48 h. The cell migration rate (%) is calculated using the formula: (migration area/starting area) × 100%.
High throughput cell transcriptome sequencing
The stable shGP5 expressing BC MDA-MB-231 cells and the control cells were cultured to the logarithmic growth phase. The old medium was discarded, and the cells were washed with PBS buffer to remove dead and detached cells. Add an appropriate amount of RNAiso plus (Takara Bio) to fully lyse the cells. The transcriptome sequencing was performed by Illumina HiSeq platform. After obtaining the sequencing results, the transcriptome differences between the two groups were analyzed.
Protein quantitative detection by Western blot
Protein was extracted from MDA-MB-231 and the control cells growing 70~80% confluence using the prepared mixture: 1 mL PIPA lysate (Biyuntian Biotechnology Co., Ltd, China) and 10 μL protease inhibitor (Biyuntian Biotechnology Co., Ltd). Using Western blot (WB), the protein samples were separated in sodium dodecyl sulfate–polyacrylamide gel electrophoresis (SDS-PAGE) (Biosharp, China) and transferred to polyvinylidene difluoride (PVDF) membrane (Millipore, USA). The membrane was blocked with 5% non-fat dry milk in PBS for 1 h and incubated in diluted primary antibody solution (Wanlei Biotechnology Company, China; 1:1000) overnight at 4°C, after washed with Tris-buffered saline with Tween 20 (TBST) buffer, the membrane was incubated with HRP-labeled secondary antibody and developed with Immobilon Western Chemiluminescent HRP Substrate (Millipore). The primary antibodies used were antivimentin, antisnail, anti-MMP2/MMP9 antibody (Wanlei Biotechnology Company, dilution ratio 1:1000).
Statistical analyses
The KEGG database 10 was used for the analysis of related signaling pathways of the GP5 gene. SPSS statistics 20.0 statistical software package was used for statistical analysis. The comparison between the two groups with the normal distribution of measurement data adopted t-test, and the expression method is ; chi-square test was used for multigroup analysis. P ⩽ 0.05 was considered as statistically significant. The mapping software was GraphPad prism 7.0.
Results
The GP5 gene expression is up-regulated in BC tissues and cells lines
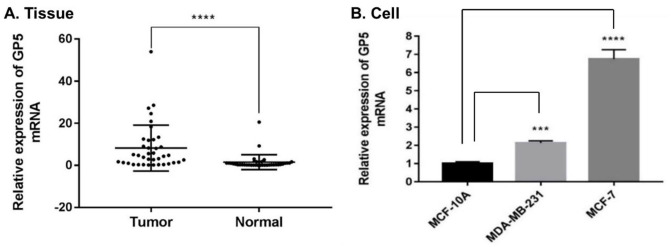
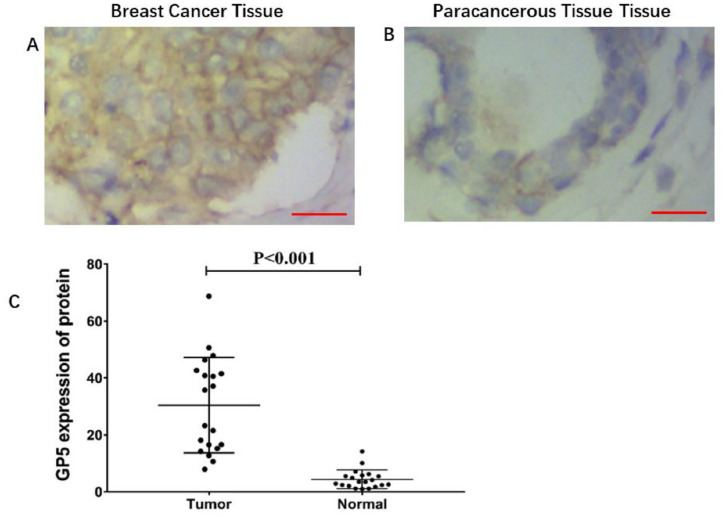
To compare the expression of GP5 in tumor and normal tissues, the GP5 mRNA expression in 41 BC and 41 paracancerous tissue samples was detected by RT-qPCR. The results indicate that the GP5 was highly expressed in BC tissues compared with paracancerous tissues, P < 0.001 (Figure 1(A)). To further verify the over-expression of GP5 in BC cells lines, the expression of GP5 mRNA in BC cell lines MCF-7, MDA-MB-231, and human immortalized normal breast epithelial cells MCF-10A was also detected. The results have showed that the mRNA expression of GP5 in MCF-7 (6.746 ± 0.517) and MDA-MB-231 (2.139 ± 0.114) was significantly higher than that of MCF-10A (1.010 ± 0.096), P < 0.001 (Figure 1(B)), which is consistent with the detection results in tumor tissues. In addition, the immunohistochemistry (IHC) detection of GP5 in 20 BC tissues and 20 paracancerous tissues showed that the expression of GP5 protein was also significantly up-regulated in BC tissues (30.468 ± 16.806) compared with normal tissues (4.421 ± 3.286), P < 0.001 (Figure 2).
Figure 1.
The expression of GP5 mRNA in breast cancer tissue and cell compared with the normal group. Differences between groups were assessed using the chi-square analysis, and P values were indicated. (A) The expression level of GP5 mRNA in breast tumor tissues (n = 41) was 8.195 ± 10.903, and the expression level in normal (paracancerous) tissues (n = 41) was 1.480 ± 3.541. (B) The expression of GP5 mRNA in breast cancer cells (MCF-7 and MDA-MB-231) versus normal breast cells (MCF-10A).
****P < 0.001 in (A).
***P < 0.001; ****P < 0.0001 in (B).
Figure 2.
The expression level of GP5 protein in breast cancer and paracancerous tissue. (A) and (B) IHC (200×) analysis of GP5 protein expression in breast tumor and paracancerous tissue. Brown color represents the positive staining. Scale bar is 20 µm (A and B). (C) The expression level of GP5 protein in breast cancer tissue (n = 20) was 30.468 ± 16.806 and in normal tissue (n = 20) was 4.421 ± 3.286, P < 0.001.
The over-expression of GP5 was associated with high histological grade, high TNM stage, HER2 negativity, and the poor prognosis of BC
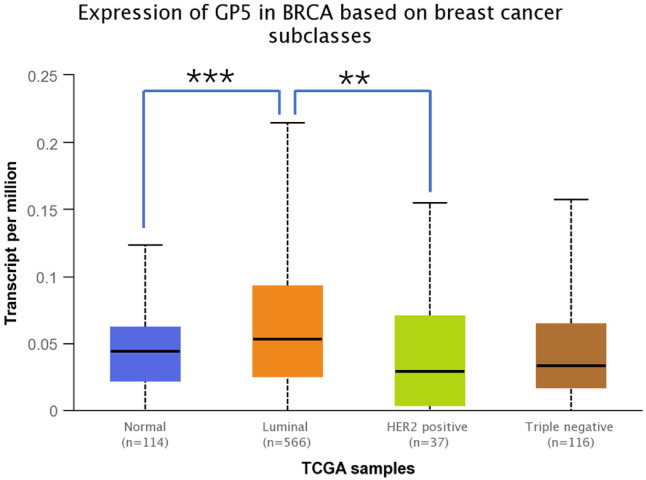
The expression of GP5 in 41 cases of BC tissues was analyzed. Set the median expression value of GP5 as the critical value to group the patients into the high and low expression groups. The relationship between the GP5 expression and BC clinicopathological parameters was analyzed. The results showed that the expression of GP5 in patients with BC at histological grade III was significantly higher than that at histological grade II. The expression of GP5 in patients with TNM stages I and II was lower than that with TNM stages III and IV, and the expression level of GP5 in patients with HER2 negative was higher than that with HER2 positive (P < 0.05). We next analyzed the correlation between mRNA expression of GP5 and tumor subclasses by UALCAN data set. As shown in Figure 3, the mean GP5 level was higher in the luminal subtype than in the HER2-positive subtype (P < 0.05). However, there was no statistically significant difference in age, menopause, tumor size, vascular invasion, nerve invasion, nipple invasion, estrogen receptor (ER), progesterone receptor (PR), Ki-67, and LN metastasis between high and low GP5 expression groups (Table 1).
Figure 3.
The transcriptional levels of GP5 in breast cancer according to different breast cancer subtypes from the UALCAN database. (A color version of this figure is available in the online journal.)
**P < 0.05; ***P < 0.01.
Table 1.
The correlation between GP5 and clinicopathological parameters of breast cancer patients.
| Clinicopathological data | n | High expression | Low expression | P (χ)2 |
|---|---|---|---|---|
| Age (years) | ||||
| <55 | 33 | 15 | 18 | 0.638 |
| ⩾55 | 8 | 5 | 3 | |
| Menopause | ||||
| Yes | 23 | 12 | 11 | 0.623 |
| No | 18 | 8 | 10 | |
| Tumor diameter (cm) | ||||
| ⩽2 | 20 | 9 | 11 | 0.636 |
| >2 | 21 | 11 | 10 | |
| Histological grade | ||||
| II | 14 | 3 | 11 | 0.012* |
| III | 27 | 17 | 10 | |
| TNM stage | ||||
| I or II | 32 | 12 | 20 | 0.019* |
| III or IV | 9 | 8 | 1 | |
| Vascular invasion | ||||
| No | 33 | 14 | 19 | 0.208 |
| Yes | 8 | 6 | 2 | |
| Nerve invasion | ||||
| No | 38 | 19 | 19 | 1.000 |
| Yes | 3 | 1 | 2 | |
| Nipple invasion | ||||
| No | 38 | 18 | 20 | 0.965 |
| Yes | 3 | 2 | 1 | |
| ER | ||||
| Negative | 27 | 11 | 16 | 0.153 |
| Positive | 14 | 9 | 5 | |
| PR | ||||
| Negative | 21 | 11 | 17 | 0.074 |
| Positive | 17 | 9 | 4 | |
| HER2 | ||||
| Negative | 27 | 17 | 11 | 0.025* |
| Positive | 13 | 3 | 10 | |
| Ki-67 positive index | ||||
| <14% | 6 | 3 | 3 | 1.000 |
| ⩾14% | 35 | 17 | 18 | |
| LN metastasis | ||||
| No | 26 | 13 | 13 | 0.837 |
| Yes | 15 | 7 | 8 | |
ER: estrogen receptor; PR: progesterone receptor; HER2: human epidermal growth factor receptor 2; LN: lymph node.
Differences between groups were assessed using the chi-square analysis, and P values were indicated (*P < 0.05).
Follow-up observation was also performed on 41 BC patients. The recurrence and metastasis were taken as the endpoint. The Kaplan–Meier survival curve was drawn to observe the relationship between GP5 and the prognosis of BC patients. The results showed that there was no significant difference in recurrence-free survival rate between the high GP5 expression group and the low GP5 expression group (P > 0.05), but the one-year recurrence-free survival rate was 85.71% in the high GP5 expression group and 100% in the low GP5 expression group; the three-year recurrence-free survival rate was 75.56% in the high GP5 expression group and 87.08% in the low GP5 expression group (Figure 4), indicating that there is still a certain association between high GP5 expression and low recurrence-free survival rate.
Figure 4.
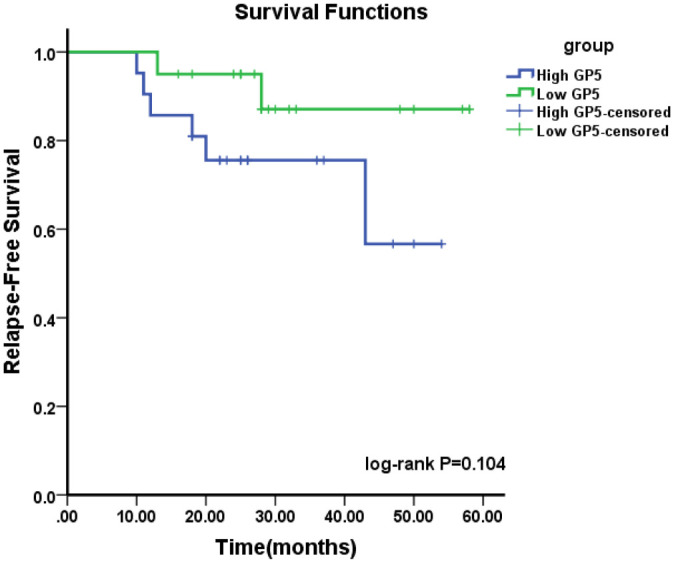
Kaplan–Meier cumulative survival curves of breast cancer patients with different GP5 expression (log-rank test: P = 0.104).
The expression of GP5 enhances proliferation, invasion, and metastasis of BC cells
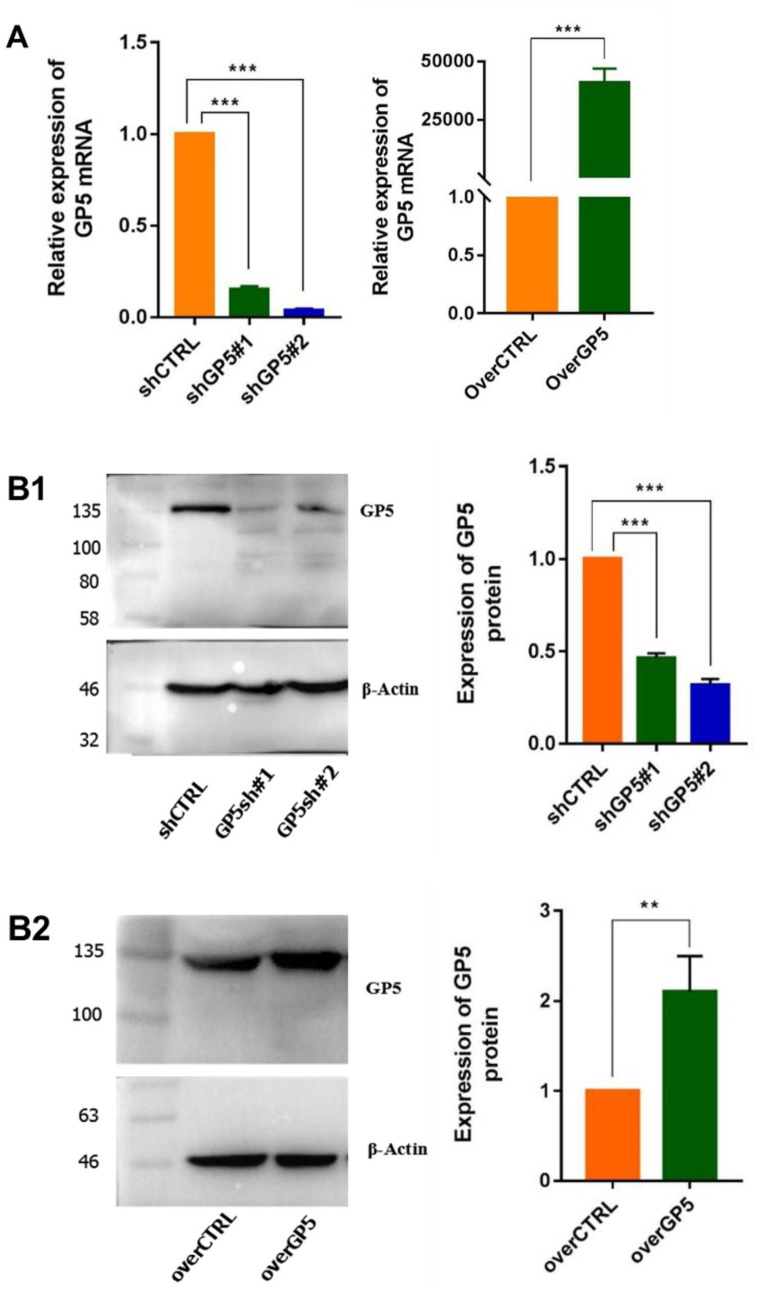
To further study whether the expression of GP5 gene affects the biological activities of BC cells, we constructed MDA-MB-231 cell lines that can stably express shGP5/shCTRL or overGP5/overCTRL through lentiviral transfection. After screening out stable cell lines with antibiotics (The result was shown in Supplementary Materials, Figure S2), the expression level of GP5 mRNA and protein in the cells was verified by RT-qPCR and WB, respectively (Figure 5).
Figure 5.
The expression of GP5 mRNA and protein in stable shGP5 and overGP5 cell line. (A) GP5 mRNA expression and (B1 and B2) GP5 protein expression. (A color version of this figure is available in the online journal.)
**P < 0.01; ***P < 0.001.
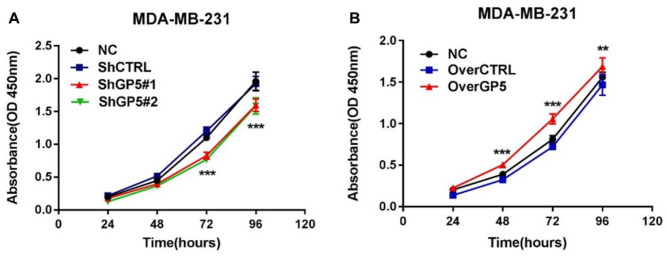
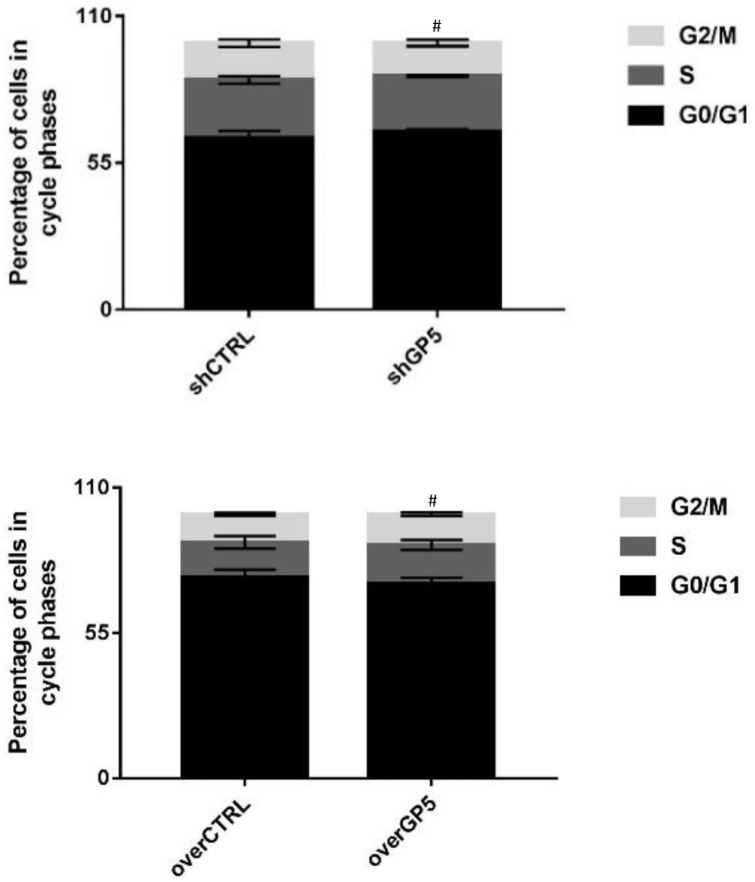
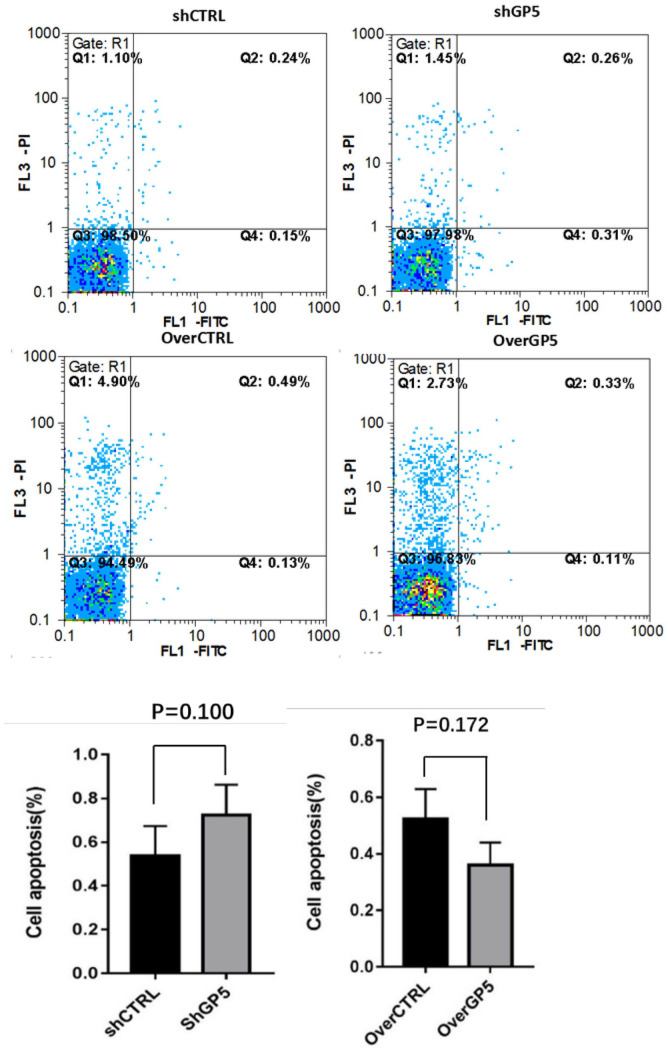
The proliferation of BC cells was detected by recording the changes of absorbance at 450 nm in CCK8. The results showed that the absorbance of shGP5 BC cells was significantly lower than that of the control group over time, while the absorbance of overGP5 BC cells was higher than that of the control group (Figure 6). Cell cycle detection showed that the proportion of G0/G1, S, and G2/M in BC cells after down-/up-regulation of the GP5 gene was not significantly different from that in the control group (Figure 7 and Supplementary Figure S3). The apoptotic test results showed that the apoptosis rate of shGP5 BC cells was higher than that of the control group, while the apoptosis rate of overGP5 BC cells was in reverse. But there was no statistically significant difference in these results (P > 0.05), suggesting that GP5 gene had no significant effect on the spontaneous apoptosis of BC cells (Figure 8).
Figure 6.
The change curves of CCK8 absorbance after the down- or up-regulation of GP5 expression. (A color version of this figure is available in the online journal.)
**P < 0.01; ***P < 0.001.
Figure 7.
The changes of the cell cycle after the down-/up-regulation of GP5 expression.
#P > 0.05, compared with the control group.
Figure 8.
Apoptosis rate was tested using flow cytometry after down-/up-regulation of GP5 expression. (A color version of this figure is available in the online journal.)
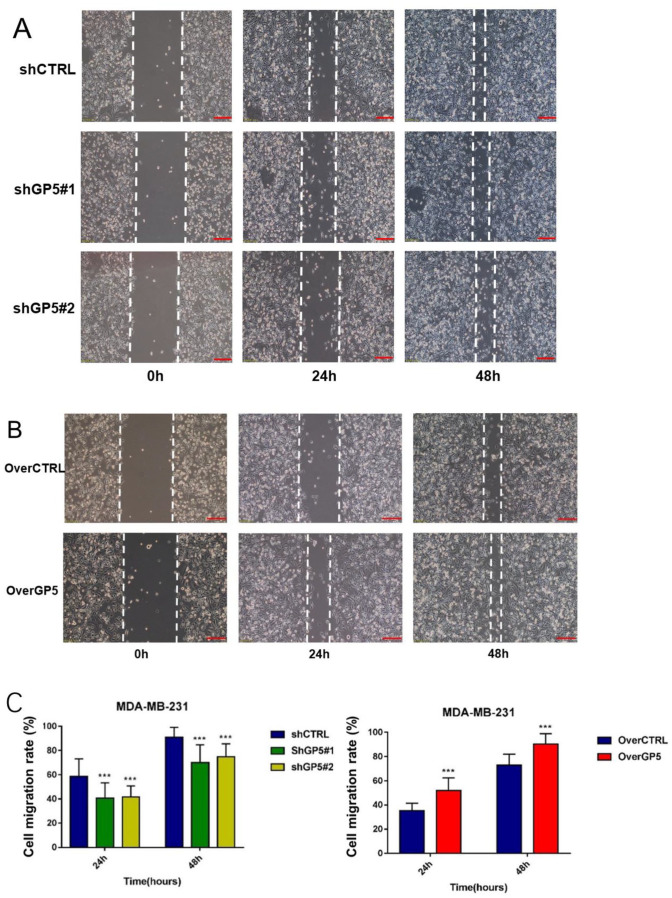
Metastasis of BC is closely related to the regulation of multiple genes. In this part, a cell scratch assay was performed to study whether the down- or up-regulation of the GP5 expression affect the metastasis of BC cells. The results showed that the cell migration rates of GP5 knockdown BC cells were significantly lower than those of the control group (P < 0.001), while the migration rate of GP5 over-expression BC cells was significantly higher than that of the corresponding control group (P < 0.001; Figure 9), indicating that the GP5 gene is a factor to promote the metastatic ability of BC cells.
Figure 9.
The changes of cell migration ability after down-/up-regulation of GP5 expression compared with the control group. Scale bar is 100 µm (A and B). (A color version of this figure is available in the online journal.)
***P < 0.001, compared with the control group.
The GP5 gene regulates the EMT progress of BC cells through PI3K/AKT pathway
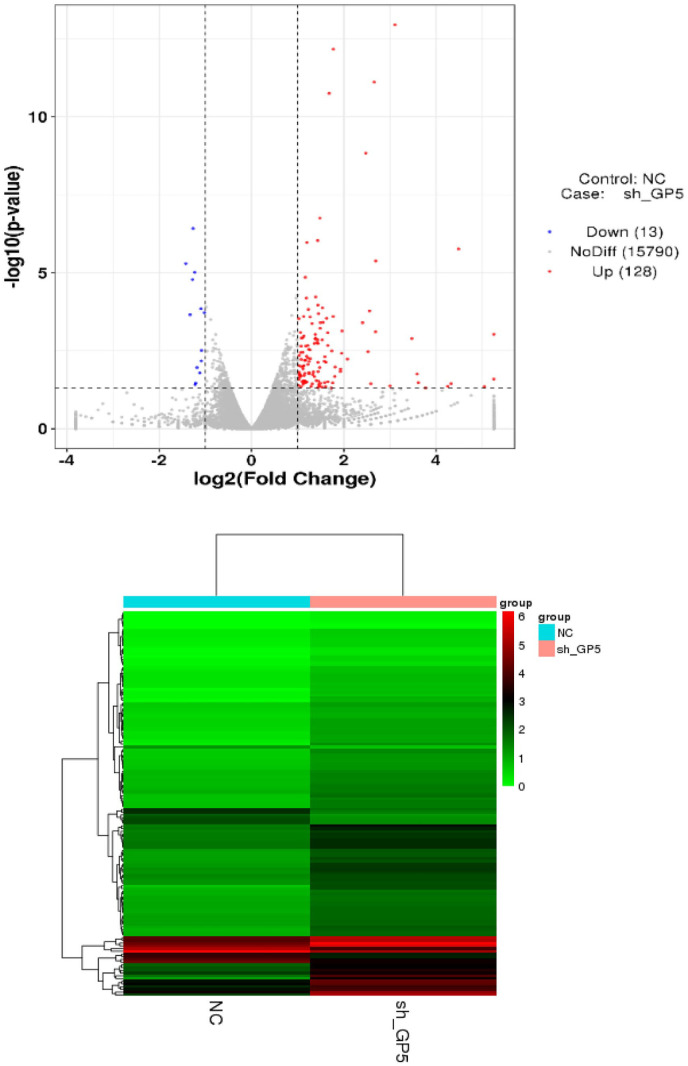
To explore the related signal pathways of the GP5 gene regulating BC progression, we explored the difference of genes expression in GP5 knockdown and control BC cells. The results of full transcription sequencing detection showed that 128 genes were up-regulated, and 13 genes were down-regulated after the down-regulation of GP5 expression (Table 2). Cluster analysis of these genes showed that the mRNA expression profile between the experimental group and the control group was different (Figure 10).
Table 2.
Top up-/down-regulated differentially expressed genes in response to GP5 knockdown versus control breast cancer cells (only the top five genes with the most different multiples are listed).
| Gene symbol | Gene description | Regulation | Fold change | P value |
|---|---|---|---|---|
| ID3 | Inhibitor of DNA binding 3, HLH protein | Up | 0.373 | 5.08E−06 |
| ARHGAP19 | Rho GTPase-activating protein 19 | Up | 0.398 | 0.0002 |
| SMIM13 | Small integral membrane protein 13 | Up | 0.412 | 1.66E−05 |
| SFT2D2 | SFT2 domain containing 2 | Up | 0.416 | 3.80E−07 |
| ID1 | Inhibitor of DNA binding 1, HLH protein | Up | 0.426 | 9.70E−06 |
| PLAGL1 | PLAG1 like zinc finger 1 | Down | 38 | 0.02 |
| ABCC12 | ATP binding cassette subfamily C member 12 | Down | 33 | 0.04 |
| AMOT | Angiomotin | Down | 22.375 | 1.73E−06 |
| HIST1H4E | Histone cluster 1 H4 family member e | Down | 20 | 0.03 |
| BCL11A | BCL11A, BAF complex component | Down | 19 | 0.04 |
Figure 10.
The volcano plot and cluster analysis of differentially expressed mRNA. (A color version of this figure is available in the online journal.)
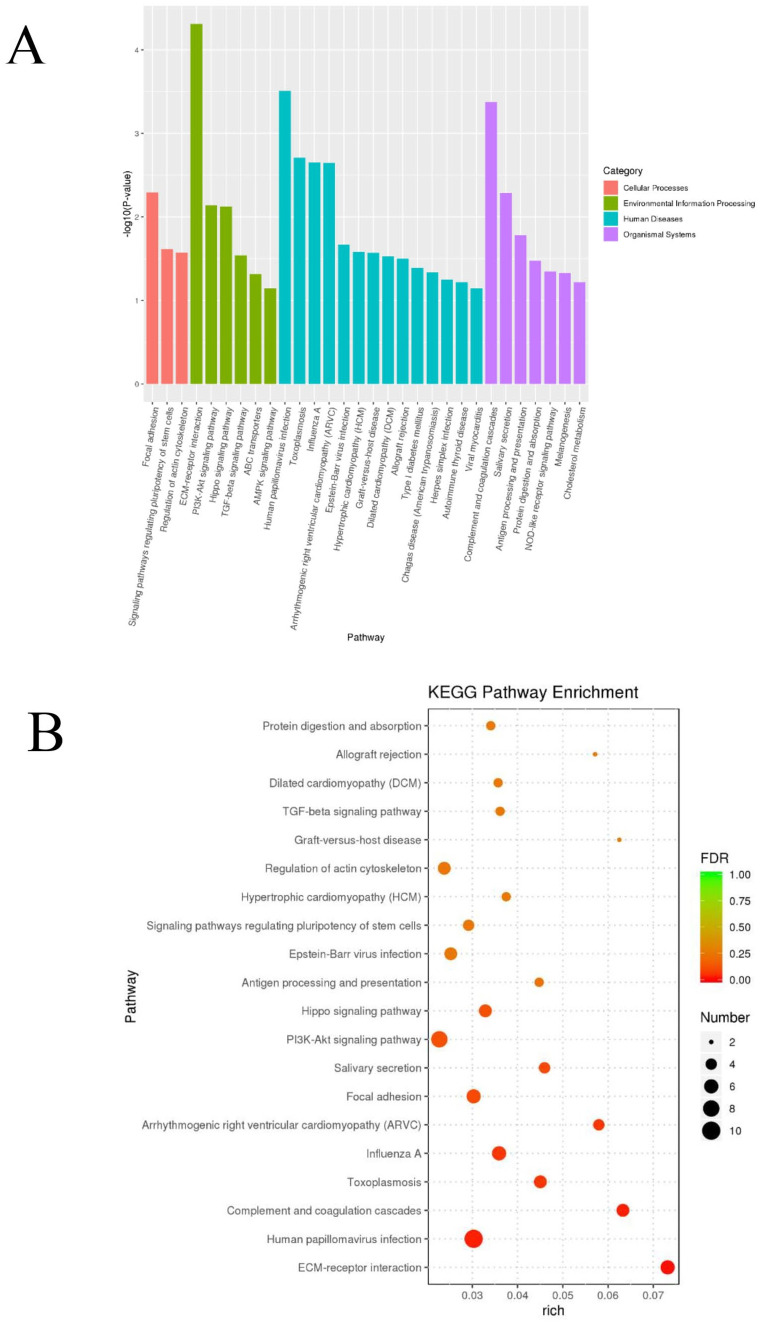
The function of differentially expressed genes was evaluated through KEGG enrichment. 10 Twenty pathways with minimum P value were selected to draw the Histogram and Bubble graph (Figure 11). The results showed that the down-regulation of GP5 was most related to the process of extracellular matrix–receptor interaction (P < 0.0001); in terms of signal transduction, the GP5 gene was significantly related to the PI3K/AKT signal pathway (P < 0.01), followed by the Hippo signal pathway (P < 0.01) and transforming growth factor-beta (TGF-β) signal pathway (P < 0.05) (Table 3).
Figure 11.
KEGG pathway enrichment analyses of the differentially expressed genes. The histogram graph of the KEGG pathway enrichment results were showed according to P value (A). Bubble plots showing the top 20 significant results by false discovery rate (FDR) (B). (A color version of this figure is available in the online journal.)
Table 3.
The KEGG signal pathway enrichment list.
| Pathway | Type | P value |
|---|---|---|
| ECM–receptor interaction | Signaling molecules and interaction | 4.88E−05 |
| PI3K/AKT signaling pathway | Signal transduction | 0.007 |
| Hippo signaling pathway | Signal transduction | 0.007 |
| TGF-β signaling pathway | Signal transduction | 0.029 |
| ABC transporters | Membrane transport | 0.048 |
ECM: extracellular matrix; PI3K: phosphatidylinositol 3-kinase; TGF-β: transforming growth factor-beta; ABC: ATP-binding cassette.
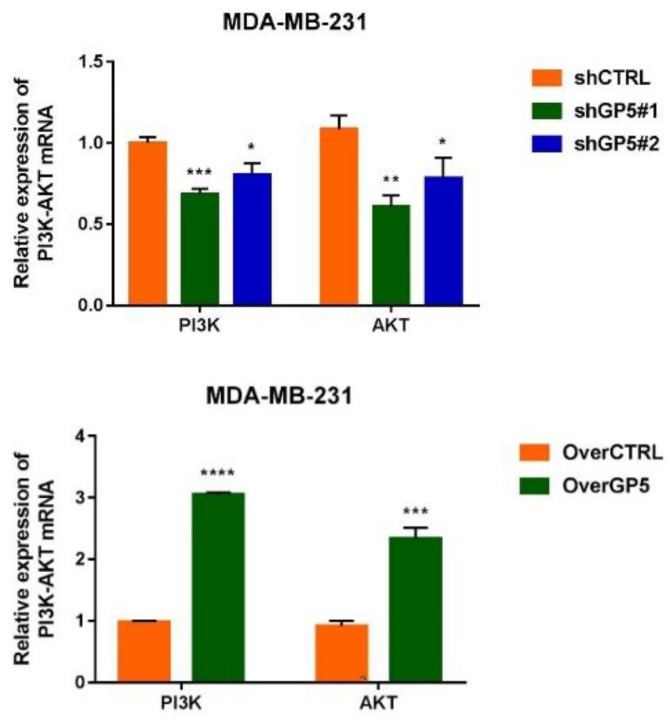
According to the screening results, the correlation between GP5 gene and PI3K/AKT pathway was verified by RT-qPCR. The results showed that the expression of PI3K mRNA (3.053 ± 0.033) and AKT mRNA (2.335 ± 0.178) in the overGP5 group were higher than that in the control group (1.001 ± 0.035) (P < 0.0001). The expressions of PI3K mRNA (shGP5#1: 0.685 ± 0.032, shGP5#2: 0.803 ± 0.073) and AKT (shGP5#1: 0.607 ± 0.068, shGP5#1: 0.782 ± 0.129) mRNA in the shGP5 group were lower than those in the control group (1.084 ± 0.084) (P < 0.05) (Figure 12). These results suggested that the GP5 gene might play a role in BC cells by up-regulating PI3K/AKT signaling pathway.
Figure 12.
The expression of PI3K and AKT mRNA in cells of down-/up-regulated GP5 group. (A color version of this figure is available in the online journal.)
*P < 0.5; **P < 0.01; ***P < 0.001; ****P < 0.0001, compared with control group.
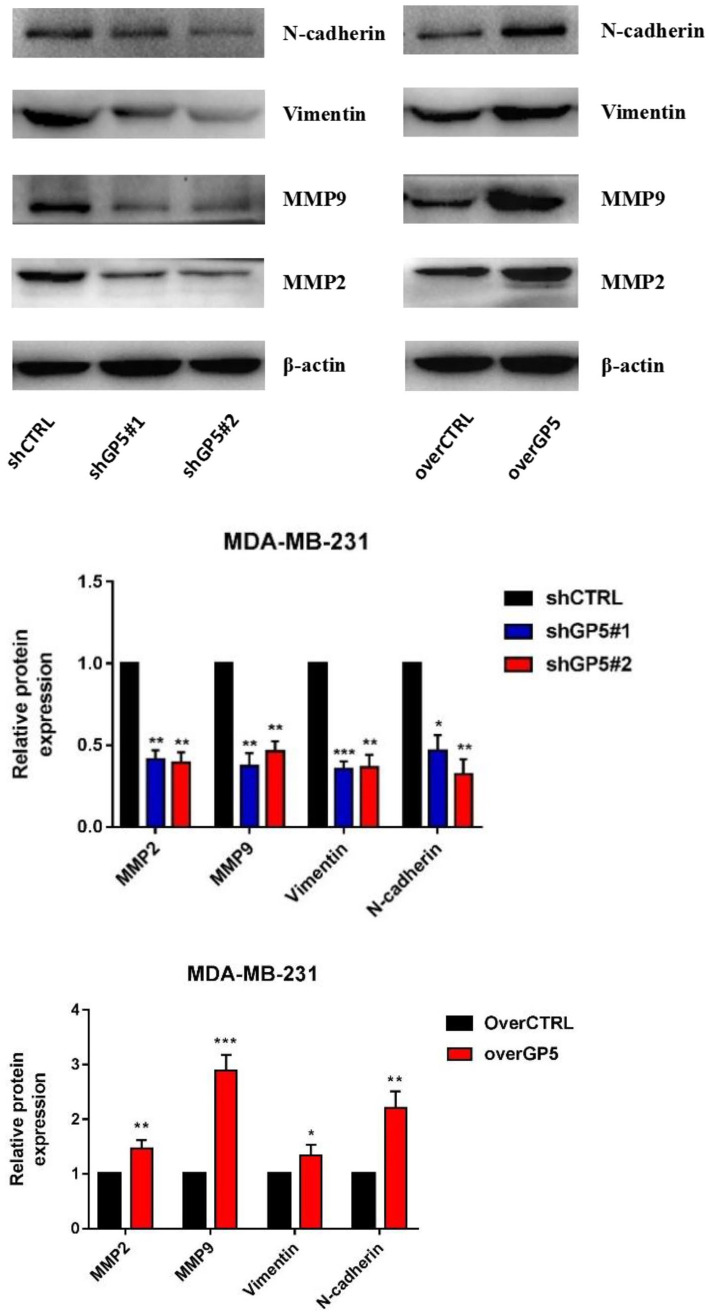
Because the EMT is closely related to the activation of PI3K/AKT signaling pathway, the changes of the EMT-related proteins expression in BC cells with up-/down-regulated GP5 expression were also studied. The Western blotting results showed that down-regulation of GP5 could reduce the expression of MMP2, MMP9, vimentin, and N-cadherin proteins by about 50~60%. Over-expression of GP5 could up-regulate the expression of MMP2 (about 1.5 times), MMP9 (about 2.9 times), valentine protein (about 1.3 times), and N-cadherin protein (about 2.2 times) (P < 0.05) (Figure 13). These results suggest that the GP5 gene can promote the EMT transformation through up-regulating MMP expression to promote the invasion and metastasis of BC cell MDA-MB-231 of BC cells.
Figure 13.
The expression of the EMT-related proteins (MMP2, MMP9, vimentin, and N-cadherin) in shGP5 or overGP5 MDA-MB-231. (A color version of this figure is available in the online journal.)
*P < 0.05; **P < 0.01; ***P < 0.001, compared with control group.
Discussion
The genes study of BC provides more scientific evidence for revealing the relationship between the etiology and progression of BC and provides more useful information and reference for clinical diagnosis and treatment. In this study, the expression level of the GP5 gene in 41 cases of breast tumors and its paracancerous tissues was detected. It was found that the GP5 gene expression is up-regulated in BC tissues and cells lines (P < 0.001). Therefore, GP5 may be a gene that promotes the progression of BC. Combined with the analysis of clinical and pathological parameters, it was found that the GP5 expression was positively correlated with histological grade and TNM grade of BC patients, but negatively correlated with HER2 expression. In addition, according to the follow-up observation of BC patients, the survival time of patients with high GP5 expression was shorter than that of patients with low GP5 expression, indicating that the high expression of GP5 was associated with poor prognosis of patients. However, due to the lack of sample size and shorter follow-up time, there is no statistical significance. Therefore, it is necessary to increase the number of BC tissue samples and prolong the follow-up time to further verify the relationship between GP5 and survival prognosis. If GP5 is confirmed to be associated with survival time in BC, it will hopefully become a new molecular target for clinical diagnosis and prognosis evaluation of BC and will tend to meet the requirements of precision medicine.
According to previous reports, the expression of the GP5 protein complex in BC may be related to distant metastasis of BC cells. 8 Therefore, by comparing the biological behavior of GP5 knockdown and over-expressed BC cell lines, it was proved that the expression of GP5 not only promoted the migration of BC cells, but also promoted the proliferation of breast cancer cells. But no significant correlation was found in the cell cycle and apoptosis of BC cells. Our research has further confirmed and supplemented the function of the GP5 expression in BC.
To further explore the molecular mechanism of the GP5 gene in promoting the progression of BC, we found that the down-regulation of the GP5 gene affected the expression of other genes to some extent using cell transcriptome sequencing technology. Therefore, it is deduced that it may promote the progression of BC by combining with other genes. The KEGG signal pathway enrichment indicates that the GP5 gene is significantly correlated with the PI3K/AKT signaling pathway. A large number of studies have shown that activation of the PI3K/AKT signaling pathway is closely related to proliferation, metastasis, 11 endocrine therapy resistance, and poor prognosis of BC cells.11 –14 Therefore, we speculate that the GP5 gene may promote proliferation and metastasis of BC cells through the PI3K/AKT signaling pathway in BC. In this study, we confirmed that GP5 over-expression can significantly up-regulate the expression levels of PI3K and AKT mRNA (P < 0.001). In subsequent studies, we need to detect the expression of the related proteins of the PI3K/AKT pathway to further confirm this hypothesis.
The activation of EMT transcription factors will lead to the down-regulation of genes encoding epithelial connexin, the weakening of intercellular adhesion and loss of top base polarity, while the expression of interstitial phenotypic genes such as N-cadherin, vimentin, and snail are up-regulated. 15 The transition of epithelial cells to mesenchymal state promotes the increase of cell movement and contractility, accompanied by the up-regulation of matrix metalloproteinase MMP expression, resulting in extracellular matrix degradation, cell migration, and invasion.16,17 It is found that multiple molecular signaling pathways are involved in the regulation of the EMT process, including TGF-β, Wnt/β-catenin, Notch, and so on. 18 Previous studies have shown that PI3K/AKT signal axis has a significant regulatory effect on the expression of MMP (Ayoup, 2020 #53; Xu, 2019 #54). Yang and other researchers 19 found that Coenzyme Q0 (CoQ0) could reduce the expression of MMP-9 through PI3K/AKT blocking nuclear factor kappa B (NF-κB) activation, thereby inhibiting MMP-9 mediated invasion and metastasis of BC cells. Wu and other researchers 20 found TGF-β1 inhibitor or PI3K inhibitor LY294002 can significantly inhibit the EMT effect of BC cell MCF-732, which shows that EMT is closely related to the activation of PI3K/AKT signaling pathway. In this study, the results showed that the GP5 over-expression could up-regulate the expression of PI3K/AKT mRNA and the EMT-related molecular markers (N-cadherin, vimentin, MMP9, and MMP2) in tumor cells, while the opposite result was observed after the down-regulation of GP5 expression. In conclusion, we hypothesized that GP5 could up-regulate EMT of tumor cells by activating PI3K/AKT signal pathway to promote the invasion and metastasis of BC cells.
Previous studies8,21 on the GP5 expression in BC just focused on the BC cells and blood samples. However, this study first confirmed the over-expression of the GP5 gene in BC by clinical tissue samples. Combined with relevant clinical information, the function of the GP5 gene in BC was analyzed. In the next studies, we needed to increase the number of BC tissue samples to verify the relationship between the GP5 expression and survival prognosis. We have predicted the possible downstream signaling pathways (PI3K/AKT) of GP5 in BC, and have preliminarily verified it by immunoblotting, which providing new clues and directions for further downstream molecular mechanism research. However, the downstream signaling pathways of GP5 in BC need further improvement and verification.
Conclusions
The GP5 gene is over-expressed in BC tissues and cells and may play a role in BC progression as a promoting oncogene. The high expression of GP5 is related to higher histological grade, higher TNM stage, and HER2 negative. The GP5 over-expression can promote proliferation, invasion, and metastasis of BC cells. The GP5 gene may increase the MET by activating the PI3K/AKT signaling pathway, thereby promoting proliferation, invasion, and metastasis of BC cells. The GP5 is expected to become a potential target for the clinical diagnosis and treatment of BC.
Supplemental Material
Supplemental material, sj-docx-1-ebm-10.1177_15353702221110642 for GP5 regulates epithelial–mesenchymal transition in breast cancer via the PI3K/AKT signaling pathway by Kui Xiang, Hua Yanshan, Zhao Chunmei, Guo Minmin, Wang Yan and Yi Xiaojia in Experimental Biology and Medicine
Footnotes
Authors’ Contributions: All authors contributed to data analysis, drafting, or revising the article, gave final approval of the version to be published, and agree to be accountable for all aspects of the work. WY, YX, and KX were responsible for the experimental design. HY, ZC, and GM carried out the experiments; HY analyzed the data; HY and KX wrote the article. WY and KX supervised the project. KX and HY contributed equally to this work.
The author(s) declared no potential conflicts of interest with respect to the research, authorship, and/or publication of this article.
Ethical Approval: All samples derived from human subjects were collected in accordance with the hospital regulations, and the study was approved by the Ethics Committee of The Second Affiliated Hospital of Kunming Medical University (ID: PJ-2020-141).
Funding: The author(s) disclosed receipt of the following financial support for the research, authorship, and/or publication of this article: This work was supported by the grants from the Applied Fundamental Research Joint Program of Science & Technology Department of Yunnan Province and Kunming Medical University (grant no. 202001AY070001-215) and the Yunnan Provincial Department of Education Science Research Fund Project (grant no. 2018JS218).
ORCID iD: Kui Xiang  https://orcid.org/0000-0003-3600-8779
Supplemental Material: Supplemental material for this article is available online.
References
- 1. Zhao J, Mao Z, Fedewa SA, Nogueira L, Yabroff KR, Jemal A, Han X. The Affordable Care Act and access to care across the cancer control continuum: a review at 10 years. CA Cancer J Clin 2020;70: 165–81 [DOI] [PubMed] [Google Scholar]
- 2. Nakamura S, Yagata H, Ohno S, Yamaguchi H, Iwata H, Tsunoda N, Ito Y, Tokudome N, Toi M, Kuroi K, Suzuki E. Multi-center study evaluating circulating tumor cells as a surrogate for response to treatment and overall survival in metastatic breast cancer. Breast Cancer 2010;17:199–204 [DOI] [PubMed] [Google Scholar]
- 3. Liang Y, Zhang H, Song X, Yang Q. Metastatic heterogeneity of breast cancer: molecular mechanism and potential therapeutic targets. Semin Cancer Biol 2020;60:14–27 [DOI] [PubMed] [Google Scholar]
- 4. Gardiner EE. Proteolytic processing of platelet receptors. Res Pract Thromb Haemost 2018;2:240–50 [DOI] [PMC free article] [PubMed] [Google Scholar]
- 5. Montague SJ, Andrews RK, Gardiner EE. Mechanisms of receptor shedding in platelets. Blood 2018;132:2535–45 [DOI] [PubMed] [Google Scholar]
- 6. Moog S, Mangin P, Lenain N, Strassel C, Ravanat C, Schuhler S, Freund M, Santer M, Kahn M, Nieswandt B, Gachet C, Cazenave JP, Lanza F. Platelet glycoprotein V binds to collagen and participates in platelet adhesion and aggregation. Blood 2001;98:1038–46 [DOI] [PubMed] [Google Scholar]
- 7. Burkhart JM, Vaudel M, Gambaryan S, Radau S, Walter U, Martens L, Geiger J, Sickmann A, Zahedi RP. The first comprehensive and quantitative analysis of human platelet protein composition allows the comparative analysis of structural and functional pathways. Blood 2012;120:e73–82 [DOI] [PubMed] [Google Scholar]
- 8. Suter CM, Hogg PJ, Price JT, Chong BH, Ward RL. Identification and characterisation of a platelet GPIb/V/IX-like complex on human breast cancers: implications for the metastatic process. Jpn J Cancer Res 2001;92:1082–92 [DOI] [PMC free article] [PubMed] [Google Scholar]
- 9. Chandrashekar DS, Bashel B, Balasubramanya SAH, Creighton CJ, Ponce-Rodriguez I, Chakravarthi B, Varambally S. UALCAN: a portal for facilitating tumor subgroup gene expression and survival analyses. Neoplasia 2017;19:649–58 [DOI] [PMC free article] [PubMed] [Google Scholar]
- 10. Kanehisa M, Furumichi M, Tanabe M, Sato Y, Morishima K. KEGG: new perspectives on genomes, pathways, diseases and drugs. Nucleic Acids Res 2017;45:D353–161 [DOI] [PMC free article] [PubMed] [Google Scholar]
- 11. Dey N, De P, Leyland-Jones B. PI3K-AKT-mTOR inhibitors in breast cancers: from tumor cell signaling to clinical trials. Pharmacol Ther 2017; 175:91–106 [DOI] [PubMed] [Google Scholar]
- 12. Luo J, Yao JF, Deng XF, Zheng XD, Jia M, Wang YQ, Huang Y, Zhu JH. 14, 15-EET induces breast cancer cell EMT and cisplatin resistance by up-regulating integrin alphavbeta3 and activating FAK/PI3K/AKT signaling. J Exp Clin Cancer Res 2018;37:23. [DOI] [PMC free article] [PubMed] [Google Scholar]
- 13. Guerrero-Zotano A, Mayer IA, Arteaga CL. PI3K/AKT/mTOR: role in breast cancer progression, drug resistance, and treatment. Cancer Metastasis Reviews 2016;35:1–10 [DOI] [PubMed] [Google Scholar]
- 14. Zheng J, Zhang M, Zhang L, Ding X, Li W, Lu S. HSPC159 promotes proliferation and metastasis by inducing epithelial–mesenchymal transition and activating the PI3K/Akt pathway in breast cancer. Cancer Sci 2018;109:2153–63 [DOI] [PMC free article] [PubMed] [Google Scholar]
- 15. Porta-de-la-Riva M, Stanisavljevic J, Curto J, Franci C, Diaz VM, Garcia de, Herreros A, Baulida J. TFCP2c/LSF/LBP-1c is required for Snail1-induced fibronectin gene expression. Biochem J 2011;435:563–8 [DOI] [PubMed] [Google Scholar]
- 16. Leong Hon S, Robertson Amy E, Stoletov K, Leith Sean J, Chin Curtis A, Chien Andrew E, Hague MN, Ablack A, Carmine-Simmen K, McPherson Victor A, Postenka Carl O, Turley Eva A, Courtneidge Sara A, Chambers Ann F, Lewis John D. Invadopodia are required for cancer cell extravasation and are a therapeutic target for metastasis. Cell Rep 2014;8:1558–70 [DOI] [PubMed] [Google Scholar]
- 17. Liu Q, Hodge J, Wang J, Wang Y, Wang L, Singh U, Li Y, Yao Y, Wang D, Ai W, Nagarkatti P, Chen H, Xu P, Murphy EA, Fan D. Emodin reduces breast cancer lung metastasis by suppressing macrophage-induced breast cancer cell epithelial–mesenchymal transition and cancer stem cell formation. Theranostics 2020;10:8365–81 [DOI] [PMC free article] [PubMed] [Google Scholar]
- 18. Mittal V. Epithelial mesenchymal transition in tumor metastasis. Annu Rev Pathol 2018;13:395–412 [DOI] [PubMed] [Google Scholar]
- 19. Yang HL, Thiyagarajan V, Shen PC, Mathew DC, Lin KY, Liao JW, Hseu YC. Anti-EMT properties of CoQ0 attributed to PI3K/AKT/NFKB/MMP-9 signaling pathway through ROS-mediated apoptosis. J Exp Clin Cancer Res 2019;38:186. [DOI] [PMC free article] [PubMed] [Google Scholar]
- 20. Wu S, Wang Y, Yuan Z, Wang S, Du H, Liu X, Wang Q, Zhu X. Human adiposederived mesenchymal stem cells promote breast cancer MCF7 cell epithelialmesenchymal transition by cross interacting with the TGFbeta/Smad and PI3K/AKT signaling pathways. Mol Med Rep 2019; 19:177–86 [DOI] [PMC free article] [PubMed] [Google Scholar]
- 21. Widschwendter M, Evans I, Jones A, Ghazali S, Reisel D, Ryan A, Gentry-Maharaj A, Zikan M, Cibula D, Eichner J, Alunni-Fabbroni M, Koch J, Janni WJ, Paprotka T, Wittenberger T, Menon U, Wahl B, Rack B, Lempiainen H. Methylation patterns in serum DNA for early identification of disseminated breast cancer. Genome Med 2017; 9:115. [DOI] [PMC free article] [PubMed] [Google Scholar]
Associated Data
This section collects any data citations, data availability statements, or supplementary materials included in this article.
Supplementary Materials
Supplemental material, sj-docx-1-ebm-10.1177_15353702221110642 for GP5 regulates epithelial–mesenchymal transition in breast cancer via the PI3K/AKT signaling pathway by Kui Xiang, Hua Yanshan, Zhao Chunmei, Guo Minmin, Wang Yan and Yi Xiaojia in Experimental Biology and Medicine


