Abstract
The hexosamine biosynthetic pathway (HBP) is connected to abnormal N- and O-linked protein glycosylation in cancer, which performs critical roles in tumorigenesis. However, the regulation mechanisms of HBP and its role in colorectal cancer (CRC) progression remain unexplained. This study analyzed the expression level of phosphoglucomutase 3 (PGM3), a key enzyme in HBP, and identified its function in CRC cell lines. Analysis of publicly available CRC microarray data determined that PGM3 is upregulated in CRC tumor tissues. Furthermore, functional experiments emphasized the significant roles of PGM3 in facilitating CRC cell proliferation and migration. Mechanistically, we demonstrated that the activity of β-catenin in CRC was maintained by PGM3-mediated O-GlcNAcylation. PGM3 knockdown or inhibition of O-GlcNAc transferase decreased β-catenin activity and the expression levels of its downstream targets. Collectively, our findings indicate that PGM3 exhibits tumor-promoting roles by elevating O-GlcNAcylation level and maintaining β-catenin activity, and might serve as a prognostic biomarker and treatment target in CRC.
Keywords: Colorectal cancer, PGM3, hexosamine biosynthetic pathway, O-GlcNAcylation, β-catenin, cancer progression
Impact Statement
This study focuses on the hexosamine biosynthetic pathway in colorectal cancer (CRC). Our findings elucidated the capabilities and underlying mechanisms of phosphoglucomutase 3 (PGM3) in colon cancer cells. The results demonstrated that PGM3 was remarkably upregulated in CRC and can promote the rapid growth of CRC cells. Furthermore, our findings revealed a PGM3/O-GlcNAcylation/β-catenin signaling pathway. These findings expanded our knowledge of the tumorigenic role of PGM3 in CRC, and also provided novel insights into the development of new prognostic biomarkers and therapeutic targets.
Introduction
Colorectal cancer (CRC) is one of the most frequently seen malignancies. In 2018, there were approximately 1,800,000 new cases of CRC, as well as 881,000 CRC-associated deaths on a global scale, and the number of young patients has been increasing year by year.1,2 The existing main treatment for CRC is surgery plus chemotherapy. A low rate of five-year survival persisted among the CRC patients despite advances in cytotoxic and targeted therapies.3,4 Therefore, it is quite important to comprehend the regulatory mechanisms contributing to colorectal carcinogenesis.
Reprogrammed metabolism is a hallmark of oncocytes and prominently influences a few cellular functions.5,6 Nutrient sensors exert primary effects on metabolic process regulation and cellular homeostasis maintenance, and the hexosamine biosynthetic pathway (HBP) is a key mechanism for detecting metabolic state. 7 The final product of HBP, uridine diphosphate N-acetyl glucosamine (UDP-GlcNAc), provides the GlcNAc residue for the O-GlcNAcylation processes.8,9 O-GlcNAcylation is capable of modifying a group of intracellular proteins and has been demonstrated to exert a crucial influence in cancer formation.10,11 Therefore, HBP and UDP-GlcNAc might be essential cell signaling regulators that promote tumor development and survival. However, the regulation mechanism of HBP and O-GlcNAcylation in CRC remains incompletely elucidated.
Phosphoglucomutase 3 (PGM3), also called N-acetylglucosamine-phosphate mutase (AGM1), is localized on human chromosome 6q14.1, which catalyzes the N-acetylglucosamine-6-phosphate to N-acetylglucosamine-1-phosphate conversion. Previously, the pro-tumorigenic functions of PGM3 have been reported in cancers of breast, uterine, prostate, and pancreas.12–15 PGM3 was significantly upregulated in CRC according to The Cancer Genome Atlas (TCGA) database. However, the biological function of PGM3 in colon cancer is still unclear. Consequently, the present work confirmed PGM3 expression level and identified its role in CRC cell lines.
In our study, we observed that PGM3 facilitated colon cancer cell proliferation and migration. In mechanistic terms, we clarified that O-GlcNAcylation mediated by PGM3 was responsible for sustaining the activity of β-catenin in CRC. PGM3 knockdown decreased β-catenin activity and the transcription of its downstream target genes.
Materials and methods
Expression data analysis
PGM3 expression data from public databases were utilized in this work. The gene expression in CRC was assessed based on the openly accessible The Cancer Genome Atlas (TCGA) data sets via UCSC Xena (https://xena.ucsc.edu). We downloaded the raw microarray expression data of the tissue specimens of the tumor and matched normal samples from the Gene Expression Omnibus (GEO) under the accession number GSE20916 and GSE110224. Protein immunohistochemistry for PGM3 was obtained from the Human Protein Atlas (https://www.proteinatlas.org).
Cell culture
Cultivation of HCT116, SW480, HCT15, HT29, RKO, and NCM460 cells was accomplished using 10% (vol/vol) fetal bovine serum (FBS)-involving Dulbecco’s modified eagle medium (DMEM) with proper penicillin/streptomycin amounts in an incubator set under 37°C and 5% CO2 conditions.
Plasmid and siRNA
The plasmid and RNAi oligonucleotides were transfected into cells with Lipofectamine 2000 (Invitrogen). The plasmid flag-PGM3 was purchased from Youbao Bio (Shanghai, China). To generate stable PGM3 over-expression cell lines, medium with 800 mg/mL G418 was added into the cells 24 h after transfection, and cells stably expressing PGM3 were maintained in medium with 400 mg/mL G418. For siRNA-mediated knockdown, the cells were transfected with 100nM of non-specific siRNA or PGM3 siRNA. After incubation for 48 h, the cells were treated as indicated. Sequences of RNAi oligonucleotides are as follows: PGM3-1# siRNA sense strand: 5′-GACAAGATAGCAACGTTAA-3′; PGM3-2# siRNA sense strand: 5′-CAGTGAGAAACTTTCACAATC-3′. Shanghai GenePharma Company provided all of the RNAi oligonucleotides.
Antibodies and reagents
The antibodies used were anti-PGM3 (Santa Cruz, #sc-390239), anti-β-actin (Santa Cruz, #sc-7210), anti-lamin B1 (Proteintech, #12987), anti-tubulin (Proteintech, #11224), anti-Flag-tag (Sigma-Aldrich, #F1804), anti-β-catenin (CST, #8480), anti-c-Myc (Proteintech, #67447), anti-cyclin D1 (CST, #2978), and anti-O-linked N-Acetylglucosamine (abcam, #ab2739).
Cycloheximide (CHX, HY-12320) was purchased from MCE; OMSI-1 (S9835) and KYA1797K (S8327) were purchased from Selleck; and UDP-GlcNAc (U33645) was purchased from HARVEYBIO.
RNA extraction and real-time polymerase chain reaction
This work utilized TRIzol (Invitrogen) for extracting total RNA following the specific protocol. Reverse transcription was carried out with random primers, while SYBR-Green mix (Invitrogen) was utilized to run real-time polymerase chain reaction (PCR) using the 7500 real-time PCR System (Applied Biosystems). Through melting curve analysis, ΔΔCT analysis was applied to determine real-time PCR results. Each analysis was carried out three times. The real-time PCR sequences are as follows:
β-actin: CCAACCGCGAGAAGATGA, CCAGAGGCGTACAGGGATAG;
PGM3: GCAGAGAGTGCTTATTGACATCA, TGTGAAAGTTTCTCACTGCTGG;
β-catenin: AAAGCGGCTGTTAGTCACTGG, CGAGTCATTGCATACTGTCCAT;
c-Myc: GTCAAGAGGCGAACACACAAC, TTGGACGGACAGGATGTATGC;
cyclin D1: CAATGACCCCGCACGATTTC, CATGGAGGGCGGATTGGAA.
Protein extraction and western blotting
Cellular protein lysis was prepared with RIPA lysis buffer. The BCA Protein Assay Kit was used to measure protein concentrations. For western blot analysis, after loading 20 μg proteins on the gel, we conducted 8–10% SDS-polyacrylamide gel electrophoresis (PAGE) for protein separation, which was later transferred onto polyvinylidene difluoride (PVDF) membranes. Thereafter, we used 5% defatted milk for membrane blocking for a 2-h period, followed by overnight primary antibody incubation under 4°C. On day 2, a secondary antibody was added to incubate membranes under ambient temperature for another 1-h period. Membranes were then rinsed, and enhanced chemiluminescence (Bio-Rad) was used to detect protein bands. Band densities were quantified by ImageJ software.
CCK-8
CRC cancer cells (2000/well) were inoculated into the 96-well plates which contained 100 μL medium in each well. CCK-8 kit (Beyotime Biotechnology) was employed for measuring cell viability.
EdU proliferation assay
EdU staining was completed in line with specific protocols (Cell-Light™ EdU Apollo®643 In Vitro Imaging Kit, RIBOBIO). Later, three fields of view (FOVs) were captured to determine the total cell and EdU-positive cell numbers with ImageJ, followed by calculating the EdU-positive cell proportion.
Colony formation
We inoculated transfected cells (1000/well) in the six-well plates, followed by fixation and staining with 0.5% crystal violet when observable colonies formed in the following 14 days. Each assay was conducted thrice.
Annexin V-fluorescein isothiocyanate/propidium iodide staining
This work determined cell apoptosis by Annexin V-FITC/PI triple-staining system. FITC Annexin V Apoptosis Detection Kit II (BD Biosciences) was used following the manufacturer’s instructions.
Transwell assay
In transwell migration as well as invasion assays, 5 × 10³ and 1 × 10⁴ cells were suspended in 100 µL serum-free medium, followed by adding suspension into the top chambers (#353097 for migration and #354480 for invasion, Corning), whereas medium that contained 10% FBS was added into the bottom chambers (24-well plates, Corning). After 24 h, we eliminated cells on the upper chamber surface and used methanol to fix those migrating to the bottom membrane surface. Later, migrating cells were subject to 0.1% crystal violet staining and their number was determined in three randomly selected FOVs.
Wound healing assays
HCT15 and SW480 cells transfected with siRNA or plasmid were inoculated in six-well plates. After achieving full confluence, the sterile p200 pipette tip was utilized to scratch wounds, followed by phosphate buffer saline (PBS) washing. Thereafter, at 0 and 24 h, we observed the wounds at identical positions. ImageJ was utilized to measure the mean healing area.
Subcutaneous xenograft model
Six-week-old female Balb/c nude mice (20 g) were obtained from Vital River Laboratory Animal and randomly divided into two groups (n = 4 each). 1 × 10⁶ HCT15 cells transfected with PGM3 shRNA or scramble were subcutaneously injected into the right inguinal region of the mice. The animals were sacrificed after four weeks to dissect the tumor tissues. The Laboratory Animal Center Affiliated to Capital Medical University approved our animal studies.
Luciferase reporter assay
TCF wild-type (TOPFlash) or mutated control (FOPFlash) luciferase reporter plasmids were purchased from Beyotime Biotechnology. At 24 h posttransfection, we adopted Dual-Luciferase Reporter Assay System (Promega) for measuring luciferase activities, with Renilla activity being the internal reference.
Cellular fractionation
SW480 cells were cultured in 10-cm culture dishes and transfected with flag-PGM3 plasmid. About 24 h later, the cells were harvested. The Nuclear and Cytoplasmic Protein Extraction Kit (Beyotime Biotechnology) was adopted to separate cytosolic and nuclear fractions.
Statistical analysis
Results were represented by mean values ± standard error of the mean (SEM). GraphPad Prism 5.0 was utilized for statistical analysis. Comparison across several groups was completed using one-way analysis of variance (ANOVA), while that between two groups was completed with unpaired student’s t-tests (*P < 0.05, **P < 0.01).
Results
High PGM3 expression in CRC
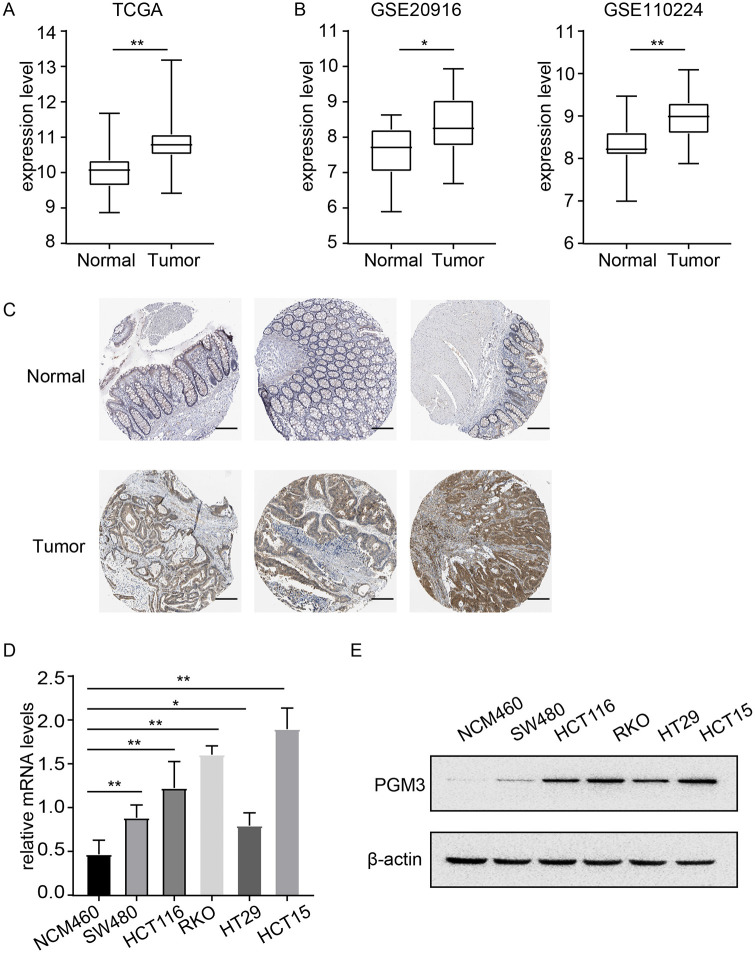
We first analyzed the mRNA expression data from TCGA and GEO database to clarify the expression level of PGM3 in CRC. As can be seen in Figure 1(A), PGM3 expression was dramatically upregulated in CRC tissues compared with normal or adjacent normal tissues in TCGA database (P < 0.01). Further verification in two independent GEO CRC data sets (GSE20916 and GSE110224) also confirmed that PGM3 expression was higher in CRC as compared to healthy tissues (Figure 1(B)). The protein expression level of PGM3 in CRC was explored using the HPA database. Notably, PGM3 was not expressed in normal colon tissues, whereas medium and high expression levels of PGM3 can be observed in colon cancer tissues (Figure 1(C)).
Figure 1.
PGM3 is over-expressed in CRC. (A) In TCGA database, PGM3 level was found to be higher in CRC tissues than in normal tissues. (B) Variation in PGM3 mRNA expression level between normal tissues and CRC based on GEO data sets (GSE20916 and GSE110224). (C) Representative immunohistochemistry images of PGM3 in CRC and non-cancerous colon tissues derived from the HPA database. The scale bar is 100 μm. (D) PGM3 mRNA expression levels in CRC cells and normal colonic NCM460 cells. (E) PGM3 protein levels in CRC cells and NCM460 were measured using western blotting. (A color version of this figure is available in the online journal.)
Moreover, PGM3 mRNA and protein levels were measured in five CRC cell lines (SW480, HCT116, HT29, HCT15, and RKO) and human normal colorectal epithelial cell line NCM460. Compared to NCM460 cells, PGM3 expression was shown to be much higher in CRC cell lines, particularly in RKO and HCT15 cells (Figure 1(D) and (E)).
PGM3 knockdown suppresses CRC cells proliferation and migration
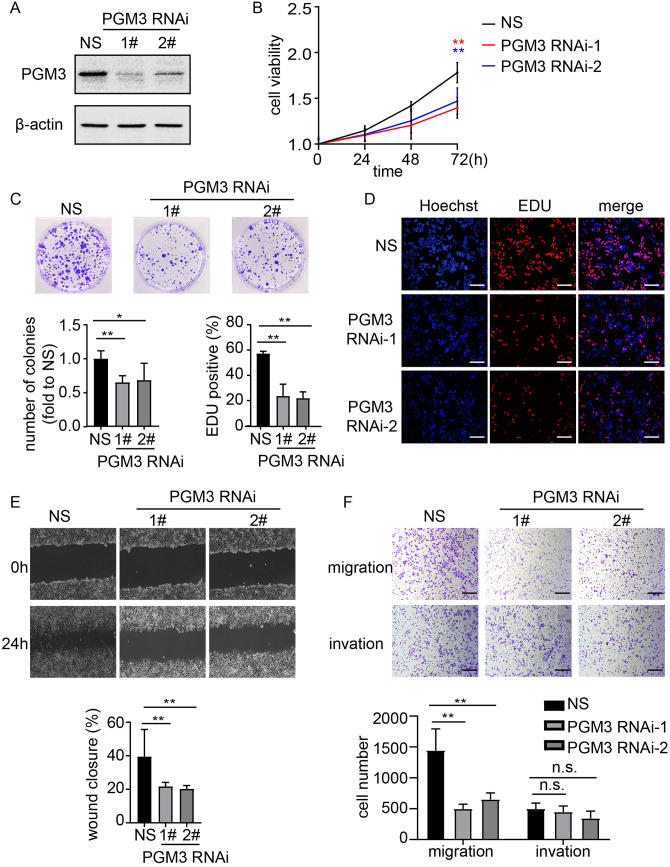
To discover whether PGM3 altered the proliferation of CRC cells, HCT15 and RKO cells were transduced with siRNAs to knockdown PGM3 expression. As illustrated in Figure 2(A) and Figure S1A-B, both cell lines transduced with PGM3 siRNAs had significantly lower PGM3 mRNA and protein levels compared to non-target scrambled siRNA (NS). The cell viability of HCT15 cells was considerably reduced at 72 h after siRNA treatment compared with NS cells as determined by CCK-8 assays (Figure 2(B)). Similar results were observed in RKO cells (Figure S1C). Repressed cell proliferation via PGM3 knockdown was also confirmed by colony formation assays (Figure 2(C)). Moreover, PGM3 knockdown resulted in a substantial decrease in EdU incorporation in an EdU proliferation assay in HCT15 (Figure 2(D)). Besides, the role of PGM3 in cell apoptosis was also investigated. Our results demonstrated that PGM3 knockdown did not significantly induce cell apoptosis (Figure S1D). These results indicate that PGM3 knockdown affects CRC cell proliferation but not apoptosis.
Figure 2.
PGM3 is necessary for CRC proliferation and migration. (A) Non-specific siRNA or PGM3 siRNA was transfected into HCT15 cells. 48 h after transfection, cells were harvested, and PGM3 level was measured using western blotting. (B) Cell proliferation after PGM3 silencing in HCT15 cell lines was determined by CCK-8 assay. (C) Non-specific siRNA or PGM3 siRNA was transfected into HCT15 cells. After two weeks, crystal violet staining was used to examine the colony formation. (D) Graphical representation of EdU images and quantification of EdU-positive cells in HCT15 cells after PGM3 knockdown. The scale bar is 100 μm. (E) Wound healing assays were used to examine migration of PGM3 knockdown HCT15 cells. The images of wound closure are presented at 0 or 24 h after scratching. (F) Transwell assays were used to look at the potential migration and invasion of PGM3 knockdown HCT15 cells. Following a 24 h culture period, the number of migratory and invaded cells was counted. The scale bar is 100 μm. (A color version of this figure is available in the online journal.)
The migration and invasion of CRC cell lines were measured using wound healing assays and transwell assays. PGM3 knockdown in HCT15 was found to disrupt the cells’ wound closing behavior (Figure 2(E)). Transwell assays revealed that knockdown of PGM3 limits the migration of CRC cells without consistent effects on invasion (Figure 2(F)).
PGM3 depletion reduces tumor growth in vivo
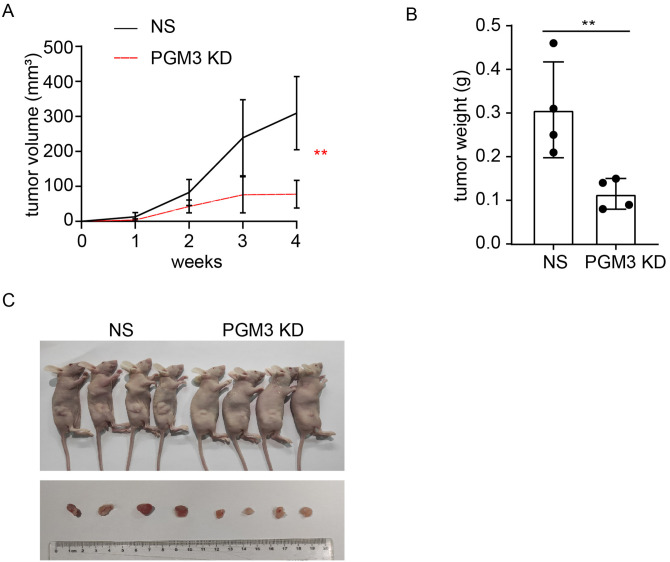
To determine the tumorigenic capacity of PGM3, HCT15 cells stably transfected with NS and shPGM3 were subcutaneously injected into the mice, respectively. Tumor development was slower in the shPGM3 group compared to the NS group (Figure 3(A)). And knockdown of PGM3 in HCT15 cells markedly reduced the size and weight of tumor (Figure 3(B) and (C)). The tumor-promoting role of PGM3 in CRC is proved by these in vivo experiments. Taken together, we concluded that PGM3 is necessary for CRC cell growth.
Figure 3.
PGM3 knockdown limits tumor growth in vivo. (A) PGM3 KD or negative control HCT15 cells were injected into nude mice, and tumor growth was monitored during the indicated weeks (four mice per group). (B and C) Xenograft weight and size were measured. (A color version of this figure is available in the online journal.)
PGM3 over-expression promotes CRC cell proliferation and migration
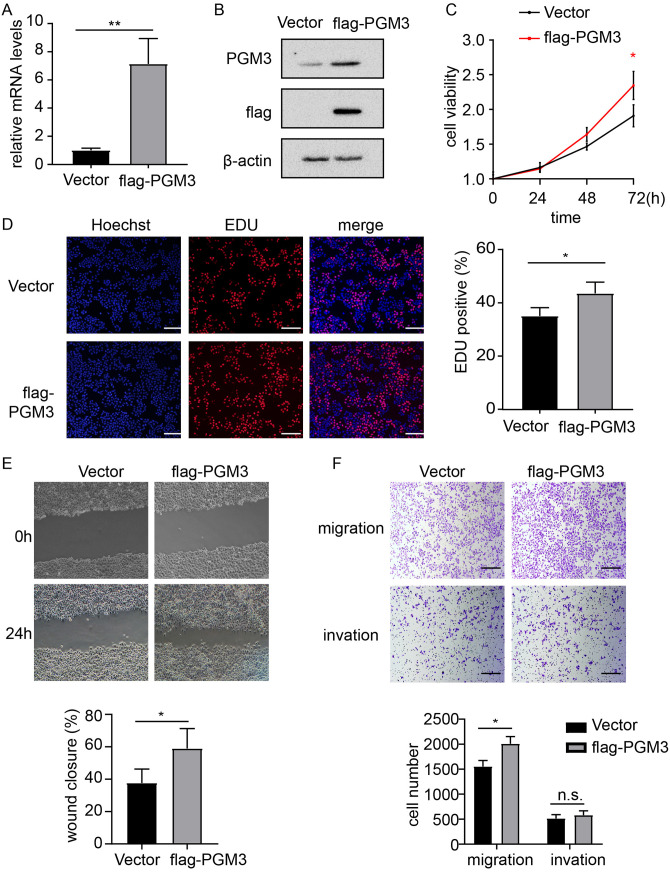
Since PGM3 knockdown decreased CRC cell proliferation and migration, the effect of PGM3 over-expression was investigated. Flag-PGM3 and empty vector plasmid were separately transfected into SW480 cells. Real-time PCR analysis indicated that PGM3 mRNA level was elevated in PGM3 over-expression SW480 cells compared with in SW480/vector cells (Figure 4(A)). Western blotting analysis also revealed that PGM3 protein level was higher in SW480/PGM3 cells compared with in the SW480/vector cells (Figure 4(B)). CCK-8 assays and colony formation assays showed a significant difference in cell proliferation activity between SW480/PGM3 cells and the control SW480/vector cells, indicating that PGM3 promotes SW480 cell proliferation (Figure 4(C) and Figure S2A). EdU proliferation assay showed that PGM3 over-expression increases EdU incorporation in SW480 (Figure 4(D)). Besides, we detected the effect of PGM3 over-expression on apoptosis and found that PGM3 over-expression did not alter apoptosis compared to control cells (Figure S2B). In addition, wound healing and transwell assays were performed to measure the effect of PGM3 over-expression on cell migration and invasion. Over-expression of PGM3 led to increased cell migration (Figure 4(E) and (F)), but it did not affect invasion in SW480 (Figure 4(F)). These data demonstrated that over-expression of PGM3 dramatically promoted the proliferation and migration of colon cancer cells.
Figure 4.
PGM3 promotes progression of CRC. (A) Empty vector or flag-PGM3 plasmid was transfected into SW480 cells. 24 h after transfection, RNA was extracted and analyzed with real-time PCR. (B) Empty vector or flag-PGM3 plasmid was transfected into SW480 cells. 24 h after transfection, cells were harvested, and western blotting was performed to detect PGM3 protein level. (C) Cell proliferation after PGM3 over-expression in SW480 cells was determined by CCK-8 assay. (D) Graphical representation of EdU images and quantification of EdU-positive cells in PGM3-over-expressed SW480 cells. The scale bar is 100 μm. (E) Wound healing assays were used to examine migration of PGM3 over-expression SW480 cells. The images of wound closure are presented at 0 or 24 h after scratching. (F) Transwell assays were used to look at the potential migration and invasion of PGM3 over-expression SW480 cells. Following a 24-h culture period, the number of migratory and invaded cells was counted. The scale bar is 100 μm. (A color version of this figure is available in the online journal.)
PGM3 activated the Wnt/β-catenin signaling pathway
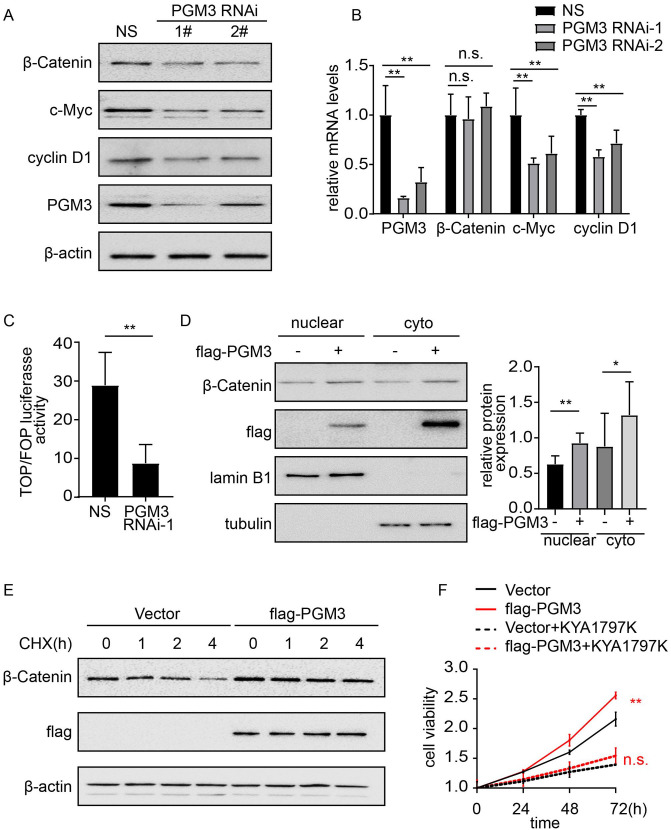
It has been reported that HBP gene signature has a strong relationship with the activity of Wnt/β-catenin signaling. 16 Moreover, Wnt/β-catenin pathway activation plays a vital role in the development and progression of CRC. 17 Therefore, we tested whether PGM3 affects β-catenin signaling in CRC. Western blotting analysis was performed to measure the expression levels of β-catenin and its downstream targets including c-Myc and cyclin D1 in PGM3 over-expression and knockdown cells. As shown in Figure 5(A), PGM3 downregulation decreased total β-catenin levels and its downstream targets. In turn, over-expression of PGM3 elevated the expression of β-catenin, c-Myc, and cyclin D1 in SW480 cell lines (Figure S3A), whereas β-catenin mRNA level indicated no apparent differences in the PGM3 over-expression or knockdown cells (Figure 5(B) and Figure S3B), suggesting β-catenin regulation at the posttranscriptional level. To further establish whether Wnt/β–catenin pathway was activated by PGM3 in CRC cells, we conducted a luciferase experiment with the TOP/FOP Flash reporter. A significant reduction of the luciferase activity was observed in HCT15 cells when PGM3 was knockdown by siRNA (Figure 5(C)), and our results showed that PGM3 increased luciferase activity dramatically in SW480 cells (Figure S3 C). These results imply that PGM3 stimulates the Wnt/β–catenin pathway in CRC cells. Next, immunoblotting was used to see if PGM3 affects the nuclear location of β-catenin. We discovered that the nuclear β-catenin increased after over-expressing PGM3 in SW480 cells (Figure 5(D)). Therefore, the oncogenic effects of PGM3 could be attributed to PGM3-mediated activation of Wnt/β-catenin signaling, as PGM3 elevated luciferase activity of TOPFlash reporter and upregulated β-catenin and its downstream targets. Subsequently, we performed cycloheximide (CHX) chase experiment to examine the mechanism behind the rise in β-catenin expression caused by PGM3 over-expression. The degradation rate of β-catenin was slower in SW480 cells that were transfected with PGM3 plasmid compared with cells treated with control empty vector (Figure 5(E) and Figure S3D). According to these findings, PGM3 increased β-catenin protein expression via lowering its degradation.
Figure 5.
Wnt/β-catenin signaling pathway is activated by PGM3. (A) Non-specific siRNA or PGM3 siRNA was transfected into HCT15 cells. 48 h after transfection, cells were collected, and western blotting was performed to detect β-catenin, c-Myc, and cyclin D1 protein levels. (B) Non-specific siRNA or PGM3 siRNA was transfected into HCT15 cells. 48 h after transfection, RNA was extracted and analyzed with real-time PCR. (C) The indicated siRNA and TOP/ FOP Flash reporter plasmid were co-transfected into HCT15 cells. 48 h later, luciferase activity was measured. (D) Empty vector or flag-PGM3 plasmid was transfected into SW480 cells. 24 h after transfection, β-catenin expression level in the nuclear and cytoplasm was assessed by western blotting. (E) PGM3 plasmid was transfected into SW480 cells, which were then treated with or without 50 μM CHX, western blotting was used to detect β-catenin level. (F) PGM3 plasmid was transfected into SW480 cells, which were then treated with or without 25μM KYA1797K, CCK-8 was used to examine cell proliferation. (A color version of this figure is available in the online journal.)
Moreover, pharmacological inhibition of Wnt/β-catenin pathway with KYA1797K inhibited SW480/PGM3 cell proliferation and migration (Figure 5(F) and Figure S3E-F), which supported the finding that upregulation of Wnt/β-catenin pathway was responsible for PGM3 induced promotion of cell viability and migration.
PGM3 enhances β-catenin expression and promotes cell proliferation and migration by elevating O-GlcNAcylation level
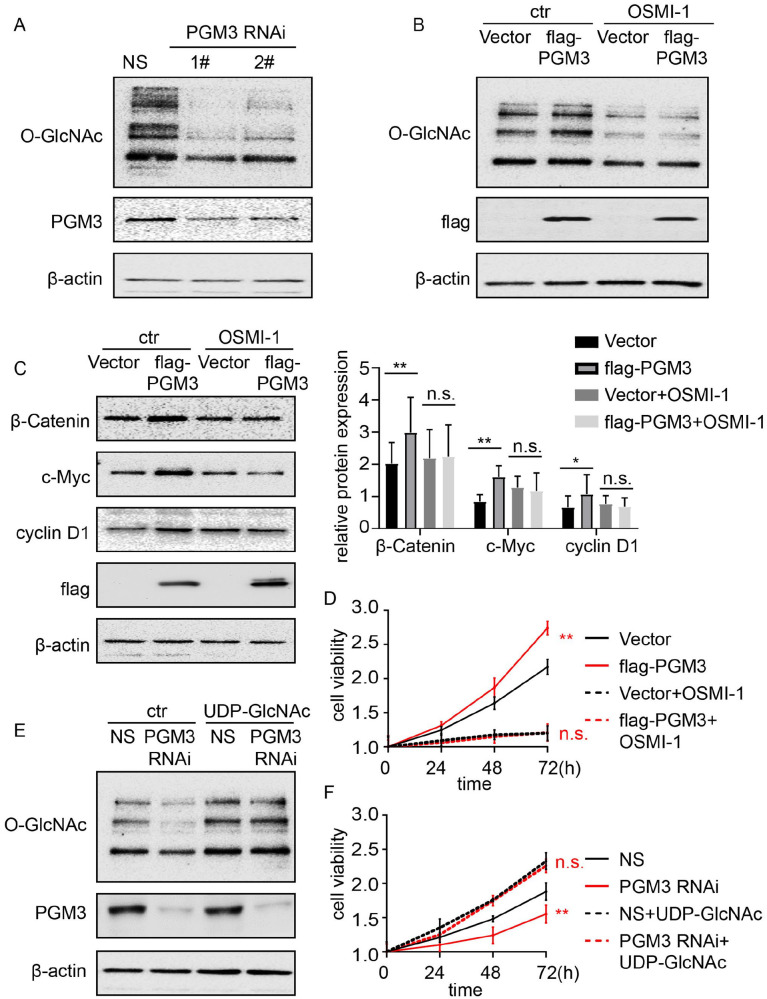
UDP-GlcNAc, the main end product of the HBP, is the substrate for the O-GlcNAcylation processes. Accordingly, we test whether O-GlcNAc level is regulated by PGM3 in colon cancer. Western blotting analysis was utilized to measure the amounts of O-GlcNAc in PGM3 knockdown cell lines. We observed that O-GlcNAc level positively correlates with PGM3 expression (Figure 6(A)). Meanwhile, PGM3-induced O-GlcNAc expression can be suppressed by O-GlcNAc transferase inhibitor OMSI-1 (Figure 6(B)).
Figure 6.
PGM3 enhances β-catenin activity and accelerates cell proliferation by elevating O-GlcNAcylation level. (A) Non-specific siRNA or PGM3 siRNA was transfected into HCT15 cells. 48 h after transfection, cells were harvested, and O-GlcNAc protein level was measured using western blotting. (B) PGM3 plasmid was transfected into SW480 cells, which were then treated with or without 30μM OMSI-1 for 24 h, O-GlcNAc protein level was measured using western blotting. (C) PGM3 plasmid was transfected into SW480 cells, which were then treated with or without 30μM OMSI-1 for 24 h, β-catenin, c-Myc, and cyclin D1 protein levels were measured by western blotting. (D) PGM3 plasmid was transfected into SW480 cells, which were then treated with or without 30μM OMSI-1, CCK-8 was used to examine cell proliferation. (E) PGM3 siRNA was transfected into HCT15 cells, which were then treated with or without 50 mM UDP-GlcNAc for 24 h, O-GlcNAc level was analyzed by western blotting. (F) PGM3 siRNA was transfected into HCT15 cells, which were then treated with or without 50 mM UDP-GlcNAc, CCK-8 was used to examine cell proliferation. (A color version of this figure is available in the online journal.)
Given that β-catenin expression is positively related to O-GlcNAcylation level,18–21 we then looked into whether the elevation in β-catenin level observed upon PGM3 over-expression via increasing O-GlcNAcylation level. As expected, OMSI-1 significantly reversed PGM3-caused increased β-catenin expression (Figure 6(C)), and further inhibited proliferation and migration of PGM3 over-expression cells (Figure 6(D) and Figure S4A). The effect of increased O-GlcNAcylation on tumor proliferation was then investigated, as shown in Figure 6(E) and (F) and Figure S4B, addition of 50 mM UDP-GlcNAc was adequate to restore the repressive effects on cell proliferation and migration of PGM3 RNAi cells. These results indicate that PGM3 enhances β-catenin expression and accelerates cancer progression by promoting O-GlcNAcylation level.
Discussion
Aberrant expression of PGM3 has been found in various types of cancer and plays different roles in tumorigenesis. For example, PGM3 inhibition downregulates protein glycosylation and triggers a sustained unfolded protein response (UPR), and then to cell death in pancreatic cancer, while PGM3 over-expression results in gemcitabine resistance. 12 Similarly, suppression of the PGM3 function by a specific inhibitor FR054 improves the susceptibility of pancreatic cancer cells to a pan-RAS inhibitor. 14 PGM3 inhibition through FR054 induces breast cancer growth arrest and apoptosis. 15 Meanwhile, PGM3 expression is elevated in prostate cancer samples, suggesting a pro-oncogenic role for PGM3. 22 In a separate study, PGM3 knockdown accelerates sulforaphane-induced cell death in LNCaP prostate cancer cells, indicating that PGM3 could be used as a therapeutic target. 13 However, the expression and functions of PGM3 in CRC are still unknown. We discovered that PGM3 is substantially upregulated in CRC and serves a function in CRC cell proliferation and migration.
The elevated level of O-GlcNAcylation in colon cancer has been described, and the reasons and consequences of this higher level have been partially uncovered.21,23 For example, O-GlcNAc transferase (OGT) is upregulated in colon cancer cells compared with normal cells, OGT impacts progression of colon cancer cells. 23 Our data showed that the O-GlcNAc level was regulated by PGM3 in CRC. The tumor-promoting effect of PGM3 was completely blocked by the OGT inhibitor, indicating that PGM3-mediated O-GlcNAcylation plays a crucial role in CRC progression.
Accumulated evidence has demonstrated that O-GlcNAcylation is linked to a variety of biological activities, including transcription, translation, epigenetics, and signaling transduction. Although studies have revealed a connection between increased O-GlcNAcylation expression and colon tumor development, the mechanisms by which aberrant O-GlcNAcylation expression regulates colon tumor progression have yet to be thoroughly understood.24,25 Here, we found that PGM3-mediated O-GlcNAcylation regulated β-catenin activities, the activity of β-catenin was suppressed by PGM3 knockdown or O-GlcNAc transferase inhibitor, suggesting that the oncogenic Wnt/β-catenin signaling pathway is presumably maintained in part by PGM3-mediated O-GlcNAcylation. Our data have shown that the β-catenin inhibitor KYA1797K moiety abrogated the tumor-promoting effects of PGM3 (Figure 5(F)). It has been proven that several molecules related to tumorigenesis and development are regulated by O-GlcNAcylation, including Yes-associated protein, phosphoglycerate kinase 1, glucose-6-phosphate dehydrogenase, and so on.26–28 Whether these molecules participate in PGM3-mediated CRC carcinogenesis should be explored in future studies.
Wnt/β-catenin pathway is critical to tumorigenesis. Multiple studies have suggested that β-catenin protein level and activity are related to a variety of biological processes in cancer. 17 Over-expression of β-catenin, which occurs in 80–90% of CRC cases, is a crucial molecular event in CRC carcinogenesis. 29 Cellular β-catenin level is regulated by various mechanisms. 30 Further investigation of the processes that activate β-catenin could provide a useful model for studying the molecular basis of CRC and developing targeted anti-cancer therapeutics. Hence, decreasing β-catenin activity by targeting PGM3 could have an antitumor effect.
In conclusion, the findings of this research indicate that PGM3 serves a function in proliferation and migration of colon cancer cells. Blockade of PGM3 has potent antitumor effects via disruption the O-GlcNAcylation of β-catenin in CRC cells. Thus, targeting PGM3 may be a novel therapeutic intervention for colon cancer treatment.
Supplemental Material
Supplemental material, sj-pdf-1-ebm-10.1177_15353702221101810 for PGM3 regulates beta-catenin activity to promote colorectal cancer cell progression by Nan Zhang, Si Liu, Junxuan Xu, Tingting Ning, Sian Xie, Li Min, Shengquan Zhu, Shutian Zhang and Shengtao Zhu in Experimental Biology and Medicine
Footnotes
Authors’ Contributions: NZ performed most of the experimental work; SL, JX, TN, and SX assisted in analyzed data; SZ performed western blotting; LM and SZ helped with the design of some experiments; NZ and SZ designed and supervised the experiments and wrote the manuscript; and All authors critically read the paper.
The author(s) declared no potential conflicts of interest with respect to the research, authorship, and/or publication of this article.
Funding: The author(s) disclosed receipt of the following financial support for the research, authorship, and/or publication of this article: This research was supported by National Natural Science Foundation of China [82103198]; Research Foundation of Beijing Friendship Hospital, Capital Medical University (yyqdkt2020-8) and (YYZZ202108).
ORCID iD: Nan Zhang  https://orcid.org/0000-0002-3353-2359
Supplemental Material: Supplemental material for this article is available online.
References
- 1. Miller KD, Nogueira L, Mariotto AB, Rowland JH, Yabroff KR, Alfano CM, Jemal A, Kramer JL, Siegel RL. Cancer treatment and survivorship statistics, 2019. CA Cancer J Clin 2019;69:363–85 [DOI] [PubMed] [Google Scholar]
- 2. Siegel RL, Miller KD, Goding Sauer A, Fedewa SA, Butterly LF, Anderson JC, Cercek A, Smith RA, Jemal A. Colorectal cancer statistics, 2020. CA Cancer J Clin 2020;70:145–64 [DOI] [PubMed] [Google Scholar]
- 3. Jemal A, Ward EM, Johnson CJ, Cronin KA, Ma J, Ryerson B, Mariotto A, Lake AJ, Wilson R, Sherman RL, Anderson RN, Henley SJ, Kohler BA, Penberthy L, Feuer EJ, Weir HK. Annual report to the nation on the status of cancer, 1975-2014, featuring survival. J Natl Cancer Inst 2017;109:1–22 [DOI] [PMC free article] [PubMed] [Google Scholar]
- 4. Xie Y-H, Chen Y-X, Fang J-Y. Comprehensive review of targeted therapy for colorectal cancer. Signal Transduct Target Ther 2020;5:22–51. [DOI] [PMC free article] [PubMed] [Google Scholar]
- 5. Pavlova NN, Thompson CB. The emerging hallmarks of cancer metabolism. Cell Metab 2016;23:27–47 [DOI] [PMC free article] [PubMed] [Google Scholar]
- 6. Faubert B, Solmonson A, DeBerardinis RJ. Metabolic reprogramming and cancer progression. Science 2020;368:eaaw5473 [DOI] [PMC free article] [PubMed] [Google Scholar]
- 7. Metallo CM, Vander Heiden MG. Metabolism strikes back: metabolic flux regulates cell signaling. Genes Dev 2010;24:2717–22 [DOI] [PMC free article] [PubMed] [Google Scholar]
- 8. Wellen KE, Thompson CB. Cellular metabolic stress: considering how cells respond to nutrient excess. Mol Cell 2010;40:323–32 [DOI] [PMC free article] [PubMed] [Google Scholar]
- 9. Ma J, Wu C, Hart GW. Analytical and biochemical perspectives of protein O-GlcNAcylation. Chem Rev 2021;121:1513–81 [DOI] [PubMed] [Google Scholar]
- 10. Fardini Y, Dehennaut V, Lefebvre T, Issad T. O-GlcNAcylation: a new cancer hallmark? Front Endocrinol 2013;4:99–112 [DOI] [PMC free article] [PubMed] [Google Scholar]
- 11. Ferrer CM, Sodi VL, Reginato MJ. O-GlcNAcylation in cancer biology: linking metabolism and signaling. J Mol Biol 2016;428:3282–94 [DOI] [PMC free article] [PubMed] [Google Scholar]
- 12. Ricciardiello F, Gang Y, Palorini R, Li Q, Giampà M, Zhao F, You L, La Ferla B, De Vitto H, Guan W, Gu J, Zhang T, Zhao Y, Chiaradonna F. Hexosamine pathway inhibition overcomes pancreatic cancer resistance to gemcitabine through unfolded protein response and EGFR-Akt pathway modulation. Oncogene 2020;39:4103–17 [DOI] [PubMed] [Google Scholar]
- 13. Lee C-H, Jeong S-J, Yun S-M, Kim J-H, Lee H-J, Ahn KS, Won S-H, Kim HS, Lee H-J, Ahn K-S, Zhu S, Chen C-Y, Kim S-H. Down-regulation of phosphoglucomutase 3 mediates sulforaphane-induced cell death in LNCaP prostate cancer cells. Proteome Sci 2010;8:67–74 [DOI] [PMC free article] [PubMed] [Google Scholar]
- 14. Ricciardiello F, Bergamaschi L, De Vitto H, Gang Y, Zhang T, Palorini R, Chiaradonna F. Suppression of the HBP function increases pancreatic cancer cell sensitivity to a pan-RAS inhibitor. Cells 2021;10:1–19 [DOI] [PMC free article] [PubMed] [Google Scholar]
- 15. Ricciardiello F, Votta G, Palorini R, Raccagni I, Brunelli L, Paiotta A, Tinelli F, D’Orazio G, Valtorta S, De Gioia L, Pastorelli R, Moresco RM, La Ferla B, Chiaradonna F. Inhibition of the hexosamine biosynthetic pathway by targeting PGM3 causes breast cancer growth arrest and apoptosis. Cell Death Dis 2018;9:377–93 [DOI] [PMC free article] [PubMed] [Google Scholar]
- 16. Jia C, Li H, Fu D, Lan Y. GFAT1/HBP/O-GlcNAcylation axis regulates β-catenin activity to promote pancreatic cancer aggressiveness. Biomed Res Int 2020;2020:1921609. [DOI] [PMC free article] [PubMed] [Google Scholar]
- 17. Caspi M, Wittenstein A, Kazelnik M, Shor-Nareznoy Y, Rosin-Arbesfeld R. Therapeutic targeting of the oncogenic Wnt signaling pathway for treating colorectal cancer and other colonic disorders. Adv Drug Deliv Rev 2021;169:118–36 [DOI] [PubMed] [Google Scholar]
- 18. Gao S, Miao Y, Liu Y, Liu X, Fan X, Lin Y, Qian P, Zhou J, Dai Y, Xia L, Zhu P, Zhu J. Reciprocal regulation between O-GlcNAcylation and β-catenin facilitates cell viability and inhibits apoptosis in liver cancer. DNA Cell Biol 2019;38:286–96 [DOI] [PubMed] [Google Scholar]
- 19. Olivier-Van Stichelen S, Dehennaut V, Buzy A, Zachayus J-L, Guinez C, Mir A-M, El Yazidi-Belkoura I, Copin M-C, Boureme D, Loyaux D, Ferrara P, Lefebvre T. O-GlcNAcylation stabilizes β-catenin through direct competition with phosphorylation at threonine 41. FASEB J 2014;28:3325–38 [DOI] [PMC free article] [PubMed] [Google Scholar]
- 20. Harosh-Davidovich SB, Khalaila I. O-GlcNAcylation affects β-catenin and E-cadherin expression, cell motility and tumorigenicity of colorectal cancer. Exp Cell Res 2018;364:42–9 [DOI] [PubMed] [Google Scholar]
- 21. Olivier-Van Stichelen S, Guinez C, Mir A-M, Perez-Cervera Y, Liu C, Michalski J-C, Lefebvre T. The hexosamine biosynthetic pathway and O-GlcNAcylation drive the expression of β-catenin and cell proliferation. Am J Physiol Endocrinol Metab 2012;302:E417–24 [DOI] [PubMed] [Google Scholar]
- 22. Munkley J, Vodak D, Livermore KE, James K, Wilson BT, Knight B, McCullagh P, McGrath J, Crundwell M, Harries LW, Leung HY, Robson CN, Mills IG, Rajan P, Elliott DJ. Glycosylation is an androgen-regulated process essential for prostate cancer cell viability. EBioMedicine 2016;8:103–16 [DOI] [PMC free article] [PubMed] [Google Scholar]
- 23. Steenackers A, Olivier-Van Stichelen S, Baldini SF, Dehennaut V, Toillon R-A, Le Bourhis X, El Yazidi-Belkoura I, Lefebvre T. Silencing the nucleocytoplasmic O-GlcNAc transferase reduces proliferation, adhesion, and migration of cancer and fetal human colon cell lines. Front Endocrinol 2016;7:46–55 [DOI] [PMC free article] [PubMed] [Google Scholar]
- 24. Jiang M, Xu B, Li X, Shang Y, Chu Y, Wang W, Chen D, Wu N, Hu S, Zhang S, Li M, Wu K, Yang X, Liang J, Nie Y, Fan D. O-GlcNAcylation promotes colorectal cancer metastasis via the miR-101-O-GlcNAc/EZH2 regulatory feedback circuit. Oncogene 2019;38:301–16 [DOI] [PMC free article] [PubMed] [Google Scholar]
- 25. Decourcelle A, Very N, Djouina M, Loison I, Thévenet J, Body-Malapel M, Lelièvre E, Coqueret O, Leprince D, El Yazidi-Belkoura I, Dehennaut V. O-GlcNAcylation links nutrition to the epigenetic downregulation of UNC5A during colon carcinogenesis. Cancers 2020;12:3168–88 [DOI] [PMC free article] [PubMed] [Google Scholar]
- 26. Rao X, Duan X, Mao W, Li X, Li Z, Li Q, Zheng Z, Xu H, Chen M, Wang PG, Wang Y, Shen B, Yi W. O-GlcNAcylation of G6PD promotes the pentose phosphate pathway and tumor growth. Nat Commun 2015;6:8468. [DOI] [PMC free article] [PubMed] [Google Scholar]
- 27. Nie H, Ju H, Fan J, Shi X, Cheng Y, Cang X, Zheng Z, Duan X, Yi W. O-GlcNAcylation of PGK1 coordinates glycolysis and TCA cycle to promote tumor growth. Nat Commun 2020;11:36. [DOI] [PMC free article] [PubMed] [Google Scholar]
- 28. Peng C, Zhu Y, Zhang W, Liao Q, Chen Y, Zhao X, Guo Q, Shen P, Zhen B, Qian X, Yang D, Zhang JS, Xiao D, Qin W, Pei H. Regulation of the Hippo-YAP pathway by glucose sensor O-GlcNAcylation. Mol Cell 2017;68:591–604.e5 [DOI] [PubMed] [Google Scholar]
- 29. Morin PJ, Sparks AB, Korinek V, Barker N, Clevers H, Vogelstein B, Kinzler KW. Activation of beta-catenin-Tcf signaling in colon cancer by mutations in beta-catenin or APC. Science 1997;275:1787–90 [DOI] [PubMed] [Google Scholar]
- 30. Taank Y, Agnihotri N. Understanding the regulation of β-catenin expression and activity in colorectal cancer carcinogenesis: beyond destruction complex. Clin Transl Oncol 2021;23:2448–59 [DOI] [PubMed] [Google Scholar]
Associated Data
This section collects any data citations, data availability statements, or supplementary materials included in this article.
Supplementary Materials
Supplemental material, sj-pdf-1-ebm-10.1177_15353702221101810 for PGM3 regulates beta-catenin activity to promote colorectal cancer cell progression by Nan Zhang, Si Liu, Junxuan Xu, Tingting Ning, Sian Xie, Li Min, Shengquan Zhu, Shutian Zhang and Shengtao Zhu in Experimental Biology and Medicine


