

Background:
Growing evidence suggests that individuals with transfemoral amputation or knee disarticulation using a prosthesis equipped with a microprocessor-controlled knee (MPK) benefit from enhanced mobility and safety, including less falls. In elderly individuals, high mortality rates are assumed to reduce the expected useful life of MPKs, and this raises concerns regarding their economic effectiveness.
Objective:
To investigate the cost-effectiveness and budget impact of the Kenevo/MPK (Ottobock, Germany) compared with non–microprocessor-controlled knees (NMPKs) in people older than 65 years at the time of transfemoral amputation/knee disarticulation, from a Swedish payer’s perspective.
Methods:
A decision-analytic model was developed to conduct the economic analysis of the Kenevo/MPK. Model parameters were derived from Swedish databases and published literature. Univariate and probabilistic sensitivity analyses were performed to explore parameter uncertainty.
Results:
Compared with NMPKs, the Kenevo/MPK reduced the frequency of hospitalizations by 137 per 1,000 person years while the frequency of fatal falls was reduced by 19 per 1,000 person-years in the simulation. Over a 25-year time horizon, the incremental cost-effectiveness ratio was EUR11,369 per quality-adjusted life year. The probability of the MPK being cost-effective at a threshold of EUR40,000 per quality-adjusted life year was 99%. The 5-year budget impact model predicted an increase in payer expenditure of EUR1.76 million if all new patients received a Kenevo/MPK, and 50% of current NMPK users switched to the MPK.
Conclusions:
Results of the modeling suggest that the Kenevo/MPK is likely to be cost-effective for elderly individuals, primarily because of a reduction in falls.
Keywords: transfemoral amputation, microprocessor-controlled knee, cost-effectiveness, economic evaluation, Markov model, diabetes mellitus, peripheral vascular disease
Introduction
Individuals with transfemoral amputation (TFA) or knee disarticulation (KD) generally have significant mobility restrictions, poor health outcomes, and high mortality rates.1-5 This is likely a consequence of underlying health conditions, such as diabetes or peripheral vascular disease (PVD), in combination with the functional loss they experience as a result of their amputation. Growing evidence supports the hypothesis that prosthetic knee mechanisms incorporating microprocessor control can improve health outcomes in this group of individuals. Microprocessor-controlled prosthetic knees (MPKs) have been demonstrated to improve mobility and quality of life in young6 and moderate-functioning prosthesis users7,8 as well as reduce the risk of falls in older and low-functioning users.7-11 Cost-effectiveness studies suggest substantial benefits associated with MPKs,12,13 but economic evidence in older prosthesis users is lacking. While MPKs have been demonstrated to reduce the risk of falls in older and low-functioning users,7-11 high mortality rates in this group may reduce the potential for midterm to long-term cost-effectiveness.
Because MPKs are more costly than non–microprocessor-controlled knees (NMPKs), health economic evaluations in relevant patient groups are necessary to inform clinical prescription and health policy decisions. Initial studies on middle-aged individuals with mainly traumatic amputations have demonstrated a reasonable relationship between increased costs and additional benefits of MPKs compared with NMPKs.14-16 A larger study, stratified by age,17 suggested that gains in health-related quality of life are slightly lower in elderly individuals, especially within the psychosocial domains of the EQ-5D. In addition, a low life expectancy in older and low-functioning prosthesis users may reduce the expected useful life of the MPK and limit potential benefits which accumulate over time, such as reduced risk of falling and improved quality of life. Interestingly, neither the effects of mortality nor the costs and health consequences due to falls were included in cost-effectiveness analyses until recently.12,13
Chen et al12 introduced a Markov simulation model to investigate economic benefits of MPKs in the health care context of the United States (US). The model incorporated cost estimations of injurious falls, death, and osteoarthritis as well as nonhospital costs of transportation and sick leave across a 10-year projected follow-up period. They found that the clinical and economic benefits of MPKs were comparable with other reimbursed technologies in the United States.12 Kuhlmann et al13 extended this modeling strategy to apply both a cost-efficacy and budget-impact analysis on the use of MPKs in patients with or without diabetes mellitus (DM) in a German context. The predicted reduction in fall-related hospitalizations and deaths in individuals older than 40 years, who received an MPK, indicated health and economic benefits for individuals both with and without DM.13 To date, no health economic study of MPKs has specifically focused on older prosthesis users who represent the largest proportion of this patient population.
In 2018, the Swedish Amputation and Prosthetics Registry for the Lower Extremity (SwedeAmp) reported more than 80% of amputations as being due to PVD and/or DM, an average age at amputation of 74 years and a 6-month mortality of 19%.18 These numbers corroborate recent Austrian,19 Danish,20 and German21 data and highlight the need for research to prioritize these elderly comorbid individuals. In Sweden, prescriptions of MPKs are rare among those older than 65 years as indicated by unpublished figures from SwedeAmp showing that approximately 1.5% were prescribed an MPK for the first ever prosthesis and 7% for a later prosthesis during the years 2016–2020.22
Each of the 21 Swedish health care regions receives a budget allocation for provision of prosthetic services and devices. This budget does not cover the provision of MPKs in elderly low-functioning users. The decision to supply a patient with more costly prosthetic components is subsequently made by each region on a case-by-case basis. Evidence to support decision-making is lacking, and it is likely that, from a payer perspective, the short-term budget impact may become as important as the societal cost-effectiveness long-term.
The objective of this study was to explore the cost-effectiveness and budget impact of providing an MPK (Kenevo, Ottobock, Germany) instead of an NMPK to elderly people in Sweden who needed a prosthesis for the first time after TFA or KD. The study was conducted from a payer's perspective.
Methods
A previously published decision-analytic model13 was modified to evaluate the Kenevo/MPK compared with NMPKs from a Swedish payer’s perspective. The model synthesizes data from different sources and simulates the long-term health effects and costs of prosthesis use. Modeling methods and collection and analyses of data to inform the model parameters are described in the following paragraphs and in supplement sections 2–5 (Supplemental Digital Content 1, http://links.lww.com/POI/A97). All outcomes reported in the results section and supplement section 6 (Supplemental Digital Content 1, http://links.lww.com/POI/A97) are outcomes of the model simulations.
The Kenevo/MPK was chosen because it is designed specifically for individuals with limited mobility requirements. The analyses investigated patients older than 65 years at the time of TFA or KD. The assumption was made that these individuals generally are low-functioning prosthesis users. Six subgroups were defined on the basis of age and etiology at amputation: 65–74 years, 75–84, and older than 85 with DM and/or PVD or other etiologies. Subgroups were chosen due to differences in life expectancy between the subgroups (supplement Tables 4, 5, and 6; supplement figures 7, 8, 11, and 12, Supplemental Digital Content 1, http://links.lww.com/POI/A97). The model was programmed in Microsoft Excel 2016.
The health economic terms used in this article are explained in more detail in the supplement (Supplemental Digital Content 1, http://links.lww.com/POI/A97).
Model structure
The decision-analytic model consisted of three components: population, fall events, and knee joint replacement. The population component assigned patients to one of the six subgroups and simulated the survival and aging of these patients after first prosthesis provision. Based on the average population size (population component), the annual number of falls and fall-related hospitalizations, outpatient treatments, and fatal falls were calculated. The knee joint replacement component of the model analyzed the number of years since first fitting or the last knee replacement and calculated the costs. Figure 1 shows the structure and interactions of the different components of the model and the contribution of each component to the health economic analysis.
Figure 1.

Structure of the decision-analytic model.
Cost-effectiveness analysis
The analysis focused on the projected number of new prosthesis users in 2020. The time horizon was 25 years. In the base-case analysis, discount rates were 3% for costs and quality-adjusted life years (QALYs).23 Calculated incremental cost-effectiveness ratios (ICERs) were compared with Swedish cost-effectiveness thresholds (≈EUR8,000 and ≈EUR40,000 per QALY gained). Cost-effectiveness of the Kenevo/MPK was explored in the six groups described above.
Budget impact analysis
Budget impact analysis (BIA) was computed for the period 2020–2024. Costs were not discounted. The BIA also included patients who received their first prosthesis in 2000–2019 at 65 years and older and were still alive in 2020. Although the Kenevo knee was introduced to Sweden in 2015, the provision of the MPK was assumed to begin in 2020 in the model. This assumption was based on unpublished data of SwedeAmp22 which indicate that an MPK was rarely provided before this time. In the base-case analysis, the following assumptions were made regarding the penetration rate of the Kenevo:
2000–2019: exclusively NMPKs are provided
2020–2024: 100% of new prosthesis users received a Kenevo and 50% of previous NMPK users, whose knee joint required replacement, would switch to a Kenevo
Data sources
Incidence of amputations and cost of fall-related injuries were extracted using amputation procedure codes24 and ICD-10/DRG statistics25 from the Swedish National Board of Health and Welfare. A literature review was conducted to obtain data regarding the risk and medical consequences of falls and health state utilities. The manufacturer of the Kenevo/MPK (Ottobock) provided prosthesis prices and warranty package costs. Table 1 summarizes input parameters including base-case estimates, probability distributions, and references.
Table 1.
Model parameters.

| Parameter | Base-case estimate | Probabilistic analysis | Source | ||
| Distribution | Parameter | ||||
| Diabetes mellitus and/or peripheral artery disease | |||||
| No. of prosthesis users | Supplement section 2 | ||||
| Prosthesis fitting | |||||
| Prob. fitting | 21.6% | Beta | α = 94 | β = 342 | Davie-Smith et al5 |
| Age factor | 0.970 | Lognormal | μ = −0.030 | σ = 0.005 | |
| Mortality rate | |||||
| 65–74 years old | 0.233 | Normal | μ = 0.233 | σ = 0.008 | Supplement section 2.7 |
| 75–84 years old | 0.309 | Normal | μ = 0.309 | σ = 0.008 | |
| Older than 85 years | 0.459 | Normal | μ = 0.459 | σ = 0.012 | |
| Other etiologies | |||||
| No. of prosthesis users | Supplement section 2 | ||||
| Prosthesis fitting | |||||
| Prob. fitting | 21.6% | Beta | α = 94 | β = 342 | Davie-Smith et al5 |
| Age factor | 0.970 | Lognormal | μ = −0.030 | σ = 0.005 | |
| Mortality rate | |||||
| 65–74 years old | 0.118 | Normal | μ = 0.118 | 0.015 | Supplement section 2.7 |
| 75–84 years old | 0.230 | Normal | μ = 0.230 | 0.022 | |
| Older than 85 years | 0.421 | Normal | μ = 0.421 | 0.039 | |
| Risk of falling per year | |||||
| Kenovo | |||||
| Rate ratio vs. NMPK | 0.37 | Lognormal | μ = −0.992 | σ = 0.147 | Supplement section 3 |
| NMPK | |||||
| No. of falls/patient year | 2.55 | Lognormal | μ = 0.891 | σ = 0.178 | Lansade et al7 and Hafner et al27 |
| OR of falling 4+years after amputation compared with first 3 years | 0.53a | Lognormal | μ = −0.671 | σ = 0.269 | Miller et al29 |
| Fall-related medical events | |||||
| Proportion of medical falls | 26.8% | Beta | α = 11 | β = 30 | Wong et al30 |
| Proportion of fatal falls in medical falls | 6.9% | Beta | α = 11 | β = 148 | Sterling et al31 |
| Proportion of hospitalizations in medical nonfatal falls | 45.5% | Beta | α = 5 | β = 6 | Wong et al30 |
| Discounting cost-effectiveness analysis (budget-impact analysis) | |||||
| Health outcomes | 3% (0%) | — | — | — | TLV23 |
| Costs | 3% (0%) | — | — | — | |
| Utilities | |||||
| Kenevo | 0.704 | Beta | α = 306 | β = 129 | Cutti et al17 |
| NMPK | 0.626 | Beta | α = 192 | β = 115 | |
| QALY loss of hospitalization | 0.271 | Beta | α = 18 | β = 48 | Hartholt et al32 |
| QALY loss of outpatient treatment | 0.043 | Beta | α = 24 | β = 535 | |
| Costs | |||||
| Kenevo | |||||
| Socket, work, CPO fee, etc. | EUR4,999 | — | — | — | Ottobock |
| Knee joint | EUR6,093 | — | — | — | |
| 3-year warranty knee joint | EUR2,844 | — | — | — | |
| 3-year add-on warranty | EUR4,283 | — | — | — | |
| NMPK | — | — | — | ||
| Socket, work, CPO fee, etc. | EUR4,999 | — | — | — | |
| Knee joint | EUR1,268 | — | — | — | |
| Fatal fall | EUR8,222 | — | — | — | Assumptionb |
| Hospitalization | EUR7,475 | — | — | — | Supplement section 5 |
| Outpatient visit/treatment | EUR626 | — | — | — | |
Abbreviations: NMPK, non–microprocessor-controlled knees; QALY, quality-adjusted life year; TLV, the Dental and Pharmaceutical Benefits Agency.
An annual decline of  in the proportion of fallers is assumed during the first 4 years after amputation. Base-case values for the ORs of falling for 2, 3, and 4+ years compared with the first year after amputation are 0.81, 0.62, 0.43.
Assumption: fatal fall costs = costs of hospitalization*1.1
Epidemiology
The anonymized data excerpt spanning 2007–2017 included 8,631 patients older than 65 years (90.9% of all patients) with at least one TFA (78.3%) or KD (29.3%) procedure (procedure codes NFQ19, NGQ09). In this elderly cohort, 91.7% of patients had DM (ICD-10/E10, E11, E13, E14) and/or PVD (ICD-10/I70).24 Survival was followed up until August 2019. A linear regression on the logged incidence rates was performed to estimate time trends and project incidences for 2000–2006 and 2018–2024. Case numbers were calculated on the basis of population projections from Statistics Sweden.26 On the basis of data from SwedeAmp, an interval of 6 months between amputation and first prosthesis fitting was assumed.18 Only patients who were still alive 6 months after surgery and achieved prosthetic fitting entered the simulations.
Probabilities of prosthetic fitting for specific age groups were obtained from a Scottish retrospective cohort study.5 In patients with TFA who survived the rehabilitation period, the fitting rate was 21.6%. The effect of increasing age at amputation was considered as a negative predictor of prosthetic fitting (−3% per year of age).5
Our data set did not include information on prosthesis use,24 and it was assumed that mortality in prosthesis users and nonusers was comparable. Mortality rates were derived by fitting exponential distributions to survival data (6+ month after amputation) using the R package flexsurvreg (version 0.7.1).
Risk of falling and fall-related medical events
A literature review identified four studies7,8,27,28 comparing the number of falls in individuals fitted with an MPK vs. NMPK and who were indoor and limited outdoor walkers. Although fall rates varied considerably across studies (07–20.98 falls per person-year (PY) in the MPK groups and 1.67–40.88 in the NMPK groups), a meta-analysis using a random effects model (Supplement Figure 15, Supplemental Digital Content 1, http://links.lww.com/POI/A97) showed low heterogeneity in the fall rate ratio. MPKs significantly reduced the fall rate by 63% (rate ratio: 0.37, 95% confidence interval: 0.28–0.49, I2: 10%). A fall rate of NMPK users of 2.55 per PY was assumed, based on naïve pooling of data from Lansade et al7 and Hafner et al.27 Multiplying the NMPK fall rate with the rate ratio gave a fall rate of 0.94 per PY for Kenevo users. Long-term risk of falling in prosthesis users has, to the best of our knowledge, not been investigated. On the basis of previously published data,29 we assumed that there would be a linear decline in the fall rate of 19 percent points per year in the first 4 years after prosthesis fitting (Table 1).
One study reported fall-related injuries in people with lower limb amputation30 and indicated that 26.8% of all falls had medical consequences. The hospitalization probability of medical falls was 45.5%. Occurrence of fatal falls was not reported. However, one subject died of unknown causes and 12 subjects were lost to follow-up.30 In line with previous economic studies, it was assumed that 6.9% of medical falls were fatal.12,13,31
Utilities
Utility values for MPK and NMPK users were extracted from Cutti et al.17 Of four identified studies,14-17 only Cutti et al17 reported utilities based on the EQ-5D in individuals older than 65 years. Utility decrements of fall-related medical events were derived from a Dutch study32 which reported utility values for hospitalized and nonhospitalized patients at 9 months after the fall incidence. Values were adjusted for other time points according to the relative change in utilities in all patients presenting to the emergency department. Graph digitizing software (PlotDigitizer 2.6.3) was used to extract numerical data from plotted utility scores32 at 2, 5, and 9 months after the fall. Utility decrements were then extrapolated up to 1 year. Long-term health-related quality-of-life reductions of falls were not included in the evaluation.
Costs
The price year of the analysis was 2019. Swedish prices and costs were converted to Euro using purchasing power parity (2019 conversion rate for Swedish crowns to Euro area Euros: 0.0807).33 The cost of the intervention, Kenevo, included the provision of a prosthetic socket (EUR4,999 including production and CPO fees), knee joint (EUR8,936 including CPO fee and 3-year warranty package), and a 3-year warranty package which is typically an optional add-on (EUR4,283). A utilization rate of 100% for the optional warranty package was assumed for patients alive, and in accordance with the terms of the warranty, we assumed knee joint replacement every 6 years.
Costs for the comparator NMPK included the socket (EUR4,999 including production and CPO fees) and the knee joint (EUR1,268). A Weibull function was applied to determine the time until NMPK knee joint replacement. Distribution parameters were taken from the study by Brodtkorb et al14 who reported a mean usage duration of 2 years for an NMPK knee. It was assumed that socket modifications or replacements would not be affected by the knee joint prescription.
Analysis of patient-level DRG data from the Swedish National Board of Health and Welfare database25 and price lists for inpatient and outpatient care for 201934 revealed average fall-related costs of EUR7,475 per hospitalization and EUR626 per outpatient treatment (supplement Tables 7, 8, 9, 10, 11, 12, and 13, Supplemental Digital Content 1, http://links.lww.com/POI/A97). A US study reported that the medical costs of fall-related death were 10% higher than those of major injurious falls.12 Applying this factor to the estimated hospitalization costs in Sweden yielded fatal fall costs of EUR8,222.
Sensitivity analyses
Univariate and probabilistic sensitivity analyses (PSAs) were performed to explore parameter uncertainty and to investigate the impact of individual input parameters on the results. The PSA was run with 10,000 iterations.
Results
Cost-effectiveness analysis
Simulated health outcomes
Among Kenevo users, the fall frequency per 1,000 PY was 63.7% lower than in NMPK users (671 vs. 1,702). As a result, fall-related medical events also decreased among Kenevo users compared with NMPK users—11 vs. 30 fatal falls and 70 vs. 208 hospitalizations per 1,000 PYs. On average, Kenevo users gained 0.34 life years or 0.65 QALYS (Table 2).
Table 2.
Base-case results (including 2.5% and 97.5% quantiles of the probabilistic sensitivity analysis).

| Fall events | Kenevo | NMPK | Difference |
| Falls per 1,000 person-years | 617 (301 to 1,200) | 1,702 (870 to 3,124) | −1,085 (−533 to −2,005) |
| Fatal falls per 1,000 person-years | 11 (3 to 26) | 30 (10 to 70) | −19 (−6 to −45) |
| Hospitalizations per 1,000 person-years | 70 (19 to 178) | 208 (57 to 498) | −137 (−37 to −331) |
| Outpatient treatments per 1,000 person-years | 84 (26 to 208) | 249 (78 to 593) | −165 (−50 to −392) |
| Health outcomes (undiscounted) | |||
| Life years per patient | 3.81 (3.55 to 4.34) | 3.48 (3.40 to 3.58) | 0.33 (0.10 to 0.86) |
| Quality-adjusted life years per patient | 2.60 (2.36 to 2.94) | 1.95 (1.58 to 2.21) | 0.65 (0.27 to 1.21) |
| Costs in EUR (undiscounted) | |||
| Prosthesis costs per patient | 19,041 (18,531 to 20,136) | 7,817 (7,411 to 8,303) | 11,224 (10,504 to 12,395) |
| Fall-related medical costs | 2,545 (804 to 6,482) | 6,803 (2,272 to 15,374) | −4,258 (−9,160 to −1,413) |
| Total costs | 21,587 (19,441 to 26,320) | 14,620 (10,051 to 23,197) | 6,967 (2,689 to 9,516) |
| Cost-effectiveness analysis (discounted by 3%) | |||
| Quality-adjusted life years per patient | 2.35 (2.15 to 2.64) | 1.77 (1.43 to 2.02) | 0.58 (0.25 to 1.06) |
| Total costs (in EUR) | 20,587 (18,650 to 24,784) | 14,012 (9,736 to 22,034) | 6,576 (2,437 to 9,021) |
| Incremental cost-effectiveness ratio (in EUR) | 11,369 (2,551 to 33,780) | — | — |
| Budget-impact analysis (undiscounted) | |||
| Year 1 (in Mio EUR) | 1.60 (1.18 to 2.21) | 1.17 (0.75 to 1.92) | 0.43 (0.18 to 0.64) |
| Year 2 (in Mio EUR) | 1.56 (1.15 to 2.16) | 1.18 (0.76 to 1.93) | 0.39 (0.15 to 0.54) |
| Year 3 (in Mio EUR) | 1.41 (1.04 to 2.01) | 1.18 (0.76 to 1.95) | 0.23 (0.00 to 0.38) |
| Year 4 (in Mio EUR) | 1.57 (1.18 to 2.21) | 1.19 (0.77 to 1.96) | 0.38 (0.18 to 0.55) |
| Year 5 (in Mio EUR) | 1.54 (1.14 to 2.18) | 1.20 (0.77 to 1.98) | 0.34 (0.14 to 0.50) |
| Total (in Mio EUR) | 7.68 (5.71 to 10.73) | 5.92 (3.81 to 9.73) | 1.76 (0.68 to 2.54) |
Abbreviation: NMPK, non–microprocessor-controlled (mechanical) knee joints.
Cost-effectiveness
After discounting, Kenevo users gained 0.58 QALYs on average. Discounted incremental costs were EUR6,576 per patient. The main cost driver among Kenevo users were prosthesis costs, which constituted 88% of the total costs. Costs of fall-related medical events were 2.67 times higher in NMPK users and amounted to 46% of total costs in this patient group (Table 2). The ICER was EUR11,369 per QALY gained.
Subgroup analysis
ICER estimates were higher in prosthesis users with DM/PVD and increased with amputation age because of a reduced life expectancy. In patients aged 65–74 years at the time of amputation, ICERs were EUR10,367 (DM/PVD) and EUR7,504 (other etiologies) per QALY gained and increased to EUR15,000 (DM/PVD) and EUR14,345 (other etiologies) in prosthesis users older than 85 years at the amputation (Figure 2). Detailed subgroup results are shown in the supplements (Supplemental Digital Content 1, http://links.lww.com/POI/A97).
Figure 2.
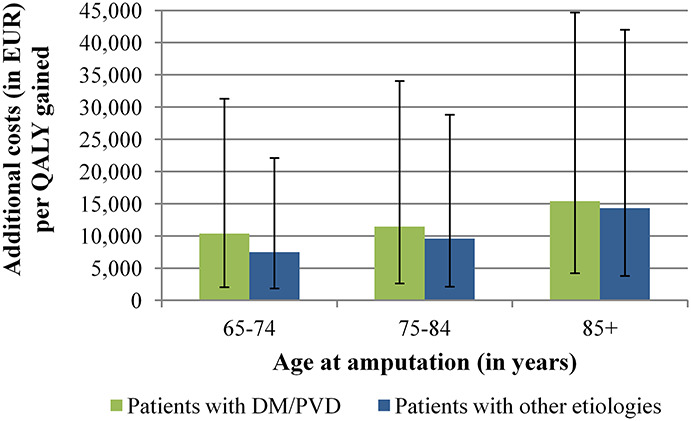
Cost-effectiveness results in the six subgroups. Green or blue bars show the base-case results for the six subgroups. The black lines represent the 2.5% and 97.5% quantiles of the Monte Carlo simulation.
Budget-impact analysis
The model estimated a budget impact of EUR1.76 million over a 5-year period (2020–2024). Around 46% of the additional costs were incurred in the first 2 years (2020–2021, Figure 3). The model predicted that between 2020 and 2024, patients with DM/PVD accounted for 88% of the total budget impact (Figure 4).
Figure 3.
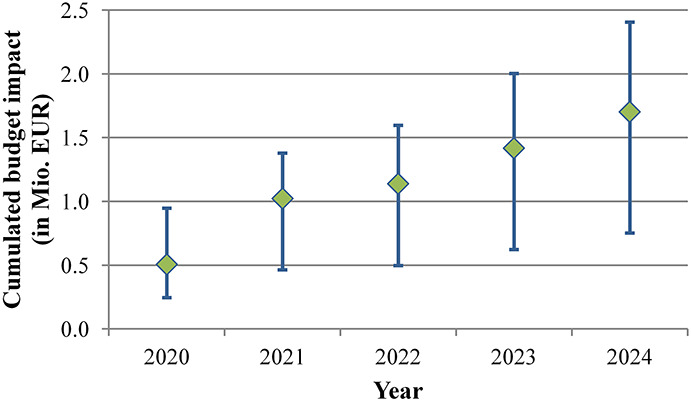
Cumulated budget impact over time. Additional costs for the statutory health insurance, occurring from Kenevo fittings instead of non–microprocessor-controlled knees. The values include both, individuals using prostheses with diabetes mellitus/peripheral vascular disease and individuals with other etiologies. The blue lines show the 2.5% and 97.5% quantiles of the Monte Carlo simulation. The budget impact over 5 years (2020–2024) amounts to EUR1.70 million (EUR0.75-EUR2.41 million).
Figure 4.
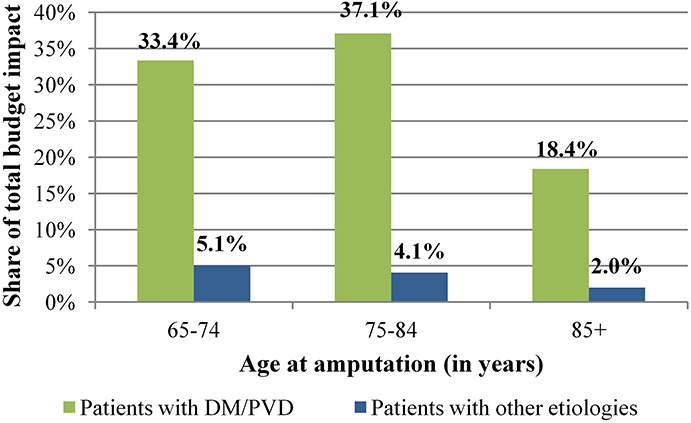
Contribution of subgroups to the total budget impact.
Providing Kenevo/MPK to all former NMPK users increased the budget impact to approximately EUR3.53 million. If the penetration rate of Kenevo was 50% in new prosthesis users and 25% of NMPK users switched to Kenevo, additional expenditures amounted to EUR0.88 million. BIAs for different penetration rates of Kenevo are presented in Figure 5.
Figure 5.
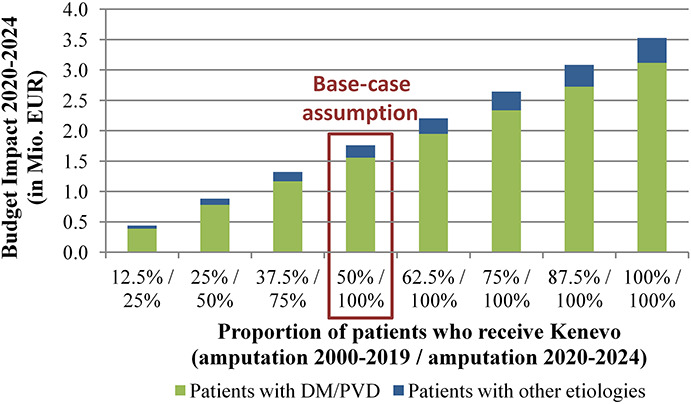
Budget impact of Kenevo for different penetration rates. Budget impact over 5 years for different penetration rates. In penetration rates, a distinction was made between patients with transfemoral amputation/knee disarticulation before 2020 and fitted with a non–microprocessor-controlled knees and patients who were fitted with prostheses for the first time from 2020. In the former, it was assumed that a prosthesis revision would allow the patient to switch from a non–microprocessor-controlled knees to a Kenevo.
Sensitivity analysis
The results of the PSA revealed substantial uncertainty in the ICER estimates and the budget impact of Kenevo (Figures 6 and 7 and Table 2). 2.5% and 97.5% quantiles (Q0.025, Q0.975) of the ICER ranged from EUR2,551 to EUR33,780 per QALY gained. At ICER thresholds of EUR8,000 and EUR40,000 per QALY gained, the probabilities of Kenevo being cost-effective were 23% and 99%, respectively (Figure 7). The Q0.025-Q0.975 intervals of the budget impact ranged from EUR0.68 to EUR2.54 million (Table 2).
Figure 6.
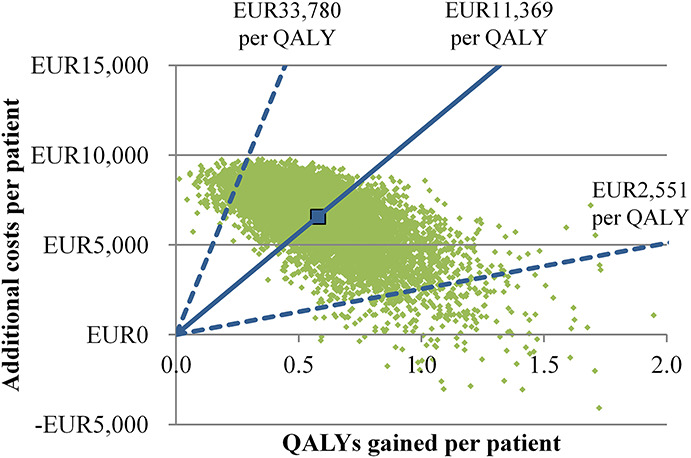
Results of the probabilistic sensitivity analysis: scatterplot. The green dots each show the results of one iteration of the Monte Carlo simulation. The larger blue point shows the average quality-adjusted life years gained and the average additional costs of the Kenevo compared with non–microprocessor-controlled knees. The incremental cost-effectiveness ratio (ICER)—additional costs per quality-adjusted life year gained—is shown by the blue lines. The solid lines show the average ICER and the dashed lines the 2.5% and 97.5% quantiles.
Figure 7.
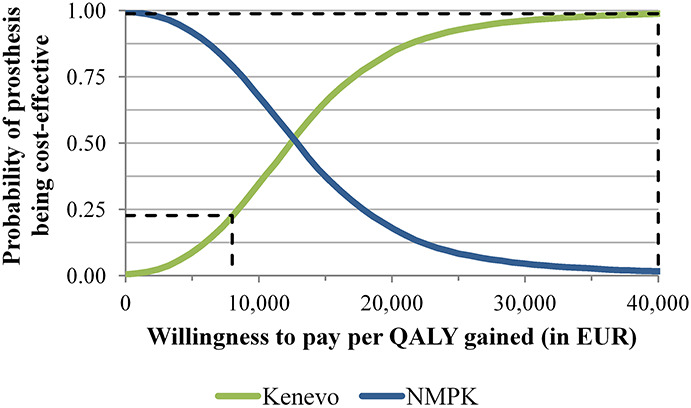
Results of the probabilistic sensitivity analysis: cost-effectiveness acceptability curve. The green and blue lines show the cost-effectiveness probabilities of the Kenevo microprocessor-controlled knee or the non–microprocessor-controlled knees for given willingness-to-pay thresholds per quality-adjusted life year gained. The black dashed lines mark the cost-effectiveness probabilities of the Kenevo MPK for the Swedish thresholds of EUR8,00 and EUR40,000 per quality-adjusted life year gained. The probabilities are the proportion of Monte Carlo interactions with an incremental cost-effectiveness ratio below the given threshold.
Figures 8 and 9 show results of univariate and multivariate sensitivity analyses. Not including the effects of falling had the highest impact on the cost-effectiveness and budget impact of Kenevo; ICERs increased to EUR40,577 per QALY (Figure 8) gained and the budget impact to EUR2.62 million (Figure 9). The proportion of medical falls and Kenevo prices also had a substantial impact on health economic outcomes (Figures 8 and 9). High discount rates reduced the cost-effectiveness of the Kenevo, but the impact of discounting was limited (supplement Table 16, Supplemental Digital Content 1, http://links.lww.com/POI/A97). Extending the mean usage duration of NMPK knees to 5 years increased the ICER to EUR12,661 per QALY (Figure 8) and reduced the budget impact to EUR1.42 million (Figure 9).
Figure 8.

Results of univariate and multivariate sensitivity analyses: incremental cost-effectiveness ratio.
Figure 9.

Results of univariate and multivariate sensitivity analyses: budget impact.
Discussion
This is the first model-based health economic evaluation of a microprocessor-controlled prosthetic knee which focuses on people older than 65 years at the time of amputation, a population with high mortality (see supplements Table 4, Supplemental Digital Content 1, http://links.lww.com/POI/A97, for the median survival of elderly patients in Sweden), and low functionality. The results of the model simulations indicated the cost-effectiveness of the Kenevo/MPK at a willingness-to-pay threshold of EUR40,000 per QALY gained. Mortality was a major driver for the cost-effectiveness of the MPK with ICERs being up to 2.05 times higher in the patient group with the lowest life expectancy (patients with amputation due to DM/PVD and older than 85 years) compared with the patient group with the highest life expectancy (patients with other etiologies aged 65–74 years).
The study design is comparable with recently published health economic models of MPKs in the United States and Germany.12,13 ICER estimates in this study were comparable with the results reported by Chen et al for a low-functioning population with a mean age of 72.5 years in the United States (USD13,568 per QALY gained)12 but lower than in the German setting (EUR20,332 per QALY gained in patients with DM and EUR16,123 in patients without DM).13 Owing to our focus on older patients, mortality was higher than in the German and US studies.12,13 Cost inputs of medical falls were slightly higher than in the German model but approximately 50% lower than in the US model. In this study, we applied provision of MPKs with a 3-year warranty plus an additional 3-year optional warranty which substantially decreased the simulated lifetime prosthesis costs compared with the 6-year warranty applied in the German model. This is because many older patients die within the first 3 years. Our results subsequently suggest that 3-year warranty packages are more appropriate from an economic perspective for this patient group.
Three previous health economic evaluations did not include medical and economic consequences of falling and applied a shorter time horizon (5–8 years).14,15,17 When excluding the effects of falling, our model estimated ICERs of EUR38,839 which are closer to results reported in the Italian study17 (EUR51,000 per QALY gained for the group older than 65 years) from which we derived the utility values. The retrospective evaluation by Brodtkorb et al14 for the Swedish health care setting calculated the lowest ICER and the highest number of QALYs gained. The main reason for these results was the application of a three-fold to four-fold higher difference in utilities between MPK and NMPK.14
In this study, fall costs were calculated based on data from the general corresponding age populations. So far, only one small US study reported on fall costs in prosthesis users.35 Mundell et al35 estimated costs of hospitalization at USD25,526, which is much higher than in our analysis. The long-term economic and health-related consequences of medical fall events were not included in our analysis. Doing so may have further increased the benefits of the Kenevo/MPK and its cost-effectiveness because of the superior safety of MPKs compared with NMPKs.7,8,27,28
Combining reported fall rates in NMPK users from Kahle et al28 and Kaufmann et al8 with data related to the consequences of falling,30,31 resulted in very high numbers of fall-related deaths. These were close to or even higher than mortality because of all causes extracted from the Swedish National Board of Health and Welfare database24 or SwedeAmp.18 Therefore, only data from Lansade7 and Hafner27 were used to calculate fall rates of NMPK users. All comparative studies included in the calculation of fall rates and the fall rate ratio7,8,27,28 and in the modeling of fall consequences30 had rather short follow-ups, small sample sizes, and induced substantial uncertainty in model outcomes. However, in the PSA, the Kenevo/MPK remained cost-effective with a probability of around 99% at a willingness-to-pay threshold of EUR40,000 per QALY gained.
Study limitations
A conscious decision was made to focus this study on the Kenevo MPK. This was done because the population of interest was older individuals, and the Kenevo is specifically marketed toward this group. It is important to recognize that finding from this study cannot be generalized to other MPKs which may also offer benefits to elderly prosthesis users.
The main limitation of this study is the lack of comprehensive epidemiological, medical, and economic data on prosthesis use, which could be used to inform model parameters.36 The amputation procedure data from Swedish National Board of Health and Welfare database24 did not include information on prosthesis use. Thus, all-cause mortality rates applied in the model were based on all patients with TFA or KD. In practice, provision of prostheses may depend on the individual’s health prognosis, and therefore, prosthesis users may have better survival rates than nonusers. Higher survival rates would increase the cost-effectiveness of the Kenevo/MPK, as shown in the age-stratified analysis. On the other hand, reduced mortality would have increased the prevalence of prosthesis users, and the budget impact of Kenevo would also have increased. However, to the best of our knowledge, this modeling study synthesizes the best available evidence including analysis of the large Swedish databases24,25 to inform epidemiological and economic model parameters. The mean duration until NMPK replacement was taken from a study which investigated a rather young (mean age 41 years) and mobile population. Low rates of prosthesis use may also prolong the life of the prosthetic device. Modeling longer usage durations of NMPKs resulted in a moderate increase in the ICER estimate. Furthermore, we assumed that a prosthesis was used at the time of falls, when in fact they may occur when the individual is not wearing their prosthesis. Many elderly patients with TFA and KD because of PVD/DM have low rates of prosthetic use, which is supported by data from SwedeAmp.18 Similarly, Denton et al37 reported prosthetic use in 13 of 20 patients at the time of a fall leading to a fracture, and Gonzales et al38 indicated that the prosthesis was used in 3 of 9 falls. Reducing the number of falls related to prosthesis use, would increase ICER estimates of the Kenevo in our model. Future studies should aim to combine information on prosthetic use and falls in individuals with lower limb amputations.
Conclusion
The results of our modeling study indicate that the Kenevo knee, by reducing the falling risk, is likely to be cost-effective in individuals older than 65 years in a Swedish context, and therefore, a revision of current prescription routines might be warranted.
Supplementary Material
Footnotes
Associate Editor: Christopher Wong
Contributor Information
Kerstin Hagberg, Email: kerstin.hagberg@vgregion.se.
Ilka Kamrad, Email: ilka.kamrad@gmail.com.
Nerrolyn Ramstrand, Email: Nerrolyn.Ramstrand@ju.se.
Susanne Seidinger, Email: susanne.seidinger@ottobock.com.
Hans Berg, Email: hans.er.berg@sll.se.
Ethics Review and Approval
The authors disclosed ethics review and approval for the research described in this article: This study includes modeling of synthetic patient cohorts and analyses of fully anonymized data. Hence, ethical approvals were not required. Data collection and analysis were in full compliance with all applicable national legislations.
Funding
The authors disclosed receipt of the following financial support for the research, authorship, and/or publication of this article: OttoBock provided prices of the prostheses which were evaluated in this study
Declaration of conflicting interest
The authors disclosed the following potential conflicts of interest with respect to the research, authorship, and/or publication of this article: A.K., K.H., I.K., N.R., and H.B. received financial compensation from OttoBock for their contribution to the study. S.S. is a full-time employee of Ottobock Healthcare Products GmbH.
Supplemental material
Supplemental material for this article is available in this article. Direct URL citation appears in the text and is provided in the HTML and PDF versions of this article on the journal’s Web site (www.POIjournal.org).
References
- 1.Sansam K, Neumann V, O'Connor R, et al. Predicting walking ability following lower limb amputation: a systematic review of the literature. J Rehabil Med 2009; 41: 593–603. [DOI] [PubMed] [Google Scholar]
- 2.Kahle JT, Highsmith MJ, Schaepper H, et al. Predicting walking ability following lower limb amputation: an updated systematic literature review. Technol Innov 2016; 18: 125–137. [DOI] [PMC free article] [PubMed] [Google Scholar]
- 3.Norvell DC, Thompson ML, Boyko EJ, et al. Mortality prediction following non-traumatic amputation of the lower extremity. Br J Surg 2019; 106: 879–888. [DOI] [PMC free article] [PubMed] [Google Scholar]
- 4.Torbjörnsson E, Blomgren L, Fagerdahl AM, et al. Risk factors for amputation are influenced by competing risk of death in patients with critical limb ischemia. J Vasc Surg 2020; 71: 130. [DOI] [PubMed] [Google Scholar]
- 5.Davie-Smith F, Paul L, Nicholls N, et al. The impact of gender, level of amputation and diabetes on prosthetic fit rates following major lower extremity amputation. Prosthet Orthot Int 2017; 41: 19–25. [DOI] [PMC free article] [PubMed] [Google Scholar]
- 6.Tofts LJ and Hamblin N. C-Leg® improves function and quality of life in an adolescent traumatic trans-femoral amputee: a case study. Prosthet Orthot Int 2014; 38: 413–417. [DOI] [PubMed] [Google Scholar]
- 7.Lansade C, Vicaut E, Paysant J, et al. Mobility and satisfaction with a microprocessor-controlled knee in moderately active amputees: A multi-centric randomized crossover trial. Ann Phys Rehabil Med 2018; 61: 278–285. [DOI] [PubMed] [Google Scholar]
- 8.Kaufman KR Bernhardt KA and Symms K: Functional assessment and satisfaction of transfemoral amputees with low mobility (FASTK2): a clinical trial of microprocessor-controlled vs. non-microprocessor-controlled knees. Clin Biomech 2018; 58: 116–122. [DOI] [PubMed] [Google Scholar]
- 9.Hasenoehrl T, Schmalz T, Windhager R, et al. Safety and function of a prototype microprocessor-controlled knee prosthesis for low active transfemoral amputees switching from a mechanic knee prosthesis: a pilot study. Disabil Rehabil Assist Technol 2018; 13: 157–165. [DOI] [PubMed] [Google Scholar]
- 10.Kannenberg A Zacharias B and Pröbsting E. Benefits of microprocessor-controlled prosthetic knees to limited community ambulators: systematic review. J Rehabil Res Dev 2014; 51: 1469–1496. [DOI] [PubMed] [Google Scholar]
- 11.Mileusnic MP Hahn A and Reiter S. Effects of a novel microprocessor-controlled knee, kenevo, on the safety, mobility, and satisfaction of lower-activity patients with transfemoral amputation. J Prosthet Orthot 2017; 29: 198–205. [Google Scholar]
- 12.Chen C, Hanson M, Chaturvedi R, et al. Economic benefits of microprocessor controlled prosthetic knees: a modeling study. J Neuroeng Rehabil 2018; 15(suppl 1): 62. [DOI] [PMC free article] [PubMed] [Google Scholar]
- 13.Kuhlmann A, Krüger H, Seidinger S, et al. Cost-effectiveness and budget impact of the microprocessor-controlled knee C-Leg in transfemoral amputees with and without diabetes mellitus. Eur J Health Econ 2020; 21: 437–449. [DOI] [PMC free article] [PubMed] [Google Scholar]
- 14.Brodtkorb TH, Henriksson M, Johannesen-Munk K, et al. Cost-effectiveness of C-leg compared with non-microprocessor-controlled knees: A modeling approach. Arch Phys Med Rehabil 2008; 89: 24–30. [DOI] [PubMed] [Google Scholar]
- 15.Gerzeli S Torbica A and Fattore G. Cost utility analysis of knee prosthesis with complete microprocessor control (C-leg) compared with mechanical technology in trans-femoral amputees. Eur J Health Econ 2009; 10: 47–55. [DOI] [PubMed] [Google Scholar]
- 16.Seelen H, Hemmen B, Schmeets AJ, et al. Costs and consequences of a prosthesis with an electronically stance and swing phase controlled knee joint. Technol Disabil 2009; 21: 25–34. [Google Scholar]
- 17.Cutti AG, Lettieri E, Del Maestro M, et al. Stratified cost-utility analysis of C-Leg versus mechanical knees: Findings from an Italian sample of transfemoral amputees. Prosthet Orthot Int 2017; 41: 227–236. [DOI] [PubMed] [Google Scholar]
- 18.Kamrad I, Söderberg B, Örneholm H, et al. SwedeAmp-the Swedish Amputation and Prosthetics Registry: 8-year data on 5762 patients with lower limb amputation show sex differences in amputation level and in patient-reported outcome. Acta Orthop 2020; 91: 464–470. [DOI] [PMC free article] [PubMed] [Google Scholar]
- 19.Aziz F, Reichardt B, Sourij C, et al. Epidemiology of Major Lower Extremity Amputations in Individuals with Diabetes in Austria, 2014-2017: A Retrospective Analysis of Health Insurance Database. Diabetes Res Clin Pract 2020; 170: 108477. [DOI] [PubMed] [Google Scholar]
- 20.Røikjer J, Jensen MH, Vestergaard P, et al. Twenty years with diabetes and amputations: a retrospective population-based cohort study. Diabet Med 2020; 37: 2098–2108. [DOI] [PubMed] [Google Scholar]
- 21.Spoden M Nimptsch U and Mansky T. Amputation rates of the lower limb by amputation level - observational study using German national hospital discharge data from 2005 to 2015. BMC Health Serv Res 2019; 19: 8. [DOI] [PMC free article] [PubMed] [Google Scholar]
- 22.SwedeAmp-the Swedish Amputation and Prosthetics Registry. Data on File. [DOI] [PMC free article] [PubMed]
- 23.The Dental and Pharmaceutical Benefits Agency. Tandvårds- Och Läkemedelsförmånsverkets Allmänna Råd. https://tlv.se/om-oss/om-tlv/regelverk/allmanna-rad.html. [Google Scholar]
- 24.The National Board of Health and Welfare. Amputation Procedures.
- 25.The National Board of Health and Welfare. Enligt Regionavtalets Ersättningsmodell 2019, § 3 Kan Vissa Definierade Läkemedel Debiteras Efter Faktisk Kostnad.
- 26.Statistics Sweden. Population by Age, Sex and Year. http://www.statistikdatabasen.scb.se/pxweb/sv/ssd/. [Google Scholar]
- 27.Hafner BJ, Willingham LL, Buell NC, et al. Evaluation of function, performance, and preference as transfemoral amputees transition from mechanical to microprocessor control of the prosthetic knee. Arch Phys Med Rehabil 2007; 88: 207–217. [DOI] [PubMed] [Google Scholar]
- 28.Kahle JT Highsmith MJ and Hubbard SL. Comparison of nonmicroprocessor knee mechanism versus C-Leg on Prosthesis Evaluation Questionnaire, stumbles, falls, walking tests, stair descent, and knee preference. J Rehabil Res Dev 2008; 45: 1–14. [DOI] [PubMed] [Google Scholar]
- 29.Miller WC Speechley M and Deathe B. The prevalence and risk factors of falling and fear of falling among lower extremity amputees. Arch Phys Med Rehabil 2001; 82: 1031–1037. [DOI] [PubMed] [Google Scholar]
- 30.Wong CK Chihuri ST and Li G. Risk of fall-related injury in people with lower limb amputations: a prospective cohort study. J Rehabil Med 2016; 48: 80–85. [DOI] [PubMed] [Google Scholar]
- 31.Sterling DA O'Connor JA and Bonadies J. Geriatric falls: Injury severity is high and disproportionate to mechanism. J Trauma 2001; 50: 116–119. [DOI] [PubMed] [Google Scholar]
- 32.Hartholt KA, van Beeck EF, Polinder S, et al. Societal consequences of falls in the older population: Injuries, healthcare costs, and long-term reduced quality of life. J Trauma 2011; 71: 748–753. [DOI] [PubMed] [Google Scholar]
- 33.OECD. PPPs and Exchange Rates. https://stats.oecd.org/Index.aspx?DataSetCode=SNA_Table4. [Google Scholar]
- 34.The National Board of Health and Welfare. PRISLISTA NordDRG ÅR 2019 För Sluten/Öppen Vård. Dataset. [Google Scholar]
- 35.Mundell B, Maradit Kremers H, Visscher S, et al. Direct medical costs of accidental falls for adults with transfemoral amputations. Prosthet Orthot Int 2017; 41: 564–570. [DOI] [PubMed] [Google Scholar]
- 36.Clarke L Dillon MP and Shiell A. A systematic review of health economic evaluations in orthotics and prosthetics: part 1—prosthetics. Prosthet Orthot Int 2020. doi: 10.1177/0309364620935310 [DOI] [PubMed] [Google Scholar]
- 37.Denton JR and McClelland SJ. Stump fractures in lower extremity amputees. J Trauma 1985; 25: 1074–1078. [PubMed] [Google Scholar]
- 38.Gonzalez EG and Mathews MM. Femoral fractures in patients with lower extremity amputations. Arch Phys Med Rehabil 1980; 61: 276–280. [PubMed] [Google Scholar]