Abstract
Social media plays an important role in disseminating information and analysing public and government opinions. The vast majority of previous research has examined information diffusion and opinion analysis separately. This study proposes a new framework for analysing both information diffusion and opinion evolution. The change in opinion over time is known as opinion evolution. To propose a new model for predicting information diffusion and opinion analysis in social media, a forest fire algorithm, cuckoo search, and fuzzy c-means clustering are used. The forest fire algorithm is used to determine the diffuser and non-diffuser of information in social networks, and fuzzy c-means clustering with the cuckoo search optimization algorithm is proposed to cluster Twitter content into various opinion categories and to determine opinion change. On different Twitter data sets, the proposed model outperformed the existing methods in terms of precision, recall, and accuracy.
Keywords: Information diffusion, Social network, Forest fire algorithm, Cuckoo search, Fuzzy C-means clustering, Opinion analysis
Introduction
The information in social networks play a big role in public events that attract public and government attention. Political, economic, social, healthcare and cultural events aim to solve the problem through public address, which is sometimes critical. Online social networks (OSN) are internet-based social groups. It's like a node-and-edge graph. Individuals are nodes and their friendships or followings are edges. Through edges, people communicate. Anyone can post about any public event in an OSN. Individual agents who meet a neighbour with opposing or supporting views are encouraged to tweet in support of their thoughts. Information diffusion spreads information across a network.
According to experts [1] social networks are important for spreading information. Information spread has long been a public concern, especially for marketing and emergencies. Because social network users are no longer merely passive recipients of information, their actions have a significant impact on how a social network evolves and spreads. People form their social networks through the exchange of information. Topological relationships connected all network users, resulting in a massive and intricate web of connections [2].
Social influence is a person's intentional or unintentional effect on others. The changed person notices the influencer's relationship [3]. Individual relationships, network distances, timeliness, and personal traits all affect social influence[4]. Facebook and Twitter speed up information sharing[5].
Information diffusion and opinion evolution are considered autonomous processes, where the information diffusion model often assumes the reach of the topic to the agents, who initially have their ideas. The two autonomous processes, namely information diffusion and opinion evolution, are intertwined with one another. The change of opinions over time is known as opinion evolution. Most social networking sites aim to attract millions of users and disseminate information [6]. Recent research has used statistical observations and social network features to model information diffusion and opinion analysis separately.
Such modelling can predict the influence of social network characteristics on public opinion formation [7]. Using the diffusion and evolution of user opinions in social networks, opinions or sentiments can be predicted [8].
Nearly 300 million people use Twitter. A tweet is a 140-character message. It spreads information using hashtags, mentions, and retweets. Information diffusion spreads users' opinions. The opinions may be positive, negative, or neutral. Information diffusion on Twitter can change users' opinions about an event [9]. Information diffusion evolution and opinion analysis must be used together to determine user opinion.
In terms of information dissemination, there are two types of users in social networks, One is an information diffuser, and the other is an information non-diffuser. Diffusers are users who actively participate in spreading information through tweeting and retweeting. Non-diffusers are users who are ideally following others but are not tweeting or retweeting.
In this paper, a new methodology is proposed for predicting both diffusion and opinion evolution in social media. The proposed model employs a nature-inspired forest fire algorithm for modelling information diffusion to determine the diffuser and non-diffuser of information and the Fuzzy c-means clustering with cuckoo search optimization is used to identify opinion types and opinion evolutions (i.e., change of opinions).
The main contributions are summarized below:
First, the information diffusion in social media is modelled using a nature-inspired forest fire algorithm to identify the diffuser and non- diffuser of the information.
Second, with the help of the diffuser list, the tweets are grouped into various opinion categories such as positive, negative and neutral using the proposed Fuzzy c-mean clustering with the Cuckoo Search optimization algorithm. Finally, The change of opinion into various polarization is identified to predict the opinion evolution.
The rest of the paper is organized as follows: Sect. 2 presents the related works, and Sect. 3 describes the algorithm's working principles. The proposed models are described in Sect. 4, whereas Sect. 5 describes the data set and experimental setup. In Sect. 6, the results and discussion are presented, and in Sect. 7, the paper is concluded.
Literature review
Rehioui and Idrissi [10] proposed a density-based clustering algorithm(DENCLUE) to classify tweets into positive sentiments, negative sentiments, and neutral sentiments. The DENCLUE clustering model improves classification accuracy while the k-means clustering algorithm groups similar tweets into various opinion clusters. Kayıkçı [11] employs the Sentiment Demonetization Network(SenDemonNet) to analyse the sentiments of the tweets related to the implementation of demonetization in India in 2016. SenDemonNet extracts the features using principal component analysis, which is combined with a weighted feature selection method based on the forest whale optimization algorithm. Vashisht and Sinha [12] used the CAA (citizenship amend act-2019) tweets data set to classify tweet sentiments into positive, negative, and neutral sentiments using the support vector machine algorithm (SVM).
Marzijarani and Sajedi [13] used Gaussian Mixture Model (GMM) algorithm to cluster the text reviews into various opinion categories. Gopi et al. [14] proposed a tweets classification method using a radial basis function(RBF) kernel-based support vector machine to classify the tweets into various opinion categories based on the opinion scores.
Florea and Roman [15] proposed a multilayer perceptron neural network model to classify skilled users based on their education levels on Twitter data. It uses nine features from the Twitter data set to predict users' education levels and identify highly skilled users. Alboaneen et al. [16] proposed a multilayer perceptron tweet classification model with glow swarm optimization. Tyagi et al.[17] used a convolution neural network with LSTM deep neural network architecture to model a sentiment classification system for the Twitter data set. It only categorises tweets into two sentiment polarities: positive and negative. Patel and Passi [18] proposed a model using machine learning techniques to analyse people's sentiments using a Twitter data set collected during the 2014 football world cup tournament.
Phu et al.[19] created a sentiment classification model for big data that works in parallel. This model classifies data into various categories using Fuzzy c-means clustering and runs in parallel using Hadoop's map-reduce concept. Furthermore, Banerjee et al. [20] proposed a tweets clustering method based on fuzzy c-means clustering to identify different categories of tweets based on their sentiments.
Chandra et al. [21] proposed a hybrid clustering technique to classify the sentiments of tweets. The k-means clustering technique was used to cluster tweets, and the cuckoo search heuristic optimization was used to find optimal cluster heads to improve classification accuracy. Kumar et al. [22] improved sentiment classification accuracy by using cuckoo search optimization to select the best features from the tweets data set. Khattak et al. [23] proposed a personalised tweets recommendation that builds a user profile based on their interests and then analyses tweets for the recommendation. Pang et al. [24] created an Aspect based sentiment classification model based on BERT (Bidirectional Encoder Representations from Transforms) to classify tweets. For fine-grained sentiment classification, it employs a language representation model. Han et al. [25] proposed a sentiment analysis system for the Twitter data set based on a support vector machine with the fisher kernel function. Ugochi et al. [26] created a model for opinion classification using logistic regression for tweets and used the Latent Dirichlet Allocation (LDA) to identify the various topics discussed in the tweets data corpus.
Tang et al. [27] proposed Graph Domain Adversarial Transfer Network (GDATN) for cross-domain sentiment classification using Bidirectional Long Short-Term Memory (BiLSTM) Network and Graph Attention Network (GAT). Shuang et al.[28] created an interactive POS-aware network (IPAN) to improve part of speech-tagging and sentiment classification accuracy. Divate [29] developed a Long short-term memory(LSTM) based sentiment classification model for e-news in marathi.
To improve the sentiment classification accuracy of the opinion evolution process, this paper incorporates information dissemination features such as diffuser, non-diffuser, and opinion polarisation features such as positive, negative, and neutral with a time stamp feature. These analyses will be useful in making timely decisions in politics, socioeconomics, business, and entertainment.
Preliminaries
The proposed model is built based on the forest fire algorithm for information diffusion and Fuzzy c-means clustering with cuckoo search optimization for opinion analysis. This section describes the basics of these models used in the proposed methodology.
Forest fire algorithm
The forest fire algorithm[9] is a metaheuristics approach inspired by nature. A forest fire is an occurrence that occurs on occasion in dense forests. Forest fires have the property that if a tree catches fire, its immediate neighbours catch fire if they are susceptible and spread the fire to the adjacent trees, causing the majority of the trees in the forest to catch fire. The forest fire algorithm has three states: empty, tree, and fire. The forest is initially in an empty state, but when a new tree grows in it, it is transformed into a tree state. The trees catch fire as a result of an incident or external activity, and the fire spreads to other susceptible neighbour trees. The same scenario is considered to model information spread by identifying the diffuser and non-diffuser of information among social network users. The social network is visualised as a graph data structure with nodes and edges. The forest represents the social network in this case. The method takes into account two factors T and P, where T is the likelihood of a new tree growing in a forest and P is the likelihood of a tree catching fire.
Users in social networks can join and leave the network at any time. Users can post messages about any topic based on their intentions and comprehension. A new user joining social networks is represented by a tree in a forest. The forest fire represents the posting and reposting of messages on social media. As the fire spreads through neighbouring trees, the information on social media will be spread by the users' followers. The activity of tweeting and retweeting spreads the information even further. The tweeting probability of a user must be calculated and is the threshold value. To ascertain the activity of information dissemination. This algorithm is fed the social network graph G = (V, E). The set of nodes V represents the users, and the set of edges E represents the users' relationship. As an output, the forest fire algorithm generates a list of diffusers. The forest fire algorithm is described as follows: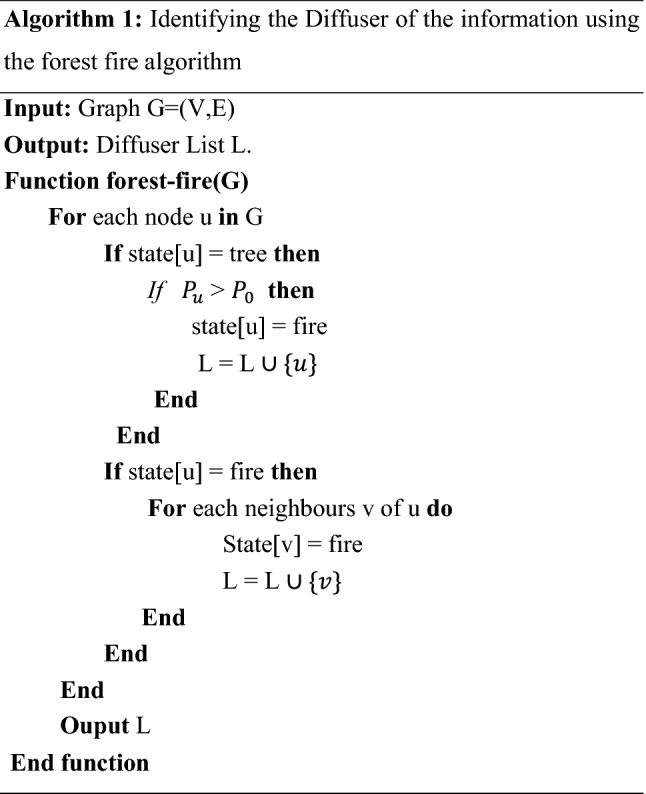
In Algorithm 1, the established Twitter data set is taken into account, and the state of the user nodes in the data set is initialised as a tree. The users who tweeted will then be assigned the state fire and added to the diffuser list.
Fuzzy c-means algorithm for clustering:
The fuzzy c-means(FCM) algorithm [20] is the well-known unsupervised soft clustering algorithm. It assigns a membership value to each data point based on the distance between the cluster centre and the data point. It makes the data points be a member of more than one cluster according to the membership value.
The fuzzy c-means algorithm is used here to group tweets into three opinion groups: positive opinion group, negative opinion group, and neutral opinion group. The data points are the extracted tweet features. As a result, the FCM locates the cluster centre and divides the data into opinion clusters based on the membership value of each data. The Euclidean distance measure is used to calculate the distance between the cluster centre and the data points ().
In Eq. 1, FCM works to minimise the given objective function.
| 1 |
In Eq. 1. m is the fuzzification parameter and takes the values as a real number greater than one and is the membership value of data point in the cluster from the cluster centre . The parameter N denotes the number of data points in the document and C is the number of clusters. The fuzzy membership matrix U is initially assigned random membership values of .
Equation 2 is used to update the membership values of each data point on each iteration.
| 2 |
The cluster centres are updated in each iteration using Eq. 3.
| 3 |
The iteration is terminated when , here the termination criteria takes the value between 0 and 1. k is the iteration step. When the termination criteria are satisfied, the value of might be minimum. FCM algorithm starts with the initialization of matrix U and executes Eqs. 2 and 3. repeatedly until the termination action criteria are satisfied and it gives the optimal cluster centre for the given set of input data points.
Cuckoo search algorithm
Cuckoo search (CS) [21] is a meta-heuristic optimization algorithm based on the breeding behaviour of the cuckoo bird. To increase their population, cuckoos lay their eggs in the nests of other host birds. The nest is selected at random. The following are the CS rules:
The cuckoo only lays one egg at a time in the nest. The nest is selected at random.
Nests with the highest quality eggs are considered suitable for passing on to future generations.
The number of host nests remains constant, and the host bird can decide whether to accept a foreign egg using the probability .
If the host bird discovers a foreign egg in the nest, it either discards the eggs or abandons the current nest.
In the CS algorithm, a cuckoo i uses the random walk defined in Eq. 4 to find new solutions, (t + 1).
| 4 |
where is the scaling factor for step size and s is the random step. The levy distribution is mentioned in Eqs. (5–6). can be used to generate the random step. The levy flight is a random walk used to explore the search space in a long run. is the current solution, is the best solution. The term product denotes the entry-wise multiplication. In Eq. 5. randan denotes the random numbers.
| 5 |
| 6 |
The new solution is determined using the current solution with the transition probability . The fraction of the poor quality nests will be eliminated and the new nest will be built using random walks. The cuckoo search algorithm is explained in Algorithm 2.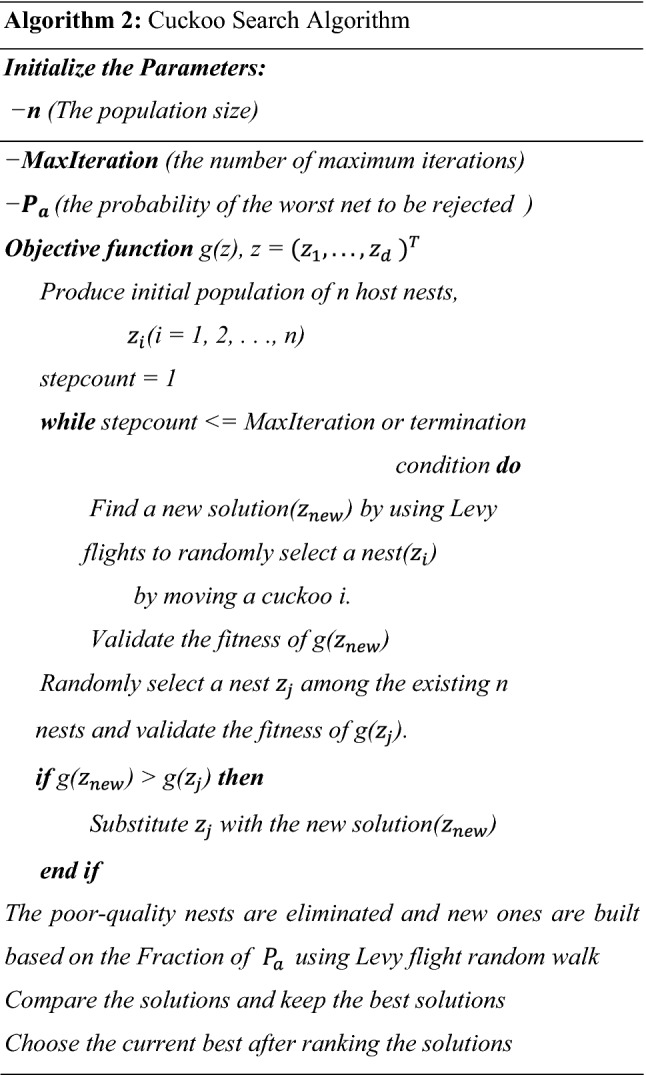
Proposed information diffusion and opinion evolution prediction model
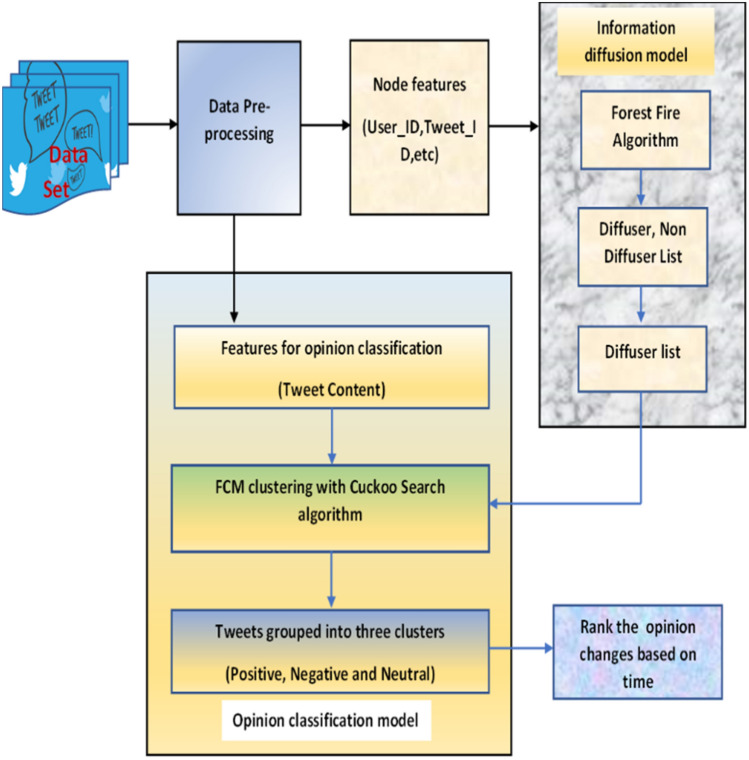
The proposed model is divided into two sub-models. The first is an information diffusion model based on the forest fire algorithm, and the second is an opinion evolution prediction model based on Fuzzy c-means clustering with cuckoo search optimization and tweet time stamps. The proposed model's data flow in three stages is depicted in Fig. 1.
Fig. 1.
Flow diagram of information diffusion and opinion dynamics prediction model
Using the forest fire algorithm, it first determines the information spread and then identifies the diffuser and non-diffuser of the information. In the second stage, it employs the FCM in conjunction with cuckoo search optimization to categorise tweet content into three groups. The output values are then used to analyse the change in opinions over time.
Information diffusion model with forest fire algorithm
The forest fire algorithm, as described in Sect. 3.1, can be used to model information diffusion activities in a social network. The task here is to identify message spreaders and non-spreaders to determine information dissemination. Twitter's node features are used to complete the task. Every user on Twitter is a node with a unique User id, and each Tweet has a unique Tweet id. If an event occurs and it makes the news, a person who is aware of the incident, namely a Twitter user, may be induced to make a tweet about the incident with his or her own opinion. Following that, some of the user's followers can do one of three things: reply to the tweet, re-tweet it, or create a new tweet about the event. In this way, the information will be disseminated and reach a larger number of people.
The tweeting ( and re-tweeting () probabilities of existing users must be calculated to identify the diffusion process.
Calculating a user's tweeting probability about an event
The tweeting probability, can be calculated by estimating factors such as user behaviour and the importance of the topic or event.
User Behaviour(UB): The user behaviour on Twitter can be estimated by considering the total count of tweets and retweets posted by the user for a period. The UB can be calculated using Eq. 7.
| 7 |
Topic Importance(TI): The importance of topics on Twitter can be measured based on the impact it creates locally and globally.
The tweet probability of a user can be computed mathematically using the following Eq. 8.
| 8 |
Calculating use’s retweeting probability of about an event:
Twitter users may be induced to retweet based on the attributes and functionalities provided by Twitter. Retweeting is an activity that contributes much to proliferating the information in social networks. We consider the following functionalities and attributes to compute the retweeting probability of a user.
User tagged(UT): The function @mention on Twitter is used to tag another user id. It is mentioned in Eq. 9.
| 9 |
User similarity: There is a high probability that similar users may think and behave similarly. To identify a similar user on Twitter we need to compute the similarity score between the users. The Jaccard similarity measure between two users (X, Y) is denoted as k.
| 10 |
In Eq. 10, we measure the similarity between the accounts of two users X and Y with k features of Twitter. Equation 10 shows the difference between the counts of values of the features common to both accounts. Our proposed model has extracted five different features namely the followings list(, hashtags mentioned(, user location(, followers list(, and languages used ( from Twitter.
The similarity score (SS) can be calculated using Eq. 11. The similarity is computed as the summation of the weighted values of the extracted features.
| 11 |
The weights , respectively associated with the features such as following list, User location, Hashtag mentioned, Followers list and Language used. The summation of the weights is equal to one as mentioned in Eq. 12. the weights take the values between 0 to 1.
| 12 |
Finally, the retweeting probability can be calculated using the weighted summation of the features namely user behaviour, topic importance, user tagged and the similarity score. Retweeting probability () is mathematically represented using Eq. 13.
| 13 |
In Eq. 13. the sum of the value of the weights will be 1. The random values between 0 to 1 were assigned to the weights according to their significance.
The above-discussed features are appropriately mapped with the forest fire algorithm to simulate information dissemination in social networks. Then the tweets of the diffusers are given as input to the opinion evolution prediction model.
Opinion evolution prediction model
The forest-fire algorithm described in Sect. 4.1.2 is used in the first stage to determine whether social media content is diffused and to identify the diffuser and non-diffuser of information. The proposed model's second stage categorises the diffusers' tweet contents into three different opinion categories: positive, negative, and neutral. The perception of the user's motive about the topic or event can be determined using this clustering. Furthermore, the change in opinions over time can be identified by ranking the opinions based on the time-stamp value. Before feeding the tweet data set into the model, data pre-processing procedures are used to remove unrelated data. Pattern removal, tokenization, stemming, stop word removal, and encoding techniques are used as data pre-processing procedures.
Data pre-processing
Following the collection of the tweets dataset, the tweets must be pre-processed to remove unwanted data
i)Pattern removal: removing special characters such as @,&, and the URL. These patterns do not convey any meaningful information.
ii)Tokenization and stemming: Tokenization is the process of breaking sentences down into individual words known as tokens. The process of determining the root word of each token is known as stemming.
iii)Vectorization. It is the procedure for converting words into vectors. The bag of words model [30] or the TF-IDF model [31] can be used for vectorization. The TF-IDF model was used to convert words into vectors in this case. Equations 14 and 15 can be used to calculate the term frequency-inverse document frequency of each word.
| 14 |
| 15 |
The vector of each word w in a tweet is represented using Eq. 16.
| 16 |
iv) Stop word removal: Stop words such as 'is,' 'was,' 'and,' 'or,' and so on must be removed from the data set because they have no meaning.
Feature extraction
(i) Exclamatory words (wep, wen): When people express their feelings, they can use exclamatory words such as baravo! hooray! and so on, which are used to express positive emotions or opinions about events. Similarly, negative exclamatory words are used to express negative emotions. The positive and negative exclamations in the tweets are counted using the positive and negative exclamation word dictionaries[32].
(ii) Negation (wn)): Negative emotions can be expressed using the negation words such as no, not, etc. Hence, the negations present in a tweet are also counted by comparing them with the set of negative words.
(iii) Positive words(wp): To determine the positive opinion, the positive words in the tweets are counted using the positive word dictionary[33].
(iv) Negative words(wne): To identify negative opinions, negative word counts are calculated by comparing tweets to a negative words dictionary[34].
(v) Neutral and Intense words(wni): The neutral and intense words in the tweets are identified and counted using neutral and intense word dictionaries[35].
Following the extraction of the various types of words described above. Equation 17 describes how to create the feature vector for the tweet i utilising Eq. 16
| 17 |
Opinion evolutions(changes) prediction using fuzzy c-means clustering with cuckoo search
The feature vectors calculated using Eq. 17 for all tweets are fed into the opinion evolution prediction model, which clusters the tweets based on sentiment categories. It employs the fuzzy c-means algorithm (FCM) and the Cuckoo Search method (CS method). In this case, FCM is used to cluster the tweets into three distinct categories, and the cuckoo search method is used to further optimise the cluster heads to improve classification accuracy. Normally, the CS method randomly initialises the population, but this requires more iterations to converge and can sometimes trap in local minima. As a result, this method uses the clusters generated from FCM to initialise the features for the cuckoo search while also resolving the random initialization problem.
Consider that there are n tweets and each tweet has s features. The tweets are clustered into N groups. The feature vector represents each tweet i.
The clustering probability xi of every tweet i is given in Eq. 18. Which is derived from Eq. 17.
| 18 |
If a tweet xi has a minimum Euclidean distance from the cluster centre then the tweet xi will be grouped into cluster j. Therefore, the probability of the occurrence of a tweet xi in cluster j can be determined by minimizing the intra-class variance between the cluster centre and the feature xi using FCM method.
| 19 |
To group the different tweets into a cluster, the intra-cluster variance must be minimized. Therefore, the proposed clustering method is used to minimize the objective function defined in Eq. 19. and optimizes the cluster centres further using the CS method. The proposed hybrid clustering method is given in Algorithm 4.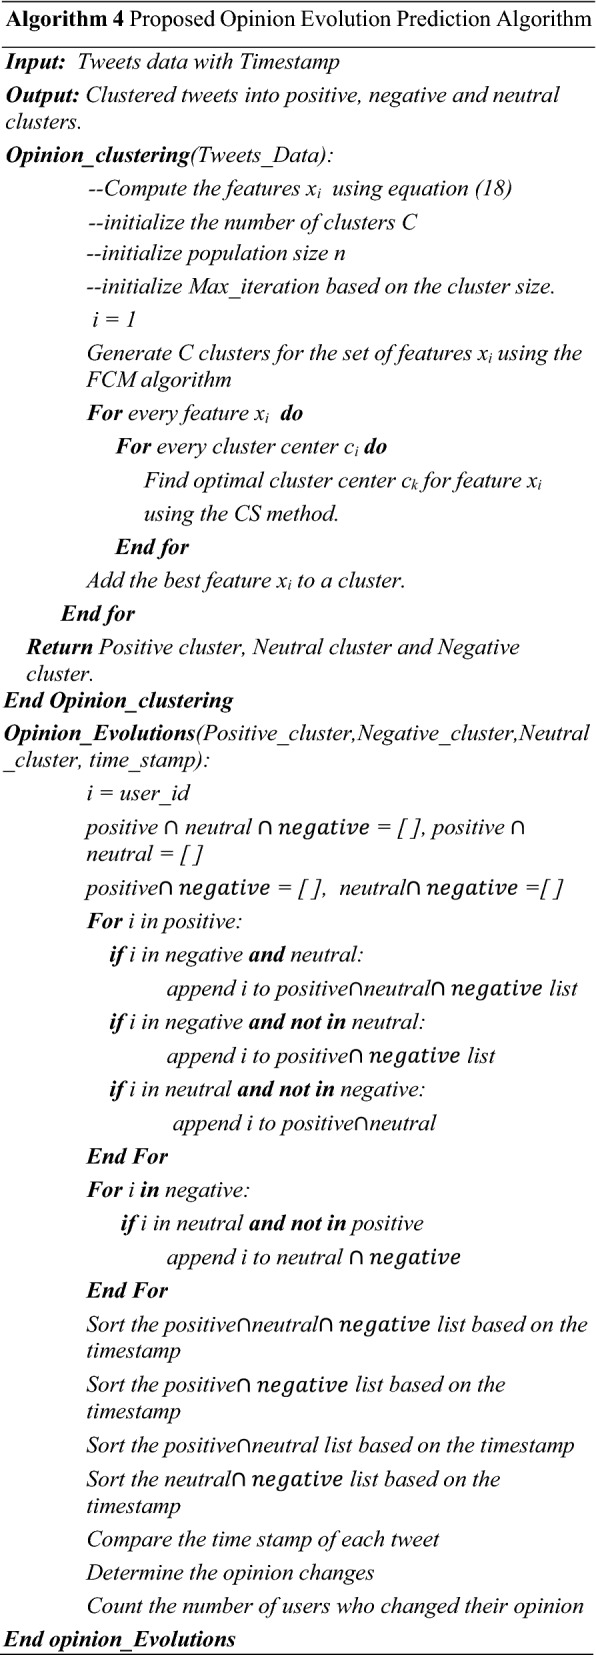
Following the completion of the tweet classification, the opinion dynamics will be examined using the time stamp of each tweet. Using algorithm 4, The positive neutral is the list of users who tweeted at different times and were classified into all three opinion categories. Then, using the tweet’s time stamps, the opinion dynamics or evolutions can be determined, such as whether they are positive to negative or neutral, and vice versa. The positive is the list of users who have tweeted both in positive and negative categories. The users who have posted tweets into positive and neutral categories are added to the positive neutral list. The neutral is the list of users who have posted tweets and have only been classified as neutral and negative. The opinion dynamics are identified using the lists generated in the preceding steps by filtering tweets based on the timestamp. The number of users who changed their minds during the information dissemination process can then be counted.
Data set descriptions and experimental setup
In this paper, three different tweet data sets, namely coronavirus or "COVID19," FIFA World Cup, and "NBA Finals," were used to test the algorithm's efficiency and opinion change analysis. All of these data sets were gathered from Kaggle.com, an online open-source data set repository.
The coronavirus data set, also known as "COVID19," contains tweets about the coronavirus pandemic. It has an impact on people all over the world. Many people lost loved ones as well as their livelihoods. It began in 2019 and was declared a pandemic by the World Health Organization (WHO) in 2020. This data set was gathered on March 13, 2020 (https://www.kaggle.com/datasets/smid80/coronavirus-covid19-tweets) [36].
The FIFA World Cup data set contains tweets related to the World Cup football tournament held in Russia from June 14 to July 15, 2018 (https://www.kaggle.com/datasets/ rgupta09/world-cup-2018-tweets) [37].
The NBA Finals dataset contains tweets extracted from the final game of the 2018 NBA (National Basketball Association). The final match featured the Golden State Warriors and the Cleveland cavaliers.
(https://www.kaggle.com/datasets/xvivancos/tweets-during-cavaliers-vs-warriors) [38].
The data sets are described in Table 1. The proposed model was written in Python and made use of several related packages, including NLTK, NUMPY, PANDAS, Scikit-learn, and Seaborn. The experiments are carried out on a personal computer system equipped with a 1.19 GHz Intel i5 processor. The computer has a 16 GB main memory and a 250 GB SSD memory.
Table 1.
Data set description
| Data set name | No. of tweets | No. of retweets | Total followers count | Time duration |
|---|---|---|---|---|
| Coronavirus pandemic | 300,273 | 694,338 | 42,819,166,666 | March 13, 2020 |
| FIFA world Cup 2018 | 242,876 | 41,927 | 2,441,853,742 | July 2, 2018 to July 7, 2018 |
| NBA finals 2018 | 19,986 | 31,439 | 748,874,447 | June 7, 2018 |
Result and discussion
To begin analysing the information diffusion process, we extracted node features from the Twitter data set to identify the diffuser and non-diffuser of the information. The number of new users joining Twitter and old users leaving Twitter is also taken into account but as a constant population. So the probability of new users joining is set to zero. The probability of any user, tweeting is estimated using Eq. 8. The weights of various parameters such as the following list() = 0.3, the hashtag mentioned( = 0.25, languages used() = 0.25, user location( and the followers list( are assigned To calculate the similarity measure (SS) mentioned in Eq. 11. Equation 13 is used to calculate a user’s retweeting probability of any user is calculated using Eq. 13. The weights of various parameters such as user behaviour(, user tagged , user similarity( and the topic importance , are used to calculate the retweeting probability, and the diffuser and non-diffuser lists are extracted using the forest fire algorithm. The weights were determined through experimentation. In our experiment, we only look at the diffuser list. The users who posted the tweets and retweets are added to the diffuser list, which is used for opinion analysis.
The content of the tweet is available in the data set in the column titled original tweets. We only looked at the original tweet column for sentiment analysis. Then, as described in Sect. 4.2, we extracted the features required for sentiment or opinion analysis. Table 2 displays the data set’s ground truth.
Table 2.
Data set ground truth values
| Data set name | No. of positive tweets | No. of neutral tweets | No. of negative tweets |
|---|---|---|---|
| Coronavirus pandemic | 52,389 | 63,902 | 183,982 |
| FIFA world Cup 2018 | 125,367 | 82,389 | 35,120 |
| NBA finals 2018 | 8290 | 5678 | 6018 |
The fuzzy membership matrix, U-0, is initialised with random values, m = 2, the termination criteria, e = 0.01, and the number of clusters, C = 3 in the FCM algorithm. All of the parameters in our experiments are determined experimentally.
Performance evoluation with the existing methods
The proposed method and the existing method's clustering or classification accuracy were measured and compared using performance validation measures such as precision, recall, and accuracy. The proposed Forest fire and time-stamp-based fuzzy c-means algorithm with cuckoo search (FF-FCM-CS) classification model are compared to the existing sentiment classification approaches, which include Multilayer perceptron with Glow Swarm optimization [16], Cuckoo search with k-means clustering (CSK) [21], and Support vector machine with Fisher kernel function (FK-SVM) [25].
Precision: Precision is defined as the ratio of correctly classified true positive values to the total predicted true positive values and the number of incorrectly predicted negative values.
Recall: The proportion of correctly classified true positive values to the total number of correctly classified positive and negative values is defined as recall.
Accuracy: Accuracy is defined as the ratio of correctly classified values to the total number of classified values. The accuracy is calculated using Eq. 20.
| 20 |
Tables 3, 4, 5 show that the proposed method FF-FCM-CS achieves improvements of at least 4% for precision, 3% for recall and 4% for accuracy, respectively over the other existing methods with a diffuser list.
Table 3.
Precision measure with diffuser list
| Data set/methods | Precision measure | |||
|---|---|---|---|---|
| With diffuser list | ||||
| CSK | FF-FCM-CS | MLP-GSO | FK-SVM | |
| Coronavirus pandemic | 80 | 85.3 | 78.2 | 75 |
| FIFA World Cup 2018 | 84 | 88.4 | 80 | 78 |
| NBA finals 2018 | 86 | 90 | 81.6 | 80 |
Table 4.
Recall measure with diffuser list
| Data set/methods | Recall measure | |||
|---|---|---|---|---|
| With diffuser list | ||||
| CSK | FF-FCM-CS | MLP-GSO | FK-SVM | |
| Coronavirus pandemic | 76 | 80.4 | 74 | 70 |
| FIFA world Cup 2018 | 82.4 | 86 | 80 | 74.3 |
| NBA finals 2018 | 84 | 88 | 84 | 78 |
Table 5.
Accuracy measure with diffuser list
| Data set/methods | Accuracy measure | |||
|---|---|---|---|---|
| With diffuser list | ||||
| CSK | FF-FCM-CS | MLP-GSO | FK-SVM | |
| Coronavirus pandemic | 78.2 | 84 | 76 | 72 |
| FIFA world Cup 2018 | 82.3 | 84.5 | 81 | 76 |
| NBA finals 2018 | 85 | 89.2 | 83.4 | 78 |
The precision, recall, and accuracy measures of various methods without the diffuser list are shown in Tables 6, 7, 8. When comparing the results with and without diffuser features, the classification accuracy improved by 1.5 to 2% with the diffuser list rather than without the diffuser list in terms of precision, recall, and accuracy measures. The results show that the proposed FF-FCM-CS method outperforms the other methods It also show that the proposed FF-FCM-CS method outperforms the other methods both with and without a diffuser list.
Table 6.
Precision measure without diffuser list
| Data set/methods | Precision measure | |||
|---|---|---|---|---|
| Without diffuser list | ||||
| CSK | FF-FCM-CS | MLP-GSO | FK-SVM | |
| Coronavirus pandemic | 78.5 | 83.4 | 76.2 | 73 |
| FIFA world Cup 2018 | 82.2 | 86.3 | 78.2 | 76.3 |
| NBA finals 2018 | 84.3 | 88 | 80 | 78 |
Table 7.
Recall measure without diffuser list
| Data set/methods | Recall measure | |||
|---|---|---|---|---|
| Without diffuser list | ||||
| CSK | FF-FCM-CS | MLP-GSO | FK-SVM | |
| Coronavirus pandemic | 74.5 | 76.3 | 72.3 | 69 |
| FIFA world Cup 2018 | 80.3 | 84.3 | 78.3 | 72 |
| NBA finals 2018 | 82.5 | 86.5 | 82.3 | 76.4 |
Table 8.
Accuracy measure without diffuser list
| Data set/methods | Accuracy measure | |||
|---|---|---|---|---|
| Without diffuser list | ||||
| CSK | FF-FCM-CS | MLP-GSO | FK-SVM | |
| Coronavirus pandemic | 76 | 82.5 | 74.5 | 70.5 |
| FIFA world Cup 2018 | 80.5 | 84.3 | 79.1 | 74.5 |
| NBA finals 2018 | 83 | 87 | 82 | 76 |
Opinion evolution prediction analysis
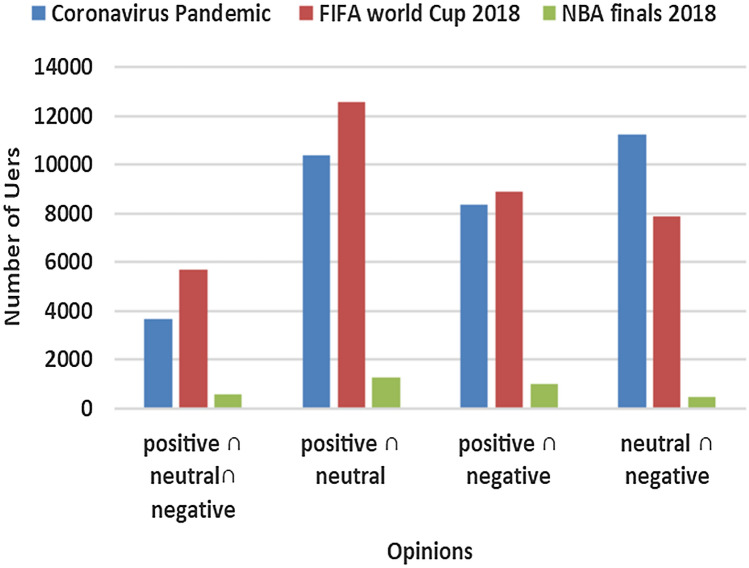
Finally, an opinion change analysis has been performed on clustered tweet content. One can use this analysis to determine how many people changed their minds over time due to the influence of others via the information diffusion process.Only the output of the FF-FCM-CS method was used. The tweets are divided into three categories: positive, negative, and neutral. Simple logical operations are used to perform the change analysis. First, the numbers of users who are positive, negative, or neutral were filtered. The bar chart in Fig. 2 shows how many users tweeted and changed their perception from positive to neutral and negative and vice versa.
Fig. 2.
Number of users who posted tweets in various categories
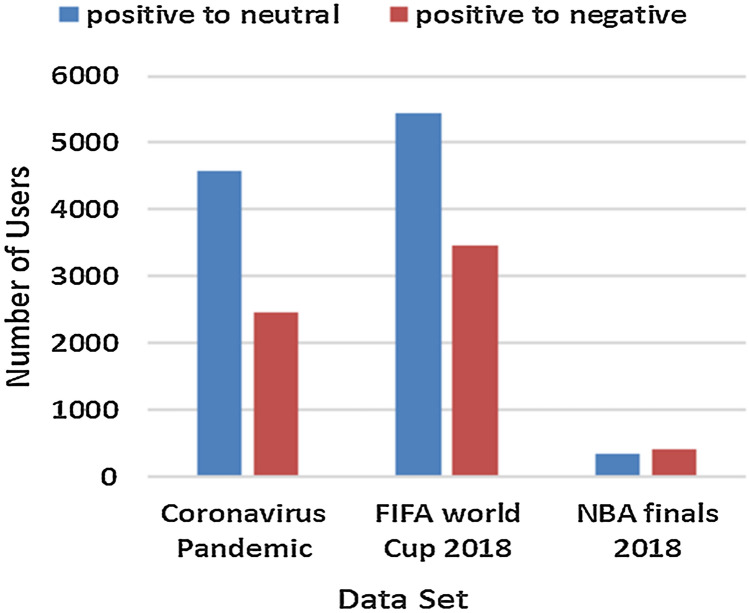
The bar chart in Fig. 3 shows that users who initially had a positive opinion of the events, have changed their opinion to neutral and then, after some time, to a negative opinion as time passes and the influence of the information diffusion process. The user-id and timestamp of the tweets have been taken into account for this analysis. Several tweets may have been sent by the same user during the events. If all of the tweets fall into the same category, the tweets will be assigned to a single opinion category. If the tweets have different opinions, they will be divided into two or more opinion categories. The timestamp of the tweets can then be used to determine the change in opinion.
Fig. 3.
The number of users who changed their opinion from positive to neutral and negative
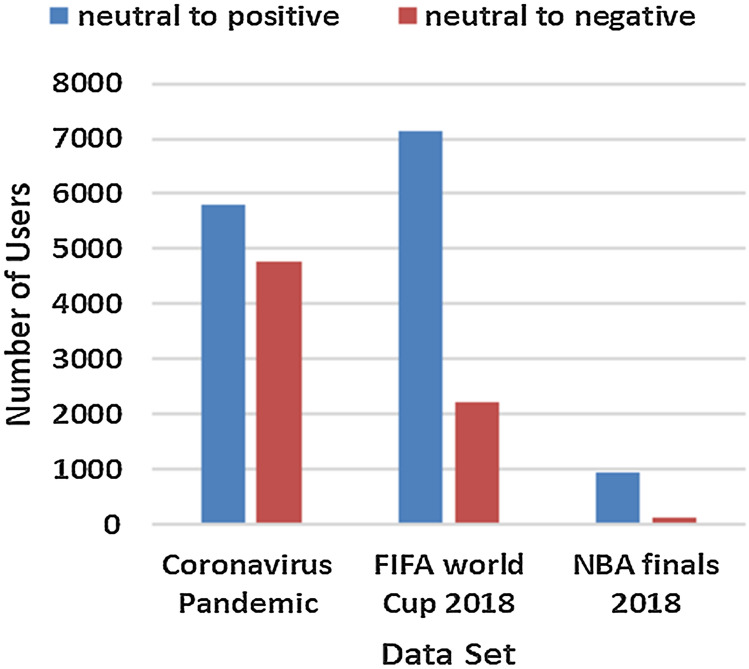
The bar chart in Fig. 4 depicts the users who have posted tweets about the topics. Initially, the tweets had a neutral opinion. The same user changed their mind and posted tweets with positive opinions after being influenced by other users or the dissemination of information, and after some time, the same user posted tweets with negative opinions.
Fig. 4.
The number of users who changed their pinion from neutral to positive and negative
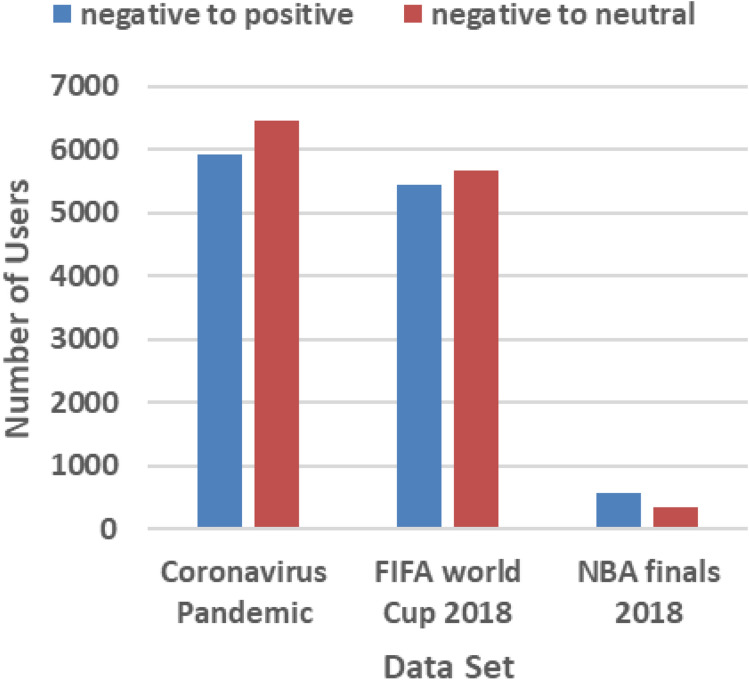
The bar chart in Fig. 5 shows that users who tweet about an event for the first time and the tweet were classified as having a negative opinion. However, the same user tweeted about the same events, first with a positive opinion and then with a neutral opinion.
Fig. 5.
The number of users who changed their opinion from negative to positive and neutral
Conclusions
This paper examines both information diffusion and opinion evolution. The proposed information diffusion and opinion evolution prediction model has been developed using the nature-inspired forest-fire algorithm and time-stamp-based fuzzy c-means clustering with cuckoo search optimization. The forest fire algorithm is used to model the process of information diffusion. This model identifies the diffuser and non-diffuser of information. If the information is disseminated, fuzzy c-means clustering with cuckoo search optimization is used to classify and predict the change of the opinion of tweets. The opinion change analysis concludes that the information diffusion process influences users to change their opinions on various events. According to a comparison of findings from different Twitter data sets, the proposed model could improve opinion classification performance by 4% precision, 3% recall, and 4% accuracy over the existing methods. Experimental results also show that diffuser analysis can improve the opinion clustering accuracy from 1.5 to 2% than that without diffuser analysis-based prediction.
The effects of information diffusion and opinion dynamics on real-time recommendation systems will be investigated in the future.
Contributor Information
Samson Ebenezar Uthirapathy, Email: u.samson@gmail.com.
Domnic Sandanam, Email: domnic@nitt.edu.
References
- 1.Ureña R, Kou G, Dong Y, Chiclana F, Herrera-Viedma E. A review on trust propagation and opinion dynamics in social networks and group decision making frameworks. Inf Sci. 2019;478:461–475. doi: 10.1016/j.ins.2018.11.037. [DOI] [Google Scholar]
- 2.Chen M, Mao S, Liu Y. Big data: a survey. Mobile Netw Appl. 2014;19(2):171–209. doi: 10.1007/s11036-013-0489-0. [DOI] [Google Scholar]
- 3.Peng S, Zhou Y, Cao L, Yu S, Niu J, Jia W. Influence analysis in social networks: a survey. J Netw Comput Appl. 2018;106:17–32. doi: 10.1016/j.jnca.2018.01.005. [DOI] [Google Scholar]
- 4.Wang Y, McKee M, Torbica A, Stuckler D. Systematic Literature Review on the Spread of Health-related Misinformation on Social Media. Social Sci Med. 2019;240:112552. doi: 10.1016/j.socscimed.2019.112552. [DOI] [PMC free article] [PubMed] [Google Scholar]
- 5.Abdullah S, Wu X (2011) An epidemic model for news spreading on twitter. In: 2011 IEEE 23rd International Conference on Tools with Artificial Intelligence.(ICTAI). IEEE. 10.1109/ictai.2011.33
- 6.Hargittai E, Walejko G. THE PARTICIPATION DIVIDE: content creation and sharing in the digital age1. Inf Commun Soc. 2008;11(2):239–256. doi: 10.1080/13691180801946150. [DOI] [Google Scholar]
- 7.Wang Y, Wang J, Wang H, Zhang R, Li M. Users’ mobility enhances information diffusion in online social networks. Inf Sci. 2021;546:329–348. doi: 10.1016/j.ins.2020.07.061. [DOI] [Google Scholar]
- 8.Li W, Zhong K, Wang J, Chen D. A dynamic algorithm based on cohesive entropy for influence maximization in social networks. Exp Syst Appl. 2021;169:114207. doi: 10.1016/j.eswa.2020.114207. [DOI] [Google Scholar]
- 9.Kumar P, Sinha A. Information diffusion modeling and analysis for socially interacting networks. Soc Netw Anal Min. 2021 doi: 10.1007/s13278-020-00719-7. [DOI] [PMC free article] [PubMed] [Google Scholar]
- 10.Rehioui H, Idrissi A. New clustering algorithms for twitter sentiment analysis. IEEE Syst J. 2020;14(1):530–537. doi: 10.1109/jsyst.2019.2912759. [DOI] [Google Scholar]
- 11.Kayıkçı Ş. SenDemonNet: sentiment analysis for demonetization tweets using heuristic deep neural network. Multimed Tools Appl. 2022;81(8):11341–11378. doi: 10.1007/s11042-022-11929-w. [DOI] [PMC free article] [PubMed] [Google Scholar]
- 12.Vashisht G, Sinha YN. Sentimental study of CAA by location-based tweets. Int J Inf Technol. 2021;13(4):1555–1567. doi: 10.1007/s41870-020-00604-8. [DOI] [PMC free article] [PubMed] [Google Scholar]
- 13.Marzijarani SB, Sajedi H. Opinion mining with reviews summarization based on clustering. Int J Inf Technol. 2020;12(4):1299–1310. doi: 10.1007/s41870-020-00511-y. [DOI] [Google Scholar]
- 14.Gopi AP, Jyothi RNS, Narayana VL, Sandeep KS. Classification of tweets data based on polarity using improved RBF kernel of SVM. Int J Inf Technol. 2020 doi: 10.1007/s41870-019-00409-4. [DOI] [Google Scholar]
- 15.Florea AR, Roman M. Artificial neural networks applied for predicting and explaining the education level of Twitter users. Soc Netw Anal Min. 2021;11:112. doi: 10.1007/s13278-021-00832-1. [DOI] [PMC free article] [PubMed] [Google Scholar]
- 16.Alboaneen DA, Tianfield H, Zhang Y (2017) Sentiment analysis via multi-layer perceptron trained by meta-heuristic optimisation. In 2017 IEEE International Conference on Big Data (Big Data). IEEE. 10.1109/bigdata.2017.825850
- 17.Tyagi V, Kumar A, Das S (2020) Sentiment analysis on twitter data using deep learning approach. In 2020 2nd International Conference on Advances in Computing, Communication Control and Networking (ICACCCN). 10.1109/icacccn51052.2020.9362853
- 18.Patel R, Passi K. Sentiment analysis on twitter data of world cup soccer tournament using machine learning. ioT. 2020;1(2):218–239. doi: 10.3390/iot1020014. [DOI] [Google Scholar]
- 19.Phu VN, Dat ND, Ngoc Tran VT, Ngoc Chau VT, Nguyen TA. Fuzzy c-means for english sentiment classification in a distributed system. Appl Intell. 2016;46(3):717–738. doi: 10.1007/s10489-016-0858-z. [DOI] [Google Scholar]
- 20.Banerjee S, Badr Y, Al-Shammari ET. Social networks: a framework of computational intelligence. Berlin: Springer International Publishing; 2013. Analyzing tweet cluster using standard fuzzy c means clustering; pp. 377–406. [Google Scholar]
- 21.Chandra Pandey A, Singh Rajpoot D, Saraswat M. Twitter sentiment analysis using hybrid cuckoo search method. Inf Process Manag. 2017;53(4):764–779. doi: 10.1016/j.ipm.2017.02.004. [DOI] [Google Scholar]
- 22.Kumar A, Jaiswal A, Garg S, Verma S, Kumar S. Sentiment analysis using cuckoo search for optimized feature selection on kaggle tweets. Int J Inf Retriev Res. 2019;9(1):1–15. doi: 10.4018/ijirr.2019010101. [DOI] [Google Scholar]
- 23.Khattak AM, Batool R, Satti FA, Hussain J, Khan WA, Khan AM, Hayat B. Tweets classification and sentiment analysis for personalized tweets recommendation. In: Khan A, editor. Complexity. New York: Hindawi Limited; 2020. pp. 1–11. [Google Scholar]
- 24.Pang G, Lu K, Zhu X, He J, Mo Z, Peng Z, Pu B. Aspect-level sentiment analysis approach via BERT and aspect feature location model. In: Duan Z, editor. Wireless communications and mobile computing. New York: Hindawi Limited; 2021. pp. 1–13. [Google Scholar]
- 25.Han K-X, Chien W, Chiu C-C, Cheng Y-T. Application of support vector machine (SVM) in the sentiment analysis of twitter dataset. Appl Sci. 2020;10(3):1125. doi: 10.3390/app10031125. [DOI] [Google Scholar]
- 26.Ugochi O, Prasad R, Odu N, Ogidiaka E, Ibrahim BH. Customer opinion mining in electricity distribution company using twitter topic modeling and logistic regression. Int J Inform Technol. 2022;14(4):2005–2012. doi: 10.1007/s41870-022-00890-4. [DOI] [Google Scholar]
- 27.Tang H, Mi Y, Xue F, Cao Y. Graph domain adversarial transfer network for cross-domain sentiment classification. IEEE Access. 2021;9:33051–33060. doi: 10.1109/access.2021.3061139. [DOI] [Google Scholar]
- 28.Shuang K, Gu M, Li R, Loo J, Su S. Interactive POS-aware network for aspect-level sentiment classification. Neurocomputing. 2021;420:181–196. doi: 10.1016/j.neucom.2020.08.013. [DOI] [Google Scholar]
- 29.Divate MS. International journal of Information technology. Berlin: Springer Science and Business Media LLC.; 2021. Sentiment analysis of Marathi news using LSTM; pp. 2069–2074. [Google Scholar]
- 30.Kuang L, Tang X, Guo K. Mathematical problems in engineering. New York: Hindawi Limited; 2014. Predicting the times of retweeting in microblogs; pp. 1–10. [Google Scholar]
- 31.Nesi P, Pantaleo G, Paoli I, Zaza I. Multimedia tools and applications. Berlin: Springer; 2018. Assessing the reTweet proneness of tweets: predictive models for retweeting; pp. 26371–26396. [Google Scholar]
- 32.Dictionary of Interjections, https://www.vidarholen.net/contents/interjections/
- 33.Jeffreybreen, Positive word dictionary, https://github.com/jeffreybreen/twitter-sentiment-analysis-tutorial-201107/blob/master/data/opinion-lexicon-English/positive-words.txt
- 34.Jeffreybreen, Negative word dictionary, https://github.com/jeffreybreen/twitter-sentiment-analysis-tutorial-201107/blob/master/data/opinion-lexicon-English/negative-words.txt
- 35.List of feeling words, http://www.psychpage.com/learning/library/assess/feelings.html
- 36.Shane smith, Coronavirus (covid19) Tweets https://www.kaggle.com/datasets/smid80/coronavirus-covid19-tweets, (2019)
- 37.Riptuparna, FIFA World Cup 2018 Tweets, https://www.kaggle.com/datasets/rgupta09/world-cup-2018-tweets, (2018)
- 38.Xavier, Tweets during Cavaliers vs Warriors, https://www.kaggle.com/datasets/xvivancos/tweets-during-cavaliers-vs-warriors, (2018)


