Abstract
Chitin is a key component of hard parts in many organisms, but the biosynthesis of the two distinctive chitin allomorphs, α- and β-chitin, is not well understood. The accurate determination of chitin allomorphs in natural biomaterials is vital. Many chitin-secreting living organisms, however, produce poorly crystalline chitin. This leads to spectrums with only broad lines and imprecise peak positions under conventional analytical methods such as X-ray diffraction (XRD), Fourier-transform infrared spectroscopy, and solid-state nuclear magnetic resonance spectroscopy, resulting in inconclusive identification of chitin allomorphs. Here, we developed a novel method for discerning chitin allomorphs based on their different complexation capacity and guest selectivity, using ethylenediamine (EDA) as a complexing agent. From the peak shift observed in XRD profiles of the chitin/EDA complex, the chitin allomorphs can be clearly discerned. By testing this method on a series of samples with different chitin allomorphs and crystallinity, we show that the sensitivity is sufficiently high to detect the chitin allomorphs even in near-amorphous, very poorly crystalline samples. This is a powerful tool for determining the chitin allomorphs in phylogenetically important chitin-producing organisms and will pave the way for clarifying the evolution and mechanism of chitin biosynthesis.
Introduction
Chitin is one of the principal organic skeletal components in invertebrate animals such as arthropods, mollusks, sponges, cnidarians, and annelids.1−8 Chitin is bio-synthesized in the form of microfibrils, where the elongated chitin molecules are packed in a highly ordered manner to form nanofibrous structures.9−13 Chitin crystalline nanofibers exhibit two distinctive forms, one with an antiparallel packing of chitin molecules known as α-chitin,14,15 and another with a parallel packing known as β-chitin,16−18 both of which occur in nature and are biosynthesized by organisms.1,2 In addition, γ-chitin has been described as a third allomorph,19 but it is structurally close to α-chitin and generally considered to be a variant of α-chitin.2,20 Arthropods such as crustaceans produce α-chitin, which is thought to be more abundant naturally compared to β-chitin, which is the main allomorph produced by diatoms,21,22 annelid worms,10 and mollusks such as squids.23 The two forms in chitin are analogous to cellulose, which also forms parallel (cellulose I)24 and anti-parallel (cellulose II)25 packing, but in cellulose, only the parallel-packed cellulose I occurs naturally.26 The mechanisms behind natural production of parallel-packed nanofibers is relatively well understood from cellulose research,27,28 but less is known about the natural production of chitin nanofibers, especially how living organisms make highly crystalline anti-parallel α-chitin.29
The precise identification of chitin allomorphs is inevitable and vital in addressing this question. Analytical methods often employed to distinguish them include X-ray diffraction (XRD),23,30 Fourier-transform infrared spectroscopy (FT-IR),31,32 and solid-state nuclear magnetic resonance spectroscopy (NMR).33,34 In the cases where the chitin samples are highly crystalline, such as chitin in the tubes of siboglinid worms,10,35 the peaks in the spectrums are indeed sufficiently sharp and well-defined for locating precise peak positions or peak splitting characteristic to each chitin allomorph. However, poorly crystalline samples, like those with low crystallinity or small crystal size, result in spectrums with only broad lines with imprecise peak position, leading to inconclusive identification of chitin allomorphs.36−38
The accurate determination of chitin allomorphs in poorly crystalline chitin is the key to understanding their natural biosynthesis, since evolutionarily important chitin-secreting living organisms such as lancelets, tunicates, and mollusks generally produce poorly crystalline chitin.36,39,40 To discriminate the two chitin allomorphs, the high intercalation (complexation) capacity of β-chitin, arising from the absence of hydrogen bonding between molecular sheets in β-chitin,41 is useful: only β-chitin is transformed into hydrates by intercalating water molecules between molecular sheets. However, this hydration-based determination of chitin allomorphs in poorly crystalline samples is not straightforward. Here, we propose a novel method for the identification of chitin allomorphs based on the different complexation capacity and guest selectivity of α- and β-chitin, using ethylenediamine (EDA) as a complexing agent.41−44 The EDA can be intercalated in both α- and β-chitin, but β-chitin can incorporate more EDA molecules than α-chitin,41,42 making the two chitin allomorphs discernible even in poorly crystalline samples. We test and show the effectiveness of this new method in determining chitin allomorphs using samples with various levels of crystallinity.
Materials and Methods
Materials
Purified water was used throughout this study (Milli-Q Advantage A10, Merck, Germany). Hydrochloric acid (HCl), sodium hydroxide (NaOH), sodium borohydride (NaBH4), acetic acid (AcOH), chloroform (CHCl3), sodium chlorite (NaClO2), acetic anhydride (Ac2O), methanol (MeOH), ethanol (EtOH), EDA, and chitosan (chitosan 100; degree of acetylation (DA): ∼0.2) were obtained from FUJIFILM Wako Pure Chemical (Osaka, Japan).
Sample Collection and Purification
A red king crab (Paralithodes camtschaticus) and several individuals of spear squids (Heterololigo bleekeri) were purchased in a grocery store. The king crab’s exoskeleton and the squids’ gladius (“squid pen”) were isolated by dissection. The siboglinid tubeworm (Lamellibrachia satsuma) was collected from Nikko seamount (23°04.86’N, 142°19.51′E, 458 m deep, Dec 2020) by a manipulator on the remotely operated vehicle (ROV) KM-ROV during the R/V Kaimei cruise KM20-10C leg 2. A Scaly-foot Snail (Chrysomallon squamiferum) was collected from Solitaire hydrothermal field (19°33.410 S, 65°50.890 E, 2606 m depth, Feb 2013) by a suction sampler on the deep-submergence vehicle (DSV) Shinkai 6500 during R/V Yokosuka cruise YK13-02, and the scales were dissected from the foot. Planktonic copepods (Pontella fera, Calanoida) were collected from the surface water during the R/V Yokosuka cruise YK19-11 by a neuston net from the Northwest Pacific approximately 400 km east off Japan (35°07.0’N, 145°00.0′E), identified and sorted out under a dissecting microscope, and then air-dried whole. Purification of chitin samples was performed according to the previous studies.45−48
Each sample was cut into small pieces about 1 cm in size (except Scaly-foot Snail’s scale and copepods that were purified whole) and soaked in a 2:1 (by volume) mixture of chloroform and acetic acid for 24 h to extract lipids. Demineralization, deproteinization, and decolorization were then carried out using 1 M HCl, 2.5 M aqueous NaOH, and 0.3 w/v% aqueous NaClO2 solution, respectively, followed by thorough washing with water. Each purification step was repeated four times. Purified samples were freeze-dried, except the squid pen that was subjected to air-drying at room temperature from water and EtOH, oven-drying at 60 and 150 °C from water, and freeze-drying from water. A N-acetylated chitosan sample was prepared by the acetylation of chitosan in acidic alcohol solution.49,50 Briefly, chitosan powder (chitosan 100, 1.5 g) was dissolved in 6 mL of AcOH/54 mL of water, followed by dilution with 240 mL of MeOH. The chitosan solution was then cooled to −10 °C, and the desired amount of Ac2O (molar ratio Ac2O/NH2: 2.1) was added. After complete mixing at −10 °C, the mixture was poured into cylindrical molds (bore size: 14 mm) at room temperature and left for 10 h to ensure complete gelation. After thoroughly washing with water, the N-acetylated chitosan sample was oven-dried at 105 °C. To observe the transformation from β-chitin to α-chitin, the purified squid pen was treated with 7, 7.5, and 8 M HCl for 0.5 h. After thorough washing with water, the HCl-treated squid pen samples were oven-dried at 105 °C. To observe the transformation from β-chitin to chitosan, the purified L. satsuma was treated with 12.5 M aqueous sodium hydroxide containing a small amount of NaBH4 to prevent depolymerization, at 90 °C for 0.5, 3, and 6 h. After thoroughly washing with water, the NaOH-treated L. satsuma samples were oven-dried at 105 °C. DA was measured by conductivity titration except N-acetylated chitosan, the DA of which was retrieved from literature.50
XRD Analysis
A wide-angle XRD experiment was performed on Nanopix (Rigaku Japan) at 40 kV and 30 mA with monochromatized and collimated Cu Kα radiation (λ = 1.548 Å). The capillary-sealed dry and wet specimen (saturated complex with water or EDA prepared by the immersion in water or EDA at room temperature for several hours42,51) was subjected to XRD measurements by the transmitting beam, where the camera length (sample-to-CCD distance: 82.37 mm) was calibrated with Si powder (d = 0.31355 nm). The peak top position was determined from the position with the highest intensity in the peak. The diffraction peaks were fitted with a pseudo-voigt function, and the crystal size, D, perpendicular to the diffraction planes, (020) plane in α-chitin and (010) plane in β-chitin, was evaluated using Scherrer’s expression:
where θ is the diffraction angle, λ is the wavelength of X-ray, and β is the peak width at half of the maximum intensity.
Results and Discussion
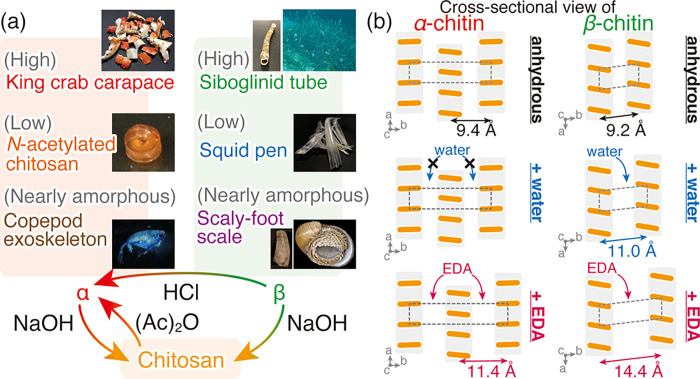
An overview of the chitin samples with known allomorphs used in the present study is shown in Figure 1a. Native chitin samples are characterized generally by three parameters: (i) allomorphs, α and β, (ii) crystallinity, and (iii) degree of N-acetylation. The β allomorph can be transformed into α-chitin by acid treatment30 or regeneration (dissolution and coagulation).54 Due to the higher stability of the antiparallel α-chitin compared to the parallel β-chitin, this transformation is irreversible and α-chitin never reverts to β-chitin. Chitin allomorphs are naturally produced with a wide range of crystallinity, depending on the organisms of origin.1,55,56 The degree of N-acetylation is another important parameter that varies among the organism-biosynthesized natural chitins and affects the quality of chitin allomorphs.1,55−57 The monomeric unit of chitin is N-acetyl-d-glucosamine, and the acetyl groups can therefore be removed by alkaline hydrolysis. Through deacetylation, chitin allomorphs lose crystallinity and become a rather amorphous substance denoted as chitosan. Through the N-acetylation of chitosan by acetic anhydride in acidic alcohol solutions, chitosan can be reverted to chitin and the resulting N-acetylated chitosan is identical to α-chitin with poor crystallinity.50 For a comprehensive test across an array of possible chitins, here we used α-chitin from the highly crystalline king crab carapace, the poorly crystalline N-acetylated chitosan, and β-chitin from the highly crystalline siboglinid worm tubes, the poorly crystalline squid pen. In addition, we also examined chitosan as the representative of samples with a low DA.
Figure 1.
Schematic illustration of (a) chitin samples used in this study and (b) cross-sectional crystal structure of native, dihydrate, and EDA complex of α- and β-chitin. Dotted rectangles represent the unit cell of the crystal structure of native, dihydrate, and EDA complex of α- and β-chitin.15,41,42,52,53 Orange bars and gray shadows represent the cross-section of chitin molecules and molecular sheets, respectively.
The identification of chitin allomorphs was conducted based on the complexations of chitin, as schematized in Figure 1b. In both α- and β-chitin, the molecular sheets of chitin molecules are the primary building units (Figure 1b). The different distances between these molecular sheets in α- and β-chitin result in characteristic peaks at 2θ = 9.4° and 9.6°, respectively. When hydrated with water, β-chitin takes up water between the molecular sheets and increases the distance between them, leading to a shift of above-mentioned peak to a lower angle, the extent of which depends on the number of the incorporated water molecules: 2θ = 8.6° in the case of monohydrate (one molecule per unit cell) and 2θ = 8.0° in dihydrate (two molecules per unit cell).16−18,52,53 Since this incorporation of water does not occur in α-chitin, the peak shift induced by hydration has often been used to identify the chitin allomorphs.58 However, in poorly crystalline samples, the identification based on hydration can be erroneous from a lack of clearly discernable peaks, due to the characteristic peaks being rather close together (detailed in the following section). Therefore, we newly employed EDA as the complexing agent. Although EDA can be incorporated in both α- and β-chitin, the β-chitin/EDA complex has a much larger inter-sheet distance (14.4 Å, 2θ = 6.1°)42 compared with those of β-chitin dihydrate (11.0 Å, 2θ = 8.0°)16,53 or α-chitin/EDA complex (11.4 Å, 2θ = 7.8°),41 making the peak shift easier to discern even in the poorly crystalline samples.
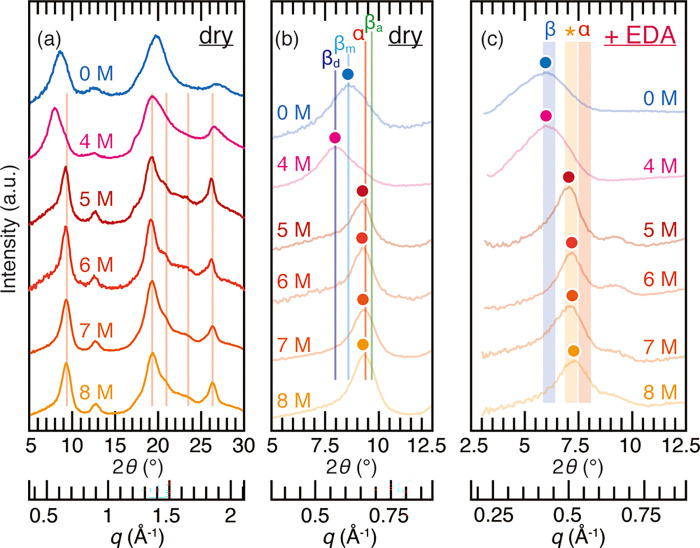
The representative XRD profiles of the chitin samples are shown in Figure 2a. When the crystallinity is high, one can distinguish α- and β-chitin with ease from the considerable number of sharp peaks. However, the poorly crystalline samples exhibited almost identical XRD profiles. Commercial chitosan also showed a broad profile, but the absence of the characteristic peak at 2θ = 8.5–9.7° is useful in its identification. It should be noted that depending on the preparation condition, chitosan forms hydrates that are rather crystalline, the XRD profile of which is similar to that of β-chitin (detailed in the following section). The detail of characteristic peaks at 2θ = 8.5–9.7° is shown in Figure 2b. The peak positions of highly crystalline α- and β-chitin materials matched well with the literature data.15,52 However, those of poorly crystalline α-chitin were lower than the literature data and located in between α-chitin and β-chitin monohydrate. This is possibly due to a property reported in cellulose, where the peak shifts to a lower angle by 2θ = ∼ 0.2° when the crystallinity is low or the crystal size is small.60 This peak shift can be a cause for misidentifying α-chitin as β-chitin. Another issue was seen in the poorly crystalline β-chitin, the peak of which matched well with that of β-chitin monohydrate, even though the chitin sample used (squid pen) was oven-dried at 60 °C.
Figure 2.
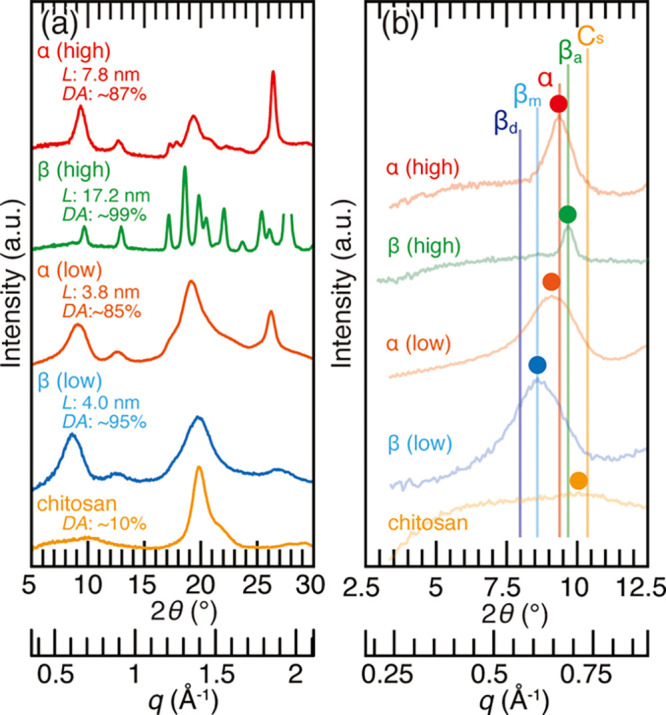
(a) X-ray diffraction profiles of the chitin samples used in this study. From top to bottom, king crab carapace, siboglinid worm tube, N-acetylated chitosan, squid pen, and commercial chitosan were used as the representatives of high (″high″ in red) and poorly (″low″ in orange) crystalline α-chitin, high (″high″ in green) and poorly (″low″ in blue) crystalline β-chitin, and samples with a low degree of acetylation (″chitosan″ in yellow), respectively. The values L and DA are the crystal size calculated from the peaks at 2θ = 8.5–9.7° [diffraction of (020) planes in α-chitin and (010) planes in β-chitin] and the degree of acetylation, respectively; (b) enlarged profiles of Figure 2a. α, βa, βm, βd, and Cs represent the peak positions of α-chitin, anhydrous β-chitin, β-chitin monohydrate, β-chitin dihydrate, and chitosan from the literature data.15,41,42,52,53,59 Colored dots represent the peak top position of the profiles.
This recalcitrant nature of β-chitin hydrate can be a cause for misidentification of allomorphs when using the conventional method based on the hydration with water.58 To demonstrate this, we analyzed poorly crystalline β-chitin samples (squid pen) prepared by a series of moderate drying methods (air-dried from ethanol and water, oven-dried from water at 60 °C, and freeze-dried from water) that are often employed in the biomaterial studies (Figure 3). Air-dried from water, oven-dried at 60 °C, and freeze-dried from water gave the peak corresponding to the β-chitin monohydrate. Even with a much harsher drying condition of oven-dried at 150 °C, the peak only slightly shifted but never reached the peak position corresponding to anhydrous β-chitin, though it is known that the highly crystalline β-chitin can be transformed into anhydrous form by drying at above 105 °C.62 Moreover, β-chitin prepared by air-drying from ethanol matched closely with literature values for β-chitin dihydrate. This lower peak position compared to the other drying methods was probably due to the trace of the β-chitin/ethanol complex.63 Therefore, attention needs to be paid to the use of biological samples stored in ethanol, as the peak of air-dried samples after ethanol storage does not shift to a lower angle by the rehydration, and the sample can be misinterpreted as α-chitin. In addition, when the sample is rehydrated by the simple immersion in water, the peak becomes highly blurred, and the peak position is not discernible. In this respect, the use of EDA as a complexing agent is advantageous: the peak of the EDA/β-chitin complex stood out even with simple immersion in EDA. This high sensitivity of chitin against EDA makes the preparation of XRD samples and interpretation of the results much more straightforward compared to the hydration method.
Figure 3.
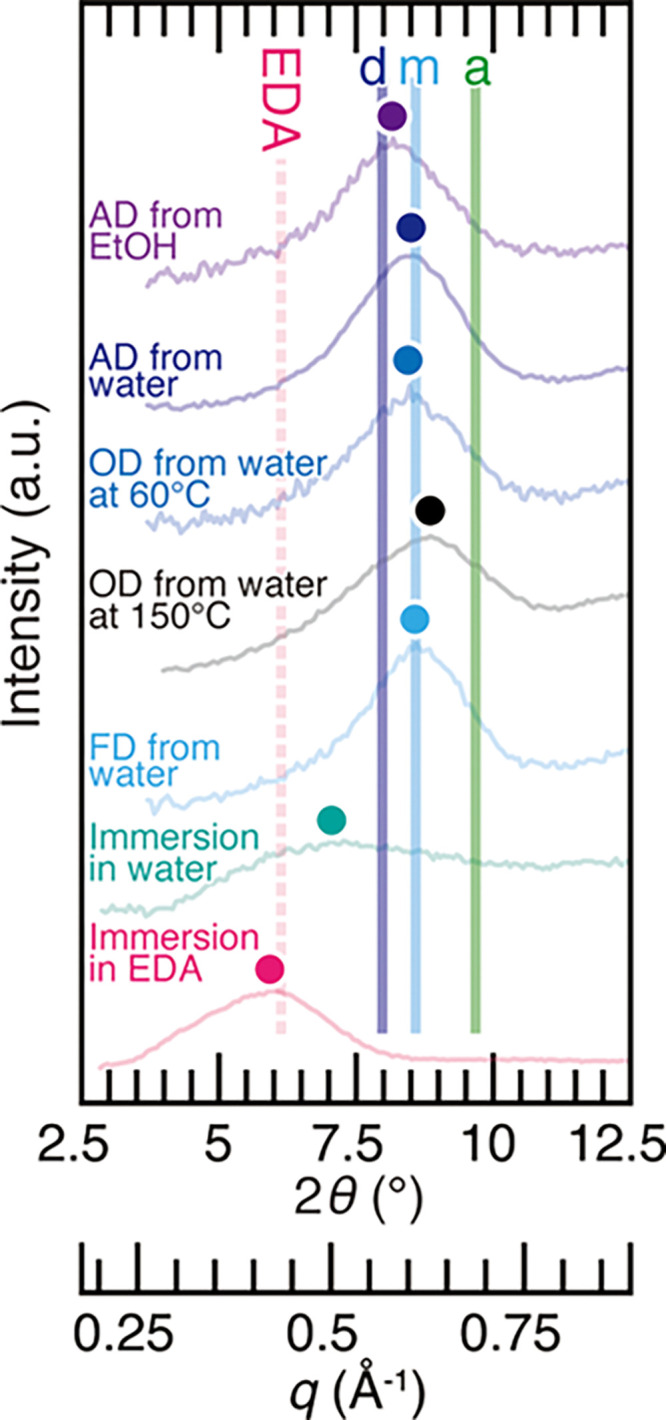
X-ray diffraction profiles of the squid pen prepared under different conditions. AD, OD, and FD represent air-dried, oven-dried, and freeze-dried, respectively. a, m, d, and EDA represent the peak positions of anhydrous β-chitin, β-chitin monohydrate, β-chitin dihydrate, and type II form of β-chitin/EDA complex from the literature data.42,53,61 Colored dots represent the peak top position of the profiles.
To test the effectiveness of our chitin/EDA complex method, the chitin samples were subjected to complexation with EDA by the simple immersion in EDA, as shown in Figure 4. The EDA complex of both high and poorly crystalline β-chitin fell into the reported peak position of the β-chitin/EDA complex42 with a margin of potential experimental error of plus or minus 2θ = 0.25°, which takes into account the potential peak shifts toward a lower angle induced by the low crystallinity or toward a higher angle caused by slightly different camera lengths (distance between the sample and detector) among the measurements upon the use of glass capillary with a diameter of 2 mm in XRD experiments (approximate estimate of discrepancy was 2θ = 0.23°). While the EDA complex of highly crystalline α-chitin was in accordance with the literature data, those of poorly crystalline α-chitin and chitosan fell into a position tentatively marked with an asterisk in Figure 3. Although the exact origin of this slightly wider distance between molecular sheets compared with the α-chitin/EDA complex is unknown, the poorly crystalline nature or a lower DA may be the reason behind the ″loose″ structure due to the imperfect hydrogen bonding network in poorly crystalline α-chitin samples. Either way, we show that one can distinguish the chitin allomorphs from the peak top position of the EDA complex by the following three categories: β-chitin when the peak is located between 2θ = 5.8 and 6.3°, poorly crystalline α-chitin or chitosan between 2θ = 6.9 and 7.4°, and highly crystalline α-chitin between 2θ = 7.5 and 8.0°.
Figure 4.
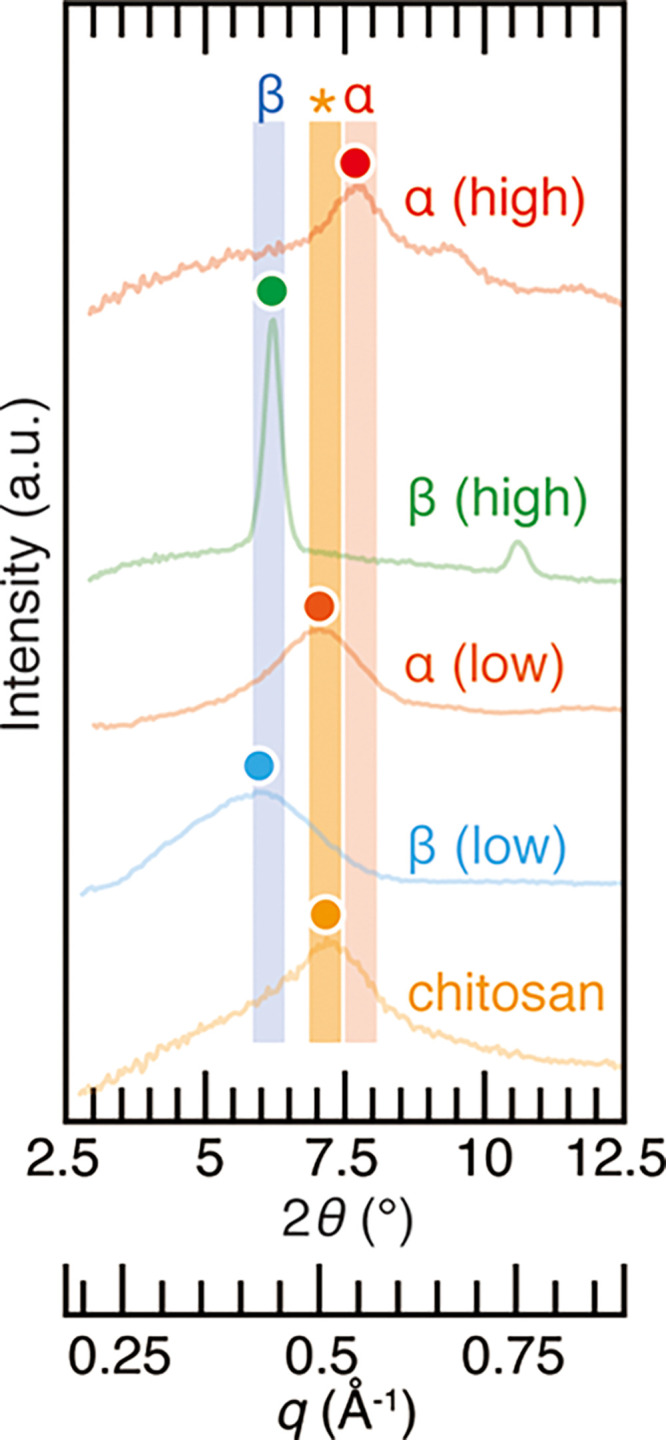
X-ray diffraction profiles of the EDA complex of chitin samples used in this study. From top to bottom, king crab carapace, siboglinid worm tube, N-acetylated chitosan, squid pen, and commercial chitosan were used as the representatives of high (″high″ in red) and poorly (″low″ in orange) crystalline α-chitin, high (″high″ in green) and poorly (″low″ in blue) crystalline β-chitin, and samples with a low degree of acetylation (″chitosan″ in yellow), respectively. Colored dots represent the peak top position of profiles. Shades denoted as α and β are the reported peak position of the EDA complex of α- and β-chitin with a margin of potential experimental error of plus or minus 2θ = 0.25°.41,42 The shade marked with an asterisk is the tentative peak position of the EDA/chitosan complex, newly reported herein, with a margin of potential experimental error of plus or minus 2θ = 0.25° to the peak position observed in chitosan of Figure 4.
To further corroborate the three categories, α-chitin prepared from β-chitin by a series of hydrochloric acid treatment was subjected to complexation with EDA. It is known that HCl at 7 M and above strongly swells highly crystalline β-chitin (siboglinid worm tube) and the transformation to α-chitin occurs upon washing.58,64 As shown in Figure 5a, poorly crystalline β-chitin (squid pen) was successfully transformed to α-chitin by treating with HCl at 5 M and above. The peaks centered at 2θ = 9.3° were indexed as reflections from the (020) plane of α-chitin (Figure 5b). By using the α-chitin samples, the validity of our EDA complexation method was examined (Figure 5c). Through the complexation with EDA, the peak top position of β-chitin treated with 5, 6, 7, and 8 M HCl fell into 2θ = 6.9 and 7.4°, indicative of poorly crystalline α-chitin or chitosan. Therefore, the allomorphs were correctly identified with EDA complexation. It should be noted that β-chitin treated with 5, 6, 7, and 8 M HCl showed a sharp peak at 2θ = 26.3°, which is indicative of α-chitin (the 0 1 3 diffraction), but this peak is not useful in the determination of chitin allomorphs, since in 2θ = 20° and above the peaks of residual, insoluble inorganic substances appear and blur the diffraction from chitin.65
Figure 5.
(a) X-ray diffraction profiles of squid pen samples treated with 0 (water), 4, 5, 6, 7, and 8 M HCl. Lines in red correspond to the diffractions characteristic of α-chitin; (b) enlarged profiles of Figure 5a. α, βa, βm, and βd represent the peak positions of α-chitin, anhydrous β-chitin, β-chitin monohydrate, and β-chitin dihydrate from the literature data.15,52,53 Colored dots represent the peak top position of the profiles; (c) X-ray diffraction profiles of the EDA complex of squid pen treated with 0 (water), 4, 5, 6, 7, and 8 M HCl. Shades denoted as α, *, and β are the same as in Figure 4. Colored dots represent the peak top position of the profiles.
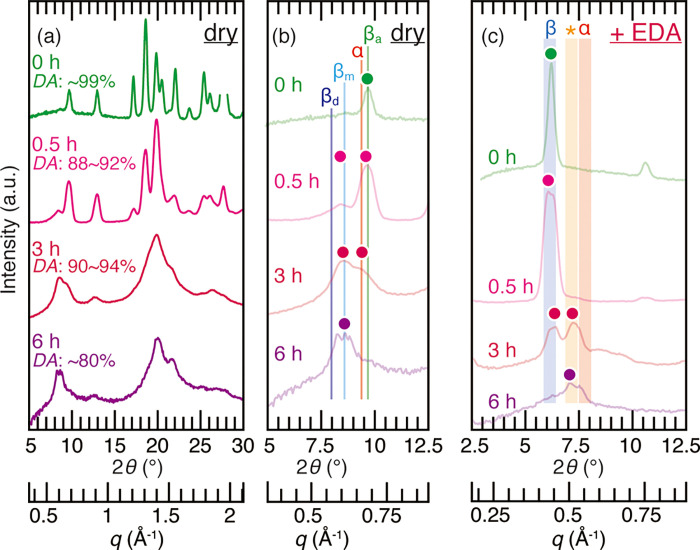
In addition to the acid treatment, alkaline treatment was conducted in order to examine the transformation from β-chitin to chitosan through deacetylation (Figure 6a). By immersing in 12.5 M aqueous NaOH solution, the β-chitin in siboglinid worm tubes gradually lost the DA and its high crystallinity, and a new peak was observed at 2θ = 8.5°, which corresponded to an unknown hydrate form of chitosan.66 Judging only from Figure 6b, this transformation may be misinterpreted as from anhydrous β-chitin to β-chitin monohydrate. However, the complexation with EDA clearly showed the gradual disappearance of β-chitin and the appearance of chitosan during the course of the alkaline treatment (Figure 6c). A peak from the diffraction of the (010) plane of the β-chitin/EDA complex gradually diminished, and a new peak appeared at the 2θ = 6.9 and 7.4° position (marked with asterisk in Figure 6), indicative of poorly crystalline α-chitin or chitosan. The transformation from β-chitin to α-chitin or chitosan was complete at 6 h of immersion in 12.5 M NaOH solution, where the DA reached 80%, in line with the literature data.57 It should be noted that due to the highly crystalline and rigid nature of the siboglinid worm tube, swelling reaction by 12.5 M NaOH solution was not homogeneous at 0.5 and 3 h immersion, and thus the DA of 0.5 and 3 h immersion in 12.5 M NaOH solution exhibited greater errors.
Figure 6.
(a) X-ray diffraction profiles of the siboglinid worm tube treated with 12.5 M NaOH for 0 (water), 0.5, 3, and 6 h. The DA values indicate the degrees of acetylation; (b) enlarged profiles of Figure 6a. α, βa, βm, and βd represent the peak positions of α-chitin, anhydrous β-chitin, β-chitin monohydrate, and β-chitin dihydrate from the literature data,15,52,53 respectively. Colored dots represent the peak top position of profiles; (c) X-ray diffraction profiles of the EDA complex of the siboglinid worm tube treated with 12.5 M NaOH for 0 (water), 0.5, 3, and 6 h. Shades denoted as α, *, and β are the same as in Figure 4. Colored dots represent the peak top position of profiles.
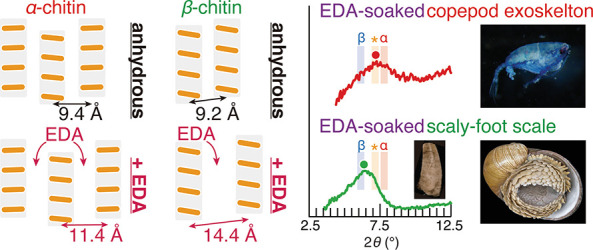
The above-mentioned results confirmed the validity of identification of chitin allomorphs based on the complexation of chitin with EDA. We then extended this EDA complexation method to chitin samples characterized by nearly-amorphous, very poor crystallinity, including the α-chitin planktic copepod exoskeletons (Pontella fera, Calanoida)67 and the β-chitin scales of the Scaly-foot Snail (Chrysomallon squamiferum).65 For copepods (Figure 7), the peak top position in the dry state was between α-chitin and β-chitin monohydrate due to the very poor crystallinity. However, EDA complexation revealed that copepod exoskeletons consisted of poorly crystalline α-chitin or chitosan. This is in line with copepods being a group of crustaceans which are known to use α-chitin. For the Scaly-foot Snail, we used the part of its scales close to the distal tip. As the scales show accretionary growth in the longitudinal direction, the distal tip has been exposed longest to the environment and the β-chitin would be more disordered than freshly secreted parts near the base.65 In Figure 7, the peak position of scale samples complexed with EDA was located at the border of the known peak position for β-chitin, identifying it correctly as β-chitin. These examples exemplify that the method proposed herein is capable of separating the chitin allomorphs even when they are near-amorphous.
Figure 7.
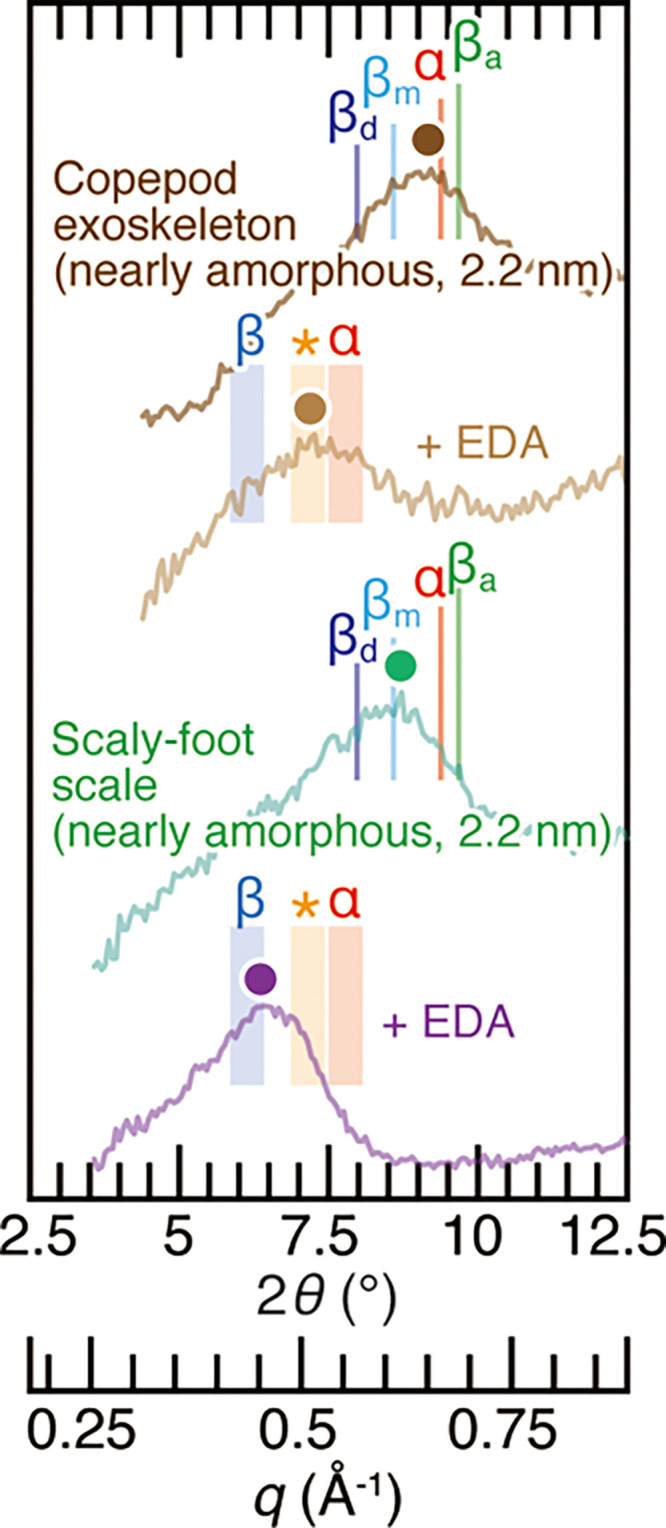
X-ray diffraction profiles of near-amorphous α-chitin copepod exoskeletons, those complexed with EDA, the near-amorphous β-chitin Scaly-foot Snail scale (sampled position near the distal tip of the scale), and the one complexed with EDA. α, βa, βm, and βd represent the peak positions of α-chitin, anhydrous β-chitin, β-chitin monohydrate, and β-chitin dihydrate from the literature data.15,52,53 Shades denoted as α, *, and β are the same as in Figure 4. Colored dots represent the peak top position of profiles. The values in the brackets are the crystal size calculated from the peaks at 2θ = 8.5–9.3° (diffraction of (020) planes in α-chitin and diffraction of (010) planes in β-chitin).
Conclusions
We successfully identified chitin allomorphs in both highly and poorly crystalline, even near-amorphous, chitin samples using a newly developed method employing the chitin/EDA complex. The advantage of this highly sensitive method is not only that the results are straightforward to interpret, but also that the sample preparation process is simple: simply immersing chitin into EDA at room temperature. Our method presents a powerful tool for determining chitin allomorphs, especially in poorly crystalline samples, and will pave the way to building an overarching understanding of chitin biosynthesis along the phylogenetic tree of chitin-producing organisms. A limitation is that poorly crystalline α-chitin is difficult to separate from chitosan when using this method only. For this, additional information such as the DA measured by electric titration, FT-IR, or solid-state NMR is necessary.
Acknowledgments
We thank the captain and crew of R/Vs Yokosuka and Kaimei for their great support of scientific activity during the expeditions YK13-02 (cruise PI: Manabu Nishizawa), YK19-11 (cruise PI: Akinori Yabuki), and KM20-10C. We extend thanks to the DSV Shinkai 6500 team and the ROV KM-ROV team. The cruise KM20-10C was funded by a marine protected area (MPA) monitoring project outsourced by the Ministry of the Environment of Japan. This paper is based on results obtained from a project, JPNP18016 and PJ-ID 20001845, commissioned by the New Energy and Industrial Technology Development Organization (NEDO). N.I. acknowledges support from the Grants-in-Aid for Scientific Research (KAKENHI Grant No. JP18K18188) from the Japan Society for the Promotion of Science (JSPS). The authors wish to acknowledge the Mauritian Government for allowing sampling of deep-sea animals in the Mauritian EEZ (Ref (29)./2014; 50/38/24 V2).
The authors declare no competing financial interest.
References
- Muzzarelli R.; Jeuniaux C.; Gooday G. W.. Chitin inNature and Technology; Muzzarelli R., Jeuniaux C., Gooday G. W., Eds.; Springer US: Boston, MA, 1986. [Google Scholar]
- Rinaudo M. Chitin and Chitosan: Properties and Applications. Prog. Polym. Sci. 2006, 31, 603–632. 10.1016/j.progpolymsci.2006.06.001. [DOI] [Google Scholar]
- Ehrlich H.; Maldonado M.; Parker A. R.; Kulchin Y. N.; Schilling J.; Köhler B.; Skrzypczak U.; Simon P.; Reiswig H. M.; Tsurkan M. V.; et al. Supercontinuum Generation in Naturally Occurring Glass Sponges Spicules. Adv. Opt. Mater. 2016, 4, 1608–1613. 10.1002/adom.201600454. [DOI] [Google Scholar]
- Talevski T.; Talevska Leshoska A.; Pejoski E.; Pejin B.; Machałowski T.; Wysokowski M.; Tsurkan M. V.; Petrova O.; Sivkov V.; Martinovic R.; et al. Identification and First Insights into the Structure of Chitin from the Endemic Freshwater Demosponge Ochridaspongia Rotunda (Arndt, 1937). Int. J. Biol. Macromol. 2020, 162, 1187–1194. 10.1016/j.ijbiomac.2020.06.247. [DOI] [PubMed] [Google Scholar]
- Kertmen A.; Petrenko I.; Schimpf C.; Rafaja D.; Petrova O.; Sivkov V.; Nekipelov S.; Fursov A.; Stelling A. L.; Heimler K.; et al. Calcite Nanotuned Chitinous Skeletons of Giant Ianthella Basta Marine Demosponge. Int. J. Mol. Sci. 2021, 22, 12588. 10.3390/ijms222212588. [DOI] [PMC free article] [PubMed] [Google Scholar]
- Nowacki K.; Stępniak I.; Langer E.; Tsurkan M.; Wysokowski M.; Petrenko I.; Khrunyk Y.; Fursov A.; Bo M.; Bavestrello G.; et al. Electrochemical Approach for Isolation of Chitin from the Skeleton of the Black Coral Cirrhipathes Sp. (Antipatharia). Mar. Drugs 2020, 18, 297. 10.3390/md18060297. [DOI] [PMC free article] [PubMed] [Google Scholar]
- Machałowski T.; Wysokowski M.; Żółtowska-Aksamitowska S.; Bechmann N.; Binnewerg B.; Schubert M.; Guan K.; Bornstein S. R.; Czaczyk K.; Pokrovsky O.; et al. Spider Chitin. The Biomimetic Potential and Applications of Caribena Versicolor Tubular Chitin. Carbohydr. Polym. 2019, 226, 115301. [DOI] [PubMed] [Google Scholar]
- Klinger C.; Żółtowska-Aksamitowska S.; Wysokowski M.; Tsurkan M. V.; Galli R.; Petrenko I.; Machałowski T.; Ereskovsky A.; Martinović R.; Muzychka L.; et al. Express Method for Isolation of Ready-to-Use 3D Chitin Scaffolds from Aplysina Archeri (Aplysineidae: Verongiida) Demosponge. Mar. Drugs 2019, 17, 131. 10.3390/md17020131. [DOI] [PMC free article] [PubMed] [Google Scholar]
- Sugiyama J.; Boisset C.; Hashimoto M.; Watanabe T. Molecular Directionality of β-Chitin Biosynthesis. J. Mol. Biol. 1999, 286, 247–255. 10.1006/jmbi.1998.2458. [DOI] [PubMed] [Google Scholar]
- Gaill F.; Persson J.; Sugiyama J.; Vuong R.; Chanzy H. The Chitin System in the Tubes of Deep Sea Hydrothermal Vent Worms. J. Struct. Biol. 1992, 109, 116–128. 10.1016/1047-8477(92)90043-A. [DOI] [Google Scholar]
- Imai T.; Watanabe T.; Yui T.; Sugiyama J. The Directionality of Chitin Biosynthesis: A Revisit. Biochem. J. 2003, 374, 755–760. 10.1042/bj20030145. [DOI] [PMC free article] [PubMed] [Google Scholar]
- Ogawa Y.; Kimura S.; Wada M.; Kuga S. Crystal Analysis and High-Resolution Imaging of Microfibrillar α-Chitin from Phaeocystis. J. Struct. Biol. 2010, 171, 111–116. 10.1016/j.jsb.2010.03.010. [DOI] [PubMed] [Google Scholar]
- Ogawa Y.; Kimura S.; Wada M. Electron Diffraction and High-Resolution Imaging on Highly-Crystalline β-Chitin Microfibril. J. Struct. Biol. 2011, 176, 83–90. 10.1016/j.jsb.2011.07.001. [DOI] [PubMed] [Google Scholar]
- Minke R.; Blackwell J. The Structure of α-Chitin. J. Mol. Biol. 1978, 120, 167–181. 10.1016/0022-2836(78)90063-3. [DOI] [PubMed] [Google Scholar]
- Sikorski P.; Hori R.; Wada M. Revisit of α-Chitin Crystal Structure Using High Resolution X-Ray Diffraction Data. Biomacromolecules 2009, 10, 1100–1105. 10.1021/bm801251e. [DOI] [PubMed] [Google Scholar]
- Blackwell J. Structure of β-Chitin or Parallel Chain Systems of Poly-β-(1→4)-N-Acetyl-D-Glucosamine. Biopolymers 1969, 7, 281–298. 10.1002/bip.1969.360070302. [DOI] [PubMed] [Google Scholar]
- Sawada D.; Nishiyama Y.; Langan P.; Forsyth V. T.; Kimura S.; Wada M. Direct Determination of the Hydrogen Bonding Arrangement in Anhydrous β-Chitin by Neutron Fiber Diffraction. Biomacromolecules 2012, 13, 288–291. 10.1021/bm201512t. [DOI] [PubMed] [Google Scholar]
- Sawada D.; Nishiyama Y.; Langan P.; Forsyth V. T.; Kimura S.; Wada M. Water in Crystalline Fibers of Dihydrate β-Chitin Results in Unexpected Absence of Intramolecular Hydrogen Bonding. PLoS One 2012, 7, e39376. [DOI] [PMC free article] [PubMed] [Google Scholar]
- Kaya M.; Mujtaba M.; Ehrlich H.; Salaberria A. M.; Baran T.; Amemiya C. T.; Galli R.; Akyuz L.; Sargin I.; Labidi J. On Chemistry of γ-Chitin. Carbohydr. Polym. 2017, 176, 177–186. [DOI] [PubMed] [Google Scholar]
- Atkins E. Conformations in Polysaccharides and Complex Carbohydrates. J. Biosci. 1985, 8, 375–387. [Google Scholar]
- McLachlan J.; McInnes A. G.; Falk M. Studies On The Chitan (Chitin: Poly-N-Acetylglucosamine) Fibers Of The Diatom Thalassiosira Fluviatilis Hustedt: I Production And Isolation Of Chitan Fibers. Can. J. Bot. 1965, 43, 707–713. 10.1139/b65-079. [DOI] [Google Scholar]
- Brunner E.; Richthammer P.; Ehrlich H.; Paasch S.; Simon P.; Ueberlein S.; Van Pée K. H. Chitin-Based Organic Networks: An Integral Part of Cell Wall Biosilica in the Diatom Thalassiosira Pseudonana. Angew. Chem. Int. Ed. 2009, 48, 9724–9727. 10.1002/anie.200905028. [DOI] [PubMed] [Google Scholar]
- Lotmar W.; Picken L. E. R. A New Crystallographic Modification of Chitin and Its Distribution. Experientia 1950, 6, 58–59. 10.1007/BF02174818. [DOI] [Google Scholar]
- Nishiyama Y.; Langan P.; Chanzy H. Crystal Structure and Hydrogen-Bonding System in Cellulose Iβ from Synchrotron X-Ray and Neutron Fiber Diffraction. J. Am. Chem. Soc. 2002, 124, 9074–9082. 10.1021/ja0257319. [DOI] [PubMed] [Google Scholar]
- Langan P.; Nishiyama Y.; Chanzy H. A Revised Structure and Hydrogen-Bonding System in Cellulose II from a Neutron Fiber Diffraction Analysis. J. Am. Chem. Soc. 1999, 121, 9940–9946. 10.1021/ja9916254. [DOI] [Google Scholar]
- Klemm D.; Heublein B.; Fink H. P.; Bohn A. Cellulose: Fascinating Biopolymer and Sustainable Raw Material. Angew. Chem. Int. Ed. 2005, 44, 3358–3393. 10.1002/anie.200460587. [DOI] [PubMed] [Google Scholar]
- Kimura S.; Itoh T. New Cellulose Synthesizing Complexes (Terminal Complexes) Involved in Animal Cellulose Biosynthesis in the Tunicate Metandrocarpa Uedai. Protoplasma 1996, 194, 151–163. [Google Scholar]
- Kimura S.; Linder C.; Laosinchai W.; Brown R.; Itoh T.; Cui X. Immunogold Labeling of Rosette Terminal Cellulose-Synthesizing Complexes in the Vascular Plant Vigna Angularis. Plant Cell 1999, 11, 2075–2086. 10.1105/tpc.11.11.2075. [DOI] [PMC free article] [PubMed] [Google Scholar]
- Chanzy H.Chitin Crystals. In Advances in Chitin Science vol. 2; Domard A., Roberts G. A. F., Vårum K. M., Eds.; Jaques André Publications: Lyon, 1997; pp. 11–21. [Google Scholar]
- Saito Y.; Putaux J. L.; Okano T.; Gaill F.; Chanzy H. Structural Aspects of the Swelling of β Chitin in HCl and Its Conversion into α Chitin. Macromolecules 1997, 30, 3867–3873. 10.1021/ma961787+. [DOI] [Google Scholar]
- Ogawa Y.; Kimura S.; Saito Y.; Wada M. Infrared Study on Deuteration of Highly-Crystalline Chitin. Carbohydr. Polym. 2012, 90, 650–657. 10.1016/j.carbpol.2012.05.092. [DOI] [PubMed] [Google Scholar]
- Pearson F. G.; Marchessault R. H.; Liang C. Y. Infrared Spectra of Crystalline Polysaccharides. V. Chitin. J. Polym. Sci. 1960, 43, 101–116. 10.1002/pol.1960.1204314109. [DOI] [PubMed] [Google Scholar]
- Kono H. Two-Dimensional Magic Angle Spinning NMR Investigation of Naturally Occurring Chitins: Precise 1H and 13C Resonance Assignment of α- and β-Chitin. Biopolymers 2004, 75, 255–263. 10.1002/bip.20124. [DOI] [PubMed] [Google Scholar]
- Tanner S. F.; Chanzy H.; Vincendon M.; Claude Roux J.; Gaill F. High-Resolution Solid-State Carbon-13 Nuclear Magnetic Resonance Study of Chitin. Macromolecules 1990, 23, 3576–3583. 10.1021/ma00217a008. [DOI] [Google Scholar]
- Ogawa Y.; Kobayashi K.; Kimura S.; Nishiyama Y.; Wada M.; Kuga S. X-Ray Texture Analysis Indicates Downward Spinning of Chitin Microfibrils in Tubeworm Tube. J. Struct. Biol. 2013, 184, 212–216. 10.1016/j.jsb.2013.10.008. [DOI] [PubMed] [Google Scholar]
- Nakashima K.; Kimura S.; Ogawa Y.; Watanabe S.; Soma S.; Kaneko T.; Yamada L.; Sawada H.; Tung C.-H.; Lu T.-M.; et al. Chitin-Based Barrier Immunity and Its Loss Predated Mucus-Colonization by Indigenous Gut Microbiota. Nat. Commun. 2018, 9, 3402. [DOI] [PMC free article] [PubMed] [Google Scholar]
- Ehrlich H.; Kaluzhnaya O. V.; Brunner E.; Tsurkan M. V.; Ereskovsky A.; Ilan M.; Tabachnick K. R.; Bazhenov V. V.; Paasch S.; Kammer M.; et al. Identification and First Insights into the Structure and Biosynthesis of Chitin from the Freshwater Sponge Spongilla Lacustris. J. Struct. Biol. 2013, 183, 474–483. 10.1016/j.jsb.2013.06.015. [DOI] [PubMed] [Google Scholar]
- Greven H.; Kaya M.; Junker K.; Akyuz L.; Amemiya C. T. Characterization of Tongue Worm (Pentastomida) Chitin Supports α- Rather than β-Chitin. Zool. Anz. 2019, 279, 111–115. 10.1016/j.jcz.2019.01.009. [DOI] [Google Scholar]
- Kocot K. M.; Aguilera F.; McDougall C.; Jackson D. J.; Degnan B. M. Sea Shell Diversity and Rapidly Evolving Secretomes: Insights into the Evolution of Biomineralization. Front. Zool. 2016, 13, 1–10. [DOI] [PMC free article] [PubMed] [Google Scholar]
- Kocot K. M.; McDougal C.; Degnan B. M. Developing Perspectives on Molluscan Shells, Part 1: Introduction and Molecular Biology. Physiol. Molluscs A Collect. Sel. Rev. 2017, 1, 1–42. [Google Scholar]
- Noishiki Y.; Nishiyama Y.; Wada M.; Kuga S. Complexation of α-Chitin with Aliphatic Amines. Biomacromolecules 2005, 6, 2362–2364. 10.1021/bm0500446. [DOI] [PubMed] [Google Scholar]
- Noishiki Y.; Nishiyama Y.; Wada M.; Okada S.; Kuga S. Inclusion Complex of β-Chitin and Aliphatic Amines. Biomacromolecules 2003, 4, 944–949. 10.1021/bm034024k. [DOI] [PubMed] [Google Scholar]
- Noishiki Y.; Kuga S.; Wada M.; Hori K.; Nishiyama Y. Guest Selectivity in Complexation of β-Chitin. Macromolecules 2004, 37, 6839–6842. 10.1021/ma0489265. [DOI] [Google Scholar]
- Sawada D.; Kimura S.; Nishiyama Y.; Langan P.; Wada M. The Crystal Structure of Mono-Ethylenediamine β-Chitin from Synchrotron X-Ray Fiber Diffraction. Carbohydr. Polym. 2013, 92, 1737–1742. 10.1016/j.carbpol.2012.11.025. [DOI] [PubMed] [Google Scholar]
- Kaku Y.; Fujisawa S.; Saito T.; Isogai A. Synthesis of Chitin Nanofiber-Coated Polymer Microparticles via Pickering Emulsion. Biomacromolecules 2020, 21, 1886–1891. 10.1021/acs.biomac.9b01757. [DOI] [PubMed] [Google Scholar]
- Qi Z. D.; Saito T.; Fan Y.; Isogai A. Multifunctional Coating Films by Layer-by-Layer Deposition of Cellulose and Chitin Nanofibrils. Biomacromolecules 2012, 13, 553–558. 10.1021/bm201659b. [DOI] [PubMed] [Google Scholar]
- Bamba Y.; Ogawa Y.; Saito T.; Berglund L. A.; Isogai A. Estimating the Strength of Single Chitin Nanofibrils via Sonication-Induced Fragmentation. Biomacromolecules 2017, 18, 4405–4410. 10.1021/acs.biomac.7b01467. [DOI] [PubMed] [Google Scholar]
- Yokoi M.; Tanaka R.; Saito T.; Isogai A. Dynamic Viscoelastic Functions of Liquid-Crystalline Chitin Nanofibril Dispersions. Biomacromolecules 2017, 18, 2564–2570. 10.1021/acs.biomac.7b00690. [DOI] [PubMed] [Google Scholar]
- Hirano S.; Ohe Y. Chitosan Gels: A Novel Molecular Aggregation of Chitosan in Acidic Solutions on a Facile Acylation. Agric. Biol. Chem. 1975, 39, 1337–1338. [Google Scholar]
- Isobe N.; Tsudome M.; Kusumi R.; Wada M.; Uematsu K.; Okada S.; Deguchi S. Moldable Crystalline α-Chitin Hydrogel with Toughness and Transparency toward Ocular Applications. ACS Appl. Polym. Mater. 2020, 2, 1656–1663. 10.1021/acsapm.0c00087. [DOI] [Google Scholar]
- Rössle M.; Flot D.; Engel J.; Burghammer M.; Riekel C.; Chanzy H. Fast Intracrystalline Hydration of β-Chitin Revealed by Combined Microdrop Generation and on-Line Synchrotron Radiation Microdiffraction. Biomacromolecules 2003, 4, 981–986. 10.1021/bm0340218. [DOI] [PubMed] [Google Scholar]
- Gardner K. H.; Blackwell J. Refinement of the Structure of β-Chitin. Biopolymers 1975, 14, 1581–1595. 10.1002/bip.1975.360140804. [DOI] [PubMed] [Google Scholar]
- Kobayashi K.; Kimura S.; Togawa E.; Wada M. Crystal Transition between Hydrate and Anhydrous β-Chitin Monitored by Synchrotron X-Ray Fiber Diffraction. Carbohydr. Polym. 2010, 79, 882–889. 10.1016/j.carbpol.2009.10.020. [DOI] [Google Scholar]
- Persson J. E.; Domard A.; Chanzy H. Single Crystals of α-Chitin. Int. J. Biol. Macromol. 1992, 14, 221–224. 10.1016/S0141-8130(05)80031-5. [DOI] [PubMed] [Google Scholar]
- Tsurkan M. V.; Voronkina A.; Khrunyk Y.; Wysokowski M.; Petrenko I.; Ehrlich H. Progress in Chitin Analytics. Carbohydr. Polym. 2021, 252, 117204. [DOI] [PubMed] [Google Scholar]
- Younes I.; Rinaudo M. Chitin and Chitosan Preparation from Marine Sources. Structure, Properties and Applications. Mar. Drugs 2015, 13, 1133–1174. 10.3390/md13031133. [DOI] [PMC free article] [PubMed] [Google Scholar]
- Montroni D.; Fermani S.; Morellato K.; Torri G.; Naggi A.; Cristofolini L.; Falini G. β-Chitin Samples with Similar Microfibril Arrangement Change Mechanical Properties Varying the Degree of Acetylation. Carbohydr. Polym. 2019, 207, 26–33. [DOI] [PubMed] [Google Scholar]
- Saito Y.; Okano T.; Gaill F.; Chanzy H.; Putaux J. L. Structural Data on the Intra-Crystalline Swelling of β-Chitin. Int. J. Biol. Macromol. 2000, 28, 81–88. 10.1016/S0141-8130(00)00147-1. [DOI] [PubMed] [Google Scholar]
- Naito P. K.; Ogawa Y.; Kimura S.; Iwata T.; Wada M. Crystal Transition from Hydrated Chitosan and Chitosan/Monocarboxylic Acid Complex to Anhydrous Chitosan Investigated by X-Ray Diffraction. J. Polym. Sci. Part B Polym. Phys. 2015, 53, 1065–1069. 10.1002/polb.23748. [DOI] [Google Scholar]
- Wada M.; Okano T.; Sugiyama J. Synchrotron-Radiated X-Ray and Neutron Diffraction Study of Native Cellulose. Cellulose 1997, 4, 221–232. 10.1023/A:1018435806488. [DOI] [Google Scholar]
- Gardner K. H.; Blackwell J. The Structure of Native Cellulose. Biopolymers 1974, 13, 1975–2001. 10.1002/bip.1974.360131005. [DOI] [Google Scholar]
- Saito Y.; Kumagai H.; Wada M.; Kuga S. Thermally Reversible Hydration of β-Chitin. Biomacromolecules 2002, 3, 407–410. 10.1021/bm015646d. [DOI] [PubMed] [Google Scholar]
- Saito Y.; Okano T.; Putaux J. L.; Gaill F.; Chanzy H.Crystallosolvates of β Chitin and Alcohols. In Advances in Chitin Science vol. 2; Domard A., Roberts G. A. F., Vårum K. M., Eds.; Jaques André Publications: Lyon, 1997; pp. 507–512. [Google Scholar]
- Rudall K. M. The Chitin/Protein Complexes of Insect Cuticles. Adv. In Insect Phys. 1963, 1, 257–313. [Google Scholar]
- Isobe N.; Chen C.; Daicho K.; Saito T.; Bissessur D.; Takai K.; Okada S. Uniaxial Orientation of β-Chitin Nanofibres Used as an Organic Framework in the Scales of a Hot Vent Snail. J. R. Soc., Interface 2022, 19, 20220120. [DOI] [PMC free article] [PubMed] [Google Scholar]
- Naito P. K.Crystal Transition of Chitin and Chitosan and Crystal Structure of Chitosan, Doctoral Thesis, University of Tokyo, 2016. [Google Scholar]
- Dillaman R. M.; Roer R.; Shafer T.; Modla S.. The Crustacean Integument. In Functional Morphology and Diversity; Oxford University Press, 2013; pp. 140–166. [Google Scholar]


