

Abstract
Pseudoenzymes resemble active enzymes, but lack key catalytic residues believed to be required for activity. Many pseudoenzymes appear to be inactive in conventional enzyme assays. However, an alternative explanation for their apparent lack of activity is that pseudoenzymes are being assayed for the wrong reaction. We have discovered several new protein kinase-like families which have revealed how different binding orientations of adenosine triphosphate (ATP) and active site residue migration can generate a novel reaction from a common kinase scaffold. These results have exposed the catalytic versatility of the protein kinase fold and suggest that atypical kinases and pseudokinases should be analyzed for alternative transferase activities. In this chapter, we discuss a general approach for bioinformatically identifying divergent or atypical members of an enzyme superfamily, then present an experimental approach to characterize their catalytic activity.
1. Introduction
The lack of expected catalytic residues in homologs of known enzymes typically results in compromised or absent catalytic activity. For example, many such pseudo-enzymes have been shown to act as scaffolds or allosteric regulators (Murphy, Farhan, & Eyers, 2017; Ribeiro et al., 2019). However, the atypical kinase and pseudokinase research has taught us that distant, atypical members of the protein kinase-like clan/superfamily (or any enzyme superfamily) can exhibit unexpected or long sought-after enzymatic activities, e.g., phosphorylation of secreted proteins (Tagliabracci et al., 2012), phosphorylation of hydroxy-lysine (Veiga da Cunha, Hadi, Balligand, Stroobant, & Van Schaftingen, 2012) or AMPylation (Sreelatha et al., 2018). Many of these atypical kinase-like proteins were initially predicted to be inactive as judged by the lack of the classical set of typical active site motifs, but later found to perform enzymatic activities by using “redesigned” or migrated active sites. We argue that by broadly searching for novel, most distant members of the protein kinase-like superfamily one may expect to find more such interesting enzymatic activities.
Here, we outline the steps that can be taken, starting from bioinformatic prediction of a putative kinase-like enzyme. Once a candidate kinase family has been identified, we offer an experimental framework toward biochemical demonstration of an alternative catalytic activity. While there is no single approach that will uncover the activity of every candidate, we suggest that intact protein mass spectrometry is a powerful method to detect unpredictable post-translational modifications (PTMs). The example of the Legionella pneumophila pseudokinase effector SidJ, which catalyzes glutamylation instead of phosphorylation (Bhogaraju et al., 2019; Black et al., 2019; Gan et al., 2019; Osinski et al., 2021; Sulpizio et al., 2019), is presented to illustrate the steps one might take toward discovering catalytic activities of pseudokinases.
2. Bioinformatics-based search for novel atypical kinases/pseudokinases. Sequence-based approach
Search for novel distant members of an established structural clan/superfamily consists of three general steps:
“High throughput” screening the target protein set (e.g., proteome) for distant, significant, and sub-significant similarities to the query (here, kinase-like families)
Filtering out the “already known” clan/superfamily members
Validating the similarity of the remaining “potentially novel” clan/superfamily members
Below, we sketch this approach by presenting two examples, whereas the screening step is performed either applying remote sequence similarity search, or three-dimensional structure similarity search using 3D structure models of the target protein set.
The first approach involves sequence similarity search, comparing a protein set of interest (here, the L. pneumophila proteome) against a library of known protein domains (here, PDB, Pfam and scop databases).
2.1. Downloading a “target” sequence dataset
The screen for novel kinase-like proteins must start from a defined set of sequences, e.g., proteome of an organism of interest. The UniProt database (UniProt, 2021) provides users sets of protein sequences with semi-automatic functional annotation. Also, it provides full proteomes of organisms.
2.1.1. Websites/webtools
UniProtKB, www.uniprot.org
alternatively, NCBI Protein, www.ncbi.nlm.nih.gov/protein
2.1.2. Procedure
From the Uniprot main page, navigate to Proteomes (www.uniprot.org/proteomes). Find the proteome of interest (here, we use the proteome of the strain “L. pneumophila subsp. pneumophila strain Philadelphia 1”).
Go to the proteome record (e.g., www.uniprot.org/proteomes/UP000000609) and select the option “Download one protein sequence per gene (FASTA)” to fetch a FASTA file containing sequences of all the proteins of the selected organism.
2.1.3. Notes
Alternatively, one can download the sequences from the NCBI Protein database, Refseq section (www.ncbi.nlm.nih.gov/refseq/) or any preferred sequence database.
2.2. Reducing redundancy in the target sequence dataset
Redundancy in a sequence dataset is usually not desirable because it may lead to unnecessary time-consuming processing of highly similar sequences. One can remove redundancy by dividing the sequence set into clusters with high similarity within, and lower similarity between them, e.g., at 40% sequence identity threshold using CD-HIT (then, one representative sequence per cluster is selected for subsequent analysis).
2.2.1. Websites/tools
CD-HIT Suite webserver, http://weizhong-lab.ucsd.edu/cdhit-web-server/cgi-bin/index.cgi.
2.2.2. Procedure
Go to the CD-HIT webserver and select the “cd-hit” tab.
Upload the protein dataset (FASTA file from step 2.1) to CD-HIT, choose “40%” identity threshold and hit “Submit.”
Download “.fas.1” file from the CD-HIT results. It contains representative sequences of the clusters.
2.2.3. Notes
Alternatively, one can use MMseqs2 (https://toolkit.tuebingen.mpg.de/tools/mmseqs2).
For the L. pneumophila proteome dataset, a CD-HIT run (40% threshold) reduces the dataset only by 10%. It is more effective when one clusters several related proteomes, e.g. when clustering two Legionella proteomes of different species, the number of proteins may decrease by 30%.
One can also do clustering using the h-cd-hit option, which performs hierarchical, multiple clustering runs. First, proteins are clustered at high sequence identity threshold (e.g., 90%), and representatives of clusters of similar sequences are used in the next clustering step at lower threshold (e.g., 60%). Subsequently, cd-hit can perform yet another third clustering step at a lower threshold (e.g., 40%). It is effective when one is clustering a large number of sequences. Then, multistep clustering can be faster than one step clustering.
Alternatively, one can use “one step” clustering at 90% or 50% threshold within the UniProt database when selecting the set of proteins for download, by choosing the clustering threshold shown to the left of the table containing the protein entries.
2.3. Splitting sequences of the dataset (optional)
All clustered sequences can be split into fragments to increase the chances of detecting remote sequence similarity in longer, multidomain proteins. For example, we “cut” proteins into 300 amino acid (aa) long fragments, with 100 aa overlap. Thus, we analyze fragments 1–300, 201–500, 401–700, etc.
2.3.1. Websites/webtools
Sequence Manipulation Suite—split FASTA, http://www.bioinformatics.org/sms2/split_fasta.html.
2.3.2. Procedure
Paste the contents of the FASTA file created in step 2.2. Set length of fragments to 300 amino acids and 100 amino acid overlap and click “submit” button.
Save results to a file.
2.3.3. Notes
“Split FASTA” has an input limit of 500,000,000 characters (e.g., more than 800,000 sequences of 600 amino acids each). If one needs to split a larger number of sequences, one can use the program “emboss splitter” (https://www.bioinformatics.nl/cgi-bin/emboss/splitter).
2.4. Remote homology detection
The well-known BLAST searches typically detect homologies at >30% sequence identity, but are in most cases unable to detect more distant similarity, e.g., at about 10–15% identity (Geourjon, Combet, Blanchet, & Deleage, 2001). PSI-BLAST overcomes these limitations to some extent but is not best suited for large-scale screening. Several even more sensitive distant homology search tools can be used to this purpose. These methods are based on the construction of amino acid frequency profiles, e.g., FFAS (Xu, Jaroszewski, Li, & Godzik, 2014) or Hidden Markov Models, e.g., HHblits (Steinegger et al., 2019). The query profile/model is then compared to a library of profiles/models of known protein families. In this way, by filtering and meticulously reviewing the results, we can find new enzyme families.
The Fold and Function Assignment System (FFAS) method is amino acid frequency profile-based. Specific profile generation is an important step that distinguishes the FFAS program from other profile-based methods. FFAS first uses 5 iterations of PSI-BLAST with a threshold E-value of 0.005 to generate set of homologs for the profile. To facilitate distant homology detection, the more distant from other sequences in the set a sequence is, the more weight it has in the profile (Rychlewski, Jaroszewski, Li, & Godzik, 2000; Xu et al., 2014).
2.4.1. Websites/tools
FFAS server, https://ffas.godziklab.org.
2.4.2. Procedure
The split sequences from the target protein set will be used to search for distant homology to known kinase domains.
One can use FFAS Web server online or the standalone version. The server version has input limit: 100 sequences. Thus, we recommend installing standalone FFAS for the Linux system (https://ffas.godziklab.org/ffas-cgi/cgi/download.pl).
Run the FFAS search, against selected databases of FFAS profiles. The recommended databases are SCOP (https://scop.berkeley.edu/) (Fox, Brenner, & Chandonia, 2014), Pfam (https://pfam.xfam.org/), PDB (https://www.rcsb.org/).
2.4.3. Notes
For FFAS search, one might consider adding other well-annotated protein domain databases, e.g., ecod (http://prodata.swmed.edu/ecod/) (Cheng et al., 2014). The results of the standalone version are flat text files that can be reviewed using simple custom scripts or even manually. For example, one can use notepad++ (Windows) or gedit (linux) to search keywords like “kinase” in results.
The searches are more sensitive if profiles are built using the most recent version of the NR and ENV_NR sequence databases from NCBI (https://www.ncbi.nlm.nih.gov/; “non-redundant protein sequences” and “metagenomic proteins”). This applies to query profiles, but also to profile libraries (PDB, Pfam, SCOP).
Although the FFAS authors recommend hits with Z-scores lower than −9.5 as likely true, for searches of remote homologs one should analyze also less significant, “borderline” hits. We typically used Z-scores up to the value of −6.
A good alternative to FFAS is HHblits/HHpred (HH-suite) (Zimmermann et al., 2018). Although FFAS and HHpred usually agree, there is anecdotal evidence that in some cases only one of these methods provides correct prediction. Also, in our hands the FFAS method is more simple to use for large datasets and requires less space.
2.5. Filtering out the “known” kinases
Obviously, the FFAS search results would in principle include all the known kinases in the target set. They can be filtered out using several non-exclusive approaches:
Using automated annotations available in the UniProt database (e.g., assignments to kinase-like Pfam domains, PF00069, etc.)
Running an automated annotation program, e.g., Batch CD-Search
Ignoring very high confidence FFAS hits
Performing filtering by annotation (i.e., ignoring all hits annotated as kinases)
Performing a manual or semi-manual literature search
2.6. Authentication of distant homology results
Since the search for novel remote kinase-like proteins leads to borderline significance hits, they need to be validated to discard false positives and gain more confidence in the remaining predictions. This usually requires a tailored case-by-case approach, below we present a non-exhaustive list of few options.
Use of other methods to predict distant homology such as HHpred and Phyre also considering the predicted secondary structure (Kelley, Mezulis, Yates, Wass, & Sternberg, 2015; Steinegger et al., 2019).
Use of Artificial Intelligence (AI)-based methods for 3D structure prediction such as AlphaFold and RoseTTAFold to build structure models and compare them with known kinase structures (Baek et al., 2021; Jumper et al., 2021).
Analysis of sequence conservation, in particular the elements of the active site, e.g., by collecting homologs and building sequence logos (Crooks, Hon, Chandonia, & Brenner, 2004).
Consideration of agreement between top hits. If several of top FFAS predictions are kinases, even when they are of low statistical significance, they are more likely to be true.
Here, we use an example of SidJ from L. pneumophila with poor similarity to known protein kinase domains. The FFAS search showed that few of the top hits were kinase-like, but the significance of these similarities was low. In addition, the conserved protein kinase active site motifs (HRD and DFG) appeared to be missing from the alignments (Fig. 1A).
Fig. 1.
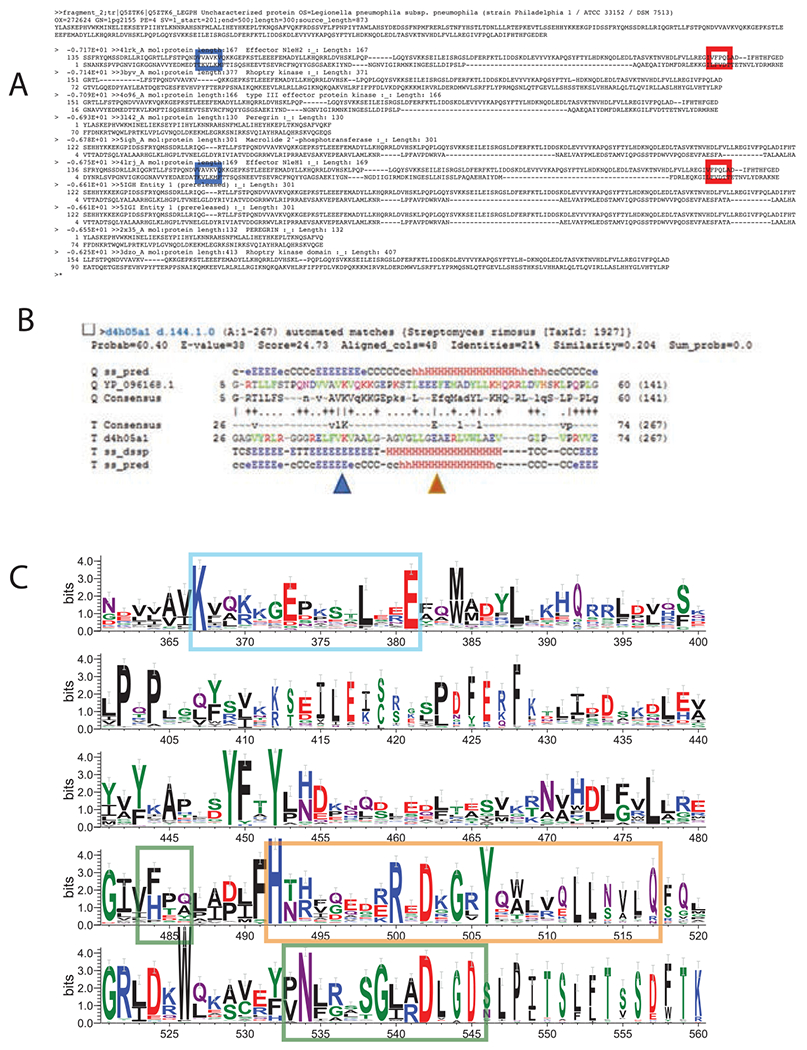
Sequence search for novel kinases. (A) Archival FFAS results. L. pneumophila proteome compared against the PDB. Results for the SidJ protein shown, with noticeable similarity to protein kinases. Blue box—equivalent of the PKA catalytic residue, K72. Red box—equivalent of the PKA catalytic residue, D166. (B) Archival results, HHpred analysis of SidJ. Similarity to N-lobe of protein kinases. Blue triangle—equivalent of PKA K72. Brown triangle—equivalent of PKA E91. (C) Sequence logo of SidJ homologs. Blue box: K72-E91 ion pair region. Green boxes: canonical kinase active site motifs. Orange box: migrated kinase active site motifs.
2.6.1. Websites/tools
HHpred server, https://toolkit.tuebingen.mpg.de/tools/hhpred
PSI-BLAST, https://blast.ncbi.nlm.nih.gov/Blast.cgi
Weblogo, http://weblogo.threeplusone.com
2.6.2. Procedure—Use of complementary method to predict distant homology
In HHpred, choose pdb70, ECOD, CDD and pfam databases, paste the “suspect” kinase sequence of SidJ, and submit.
Inspect the results, search for protein kinase-like hits—see Fig. 1B. Here, these hits are not statistically significant. However, some features of kinases (the counterparts of the protein kinase A (PKA) residues, K72 and E91) and secondary structures for a fragment of the kinase domain appear to be conserved.
2.6.3. Procedure—Analyzing sequence conservation by sequence logo
Use PSI-BLAST, HHblits or JackHMMer to collect sequence homologs.
Remove sequence redundancy, e.g., at 80% sequence identity threshold, using CD-HIT.
Align the representative homologs using a multiple alignment program, e.g., MAFFT.
Create sequence logo in the Weblogo server.
For SidJ, the sequence logo (see Fig. 1C) shows remarkable conservation of the K72-E91 ion pair important for kinase catalysis (PKA numbering) and of the several conserved motifs downstream, some of them reminiscent of the classic DFG metal ion binding motif. The catalytic HRD motif appears to be absent. However, sequence analysis did not allow unequivocal assignment of catalytic residues, since two sets of motifs appeared plausible. This ambiguity turned out to reflect reality, as SidJ was found to possess two active sites, the “canonical” one and a “migrated” one—see Fig. 1C.
2.6.4. Notes
These are just examples of steps one can take to gain more confidence in a weakly predicted similarity to protein kinases. Each such prediction may require special customized steps.
The logos are more informative if one uses a custom script to remove gaps in the query sequence from the alignment (see Supplement for a sample script in Supplementary Material 1 in the online version at https://doi.org/10.1016/bs.mie.2022.03.047).
In the example of SidJ protein shown in Fig. 1, it is important to note that this L. pneumophila protein has been already characterized experimentally as a deubiquitinase (Qiu et al., 2017). Thus, although experimental validation is the ultimate arbiter of truth, it is essential to keep in mind that interpretation of experimental data can be wrong or misleading. Here, although published experimental data were claimed to prove protease function for SidJ, our later bioinformatics prediction of a kinase-like protein and kinase-like active site was in the end proved correct by extensive structural, biochemical and Legionella infection model experiments. Thus, experimental evidence contradicting bioinformatic predictions need not always mean the prediction is wrong.
3. Bioinformatics-based search for novel atypical kinases/pseudokinases. Approach using predicted three-dimensional protein structures
This approach involves three-dimensional structure similarity searches, comparing a representative set of protein domains of interest (here, protein kinase-like domains) against a set of 3D structure models built for a protein set of interest (here: AlphaFold models of the Leishmannia infantum proteome) (Varadi et al., 2022).
3.1. Downloading the database of protein structure models (search domain) and the set of representative kinase-like structures (query set)
3.1.1. Websites/webtools
AlphaFold (AF) database—protein structure models, http://alphafold.ebi.ac.uk/download#proteomes-section
ecod40 dataset of representative protein domain structures, http://prodata.swmed.edu/ecod
3.1.2. Procedure
Download the AlphaFold structure models of the proteome of interest (here, L. infantum: https://ftp.ebi.ac.uk/pub/databases/alphafold/UP000008153_5671_LEIIN.tar)
Download the ecod F40 dataset of representative protein domain structures http://prodata.swmed.edu/ecod/distributions/ecod.latest.F40.pdb.tar.gz
Using the ecod classification available at http://prodata.swmed.edu/ecod/distributions/ecod.latest.F40.domains.txt
Note: out of the ecod F40 representative structures, select those of the “protein kinase” (T) group
3.1.3. Notes
Alternatively, one could use other representative sets of kinase-like structures (query set), e.g., from SCOP, CATH, Pfam. However, in our experience, the ecod database (Schaeffer, Liao, Cheng, & Grishin, 2017) is most up-to-date, and also has the structural domains very well curated from the point of structural bioinformatics.
Nevertheless, one may want to complement the ecod40 set with a manually prepared set of additional domains, including AlphaFold models of reliably predicted kinases. Here, we added the structures of Lpg2603, MavQ, CotH, SelO, and SidJ kinase-like proteins (pdb codes 6vve (Sreelatha et al., 2020), 7m7a (Hsieh et al., 2021), 5jda (Nguyen et al., 2016), 6eac (Sreelatha et al., 2018), 6oqq (Black et al., 2019), respectively) as well as AlphaFold models of human FAM69A and DIA1 predicted kinases (Dudkiewicz, Lenart, & Pawłowski, 2013).
In principle, one might use only a single kinase-like query. However, in our experience the use of multiple, diverse queries increases the likelihood of detecting distant structural neighbors, in the spirit of cascading sequence searches (Li, Pio, Pawlowski, & Godzik, 2000).
Also in this spirit, one might use the novel kinase-like proteins found by the structure search as subsequent queries in an iterative procedure.
Instead of selecting ecod representative structures at the topology (T) level, one might use different levels of the ecod structural hierarchy, e.g., the higher levels of possible homology (X) or homology (H).
As an alternative to AlphaFold, one could use a database of custom-made 3D models built using other tools, e.g., RoseTTAFold (Baek et al., 2021). However, as of writing this paper, AlphaFold provides the only comprehensive structure model database for entire proteomes, including human. Also, the AlphaFold database is expected to grow significantly in the coming months.
3.2. Comparing structures of query representative kinase structures with the models
TMalign is a fast and sensitive protein structure comparison program providing reliable measures of similarity (Zhang & Skolnick, 2005).
3.2.1. Websites/webtools
TMalign structure comparison program, https://zhanggroup.org/TM-align
3.2.2. Procedure
-
Download and install the standalone TMalign program https://zhanggroup.org/TM-align
Note: compiling the code under Linux on the user’s machine is preferable to achieve best speed, although an executable for the Linux system is also provided.
-
Run TMalign, preferably using a script, performing pairwise comparisons of all query structures (representative kinases) vs all the models of the proteome of interest (here—L. infantum—see Supplement for a sample script in Supplementary Material 2 in the online version at https://doi.org/10.1016/bs.mie.2022.03.047).
Use TM-score normalization by the query (kinase) structure.
For every comparison, save similarity-related parameters: TM-score, alignment length, sequence identity and RMSD (Cα root mean square deviation).
3.2.3. Notes
Alternatively, one could use other structure comparison methods, e.g., Dali or FATCAT servers (however, in our experience, TMalign was preferable for its speed).
3.3. Analyzing the results of structure comparison
Similarly, to the novel kinase search using sequence analysis, the results need be filtered to remove known kinases—see Section 2.5. Then, formerly unpredicted, possibly novel kinases, if any, need be spotted among the majority of non-kinase structures. Although TMalign does not provide a clear-cut statistical similarity measure such as E-value in BLAST or HHpred, the TMscore is a good proxy. Because a novel atypical kinase may exhibit TMalign-detectable structural similarity only to few known kinases, it is prudent not to rely on measures such as “average TMscore for comparison of protein X vs kinases.” Instead, we propose to search for such proteins that exhibit even just one or only few relatively high TMscores in comparison to kinases. To this end, we found visual inspection of graphical representation of the data very convenient.
3.3.1. Websites/webtools
For graphical presentation, any data-plotting program, e.g., a spreadsheet application, will work. Here, we used the Spotfire program (from TIBCO), which handles large datasets and allows flexible use of annotations and filtering.
3.3.2. Procedure
Plot TMscore vs alignment length for all TMalign results.
Filter plot by alignment length (e.g., requiring at least 100 residues). Filter out “known” kinases, e.g. using annotations of Pfam domains provided by Uniprot—(see Fig. 2A).
Seek “promising” kinase-like candidates as outliers in the plot (see Fig. 2B). If needed, use additional plots to inspect sequence identity and RMSD.
Fig. 2.

Structure search for novel kinases. (A) TMalign results, Leishmania infantum proteome vs kinases. Known kinases marked in red. (B) As in (A), but known kinases filtered out. Data points corresponding to Leishmania E9AHR4 shown in blue. (C) Structural superposition of an AlphaFold model of Leishmania E9AHR4 (gray) vs PDB 2zv2 (CaMKK2 kinase).
3.3.3. Notes
Alternatively, one could entertain a statistical approach to TMscore analysis. For example, one could evaluate, using a t-test, the difference between average TMscore for comparing structure of a query protein with known kinase structures to the average TMscore between the query and all non-kinase proteins. However, in our experience, visual inspection was sufficient.
3.4. Validating the structure similarity
The candidate novel kinases require the validity and extent of the detected structural similarity to be checked. As with novel kinase searches by sequence, this step is most variable and typically will require a customized approach. Here, we present a non-exhaustive list of possible steps. In our experience, using an alternative structure comparison tool and visual inspection of structural superposition is most important.
3.4.1. Websites/webtools
Structure comparison: Dali server, http://ekhidna2.biocenter.helsinki.fi/dali/
Structure comparison: FATCAT server, https://fatcat.godziklab.org
Structure viewing: Pymol: https://pymol.org/2/
Structure viewing: Chimera, https://www.cgl.ucsf.edu/chimera/
3.4.2. Procedure
-
Superpose the candidate kinase-like protein and the closest known kinase indicated by TMalign search, using Dali or FATCAT pairwise comparison options, or the cealign command in Pymol.
Inspect the statistical parameters describing the similarity (FATCFAT P-value, Dali Z-score).
Visualize the superposed structures in a structure viewer, e.g., Pymol or Chimera.
Additionally, build a sequence logo for the candidate kinase (see Section 2.6.3).
Inspect the conservation of the crucial elements of the kinase active site.
3.4.3. Notes
In addition, one might use tools such as the CONSURF server (Ashkenazy et al., 2016) to map sequence conservation directly onto structure, and to evaluate evolutionary conservation of a putative kinase-like active site.
In addition, one might use tools docking tools such as the HADDOCK server (van Zundert et al., 2016), to investigate the likelihood of nucleotide binding in the putative kinase-like nucleotide binding pocket.
One might additionally include the information on residue-by-residue “model confidence” provided by AlphaFold to assess reliability of the putative kinase-like structure.
In the example shown in Fig. 2C, the uncharacterized L. infantum protein E9AHR4 can be seen to align well to a known kinase structure although sequence identity is as low as 5%. Also, sequence conservation of the putative active site motifs supports the prediction of an active kinase-like enzyme.
4. Cloning a candidate novel kinase for bacterial expression
To maximize one’s chances of detecting a novel activity, one should strive to obtain soluble, homogenous, and active candidate protein. The investigator should anticipate a requirement for cofactors, binding partners, or activating modifications that are not apparent from the primary sequence. When it can be predicted, the substrate of the candidate enzyme should also be cloned and co-expressed. Ideally, a cell-based or phenotypic assay will also exist to determine if the activity is meaningful in a biological context. The following protocol outlines the approach taken to discover the glutamylation activity of the Legionella effector SidJ.
4.1. Designing stable truncations that encompass the kinase domain
We follow design principles from the field of protein crystallography to produce constructs for recombinant protein expression. While these have been reviewed in crystallographic texts (Deller, Kong, & Rupp, 2016). some of the most important considerations are the species of origin and the truncations tested.
Select a homolog from the candidate kinase family, considering the full diversity of species available. Ideal candidates are single domain proteins that comprise the core novel kinase fold. Transmembrane features, large, disordered regions, and poorly conserved insertions that interrupt the kinase domain are undesirable. These features can be detected by analysis of sequence conservation, secondary structure predictions (by Phyre or similar programs), and AI-based methods for 3D structure prediction (RoseTTAFold or AlphaFold) as outlined in Section 2.6. Design truncations to remove these features.
4.1.1. Tools and equipment
Software for codon optimization and primer design: Any sequence analysis program such as SnapGene software (from Insightful Science, available at snapgene.com) or MacVector (from Oxford Molecular Group).
Polymerase Chain Reaction (PCR) template: Genomic DNA or cDNA clones may be used if available. Chemically synthesized custom DNA templates such as gBlocks from Integrated DNA Technologies can provide sequences from uncommon organisms and offer the advantage of codon optimization for the expression host.
Thermocycler, heat blocks, or adjustable-temperature water baths
4.1.2. Buffers and reagents
The reagents will depend on the cloning method that the investigator chooses to pursue. New England BioLabs sells reagents and buffers for various cloning methods including traditional restriction enzyme ligation, TA ligation, recombination, Gibson Assembly® (Gibson et al., 2009), and others.
Vector backbone: we clone into a modified pET28a bacterial expression vector (ppSUMO) containing an N-terminal 6×-His tag followed by the yeast SUMO (smt3) coding sequence. The 6×-His-SUMO tag serves as a solubility tag to promote protein folding, and as an affinity tag that can be purified by nickel affinity (described later). The 6×-His-SUMO tag is easily removed by the SUMO Protease (ULP, UniProt Q02724).
4.1.3. Protocol
Follow lab cloning protocol adapted to your lab. Green, Sambrook, and Sambrook (2012) provides an authoritative manual of molecular cloning techniques.
4.1.4. Notes
Consider cloning homologs from thermophilic organisms or substrates of bacterial secretion systems, which tend to adopt stable protein folds. Any strain or species may be selected.
It is desirable to test multiple truncations of the kinase domain, as it can be difficult to predict how truncation will affect protein expression and stability. One reasonable approach is to make 10 different truncations every 5–15 amino acid residues around the approximate boundaries of the kinase domain. Truncations beginning at secondary structural features predicted by Phyre or Alpha fold are preferable to truncations that interrupt such features. We performed serial N- and C- terminal truncations of SidJ to identify a stable fragment consisting of amino acid residues 59–851.
Recombinant full length proteins could be subjected to limited proteolysis with a dilution series of enzymes, such as trypsin or chymotrypsin, to remove unstructured regions of the protein and identify a folded core domain. A stable core domain, as observed by SDS-PAGE, can be characterized by mass spectrometry or N-terminal peptide sequencing to identify its composition for recloning and expression as a recombinant protein.
4.2. Introducing and testing mutations of predicted catalytic residues
Predicted catalytic mutants serve as important experimental controls. We select at least one of the conserved residues corresponding to kinase catalytic motifs (see Section 2.6.3) to mutate to alanine. Alanine substitutions are usually well-tolerated and do not compromise the solubility of the protein.
4.2.1. Tools
For designing primers for targeted mutagenesis, we use the Agilent QuikChange Primer design tool: https://www.genomics.agilent.com
Thermocycler
42°C water bath
Incubator set to 37°C with rotating tube rack
Incubator set to 37°C with orbital shaker
4.2.2. Buffers and reagents
PfuTurbo DNA polymerase and 10× reaction buffer (Thermo Fisher Scientific)
Dimethyl Sulfoxide (DMSO)
DpnI Endonuclease (New England BioLabs)
Chemically competent DH5ɑ E. coli (Thermo Fisher Scientific)
SOC recovery media: Dextrose, 3.603g/L KCl, 0.186g/L MgSO4, 4.8g/L Tryptone, 20g/L, Yeast extract, 5g/L
LB agar: 10 g/L Peptone, 5g/L Yeast Extract, 5g/L NaCl, 12g/L Agar
LB Broth: 10g/L Peptone, 5g/L Yeast Extract, 5g/L NaCl
Kanamycin sulfate (Millipore Sigma). Dilute in H2O and add to LB at 50μg/mL final
GeneJET plasmid Miniprep DNA kit or other similar kit (Thermo Fisher Scientific, K0502)
4.2.3. Protocol
Perform QuikChange site-directed mutagenesis with PfuTurbo DNA polymerase (Agilent) according to the manufacturer’s protocol
Digest reaction products with DpnI endonuclease overnight
Add 5μL PCR into ~50μL chemically competent DH5ɑ E. coli on ice, then heat shock at 42°C for 45s
Briefly return the E. coli to ice, then add 500μL SOC. Incubate at 37 °C with rotating tube rack for at least 30 min
Plate the E. coli on LB agar plates and incubate overnight at 37 °C
Pick 2 single colonies and inoculate 5mL LB broth with kanamycin selection
Extract plasmid DNA with the miniprep kit
Confirm mutations by Sanger sequencing
4.2.4. Notes
Catalytic residues may be hard to predict, especially when there are few sequence homologs available to build a weblogo. In these cases, make several mutants.
In some cases, published reports may exist that identify important residues. For instance, the predicted metal-binding “DFG” motif of SidJ (Fig. 1) corresponds to a DxxD motif previously shown to be required for SidJ’s role in Legionella virulence (Jeong, Sexton, & Vogel, 2015; Qiu et al., 2017). Both D542 and the predicted ion-pair lysine (K367) were mutated to alanine as controls.
Addition of DMSO to 4% to PCR conditions may improve the success rate for difficult mutations.
If available, a phenotypic assay is performed to determine if kinase catalytic residues are required for the enzyme’s activity in cells. We frequently choose the yeast Saccharomyces cerevisiae as a proxy to study novel enzymes due to the ease of genetic manipulations in this organism. S. cerevisiae has been particularly useful for the study of bacterial effectors, which often target cellular processes that are conserved between yeast and other eukaryotes and therefore may cause a growth inhibition phenotype which can be readily detected. For example, expression of the SidE proteins in S. cerevisiae results in a growth inhibition phenotype that can be suppressed by co-expression of SidJ (Havey & Roy, 2015; Jeong et al., 2015). Using this system, we were able to demonstrate that the kinase catalytic residues of SidJ are required for its role in suppression of SidE-mediated toxicity, lending assurance to the hypothesis that SidJ harbors catalytic activity. A yeast phenotypic assay also allows the investigator to test whether truncations of the candidate enzyme, as designed for protein expression in Section 4.1, retain activity.
4.3. Identifying interacting proteins
While some enzymes possess intrinsic activity, others may only adopt a catalytic conformation if induced by a post-translational modification, a protein-protein interaction, or by binding to a small molecule cofactor (i.e., cAMP-dependent protein kinase (Johnson, Akamine, Radzio-Andzelm, Madhusudan, & Taylor, 2001) and calmodulin-dependent protein kinases (Haridas et al., 1998)). These interactions may be impossible to predict from the primary amino acid sequence of the candidate, so they should be actively sought using a combination of affinity-based and mass spectrometry approaches. These protocols are beyond the scope of this methods paper, but we briefly highlight key points to consider. If a cellular phenotype has been identified, the cofactor may be sought in the same system. For example, although we did not detect kinase activity of SidJ in vitro, SidJ was active against SidE in S. cerevisiae. We therefore sought to identify interacting proteins or potential substrates by affinity purification and mass spectrometry. This led to the identification of calmodulin (CaM) as a SidJ-interacting protein. In some cases, sequence motifs may help to predict interacting partners. For instance, the Calmodulin Target Database (http://calcium.uhnres.utoronto.ca/ctdb/ctdb/sequence.html) can analyze a protein sequence for possible CaM-interaction motifs. In the case of SidJ, a well-known CaM-binding IQ motif (Putkey, Kleerekoper, Gaertner, & Waxham, 2003) conserved in SidJ suggested CaM as an interactor.
Confirm that any predicted protein-protein interactions are direct by performing binding studies with purified components. Isothermal titration calorimetry (ITC) directly analyzes association kinetics to determine the binding constants and stoichiometry of an interaction (Pierce, Raman, & Nall, 1999). ITC is also a powerful assay to test mutations designed to disrupt the interaction. Other biophysical techniques including Microscale Thermophoresis (MST) or Surface Plasmon Resonance (SPR) may be appropriate. MST can be performed with much smaller quantities of protein but requires that the analyte molecule is conjugated to a fluorophore, which may disrupt the interaction. SPR also can be performed with low quantities of analyte but requires derivatization of the analyte so it can be immobilized to a sensor surface.
5. Preparation of an active kinase complex from bacteria
The next step toward biochemical and structural studies is production of recombinant, catalytically competent holoenzyme. We present an approach to co-express SidJ and CaM, which could be adapted to other enzyme-cofactor pairs.
5.1. Design of a co-expression system
To express the active SidJ-CaM complex, SidJ residues 59–851 and yeast CaM were cloned into the pETDuet1 vector (Novagen), which contains two multiple cloning sites preceded by a T7 promoter/lac operator. SidJ was cloned with N-terminal 6×His and SUMO tags, while CaM was untagged (pETDuet1 SUMO-SidJ/CaM, Fig. 3A). This enabled the simultaneous expression of both proteins from a single construct and the subsequent enrichment of the SidJ-CaM complex by virtue of their high-affinity interaction (Fig. 3B). Ni2+ NTA is a convenient and inexpensive purification method, but any affinity-based system could be utilized.
Fig. 3.

Purification of the active SidJ-CaM complex. (A) Plasmid map of pETDuet1 SUMO-SidJ/CaM used to co-express SidJ and CaM. Black arrows indicate the coding sequences of CaM and SidJ cloned into the first and second multiple cloning sites ([MCS]), respectively, under control of a T7 promoter (T7 pro.) The map also indicates the ampicillin resistance cassette (AmpR), pUC high-copy number origin if replication (ori) and the coding sequence of the lac repressor (LacI). (B) Superdex 200 size exclusion chromatography trace of the SidJ-CaM complex purified from E. coli as described in Section 6.1.2. (C) Fractions that eluted from 67.5 to 80 mL were separated by reduced 6% SDS-PAGE and visualized with Coomassie blue, demonstrating co-elution of SidJ (the ~100kDa species) and CaM (the ~15kDa species).
5.1.1. Tools
Incubators with orbital shakers, set to 37°C
Spectrophotometer and cuvettes for measuring bacterial OD600 and protein concentration determination by Bradford assay
High-speed floor-standing centrifuge that accommodates a fixed-angle rotor, such as the Sorvall LYNX 4000
Sonicator cell disruptor. We use a VCX-750 ultrasonic processor coupled to a CV334 converter and 3 mm stepped micro tip probe (Biomedical Solutions, Inc.)
4°C work environment for protein purification steps
Chromatography system equipped for fast protein liquid chromatography (FPLC). We use the AKTA Pure FPLC chromatography system coupled to a Superdex 200 column (GE Healthcare) with flow rate set to 1 mL/min
Heat block at 98°C
5.1.2. Buffers and reagents
Rosetta™ DE3 E. coli (Novagen Cat#70954) (This host strain is a BL21 derivative that supplies tRNAs for codons that are rare in E. coli), and expression construct (i.e., pETDuet1 SUMO-SidJ/CaM)
LB media (see Section 4.2.2)
Kanamycin sulfate (Millipore Sigma K1377) and Ampicillin sodium salt (Millipore Sigma A9518). The final concentrations are Kan, 50μg/mL final, and Amp, 100μg/mL
Isopropyl β-D-1 thiogalactopyranoside (IPTG). Prepare a stock at 400mM in H2O and sterile filter the solution
Lysis buffer: 50mM Tris-HCl pH8, 300mM NaCl, 1mM Dithiothreitol (DTT) (Millipore Sigma D0632), 1mM phenylmethylsulfonyl fluoride (PMSF). Prepare fresh and keep ice cold. PMSF is prepared as a 100mM stock in isopropanol on the day of the prep
Hispure™ Ni-Nitriloacetic acid (NTA) resin (Thermo Scientific 88,221). The resin is stored in 20% EtOH, so it is recommended to wash the resin in H2O and wash buffer before adding it to a sample
Gravity flow columns, such as Bio-Rad cat#7321010
Wash Buffer: 50mM Tris-HCl pH8, 300mM NaCl, 1mM Dithiothreitol DTT, 25mM Imidazole (Millipore Sigma). Imidazole stock is prepared at 3M in H2O and the pH is adjusted to 8.0 with HCl. All buffers with DTT should be prepared on the day of the prep
Elution Buffer: 50mM Tris-HCl pH8, 300mM NaCl, 1mM DTT, 300mM Imidazole
Gel filtration buffer: 50mM Tris-HCl pH 8, 300mM NaCl, 1mM DTT
ULP protease: full-length ULP can be cloned from yeast and expressed as a 6×-His fusion in E. coli. We aliquot ULP at 5mg/mL in 20μL volumes, and store the enzyme at −80°C
50,000Da Molecular Weight Cut-Off (MWCO) centrifugal filters (such as Amicon® Ultra-15 filter units, Millipore Sigma, UFC905008)
Bradford assay reagent (Thermo Fisher Scientific)
Sodium Dodecyl Sulfate Polyacrylamide Gel electrophoresis (SDS-PAGE) gels. For routine applications, we use hand cast discontinuous gels with a 4% acrylamide stacking gel (pH6.8) and a 12% resolving gel (pH8.8). This gives good resolution of both SidJ and CaM. Refer to a Bio-Rad bulletin for detailed instructions for preparing SDS-PAGE gels: https://www.bio-rad.com/webroot/web/pdf/lsr/literature/Bulletin_6040.pdf
SDS-PAGE gel tank and power supply (Bio-Rad)
SDS-PAGE running buffer: 25mM Tris, 192mM glycine, 0.1% SDS
5× SDS-PAGE reducing Laemmli sample buffer: 12.5mM Tris PO4 pH6.8, 10% (w/v) glycerol, 1.25% (w/v) SDS, 0.02% (w/v) bromophenol blue and 1% β-ME
Coomassie Blue staining reagents
Molecular weight marker such as the PageRuler™ Plus Prestained Protein ladder (ThermoFisher)
5.1.3. Procedures
Transform pETDuet1 SUMO-SidJ/CaM into chemically competent Rosetta DE3 cells (see Section 4.2.3).
The next day, take a streak of bacteria and inoculate several 5mL cultures of LB. Grow for ~2h at 37C with orbital shaking at 250rpm. When the cultures are visually turbid, inoculate 1L flasks of LB media with 10mL starter culture. Grow bacteria for ~5h to an OD600 of 0.6–1.1 before cooling to room temperature and inducing protein expression with 0.4mM IPTG.
Allow protein expression for 16–18 h at room temperature, usually overnight.
Collect cells by centrifugation at 4000× g for 15min in Nalgene™ 1L sealed centrifuge bottles using a F10-4×1000 LEX rotor or equivalent. Pour off the LB media.
Resuspend the bacterial pellet in ~1/100 volume of lysis buffer on ice. Aliquot into 50mL conical tubes for sonication.
Sonicate ~40mL volumes with a microtip set to deliver five 30s pulses at 40% amplitude, each pulse followed by a 1min recovery on ice.
Clear the lysate in high-speed centrifuge tubes (such as Nalgene™ Oak Ridge High-Speed PPCO Centrifuge Tubes) by centrifugation at 30,000–35,000× g for 30 min, at 4°C. Use a F21-8x50y rotor or equivalent. Decant and save the supernatant, which contains soluble protein.
Incubate the cleared lysate with Ni-NTA beads for a minimum of 1h at 4°C, nutating, in a 50mL polyethylene conical tube. The binding capacity is 60mg protein/mL rein, so 0.5 to 1mL of packed resin is usually sufficient.
Load the lysate-resin mixture onto a gravity-flow column. Allow the lysate to flow through and the beads to settle.
Wash the beads with 20mL of wash buffer in 1mL increments. Do not allow the resin to dry.
Elute the protein by adding 10–15mL elution buffer all at once. Collect the elution, and measure the protein concentration using a commercial assay, such as the Bradford assay, to estimate yield. Take a small aliquot of elution and boil in 1× SDS-PAGE buffer.
Add 6×-His tagged ULP SUMO protease (~2μg/mL) to cleave the 6xHis-SUMO tag from SUMO-SidJ. Incubate static overnight at 4°C.
The next morning, take another sample for SDS-PAGE to determine efficiency of ULP treatment. Then, concentrate the protein in a 50,000Da-cutoff centrifugal filter to remove SUMO and ULP. Use a centrifuge cooled to 4°C and spin at 3000× g. Aim for a final volume that can be accommodated by your FPLC system, usually 1–2mL. As a final step before gel filtration, spin the protein at 10,000× g at 4°C to remove any aggregates.
Further purify the SidJ-CaM complex by gel filtration chromatography using a Superdex 200 gel filtration column. Resolve samples from each fraction by SDS-PAGE to assess purity and separation. A representative separation is shown in Fig. 3B. The complex elutes between 65 and 80mL on this column system.
Combine the peak fractions and concentrate the SidJ-CaM complex to 5–10mg/mL. Dilute the protein into 50mM Tris-HCl pH8, 300mM NaCl, 1mM DTT with 5% glycerol. Aliquot and snap-frozen in liquid nitrogen for storage at −80°C.
5.1.4. Notes
This protocol is one version of many that have been published for expression and purification of affinity-tagged proteins from E. coli (Spriestersbach, Kubicek, Schafer, Block, & Maertens, 2015). Follow a protocol adapted to your laboratory. Keep in mind that any protocol will likely require modifications and customization to optimize expression.
5.2. Initial assays to detect AMPylation and phosphorylation
A standard kinase assay using γ32P-ATP (see Tagliabracci, Wen, & Xiao, 2016 for an example) is an appropriate initial experiment to detect if a predicted kinase catalyzes phosphotransfer. It is important to include an active canonical kinase as a positive control, and to test predicted catalytic mutants of the novel kinase fold. These controls help distinguish genuine activity from non-enzymatic binding of reagents to substrate proteins or any activity that is co-purified with the candidate. Generic kinase substrates, such as casein or myelin basic protein, may be tested.
Some atypical protein kinase-like folds instead transfer adenosine monophosphate (AMP) to their substrates. SelO is an example of such a kinase-like fold (Sreelatha et al., 2018). To detect AMPylation activity, we perform assays with α32P-ATP as a cosubstrate. Reactions with α32P-ATP are otherwise performed identically to kinase assays. Substrates, pH, and metals may be varied to find optimal conditions for phosphorylation or AMPylation. YdiU, the E. coli homolog of SelO, is an ideal positive control for AMPylation assays. YdiU expressed as a N-terminal 6xHis-SUMO fusion AMPylates the generic substrate myelin basic protein (Sreelatha et al., 2018).
6. Assigning novel catalytic activities
Our general approach for assigning a catalytic activity to a novel kinase fold is to co-express or incubate the candidate enzyme with its substrate, then analyze the substrate for mass shifts using intact protein mass spectrometry. Co-expression provides metabolites and cofactors from the milieu of the host cell which may participate in the reaction. To the same effect, cell lysates may be added to reactions with purified components. Whenever possible, include control conditions with predicted catalytic mutants of the candidate kinase. If the substrate of a candidate enzyme cannot be predicted, intact mass measurement of the candidate itself may reveal its activity. We have observed that many enzymes modify themselves when overexpressed and when substrates are provided in excess. Once an activity can be predicted from intact mass analysis, it should be reconstituted with purified components.
6.1. Design of a co-expression system with predicted substrates
SidJ is a genetic suppressor of toxicity caused by the SidE family effectors (Havey & Roy, 2015; Jeong et al., 2015). Therefore, we hypothesized that these are direct substrates of SidJ, and sought to co-express SidJ, CaM, and the SidE family member SdeA in E. coli. We designed a system to express SidJ and CaM from pETDuet1 (AmpR), while SdeA is expressed from the modified pET28a vector ppSUMO (KanR) (Fig. 4A). E. coli maintained under double selection with kanamycin and ampicillin will retain both plasmids. SdeA was expressed as an N-terminal 6xHis-SUMO fusion to enable Ni-NTA affinity purification, while SidJ and Calmodulin were untagged as not to be retained by the resin (unless bound to SdeA). As controls, the same experiment was performed with the D542A predicted catalytic mutant of SidJ, empty pETDuet1 plasmid, and pETDuet1 CaM without SidJ. Following co-expression, SdeA was purified as described in Section 6.1.3 and analyzed by SDS-PAGE. An electrophoretic mobility shift of SdeA appeared only when WT SidJ and CaM were co-expressed (Fig. 4B).
Fig. 4.

Discovery of glutamylation of SdeA after co-expression with SidJ and CaM. (A) Plasmid maps of pETDuet1 SidJ/CaM and pSUMO-SdeA, annotated as in Fig. 3. (B) Reducing 6% SDS-PAGE analysis and Coomassie staining of SdeA isolated from E. coli following co-expression with CaM, SidJ, or the indicated mutants. Note the electrophoretic mobility shift of SdeA co-expressed with SidJ and CaM. (C) Intact mass LC/MS spectra of SdeA from lane 2 of (B). The theoretical MW of SdeA is 104,340 Da. The labeled peaks demonstrate up to five mass shifts of +129Da. D. LC/MS spectra of SdeA from lane 3 of (B), in which the D542A mutant of SidJ was co-expressed. Panels (B)–(D): Adapted from fig. 2 in Black, M. H., Osinski, A., Gradowski, M., Servage, K. A., Pawlowski, K., Tomchick, D. R., et al. (2019). Bacterial pseudokinase catalyzes protein polyglutamylation to inhibit the SidE-family ubiquitin ligases. Science, 364(6442), 787–792. doi:https://doi.org/10.1126/science.aaw7446.
6.1.1. Tools
Strains and reagents for expressing recombinant protein in E. coli, as detailed in Section 6.1.1.
6.1.2. Procedures
Transform Rosetta DE3 cells with plasmids pETDuet1-SidJ/CaM and ppSUMO-SdeA. As a control condition, transform cells with plasmids pETDuet1-SidJ D542A/CaM and ppSUMO-SdeA. Plate the transformations on LB agar plates with double selection using kanamycin (50μg/mL) and ampicillin (100μg/mL). Maintain double selection throughout subsequent steps to ensure E.coli retain both plasmids.
Follow protocol in Section 6.1.3 to purify SdeA.
Resolve FPLC fractions by SDS-PAGE to assess purity and separation. Visualize protein bands using Coomassie blue staining. Because SdeA is over 100kDa, run a gel with a 6% polyacrylamide resolving section to achieve better resolution. Small electrophoretic mobility shifts indicate a PTM (see Note 2).
Pool the peak fractions from each co-expression experiment and concentrate. Dilute each sample to the same protein concentration, using the Bradford assay or similar assay. Boil 2–5μg of protein in Laemmli sample buffer for 10min. Run different experimental conditions side-by-side on denaturing SDS-PAGE to appreciate subtle shifts that may have been overlooked (Fig. 4B). Load between 2 and 5μg for optimal visualization and pick a gel acrylamide percentage to achieve the best possible resolution of the band.
6.1.3. Notes
Confirm that untagged proteins have been expressed by immunoblotting of cell lysates after induction. If secondary antibodies against the untagged protein(s) are not available, it may be helpful to express them as fusions with tags that are not enriched by Ni/NTA (such as the FLAG or Myc tags).
Analyze both the FPLC fractions and pooled protein by SDS-PAGE. PTMs can often be appreciated as electrophoretic mobility shifts. Keep in mind that some PTMs may not withstand the sample preparations given here (reducing agents, boiling, and denaturing gel conditions). Native PAGE is a less harsh method of visualizing proteins that may preserve labile PTMs. However, Native PAGE should be interpreted cautiously when comparing an enzyme to its catalytic mutants because even single amino acid mutations can change the native mass-to-charge ratio of a protein, and therefore its migration pattern.
6.2. Detecting post-translational modifications by mass spectrometry
Liquid Chromatography-tandem Mass Spectrometry (LC-MS/MS) is a powerful tool to detect post-translational modifications of proteins, so long as the PTM can be predicted a priori. Unexpected PTMs change the precursor peptide mass such that it may not be identified in mass spectrometry databases. This precludes the use of LC-MS/MS to screen for unknown PTMs. One possible solution is to use software tools with a wide precursor mass tolerance (Solntsev, Shortreed, Frey, & Smith, 2018). Intact mass analysis, in contrast, is a sensitive technique that removes bias entirely from the process of detecting mass shifts. We routinely subject novel candidate enzymes and their predicted substrates to intact mass analysis for this purpose.
Intact mass analysis of SdeA co-expressed with SidJ/CaM revealed a series of mass increases in increments of ~128.99Da (Fig. 4C). These mass shifts were not present when SidJ harbored a mutation in the catalytic D542 (Fig. 4D). Referencing to an online database generated the hypothesis that SidJ catalyzes glutamylation.
Importantly, even if the substrate of a candidate cannot be deduced, intact mass analysis of the candidate enzyme itself may reveal auto-modification with an unexpected PTM. As an example, SidJ co-expressed with CaM demonstrates mass shifts of +129Da, consistent with auto-glutamylation and auto-polyglutamylation (Fig. 5).
Fig. 5.

LC/MS spectra of SidJ residues 59–851 demonstrating auto-glutamylation. SidJ was co-expressed with CaM in E. coli as described in Section 6.1.2 and analyzed by protein intact mass spectrometry.
6.2.1. Tools
Mass spectrometer equipped for protein intact mass analysis. Institutional proteomics or biochemistry core facilities typically offer this service. Our experiments are performed on a Sciex X500B Q-ToF mass spectrometer coupled to an Agilent 1290 Infinity II HPLC with a POROS R1 reverse-phase column (2.1 × 30mm, 20 μm particle size, 4000 Å pore size)
Software to deconvolute mass spectra, such as BioPharmaView v. 2.1 software (Sciex)
Software to determine the theoretical molecular weight of the target, such as Expasy (https://web.expasy.org/compute_pi)
Database of post-translational modifications and their corresponding mass tags (abrf.org/deltamass).
6.2.2. Buffers and reagents
HPLC Buffer A: 0.1% formic acid in H2O
HPLC Buffer B: 0.1% formic acid in acetonitrile
6.2.3. Procedures
Dilute 50–100μg protein in a MS-compatible buffer (Note 1) to between 5 and 10mg/mL.
Inject sample into the reverse-phase column.
Run Buffer A at 300μL/min to elute salts. (Note 2).
Increase Buffer B stepwise until the protein elutes from the column.
Ionize the protein sample gas using the following settings: Gas 1, 15psi, ion source gas 2, 30psi, curtain gas 35, CAD gas 7, temperature 200C, spray voltage 5200V, declustering potential 80V, collision energy 15V.
Acquire data from 1400 to 3600Da with a 1s accumulation time and 80 time bins summed.
Deconvolute the acquired mass spectra to obtain the molecular weights using BioPharmaView v. 2.1 software (Sciex).
Compare the acquired molecular weight to the theoretical one and make note of any discrepancies that appear (Note 3). Protein that is incompletely modified may appear as multiple peaks on the mass spectrum.
Reference a database of mass tags (such as abrf.org/deltamass) to generate a hypothesis about the identity of the mass shift.
6.2.4. Notes
All buffer components cause signal suppression to some degree. The strongest suppressors include detergents (SDS, Tween-20, and Triton X-100), and metallic salts including magnesium chloride. Half-maximum suppression concentrations (Donnelly et al., 2019) can be referenced to develop a compatible buffer. Sample cleanup by ultrafiltration through a MWCO membrane or a desalting spin column (such as Bio-Rad Micro Bio-spin™ 6 gel columns, cat#7326221) may be necessary. Refer to manufacturer documentation for instructions on specific filter unit protocols.
Be aware that some PTMs (such as those with phosphoramidate bonds) may undergo acid-catalyzed hydrolysis under the liquid chromatography conditions.
Fully sequence the coding sequence of all expression constructs. Overlooked amino acid substitutions can lead to confusion when interpreting intact mass data. Similarly, scars left by restriction enzyme sites may introduce amino acids to the termini of proteins. Alpha-N-6-phosphogluconoylation of polyhistidine peptides in 6xHis tags can induce unexpected mass shifts of 178 and 258Da (Geoghegan et al., 1999). Oxidation of methionine or cysteine may introduce a +16Da or +32Da shifts. It is important to have catalytic mutants or control conditions to determine if a modification is catalyzed by the candidate enzyme.
7. Conclusion
The advent of high-accuracy structure prediction algorithms allows researchers to quickly generate hypotheses about protein function and enzymatic activity. However, the three-dimensional fold of a protein does not always predict its function. This chapter offers a general approach to obtain experimental evidence of enzymatic activity. Discovering novel activities of pseudokinases is a daunting prospect, but with inclusion of predicted catalytic mutants as controls, a thorough search for cofactors, and careful attention to experimental results, one can maximize the chances of uncovering an enzymatic activity. While we have focused on members of the kinase superfamily, similar methodology could be applied to diverse groups of enzymes.
Supplementary Material
Acknowledgments
Research in the Tagliabracci lab is supported by a Welch Foundation Grant (I-1911), a W. M. Keck Foundation Medical Research Grant, the Howard Hughes Medical Institute (HHMI) and NIH grants R01GM135189 and DP2 GM137419. M.G. is supported by a Polish National Science Centre grant 2019/35/N/NZ2/02844 and K.P. is supported by Polish National Science Centre grant 2019/33/B/NZ2/01409.
References
- Ashkenazy H, Abadi S, Martz E, Chay O, Mayrose I, Pupko T, et al. (2016). ConSurf 2016: An improved methodology to estimate and visualize evolutionary conservation in macromolecules. Nucleic Acids Research, 44(W1), W344–W350. 10.1093/nar/gkw408. [DOI] [PMC free article] [PubMed] [Google Scholar]
- Baek M, DiMaio F, Anishchenko I, Dauparas J, Ovchinnikov S, Lee GR, et al. (2021). Accurate prediction of protein structures and interactions using a three-track neural network. Science, 373(6557), 871–876. 10.1126/science.abj8754. [DOI] [PMC free article] [PubMed] [Google Scholar]
- Bhogaraju S, Bonn F, Mukherjee R, Adams M, Pfleiderer MM, Galej WP, et al. (2019). Inhibition of bacterial ubiquitin ligases by SidJ-calmodulin catalysed glutamylation. Nature, 572(7769), 382–386. 10.1038/s41586-019-1440-8. [DOI] [PMC free article] [PubMed] [Google Scholar]
- Black MH, Osinski A, Gradowski M, Servage KA, Pawlowski K, Tomchick DR, et al. (2019). Bacterial pseudokinase catalyzes protein polyglutamylation to inhibit the SidE-family ubiquitin ligases. Science, 364(6442), 787–792. 10.1126/science.aaw7446. [DOI] [PMC free article] [PubMed] [Google Scholar]
- Cheng H, Schaeffer RD, Liao Y, Kinch LN, Pei J, Shi S, et al. (2014). ECOD: An evolutionary classification of protein domains. PLoS Computational Biology, 10(12), e1003926. 10.1371/journal.pcbi.1003926. [DOI] [PMC free article] [PubMed] [Google Scholar]
- Crooks GE, Hon G, Chandonia JM, & Brenner SE (2004). WebLogo: A sequence logo generator. Genome Research, 14(6), 1188–1190. [DOI] [PMC free article] [PubMed] [Google Scholar]
- Deller MC, Kong L, & Rupp B (2016). Protein stability: A crystallographer’s perspective. Acta Crystallographica Section F: Structural Biology and Crystallization Communications, 72(Pt. 2), 72–95. 10.1107/S2053230X15024619. [DOI] [PMC free article] [PubMed] [Google Scholar]
- Donnelly DP, Rawlins CM, DeHart CJ, Fornelli L, Schachner LF, Lin Z, et al. (2019). Best practices and benchmarks for intact protein analysis for top-down mass spectrometry. Nature Methods, 16(7), 587–594. 10.1038/s41592-019-0457-0. [DOI] [PMC free article] [PubMed] [Google Scholar]
- Dudkiewicz M, Lenart A, & Pawłowski K (2013). A novel predicted calcium-regulated kinase family implicated in neurological disorders. PLoS One, 8(6), e66427. [DOI] [PMC free article] [PubMed] [Google Scholar]
- Fox NK, Brenner SE, & Chandonia JM (2014). SCOPe: Structural Classification of Proteins—Extended, integrating SCOP and ASTRAL data and classification of new structures. Nucleic Acids Research, 42(Database issue), D304–D309. 10.1093/nar/gkt1240. [DOI] [PMC free article] [PubMed] [Google Scholar]
- Gan N, Zhen X, Liu Y, Xu X, He C, Qiu J, et al. (2019). Regulation of phosphoribosyl ubiquitination by a calmodulin-dependent glutamylase. Nature, 572(7769), 387–391. 10.1038/s41586-019-1439-1. [DOI] [PMC free article] [PubMed] [Google Scholar]
- Geoghegan KF, Dixon HB, Rosner PJ, Hoth LR, Lanzetti AJ, Borzilleri KA, et al. (1999). Spontaneous alpha-N-6-phosphogluconoylation of a “His tag” in Escherichia coli: The cause of extra mass of 258 or 178 Da in fusion proteins. Analytical Biochemistry, 267(1), 169–184. 10.1006/abio.1998.2990. [DOI] [PubMed] [Google Scholar]
- Geourjon C, Combet C, Blanchet C, & Deleage G (2001). Identification of related proteins with weak sequence identity using secondary structure information. Protein Science, 10(4), 788–797. 10.1110/ps.30001. [DOI] [PMC free article] [PubMed] [Google Scholar]
- Gibson DG, Young L, Chuang RY, Venter JC, Hutchison CA 3rd, & Smith HO (2009). Enzymatic assembly of DNA molecules up to several hundred kilobases. Nature Methods, 6(5), 343–345. 10.1038/nmeth.1318. [DOI] [PubMed] [Google Scholar]
- Green MR, Sambrook J, & Sambrook J (2012). Molecular cloning: A laboratory manual (4th ed.). Cold Spring Harbor, N.Y.: Cold Spring Harbor Laboratory Press. [Google Scholar]
- Haridas V, Ni J, Meager A, Su J, Yu GL, Zhai Y, et al. (1998). TRANK, a novel cytokine that activates NF-kappa B and c-Jun N-terminal kinase. Journal of Immunology, 161(1), 1–6. [PubMed] [Google Scholar]
- Havey JC, & Roy CR (2015). Toxicity and SidJ-mediated suppression of toxicity require distinct regions in the SidE family of legionella pneumophila effectors. Infection and Immunity, 83(9), 3506–3514. 10.1128/iai.00497-15. [DOI] [PMC free article] [PubMed] [Google Scholar]
- Hsieh TS, Lopez VA, Black MH, Osinski A, Pawłowski K, Tomchick DR, et al. (2021). Dynamic remodeling of host membranes by self-organizing bacterial effectors. Science, 372(6545), 935–941. 10.1126/science.aay8118. [DOI] [PMC free article] [PubMed] [Google Scholar]
- Jeong KC, Sexton JA, & Vogel JP (2015). Spatiotemporal regulation of a Legionella pneumophila T4SS substrate by the metaeffector SidJ. PLoS Pathogens, 11(3), e1004695. 10.1371/journal.ppat.1004695. [DOI] [PMC free article] [PubMed] [Google Scholar]
- Johnson DA, Akamine P, Radzio-Andzelm E, Madhusudan M, & Taylor SS (2001). Dynamics of cAMP-dependent protein kinase. Chemical Reviews, 101(8), 2243–2270. 10.1021/cr000226k. [DOI] [PubMed] [Google Scholar]
- Jumper J, Evans R, Pritzel A, Green T, Figurnov M, Ronneberger O, et al. (2021). Highly accurate protein structure prediction with AlphaFold. Nature, 596(7873), 583–589. 10.1038/s41586-021-03819-2. [DOI] [PMC free article] [PubMed] [Google Scholar]
- Kelley LA, Mezulis S, Yates CM, Wass MN, & Sternberg MJ (2015). The Phyre2 web portal for protein modeling, prediction and analysis. Nature Protocols, 10(6), 845–858. 10.1038/nprot.2015.053. [DOI] [PMC free article] [PubMed] [Google Scholar]
- Li W, Pio F, Pawlowski K, & Godzik A (2000). Saturated BLAST: An automated multiple intermediate sequence search used to detect distant homology. Bioinformatics, 16(12), 1105–1110. [DOI] [PubMed] [Google Scholar]
- Murphy JM, Farhan H, & Eyers PA (2017). Bio-zombie: The rise of pseudoenzymes in biology. Biochemical Society Transactions, 45(2), 537–544. 10.1042/bst20160400. [DOI] [PubMed] [Google Scholar]
- Nguyen KB, Sreelatha A, Durrant ES, Lopez-Garrido J, Muszewska A, Dudkiewicz M, et al. (2016). Phosphorylation of spore coat proteins by a family of atypical protein kinases. Proceedings of the National Academy of Sciences of the United States of America, 113(25), E3482–E3491. 10.1073/pnas.1605917113. [DOI] [PMC free article] [PubMed] [Google Scholar]
- Osinski A, Black MH, Pawlowski K, Chen Z, Li Y, & Tagliabracci VS (2021). Structural and mechanistic basis for protein glutamylation by the kinase fold. Molecular Cell, 81(21), 4527–4539 e4528. 10.1016/j.molcel.2021.08.007. [DOI] [PMC free article] [PubMed] [Google Scholar]
- Pierce MM, Raman CS, & Nall BT (1999). Isothermal titration calorimetry of protein-protein interactions. Methods, 19(2), 213–221. 10.1006/meth.1999.0852. [DOI] [PubMed] [Google Scholar]
- Putkey JA, Kleerekoper Q, Gaertner TR, & Waxham MN (2003). A new role for IQ motif proteins in regulating calmodulin function. The Journal of Biological Chemistry, 278(50), 49667–49670. 10.1074/jbc.C300372200. [DOI] [PubMed] [Google Scholar]
- Qiu J, Yu K, Fei X, Liu Y, Nakayasu ES, Piehowski PD, et al. (2017). A unique deubiquitinase that deconjugates phosphoribosyl-linked protein ubiquitination. Cell Research, 27(7), 865–881. 10.1038/cr.2017.66. [DOI] [PMC free article] [PubMed] [Google Scholar]
- Ribeiro AJM, Das S, Dawson N, Zaru R, Orchard S, Thornton JM, et al. (2019). Emerging concepts in pseudoenzyme classification, evolution, and signaling. Science Signaling, 12(594). 10.1126/scisignal.aat9797. [DOI] [PubMed] [Google Scholar]
- Rychlewski L, Jaroszewski L, Li W, & Godzik A (2000). Comparison of sequence profiles. Strategies for structural predictions using sequence information. Protein Science, 9(2), 232–241. [DOI] [PMC free article] [PubMed] [Google Scholar]
- Schaeffer RD, Liao Y, Cheng H, & Grishin NV (2017). ECOD: New developments in the evolutionary classification of domains. Nucleic Acids Research, 45(D1), D296–D302. 10.1093/nar/gkw1137. [DOI] [PMC free article] [PubMed] [Google Scholar]
- Solntsev SK, Shortreed MR, Frey BL, & Smith LM (2018). Enhanced global post-translational modification discovery with MetaMorpheus. Journal of Proteome Research, 17(5), 1844–1851. 10.1021/acs.jproteome.7b00873. [DOI] [PubMed] [Google Scholar]
- Spriestersbach A, Kubicek J, Schafer F, Block H, & Maertens B (2015). Purification of his-tagged proteins. Methods in Enzymology, 559, 1–15. 10.1016/bs.mie.2014.11.003. [DOI] [PubMed] [Google Scholar]
- Sreelatha A, Nolan C, Park BC, Pawłowski K, Tomchick DR,& Tagliabracci VS (2020). A Legionella effector kinase is activated by host inositol hexakisphosphate. The Journal of Biological Chemistry, 295, 6214–6224. 10.1101/2020.02.18.954925. [DOI] [PMC free article] [PubMed] [Google Scholar]
- Sreelatha A, Yee SS, Lopez VA, Park BC, Kinch LN, Pilch S, et al. (2018). Protein AMPylation by an evolutionarily conserved pseudokinase. Cell, 175(3), 809–821 e819. 10.1016/j.cell.2018.08.046. [DOI] [PMC free article] [PubMed] [Google Scholar]
- Steinegger M, Meier M, Mirdita M, Vohringer H, Haunsberger SJ, & Soding J (2019). HH-suite3 for fast remote homology detection and deep protein annotation. BMC Bioinformatics, 20(1), 473. 10.1186/s12859-019-3019-7. [DOI] [PMC free article] [PubMed] [Google Scholar]
- Sulpizio A, Minelli ME, Wan M, Burrowes PD, Wu X, Sanford EJ, et al. (2019). Protein polyglutamylation catalyzed by the bacterial calmodulin-dependent pseudokinase SidJ. eLife, 8. 10.7554/eLife.51162. [DOI] [PMC free article] [PubMed] [Google Scholar]
- Tagliabracci VS, Engel JL, Wen J, Wiley SE, Worby CA, Kinch LN, et al. (2012). Secreted kinase phosphorylates extracellular proteins that regulate biomineralization. Science, 336, 1150–1153. [DOI] [PMC free article] [PubMed] [Google Scholar]
- Tagliabracci VS, Wen J, & Xiao J (2016). Methods to purify and assay secretory pathway kinases. Methods in Molecular Biology, 1496, 197–215. 10.1007/978-1-4939-6463-5_16. [DOI] [PubMed] [Google Scholar]
- The UniProt Consortium. (2021). UniProt: The universal protein knowledgebase in 2021. Nucleic Acids Research, 49(D1), D480–D489. 10.1093/nar/gkaa1100. [DOI] [PMC free article] [PubMed] [Google Scholar]
- van Zundert GC, Rodrigues JP, Trellet M, Schmitz C, Kastritis PL, Karaca E, et al. (2016). The HADDOCK2.2 web server: User-friendly integrative modeling of biomolecular complexes. Journal of Molecular Biology, 428(4), 720–725. 10.1016/j.jmb.2015.09.014. [DOI] [PubMed] [Google Scholar]
- Varadi M, Anyango S, Deshpande M, Nair S, Natassia C, Yordanova G, et al. (2022). AlphaFold Protein Structure Database: Massively expanding the structural coverage of protein-sequence space with high-accuracy models. Nucleic Acids Research, 50(D1), D439–D444. 10.1093/nar/gkab1061. [DOI] [PMC free article] [PubMed] [Google Scholar]
- Veiga da Cunha M, Hadi F, Balligand T, Stroobant V, & Van Schaftingen E (2012). Molecular identification of hydroxylysine kinase and of ammoniophospholyases acting on 5-phosphohydroxy-L-lysine and phosphoethanolamine. The Journal of Biological Chemistry, 287(10), 7246–7255. 10.1074/jbc.M111.323485. [DOI] [PMC free article] [PubMed] [Google Scholar]
- Xu D, Jaroszewski L, Li Z, & Godzik A (2014). FFAS-3D: Improving fold recognition by including optimized structural features and template re-ranking. Bioinformatics, 30(5), 660–667. 10.1093/bioinformatics/btt578. [DOI] [PMC free article] [PubMed] [Google Scholar]
- Zhang Y, & Skolnick J (2005). TM-align: A protein structure alignment algorithm based on the TM-score. Nucleic Acids Research, 33(7), 2302–2309. 10.1093/nar/gki524. [DOI] [PMC free article] [PubMed] [Google Scholar]
- Zimmermann L, Stephens A, Nam SZ, Rau D, Kübler J, Lozajic M, et al. (2018). A completely reimplemented MPI bioinformatics toolkit with a new HHpred server at its core. Journal of Molecular Biology, 430(15), 2237–2243. 10.1016/j.jmb.2017.12.007. [DOI] [PubMed] [Google Scholar]
Associated Data
This section collects any data citations, data availability statements, or supplementary materials included in this article.