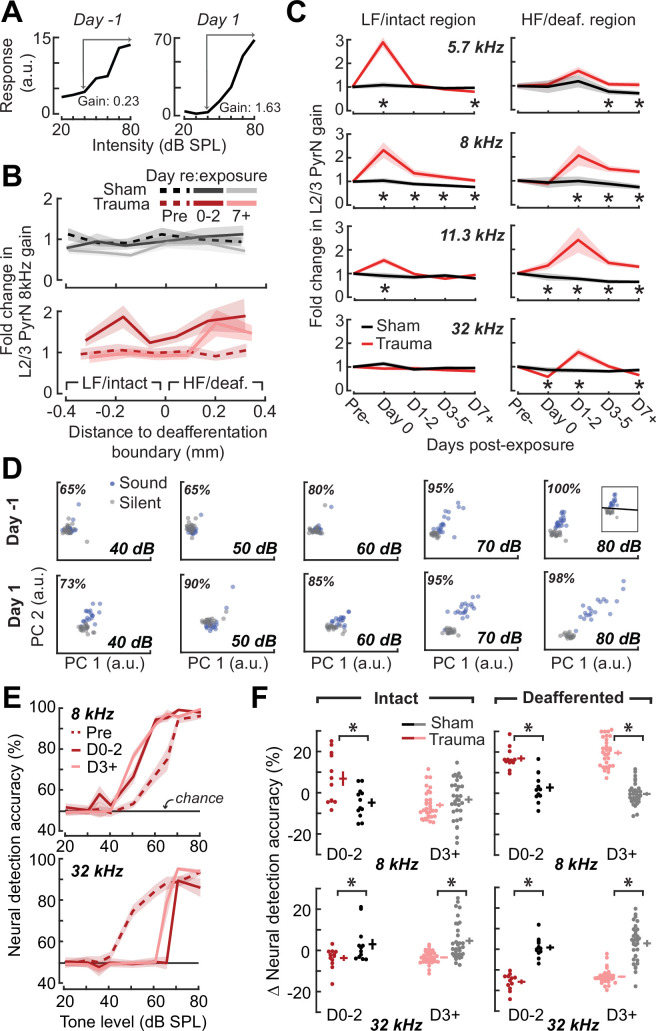
Figure 5. Increased central gain is associated with hypersensitive neural encoding of low-intensity sounds.
(A) Neural gain is measured as the average rate of response growth in the sound level-response function. A detailed description of how neural gain is measured for different types of level-response functions is provided in Figure 5—figure supplement 1. (B) Mean change in response gain to an 8 kHz tone relative to the baseline support vector machine (SVM) demarcation of the low-frequency (LF) intact and high-frequency (HF) deafferented regions of the A1 map from all sham-exposed (top) and all noise-exposed (bottom) mice. (C) Fold change in 8 kHz response gain relative to the pre-exposure period in sham (n = 23,007 PyrNs from four mice) and trauma (n = 23,319 PyrNs from four mice). After acoustic trauma, the response gain for low- and mid-frequency tones is temporarily increased in the intact region. A sustained increase in response gain is observed in the deafferented region, particularly for tone frequencies bordering the cochlear lesion. Four-way analysis of variance (ANOVA) with Group, Region, Time, and Frequency as factors main effects, respectively: F = 111.03, p = 6 × 10–26; F = 0.03, p = 0.87; F = 23.21, p = 4 × 10–19; F = 9.87, p = 2 × 10⁻⁶; Group × Region × Time × Frequency interaction term: F = 2.23; p = 0.008. Asterisks denote significant pairwise post hoc differences between groups (p < 0.05). (D) Neural ensemble responses to single trials of sound or silence were decomposed into principal components (PC) and classified with an SVM decoder. The first two PCs are presented from an example mouse 1 day before or after acoustic trauma for an 8 kHz tone. Single trial classification accuracy is provided for each sound intensity. (E) Mean decoding accuracy for 8 and 32 kHz tones across all noise-exposed mice as a function of sound intensity at varying times following acoustic trauma. (F) Mean change in decoding accuracy across all intensities for 8 and 32 kHz tones for L2/3 PyrNs in the intact and deafferented regions of the A1 map. For 8 kHz tones, PyrN ensemble decoding shows sustained improvement in the deafferented region but a temporary improvement in the intact region. Ensemble decoding of 32 kHz tones is reduced for all time points and measurement regions. Dots represent single imaging sessions. Bars denote mean ± standard error of the mean (SEM). Asterisks represent significant differences with unpaired t-tests (p < 0.05).


