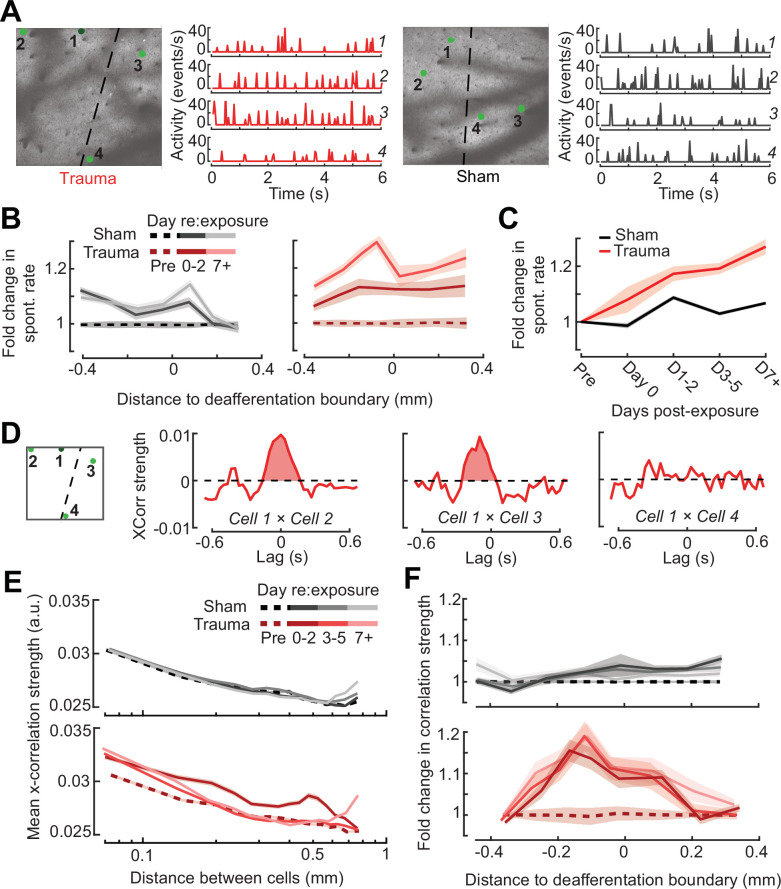
Figure 7. Topographic regulation of neural hyperexcitability and hyper-synchrony after acoustic trauma.
(A) Spontaneous activity traces in four example neurons from a trauma (left) and sham (right) mouse. (B) In chronically tracked PyrNs, spontaneous activity changes are expressed as fold change relative to that cell’s pre-exposure baseline. Increased spontaneous activity after trauma (right) or the lack thereof after sham exposure (left) are plotted over topographic distance and over post-exposure time. (C) Spontaneous activity changes across the cortical map are significantly greater after trauma than sham exposure and increase over post-exposure time (n = 915/1125 tracked cells, for trauma/sham; mixed model analysis of variance (ANOVA) with Group as a factor and Time as a repeated measure, main effect for Group [F = 12.81, p = 0.0004], main effect for Time [F = 65.03, p = 3 × 10–40], Group × Time interaction term [F = 17.66, P = 3 × 10–11]). (D) Synchrony in the spontaneous activity of PyrN pairs is measured as the area under the shuffle-corrected cross-correlogram peak (shaded red region, see Materials and methods). Example data are plotted for the same four PyrNs with topographic positions indicated in left panel. (E) Looking across all significantly correlated PyrN pairs recorded in a given imaging session (n = 3,301,363 pairs, 1,624,195/1,677,168 for trauma/sham), neural synchrony is reduced as the physical separation between somatic ROIs increases. Synchrony is increased after trauma, though remains elevated only among nearby PyrNs (three-way ANOVA with Group, Day, and Distance as factors: main effects for Group [F = 556.94, p = 4 × 10–123], Day [F = 82.6, p = 2 × 10–53], and Distance [F = 8527.73, p = 0], Group × Day × Distance interaction term [F = 7.94, p = 3 × 10⁻⁵]). (F) For each chronically tracked neuron (same sample as C), we calculate their average neural synchrony with all other cells (only taking significant pairs). Given the location of these tracked cells, we can examine the fold change in neural synchrony relative to pre-exposure baseline across the topographic map. Neural synchrony is significantly and stably increased after trauma, particularly for PyrNs located near the deafferentation boundary (mixed model ANOVA with Group and Distance as factors and Day as a repeated measure: main effects for Group [F = 26.62, p = 3 × 10⁻⁷], Day [F = 1.68, p = 0.19], and Distance [F = 0.53, p = 0.47], Group × Distance interaction term [F = 5.53, p = 0.02]).

