

Abstract
Long non-coding (lnc) urothelial cancer associated 1 (UCA1) has been confirmed to participate in osteosarcoma (OS), but its specific mechanism is still under investigation. The study was designed to reveal the interaction between UCA1 and its downstream effector molecules, so as to determine whether there is any interaction of regulating physiological processes in tumor cells. Here, we studied the signaling cascade involving UCA1, miR-145, and HMGA1. The expression of UCA1 and miR-145 levels was interfered to assess their effects on physiological processes of tumor cells. The relationship between UCA1 and miR-145 as well as between HMGA1 and miR-145 was identified by the dual-luciferase reporter (DLR) assay, and the in vivo effect of UCA1 was estimated in nude mouse xenografts. As a result, a negative association was found between UCA1 and miR-145 in OS cells. Both UCA1 knockout and miR-145 over-expression inhibited malignant progression and induced apoptosis in MG-63 and U2OS cells. UCA1 knockout led to an increase in miR-145 and decreases in HMGA1, p-β-catenin and cyclin D1. In addition, UCA1 upregulation promoted tumor growth in vitro and changed miR-145 and HMGA1 levels in vivo. Moreover, the DLR assay and RNA immunoprecipitation (RIP) showed that UCA1 was likely to regulate HMGA1 levels by sponging miR-145. Overall, the inhibition of UCA1 increases miR-145 levels and decreases HMGA1 levels, thereby exerting an anti-tumor role in OS.
Keywords: lncRNA UCA1, miR-145, HMGA1, Wnt/β-catenin, osteosarcoma
Introduction
As the most common primary bone tumor, osteosarcoma (OS) originates from osteoblasts and occurs mostly in children and young people [1]. It is aggressive and highly metastatic [2], and nowadays, the preferred treatment options include surgery, neoadjuvant radiotherapy and chemotherapy, with an overall 5-year survival rate of about 70% [3,4]. However, due to the high invasiveness, OS metastasis develops in more than 40-50% of patients, resulting in the long-term survival rate of 10-30% [5]. Therefore, identifying novel molecules related to tumor progression is crucial to lowering the morbidity and mortality of OS.
Long non-coding RNAs (lncRNAs), a member of ncRNAs with a length ≥200 nt, have been initially considered as the waste in the process of genome transcription because of their incompetence in regulating protein transcription [6,7]. However, they have been recently confirmed to be involved in multiple biological processes including transcriptional activation, transcriptional interference, nuclear transport and tumor initiation [7,8]. For example, lncRNA LOXL1-AS1/microRNA (miR)-28-5p/SEMA7A axis accelerates the progression of pancreatic cancer [9], and lncRNA-UCA1 (urothelial cancer associated 1) modulates colon cancer progression via miR-28-5p/Hoxb3 axis [10]. UCA1, also known as LINC00178, is a valuable tumor-related lncRNA [11,12] highly expressed in lung cancer [13], gastric cancer [14], and OS [15], but its mechanism in OS has not been clarified.
Competing endogenous RNAs (ceRNAs) are a class of newly proposed mechanism for the involvement of lncRNAs in biological processes, that is, lncRNAs regulate miR expression by competing for miRNA response elements (MREs) [16,17]. In the present study, we found through online analysis that UCA1 and miR-145 had target binding sites. Prior research has also uncovered the regulatory relationship between miR-145 and Wnt/β-catenin pathway, a pivotal pathway for tumor metastasis [18]. Thus, we speculate that UCA1 may be capable of modulating Wnt/β-catenin pathway.
This study explored the role of UCA1 in OS, with the aim of offering potential therapeutic targets to its treatment.
Materials and data
Clinical data
Eighty patients with OS admitted to our hospital from Oct, 2013 to Oct, 2020 were recruited. During the surgery, cancerous and adjacent tissues were collected, transported into liquid nitrogen, and then stored at -80°C. The inclusion criteria: patients confirmed with OS based on pathology and imaging examination; patients met the 7th TNM staging criteria issued by AJCC in 2009; and patients with complete clinical data. All of them signed informed consent forms after being apprised of the study. The exclusion criteria of the study: patients with other comorbid tumors, patients with estimated survival time less than 1 month, and those who had received targeted anti-cancer treatment before this study. Ethics approval was obtained from hospital medical committee (KY2020377) and conformed to the Declaration of Helsinki [19].
Cell culture
Human bone cell line (hFOB) and OS cells (SOSP-9607, MG-63, U2OS, and SAOS-2) (ATCC) were cultured in DMEM with 10% FBS (Sigma, USA) and 100 U/ml Pen-Strep (37°C, 5% CO2).
Cell transfection
UCA1 over-expression vector was constructed with pcDNA-3.1. Small interfering RNA-UCA1, miR-145 mimics, NC mimics (NC), and miR-145 inhibitor were from Ribobio (Guangzhou, China). OS cells were transfected with plasmids by liposome 3000 (Invitgen, Carlsad, CA, USA), and then analyzed after 48 h of transfection. Stable transfected cells were screened out by G418 (0.5 mg/ml, Sigma-Aldrich, St. Louis, Missouri, USA). The transfection sequences are expressed in Table 1.
Table 1.
Primer sequence
| Gene | Forward | Reverse |
|---|---|---|
| pcDNA-UCA1 | CGG-GATCCTGACATTCTTCTGGACAATGAG | CCG-GAATTCGCATATTAGCTTTAATGTAGGTGGC |
| si-UCA1 | GGACAACAGUACACGCAUA | |
| miR-145-mimics | GUCCAGUUUCCCAGGAAUCCCU | |
| anti-miR-145 | GUUGCGAUAGGAAUCA |
Cell proliferation assay (CCK-8)
In this assay, a CCK-8 assay kit (Nanjing Jigen Biotechnology Co., Ltd., Nanjing, China) was adopted to determine the effect of UCA1 on viability of OS cells. Specifically, transfected OS cells were collected and cultured in 96-well plates for 24, 48 or 72 h. Finally, proliferation of the cells was determined with the CCK-8 kit, and the optical density at 450 nm was measured by an ELISA reader.
Cell invasion and migration assay
Cell proliferation and invasion were determination by the Transwell method. For the invasion assay, the upper compartment of the Transwell chamber was precoated with Matrigel (BD Biosciences, Franklin Lakes, NJ, USA). In the invasion assay, transfected OS cells were transferred to the apical chamber with serum-free culture medium, while the basal lateral chamber was filled with culture medium containing 10% fetal bovine serum. After 24 h, the cells were stained with crystal violet (Sigma-Aldrich, St. Louis, Missouri, USA) in the dark and analyzed under a microscope. In the migration assay, except that Matrigel was not contained in the upper compartment, the other steps were the same as those of invasion assay.
Flow cytometry (FCM)
AnnexinV-FITC/PI (South Biotech, USA) was used to quantify the apoptosis of transfected OS cells. The MG-63 and U2OS cells in the culture medium were washed with PBS, fixed with ethanol (70%), then washed twice and centrifuged. After that, an appropriate amount of combined buffer was added to prepare a single cell suspension with a cell concentration of 1×10⁶ cells/ml. The 100 μhe 100 hat, an appropriate amount of combined buffer was added to prepare a single cell suspension with a cell co μhe 100 hat, an appropr μhe 100 hat, an appropriate amount of combined buffer was aunder dark conditions at room temperature for 1 h. Apoptosis was detected by FACSCan (BD Biosciences, USA) (Annexin-V positive, PI negative).
RNA purification and qRT-PCR
cDNA was extracted from TRIzol-extracted total RNA (Invitrogen, USA) using a PrimeScript RT kit, followed by RT-PCR assay with a SYBR® Premix Ex TaqTM II kit and PCR amplification with an ABI 7500 amplifier. Reaction system consisted of mix (10 μL), upstream and downstream primers (each 0.8 μL), cDNA (2 μL) and DEPC water (6.4 μL). Cyclic conditions were as follows: denaturation at 95°C for 5 min, 95°C for 30 s, 61°C for 30 s, 72°C for 30 s, with a total of 45 cycles. Three multiple wells were set up in each group. With GAPDH as endogenous reference of mRNA and lncRNA, and U6 as reference of miR, results were calculated by the 2-ΔΔCT method [20] (Table 2).
Table 2.
Primer sequence
| Gene | Upstream primer (5’-3’) | Downstream primer (5’-3’) |
|---|---|---|
| UCA1 | CTCTCCATTGGGTTCACCATTC | GCGGCAGGTCTTAAGAGATGAG |
| miR-145 | ACCTG CTGTGTTGAGC | CGGGTGCTTCTACTGGGAG |
| HMGA1 | GCTGGTAGGGAGTCAGAAGGA | TGGTGGTTTTCCGGGTCTTG |
| U6 | CTCGCTTCGGCAGCACA | AACGCTTCACGAATTTGCGT |
| GAPDH | AGTAGTCACCTGTTGCTGG | TAATACGGAGACCTGTCTGGT |
Western blot (WB)
Total protein treated by RIPA buffer was tested using BCA (Thermo, PA, USA). Afterwards, it was separated in 12% SDS-PAGE and transferred to a PVDF membrane. It was sealed with milk powder and immunostained overnight with primary antibodies against HMGA1 (abcam, ab129153, 1:500), β-catenin (abcam, ab32572, 1:500), p-β-catenin (abcam, ab246504, 1:500), cyclin D1 (abcam, ab16663, 1:1000) and GAPDH (abcam, ab129153, 1:1000) at 4°C. Following incubation with secondary antibody, fluorescent signals were visualized in a chemiluminescence system (Pierce, Thermo, PA, USA).
Dual-luciferase reporter (DLR) assay
A total of four pmiR-RB-REPORT TM vectors were obtained: HMGA1 3’-UTR containing putative target sites of miR-145 (HMGA1 WT-3’-UTR), HMGA1 3’-UTR containing mutant binding sites (HMGA1 Mut-3’-UTR), full-length UCA1 containing putative miR-145 targets (UCA1-WT), and full-length UCA1 containing mutant binding sites (UCA1-Mut). The vectors (100 ng) were separately transfected with miR-145 mimic or mimic control (50 nM/well) into 293T cells with riboFECTTM CP reagent (Ribobio), followed by determination of luciferase activity with a DLR kit (Promega, Madison, WI, USA).
RNA immunoprecipitation (PIR)
A Magna RIP kit (Millipore, Billerica, MA, USA) was used to conduct RIP. Whole cell lysate in RIP buffer (containing magnetic beads coupled with human anti-Ago2 antibody or normal mouse IgG) was adopted as negative control. Next, proteinase k was added, and immunoprecipitated RNA was isolated. The isolated RNA was analyzed by qRT-PCR, from which the relative expression of UCA1 and miR-145 was quantified.
Nude mouse xenografts
MG-63 cells (5×10⁶ cell) treated with control lentivirus (sh-NC) and UCA1 knocked out lentivirus (sh-UCA1) were inoculated subcutaneously into 10 BALA/C nude mice (male, 18-25 g, 4 weeks old; Vital River, Beijing, China) (n=5 in each group). The tumor volume ((Dmax × Dmin ^2)/2, mm3) was calculated. Twenty-eight days after inoculation, all nude mice were euthanized by carbon dioxide inhalation, and their tumor tissues were collected. This study was approved by the animal ethics committee of our hospital and carried out in accordance with the American Guidelines for the Care and Use of Laboratory Animals.
Statistical analysis
GraphPad 8 was adopted for data processing, and inter-group comparisons were carried out by the independent samples t-test. The counting data were analyzed by the chi-square test. Univariate ANOVA analysis was used for comparison among groups, and LSD-t method was used as post-hoc test. Comparisons among multiple time points were conducted by the repeated measures analysis of variance, and Bonferroni was adopted for post hoc test. In addition, Pearson test was used to identify the correlation of each gene, K-M curve was plotted to visualize the total survival of patients, and a Log-rank test was used for the data analysis. P<0.05 indicates a significant difference.
Results
Increased UCA1 levels in OS indicated an unfavorable prognosis
In the present study, as demonstrated by qRT-PCR, an increase in UCA1 was observed in both OS tissues (Figure 1A, P<0.001) and cell lines (Figure 1B, P<0.05), indicating the involvement of UCA1 in OS. Next, we assessed the value of UCA1 in OS. Patients were assigned into high and low expression groups according to the median value of UCA1 levels, and the correlation between UCA1 and clinical data of patients was analyzed. It turned out that patients in the high expression group were more likely to develop large tumor ≥5 cm, stage IIB/III disease, and distal metastases (Table 3, P<0.05). In addition, they had a lower 5-year survival than those in the other group (Figure 1C, P=0.011), which suggested an association of UCA1 with prognosis of patients.
Figure 1.

UCA1 levels in OS tissues and cells and their correlation with survival. A. Relative expression of UCA1 in OS tissues (qRT-PCR) was analyzed by paired t-test. Cancerous tissues vs. para-cancerous tissues, ***P<0.001 (n=80). B. Relative expression of UCA1 in OS cell lines (qRT-PCR) was assessed by one-way ANOVA, and LSD-t test was used as post-hoc analysis. *P<0.05 vs. hFOB, **P<0.01 vs. hFOB (n=3). C. Comparison of 5-year survival of patients in high and low expression groups (K-M curve) (n=80).
Table 3.
Relationship between UCA1 expression level and clinical data
| Factor | UCA1 expression level | P value | |
|---|---|---|---|
|
| |||
| High expression (n=40) | Low expression (n=40) | ||
| Gender | 0.227 | ||
| Male | 25 | 30 | |
| Female | 15 | 10 | |
| Age | 0.112 | ||
| ≥18 years old | 27 | 20 | |
| <18 years old | 13 | 20 | |
| Tumor size | 0.002 | ||
| ≥5 cm | 29 | 15 | |
| <5 cm | 11 | 25 | |
| Stage | <0.001 | ||
| I+II A | 13 | 29 | |
| IIB/III | 27 | 11 | |
| Metastasis | 0.001 | ||
| Yes | 25 | 10 | |
| No | 15 | 30 | |
Note: Chi-square test is used.
Absence of UCA1 inhibited growth and metastasis of OS cells
siRNAs (si-UCA1#1, #2) were designed to explore the effect of UCA1 on OS cells. si-UCA1#1, the most efficient one, was selected to transfect the cells (Figure 2A, P<0.01), and qRT-PCR confirmed the success of the transfection (Figure 2B, P<0.01). A series of investigations indicated that knocking down UCA1 inhibited the proliferation (Figure 2C, P<0.05), invasion and migration (Figure 2D, 2E, P<0.05) of OS cells, and induced their apoptosis (Figure 2F, P<0.05). Therefore, UCA1 participated in the pathogenesis of OS. Furthermore, we found that p-β-catenin and cyclin D1 levels declined evidently (WB; Figure 3A, 3B, P<0.05), indicating that UCA1 possibly regulated Wnt/β-catenin pathway.
Figure 2.

Effect of knocking down UCA1 on proliferation, invasion, migration and apoptosis in OS cells. A. Relative expression of UCA1 after si-UCA1 transfection was assessed by qRT-PCR (one-way ANOVA with LSD-t test). si-UCA1#1, #2 vs. si-NC, **P<0.01 (n=3). B. Relative expression of UCA1 after si-UCA1#1 transfection was assessed by qRT-PCR (independent-sample t test). si-UCA1#1 vs. si-NC, **P<0.01 (n=3). C. Proliferation of OS cells after si-UCA1#1 transfection was observed by CCK-8 (ANOVA with Bonferroni test). si-UCA1#1 vs. si-NC, *P<0.05 (n=3). D, E. Invasion and migration of OS cells after si-UCA1#1 transfection were assessed by Transwell (independent-sample t test). si-UCA1#1 vs. si-NC, *P<0.05. (×200, n=3). F. Apoptosis of OS cells after si-UCA1#1 transfection was assessed by FCM (independent-sample t test). si-UCA1#1 vs. si-NC, **P<0.01 (n=3).
Figure 3.

Knockdown of UCA1 lowered p-β-catenin and cyclin D1 levels in OS cells. A. p-β-catenin and cyclin D1 levels in MG-63 cells were assessed via WB (independent-sample t test). si-UCA1#1 vs. si-NC, *P<0.05 (n=3). B. p-β-catenin and cyclin D1 levels in U2OS cells were assessed via WB (independent-sample t test). si-UCA1#1 vs. si-NC, *P<0.05 (n=3).
UCA1 targeted and regulated miR-145
There is evidence that UCA1 plays a role in many tumors as a ceRNA of multiple miRs. To identify the potential mechanism of UCA1 in OS, we found that miR-145 and UCA1 shared target binding sites (Figure 4A). In addition, the DLR assay and RIP confirmed that UCA1 had the ability to bind miR-145. Also, the luciferase activity of UCA1-WT was inhibited by miR-145-mimic (Figure 4B, P<0.05), and both UCA1 and miR-145 could be precipitated by Ago2 (Figure 4C). Then, qRT-PCR verified that miR-145 level in OS cells increased after transfection of si-UCA1#1, but there was no significant difference between the miR-145-mimics+si-UCA1 group and the si-NC group (Figure 4D, P<0.05). These results indicated that UCA1 could regulate the level of miR-145.
Figure 4.

UCA1 was proved to be able to regulate miR-145 levels. A. Target binding sites between UCA1 and miR-145. B. UCA1 has the ability to bind miR-145, which was assessed via DLR assay (independent-sample t test). miR-NC vs. miR-145-mimic, *P<0.05 (n=3). C. Targeted binding between UCA1 and miR-145 was assessed by RIP (one-way ANOVA followed with LSD-t test) (n=3). D. Regulatory effect of UCA1 on miR-145 in OS cells after co-transfection was assessed by qRT-PCR (one-way ANOVA followed with LSD-t test). *P<0.05 vs. si-NC (n=3).
HMGA1 was proved to be the target gene of miR-145
We predicted the downstream target genes of miR-145 using an online tool to fathom the mechanism of miR-145 in OS. It revealed that HMGA1 shared targeted binding sites with mR-145 (Figure 5A). A DLR assay further determined the relationship between them. The luciferase activity of HMGA1-WT was inhibited by miR-145-mimic, suggesting a regulatory relationship between miR-145 and HMGA1 (Figure 5B, P<0.05). To verify the targeted regulation of miR-145 on HMGA1, qRT-PCR and WB were carried out. mRNA and protein levels of HMGA1 were remarkably suppressed in miR-145-mimic treated OS cells, and the co-transfection of pcDNA-3.1-HMGA1 and miR-145-mimic had no impact compared to miR-NC (Figure 5C, 5D, P<0.05). Therefore, HMGA1 was the target gene of miR-145, and miR-145 was capable of regulating HMGA1.
Figure 5.

miR-145 regulated the relative expression of HMGA1. A. Target binding sites between miR-145 and HMGA1. B. Confirmation of the targeted binding of miR-145 and HMGA1 by DLR assay. miR-NC vs. miR-145-mimic, *P<0.05; independent-sample t test (n=3). C. Relative expression of HMGA1 mRNA in OS cells after co-transfection detected by qRT-PCR. *P<0.05 vs. miR-NC group; one-way ANOVA was used for this study, and LSD-t test was used as post-hoc analysis (n=3). D. Relative expression of HMGA1 protein in OS cell after co-transfection was assessed by WB (one-way ANOVA followed with LSD-t test). *P<0.05 vs. miR-NC group (n=3).
Correlation among UCA1, miR-145 and HMGA1
We used qRT-PCR to quantify miR-145 and HMGA1 levels in OS tissues. A lower miR-145 (Figure 6A, P<0.001) and a higher HMGA1 (Figure 6B, P<0.001) in OS tissues were observed than those in adjacent tissues. Furthermore, correlation analyses indicated a negative association between UCA1 and miR-145 (Figure 6C), a positive association between UCA1 and HMGA1 (Figure 6D), and a negative association between HMGA1 and miR-145 (Figure 6E).
Figure 6.

Correlation among UCA1, miR-145 and HMGA1 in OS tissues. A. Relative expression of miR-145 in OS tissues (qRT-PCR). Cancerous tissues vs. para-cancerous tissues; paired t-test was used for analysis, ***P<0.001 (n=80). B. Relative expression of HMGA1 in OS tissues. Cancerous tissues vs. para-cancerous tissues; paired t-test was used for analysis; ***P<0.001 (n=80). C-E. Correlation among UCA1, miR-145 and HMGA1 in OS tissues (Pearson test) (n=80).
UCA1 inhibited OS invasion and migration by regulating miR-145/HMGA1
To verify the ability of UCA1 to regulate miR-145/HMGA1, co-transfections were carried out. As shown by qRT-PCR and WB, si-UCA1#1 effectively suppressed the up-regulated mRNA and protein levels of HMGA1 induced by anti-miR-145 or pcDNA-3.1-HMGA1 (Figure 7A, 7B, P<0.05). The inhibition of si-UCA1#1 on invasion and migration of OS cells was reversed by si-UCA1#1+anti-miR-145 or si-UCA1#1+pcDNA-3.1-HMGA1 (Figure 7C, 7D, P<0.05). In addition, WB showed that p-β-catenin and cyclin D1 levels after co-transfection were higher than those after single transfection of anti-miR-145 or pcDNA-3.1-HMGA1 (Figure 8A, 8B, P<0.05). Thus, si-UCA1 restricted OS invasion and migration via the Wnt/β-catenin pathway mediated by miR-145/HMGA1.
Figure 7.

si-UCA1 restricted OS invasion and migration by regulating miR-145/HMGA1. A. Relative expression of HMGA1 mRNA in OS cells after co-transfection was detected by qRT-PCR. *P<0.05 vs. si-NC+miR-NC group; one-way ANOVA was used for this study, and LSD-t test was used as post analysis (n=3). B. Relative expression of HMGA1 protein in OS cells after co-transfection was detected by qRT-PCR. *P<0.05 vs. si-NC+miR-NC group; one-way ANOVA was used for this study, and LSD-t test was used as post analysis (n=3). C, D. Changes in invasion and migration in OS cells after co-transfection were detected by Transwell. *P<0.05 vs. si-NC+miR-NC group; one-way ANOVA was used for this study, and LSD-t test was used as post analysis (×200, n=3).
Figure 8.
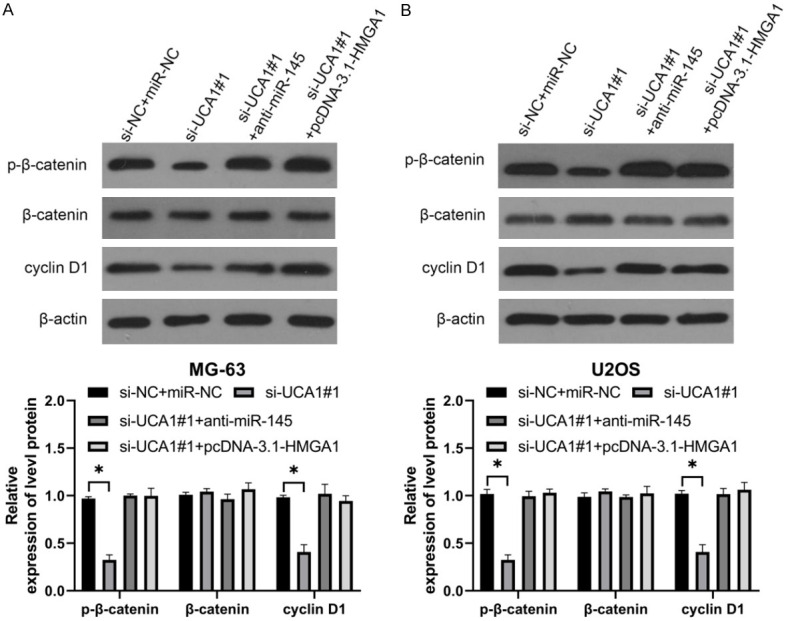
UCA1 modulates Wnt/β-catenin pathway via miR-145/HMGA1 axis. A. p-β-catenin and cyclin D1 levels in MG-63 cells (WB). *P<0.05 vs. si-NC+miR-NC group; one-way ANOVA was used for this study, and LSD-t test was used as post analysis (n=3). B. p-β-catenin and cyclin D1 levels in U2OS cells (WB); one-way ANOVA was used for this study, and LSD-t test was used as post analysis. *P<0.05 vs. si-NC+miR-NC group (n=3).
Over-expression of UCA1 accelerated OS growth in nude mice
A nude mouse model of OS was established to determine the role of UCA1 in OS. The tumor increased in volume (Figure 9A, P<0.01) and mass (Figure 9B, P<0.01) in mice transfected with pcDNA-3.1-UCA1. Decreased relative expression of miR-145 in OS tissues was observed in qRT-PCR after transfection of pcDNA-3.1-UCA1 (Figure 9C, P<0.05), while HMGA1 was elevated. In addition, WB showed that pcDNA-3.1-NC increased protein levels of HMGA1, p-β-catenin and cyclin D1 in OS tissues (Figure 9D, P<0.05). Therefore, UCA1 could mediate Wnt/β-catenin pathway via miR-145/HMGA1 axis, thus participating in OS.
Figure 9.

Overexpression of UCA1 accelerates OS growth in nude mice. A. Changes in tumor volume in nude mice within 28 days. **P<0.01, vs. pcDNA-3.1-NC; repeated measures ANOVA followed with Bonferroni test (n=5). B. Changes in tumor mass in nude mice sacrificed 28 days later. **P<0.01, vs. pcDNA-3.1-NC, independent-sample t test (n=5). C. Relative expression of miR-145 and HMGA1 in nude mice with pcDNA-3.1-UCA1 treatment was assessed by qRT-PCR. **P<0.05, vs. pcDNA-3.1-NC, independent-sample t test (n=5). D. Protein levels of HMGA1, p-β-catenin and cyclin D1 in nude mice with pcDNA-3.1-UCA1 treatment were assessed by WB. **P<0.05, vs. pcDNA-3.1-NC, independent-sample t test (n=5).
Discussion
OS, a common malignancy among adolescents, has always been one of the difficult problems [21,22], accounting for 2.4% of all malignancies in children [23]. Despite advances in medicine and the improvement of diagnosis, the survival of patients with OS remains disappointing because tumor metastasis greatly increases the difficulty of treatment [24,25]. In the present study, UCA1 regulated the oncogene HMGA1 by competing for miR-145 in OS cells as a ceRNA, thus mediating the Wnt/β-catenin pathway to inhibit cell metastasis.
LncRNAs are crucial regulators in a wide range of tumor biological processes [26,27]. As an lncRNA discovered early, UCA1 is highly expressed in various tumors [28,29], including OS [15], which was verified in this study. In addition, we noticed that UCA1 was significantly associated with the prognosis of OS, so it was expected to be a prognostic indicator for OS. Also, UCA1 was found to be related to clinical staging, tumor size and distant metastasis. Inhibition of metastasis is the key to OS treatment. We constructed si-UCA1#1 to estimate the influence of UCA1 on OS cell growth and metastasis. After transfection, malignant phenotypes were inhibited dramatically, and apoptosis was stimulated, indicating the effectiveness of UCA1 knockdown in inhibiting malignant progression in OS cells.
ceRNA is a key factor affecting the involvement of lncRNA in tumor progression [30]. For the purpose of elucidating the possible mechanism of UCA1 in OS, target binding sites between miR-145 and UCA1 were predicted online. Moreover, the targeted relationship between them was determined by DLR assay and RIP. miR-145 located at human chromosome 5q32 was lowly expressed in cases with OS [31]. We also noticed decreased miR-145 in OS in this study, and its negative correlation with UCA1, which suggested a possible regulatory relationship between UCA1 and miR-145. To verify our hypothesis, co-transfection experiments were performed and the regulatory effect of UCA1 on miR-145 was identified.
HMGA1 belongs to the HMGA protein family that modulates chromatin structure by binding DNA sequences rich in A/T in promoter and enhancer regions of human genes [32,33]. HMGA1 shows high expression profiles in lung cancer [34], gastric cancer [35] and colorectal cancer [36]. And it also participates in tumor metastasis via Wnt/β-catenin pathway [37]. The existence of target binding sites between miR-145 and HMGA1 and their targeted relationship were verified, and the inhibitory role of miR-145 upregulation in HMGA1 levels was revealed. These findings allow us to draw a conclusion that miR-145 is able to regulate HMGA1. There is evidence that HMGA1 can mediate Wnt/β-catenin pathway, OS growth and metastasis and other biological processes [38,39]. More importantly, targeting Wnt/β-catenin pathway is a potential treatment for OS [40,41]. Co-transfection experiments indicated that UCA1 affected invasion and migration in OS cells by mediating Wnt/β-catenin pathway via miR-145/HMGA1 axis. Upregulation of UCA1 accelerated tumor growth in nude mice, and up-regulated HMGA1, p-β-catenin and cyclin D1 proteins in OS tissues, suggesting the role of UCA1 as a therapeutic target for OS.
Although we have confirmed the ability of UCA1 to regulate Wnt/β-catenin pathway and its participation in OS metastasis (Figure 10), there are still limitations. First, the diagnostic implications of UCA1 in OS have not been evaluated, and there is a lack of diversity in samples. For instance, peripheral blood mononuclear cells and exosomes have been determined to be highly diagnostic for cancers. Second, the involvement of Wnt/β-catenin pathway in OS resistance has been reported, but the mechanism of UCA1/miR-145/HMGA1 axis in OS resistance remains unexplored in this study. Thus, we will include more samples and carry out basic research to supplement our conclusions.
Figure 10.

UCA1/miR-145/HMGA1 axis modulates Wnt/β-catenin pathway.
To sum up, with high expression profiles in OS, lncRNA UCA1 interferes with OS progression by regulating miR-145/HMGA1 axis-mediated Wnt/β-catenin pathway, which is an available therapeutic target.
Acknowledgements
This study was supported by the mechanism of targeted regulation of WT1 by mesenchymal stem cells-derived exosomal miR-128-2-5p in the autophagy and apoptosis promotion of osteosarcoma cells, No. 2020068.
Disclosure of conflict of interest
None.
References
- 1.Brown HK, Tellez-Gabriel M, Heymann D. Cancer stem cells in osteosarcoma. Cancer Lett. 2017;386:189–195. doi: 10.1016/j.canlet.2016.11.019. [DOI] [PubMed] [Google Scholar]
- 2.Pu F, Chen F, Zhang Z, Liu J, Shao Z. Information transfer and biological significance of neoplastic exosomes in the tumor microenvironment of osteosarcoma. Onco Targets Ther. 2020;13:8931–8940. doi: 10.2147/OTT.S266835. [DOI] [PMC free article] [PubMed] [Google Scholar]
- 3.Suehara Y, Alex D, Bowman A, Middha S, Zehir A, Chakravarty D, Wang L, Jour G, Nafa K, Hayashi T, Jungbluth AA, Frosina D, Slotkin E, Shukla N, Meyers P, Healey JH, Hameed M, Ladanyi M. Clinical genomic sequencing of pediatric and adult osteosarcoma reveals distinct molecular subsets with potentially targetable alterations. Clin Cancer Res. 2019;25:6346–6356. doi: 10.1158/1078-0432.CCR-18-4032. [DOI] [PMC free article] [PubMed] [Google Scholar]
- 4.Kager L, Tamamyan G, Bielack S. Novel insights and therapeutic interventions for pediatric osteosarcoma. Future Oncol. 2017;13:357–368. doi: 10.2217/fon-2016-0261. [DOI] [PubMed] [Google Scholar]
- 5.Hao Y, An R, Xue Y, Li F, Wang H, Zheng J, Fan L, Liu J, Fan H, Yin H. Prognostic value of tumoral and peritumoral magnetic resonance parameters in osteosarcoma patients for monitoring chemotherapy response. Eur Radiol. 2020;31:3518–3529. doi: 10.1007/s00330-020-07338-y. [DOI] [PMC free article] [PubMed] [Google Scholar]
- 6.Ferre F, Colantoni A, Helmer-Citterich M. Revealing protein-lncRNA interaction. Brief Bioinform. 2016;17:106–116. doi: 10.1093/bib/bbv031. [DOI] [PMC free article] [PubMed] [Google Scholar]
- 7.Charles Richard JL, Eichhorn PJA. Platforms for investigating LncRNA functions. SLAS Technol. 2018;23:493–506. doi: 10.1177/2472630318780639. [DOI] [PMC free article] [PubMed] [Google Scholar]
- 8.Jathar S, Kumar V, Srivastava J, Tripathi V. Technological developments in lncRNA biology. Adv Exp Med Biol. 2017;1008:283–323. doi: 10.1007/978-981-10-5203-3_10. [DOI] [PubMed] [Google Scholar]
- 9.Liu Y, Guo C, Li F, Wu L. LncRNA LOXL1-AS1/miR-28-5p/SEMA7A axis facilitates pancreatic cancer progression. Cell Biochem Funct. 2020;38:58–65. doi: 10.1002/cbf.3449. [DOI] [PubMed] [Google Scholar]
- 10.Cui M, Chen M, Shen Z, Wang R, Fang X, Song B. LncRNA-UCA1 modulates progression of colon cancer through regulating the miR-28-5p/HOXB3 axis. J Cell Biochem. 2019 doi: 10.1002/jcb.27630. [Epub ahead of print] [DOI] [PubMed] [Google Scholar]
- 11.Barbagallo C, Brex D, Caponnetto A, Cirnigliaro M, Scalia M, Magnano A, Caltabiano R, Barbagallo D, Biondi A, Cappellani A, Basile F, Di Pietro C, Purrello M, Ragusa M. LncRNA UCA1, upregulated in CRC biopsies and downregulated in serum exosomes, controls mRNA expression by RNA-RNA interactions. Mol Ther Nucleic Acids. 2018;12:229–241. doi: 10.1016/j.omtn.2018.05.009. [DOI] [PMC free article] [PubMed] [Google Scholar]
- 12.Wang H, Guan Z, He K, Qian J, Cao J, Teng L. LncRNA UCA1 in anti-cancer drug resistance. Oncotarget. 2017;8:64638–64650. doi: 10.18632/oncotarget.18344. [DOI] [PMC free article] [PubMed] [Google Scholar]
- 13.Wu H, Zhou C. Long non-coding RNA UCA1 promotes lung cancer cell proliferation and migration via microRNA-193a/HMGB1 axis. Biochem Biophys Res Commun. 2018;496:738–745. doi: 10.1016/j.bbrc.2018.01.097. [DOI] [PubMed] [Google Scholar]
- 14.Li C, Liang G, Yang S, Sui J, Yao W, Shen X, Zhang Y, Peng H, Hong W, Xu S, Wu W, Ye Y, Zhang Z, Zhang W, Yin L, Pu Y. Dysregulated lncRNA-UCA1 contributes to the progression of gastric cancer through regulation of the PI3K-Akt-mTOR signaling pathway. Oncotarget. 2017;8:93476–93491. doi: 10.18632/oncotarget.19281. [DOI] [PMC free article] [PubMed] [Google Scholar]
- 15.Li W, Xie P, Ruan WH. Overexpression of lncRNA UCA1 promotes osteosarcoma progression and correlates with poor prognosis. J Bone Oncol. 2016;5:80–85. doi: 10.1016/j.jbo.2016.05.003. [DOI] [PMC free article] [PubMed] [Google Scholar]
- 16.Xu J, Li Y, Lu J, Pan T, Ding N, Wang Z, Shao T, Zhang J, Wang L, Li X. The mRNA related ceRNA-ceRNA landscape and significance across 20 major cancer types. Nucleic Acids Res. 2015;43:8169–8182. doi: 10.1093/nar/gkv853. [DOI] [PMC free article] [PubMed] [Google Scholar]
- 17.Karreth FA, Pandolfi PP. ceRNA cross-talk in cancer: when ce-bling rivalries go awry. Cancer Discov. 2013;3:1113–1121. doi: 10.1158/2159-8290.CD-13-0202. [DOI] [PMC free article] [PubMed] [Google Scholar]
- 18.Li Q, Yu X, Yang L. MiR-145 inhibits cervical cancer progression and metastasis by targeting WNT2B by Wnt/beta-catenin pathway. Int J Clin Exp Pathol. 2019;12:3740–3751. [PMC free article] [PubMed] [Google Scholar]
- 19.Issue information-declaration of Helsinki. J Bone Miner Res. 2018;34:BM i–BM ii. doi: 10.1002/jbmr.3271. [DOI] [PubMed] [Google Scholar]
- 20.Livak KJ, Schmittgen TD. Analysis of relative gene expression data using real-time quantitative PCR and the 2(-Delta Delta C(T)) method. Methods. 2001;25:402–408. doi: 10.1006/meth.2001.1262. [DOI] [PubMed] [Google Scholar]
- 21.Simpson E, Brown HL. Understanding osteosarcomas. JAAPA. 2018;31:15–19. doi: 10.1097/01.JAA.0000541477.24116.8d. [DOI] [PubMed] [Google Scholar]
- 22.ElKordy MA, ElBaradie TS, ElSebai HI, KhairAlla SM, Amin AAE. Osteosarcoma of the jaw: challenges in the diagnosis and treatment. J Egypt Natl Canc Inst. 2018;30:7–11. doi: 10.1016/j.jnci.2018.02.001. [DOI] [PubMed] [Google Scholar]
- 23.Anninga JK, Gelderblom H, Fiocco M, Kroep JR, Taminiau AH, Hogendoorn PC, Egeler RM. Chemotherapeutic adjuvant treatment for osteosarcoma: where do we stand? Eur J Cancer. 2011;47:2431–2445. doi: 10.1016/j.ejca.2011.05.030. [DOI] [PubMed] [Google Scholar]
- 24.Tang XF, Cao Y, Peng DB, Zhao GS, Zeng Y, Gao ZR, Lv YF, Guo QN. Overexpression of Notch3 is associated with metastasis and poor prognosis in osteosarcoma patients. Cancer Manag Res. 2019;11:547–559. doi: 10.2147/CMAR.S185495. [DOI] [PMC free article] [PubMed] [Google Scholar]
- 25.Zhang Y, Zhang L, Zhang G, Li S, Duan J, Cheng J, Ding G, Zhou C, Zhang J, Luo P, Cai D, Kuang L, Zhou Y, Tong L, Yu X, Zhang L, Xu L, Yu L, Shi X, Ke A. Osteosarcoma metastasis: prospective role of ezrin. Tumour Biol. 2014;35:5055–5059. doi: 10.1007/s13277-014-1799-y. [DOI] [PubMed] [Google Scholar]
- 26.Li J, Li Z, Zheng W, Li X, Wang Z, Cui Y, Jiang X. LncRNA-ATB: an indispensable cancer-related long noncoding RNA. Cell Prolif. 2017;50:e12381. doi: 10.1111/cpr.12381. [DOI] [PMC free article] [PubMed] [Google Scholar]
- 27.Li J, Meng H, Bai Y, Wang K. Regulation of lncRNA and its role in cancer metastasis. Oncol Res. 2016;23:205–217. doi: 10.3727/096504016X14549667334007. [DOI] [PMC free article] [PubMed] [Google Scholar]
- 28.Yao F, Wang Q, Wu Q. The prognostic value and mechanisms of lncRNA UCA1 in human cancer. Cancer Manag Res. 2019;11:7685–7696. doi: 10.2147/CMAR.S200436. [DOI] [PMC free article] [PubMed] [Google Scholar]
- 29.Yan Q, Tian Y, Hao F. Downregulation of lncRNA UCA1 inhibits proliferation and invasion of cervical cancer cells through miR-206 expression. Oncol Res. 2018 doi: 10.3727/096504018X15185714083446. [Epub ahead of print] [DOI] [PubMed] [Google Scholar]
- 30.Zhu J, Zhang X, Gao W, Hu H, Wang X, Hao D. lncRNA/circRNA-miRNA-mRNA ceRNA network in lumbar intervertebral disc degeneration. Mol Med Rep. 2019;20:3160–3174. doi: 10.3892/mmr.2019.10569. [DOI] [PMC free article] [PubMed] [Google Scholar]
- 31.Wu P, Liang J, Yu F, Zhou Z, Tang J, Li K. miR-145 promotes osteosarcoma growth by reducing expression of the transcription factor friend leukemia virus integration 1. Oncotarget. 2016;7:42241–42251. doi: 10.18632/oncotarget.9948. [DOI] [PMC free article] [PubMed] [Google Scholar]
- 32.Wang Y, Hu L, Zheng Y, Guo L. HMGA1 in cancer: cancer classification by location. J Cell Mol Med. 2019;23:2293–2302. doi: 10.1111/jcmm.14082. [DOI] [PMC free article] [PubMed] [Google Scholar]
- 33.De Martino M, Forzati F, Arra C, Fusco A, Esposito F. HMGA1-pseudogenes and cancer. Oncotarget. 2016;7:28724–28735. doi: 10.18632/oncotarget.7427. [DOI] [PMC free article] [PubMed] [Google Scholar]
- 34.Zhang R, Tao F, Ruan S, Hu M, Hu Y, Fang Z, Mei L, Gong C. The TGFbeta1-FOXM1-HMGA1-TGFbeta1 positive feedback loop increases the cisplatin resistance of non-small cell lung cancer by inducing G6PD expression. Am J Transl Res. 2019;11:6860–6876. [PMC free article] [PubMed] [Google Scholar]
- 35.Jun KH, Jung JH, Choi HJ, Shin EY, Chin HM. HMGA1/HMGA2 protein expression and prognostic implications in gastric cancer. Int J Surg. 2015;24:39–44. doi: 10.1016/j.ijsu.2015.10.031. [DOI] [PubMed] [Google Scholar]
- 36.Yang Q, Wang X, Tang C, Chen X, He J. H19 promotes the migration and invasion of colon cancer by sponging miR-138 to upregulate the expression of HMGA1. Int J Oncol. 2017;50:1801–1809. doi: 10.3892/ijo.2017.3941. [DOI] [PubMed] [Google Scholar]
- 37.Han X, Cao Y, Wang K, Zhu G. HMGA1 facilitates tumor progression through regulating Wnt/beta-catenin pathway in endometrial cancer. Biomed Pharmacother. 2016;82:312–318. doi: 10.1016/j.biopha.2016.05.004. [DOI] [PubMed] [Google Scholar]
- 38.Ren J, Yang M, Xu F, Chen J. microRNA-758 inhibits the malignant phenotype of osteosarcoma cells by directly targeting HMGA1 and deactivating the Wnt/beta-catenin pathway. Am J Cancer Res. 2019;9:36–52. [PMC free article] [PubMed] [Google Scholar]
- 39.Pan W, Pang J, Ji B, Wang Z, Liu C, Cheng Y, Zhang L. RNA binding protein HuR promotes osteosarcoma cell progression via suppressing the miR-142-3p/HMGA1 axis. Oncol Lett. 2018;16:1475–1482. doi: 10.3892/ol.2018.8855. [DOI] [PMC free article] [PubMed] [Google Scholar]
- 40.Singla A, Wang J, Yang R, Geller DS, Loeb DM, Hoang BH. Wnt signaling in osteosarcoma. Adv Exp Med Biol. 2020;1258:125–139. doi: 10.1007/978-3-030-43085-6_8. [DOI] [PubMed] [Google Scholar]
- 41.Huang W, Zheng X, Yang X, Fan S. Stimulation of osteogenic differentiation by Saikosaponin-A in bone marrow stromal cells via WNT/beta-catenin pathway. Calcif Tissue Int. 2017;100:392–401. doi: 10.1007/s00223-017-0242-y. [DOI] [PubMed] [Google Scholar]