

Abstract
Objective: The purpose of this study was to compare the differences in imaging features between patients with pulmonary tuberculosis (TB) alone and patients with TB complicated with lung cancer (LCA) as well as to investigate the diagnostic value of CT in these two groups. Methods: In this retrospective study, 110 patients with confirmed TB admitted to the Second Affiliated Hospital of Hainan Medical University from March 2020 to April 2021 were collected and divided into TB+LCA group (50 cases, diagnosed with TB complicated with lung cancer) and TB group (60 cases, diagnosed with TB alone) according to actual diagnosis. The CT results of both groups were analyzed by the same group of physicians in a double-blind manner. The diagnostic value of CT for TB alone and TB complicated with lung cancer was calculated. The differences in CT imaging characteristics between the two groups were investigated. The differences in the structural characteristics of para-cancerous tissue between the two groups were analyzed. Results: The diagnostic accuracy of CT was 91.67% in TB patients (55/60) and 92.00% in TB+LCA patients (46/50) without significant difference (X2 =0.004, P=0.949). The detection rate of spiculation, lobulation and cavitation in TB+LCA group was significantly higher than that in TB group (P<0.05), and the distribution, size and wall thickness of cavitation varied significantly between the two groups (P<0.05). Patients in TB group had higher percentage of mediastinal lymph node calcification, peripheral satellite lesion, and mediastinal lymph node enlargement around the TB lesions compared with those in TB+LCA group (P<0.05). Conclusion: CT has certain application value in differentiating TB alone from TB complicated with lung cancer, and there are many similarities in the imaging features of the two conditions. CT can be considered as a preliminary means of differential diagnosis of TB complicated with lung cancer, which is helpful to the primary screening diagnosis of lung cancer.
Keywords: Pulmonary tuberculosis, pulmonary tuberculosis complicated with lung cancer, CT diagnosis, imaging features, difference analysis
Introduction
With the continuous acceleration of industrialization process, environmental pollution has become increasingly prominent, which, together with the changes of lifestyle and dietary structure of residents, has led to an increasing incidence of respiratory diseases [1]. In recent years, the incidence and mortality rate of lung cancer have been increasing year by year in China, which has become a crucial factor threatening the life and health of residents [2,3]. Tuberculosis (TB) is a chronic infectious disease caused by Mycobacterium tuberculosis that can also invade other organs and cause dysfunction in addition to invading the lungs and causing tuberculosis infection [4]. Low-grade fever, night sweats, emaciation, weakness, chest pain, and hemoptysis are typical symptoms of TB, and some patients with advanced TB may also develop pleural indentation or mediastinal shift due to pulmonary fibrosis [5]. According to the survey, there were about 9 million TB cases in 2013, of which the number of deaths reached about 1.5 million, and the number of TB in China was about 1 million cases, of which about 40,000 patients died, ranking the second worldwide.
Studies have shown that the bronchial mucosa of patients with TB is in a state of chronic inflammatory irritation, which increases the likelihood of cancer in the epithelial cells of adjacent tissues [6]. In addition, the immunity of TB patients is significantly reduced during the treatment process, which makes them more susceptible to external factors and increases the risk of lung cancer [7]. Data show that in recent years, TB complicated with lung cancer is also increasing year by year, and the incidence of TB complicated with lung cancer is about 2.7% in general population and 15% in population over 60 years old [8]. CT is a common imaging tool for TB. Due to the similarity between TB and lung cancer in terms of clinical manifestations and imaging features, coupled with the limited experience of some physicians in charge of diagnosis, the misdiagnosis rate of TB complicated with lung cancer is high, which has a great impact on the effects of clinical intervention. In a study of patients with suspected TB complicated with lung cancer, it was found that, under the double-blind review, most physicians were unable to distinguish the CT features of TB complicated with lung cancer from TB alone [9]. It has also been found that patients with lung cancer are in a reduced immune system, and after being infected by Mycobacterium tuberculosis, it is easy to induce active TB, leading to the deterioration and excretion of TB, and the imaging manifestations of the process are similar to those of TB, which is more difficult in the differential diagnosis [10,11]. To improve the performance of CT in differentiating pulmonary TB and TB complicated with lung cancer, this study was designed to compare the similarities and differences in terms of imaging features of these two conditions, so as to provide clinical reference for improving the diagnostic accuracy of patients with TB complicated with lung cancer.
Materials and methods
Baseline data
In this retrospective study, 110 patients with confirmed TB admitted to the Second Affiliated Hospital of Hainan Medical University from March 2020 to April 2021 were collected and divided into TB+LCA group (50 cases, diagnosed with TB complicated with lung cancer, including 20 cases of squamous cell carcinoma of lung and 30 cases of adenocarcinoma of lung) and TB group (60 cases, diagnosed with TB alone) according to actual diagnosis. This study was approved by the Ethics Committee of the Second Affiliated Hospital of Hainan Medical University (approval number NCT01258635). All research subjects and their families were informed and signed a fully-informed consent form.
Inclusion criteria
(1) patients diagnosed with TB or TB complicated with lung cancer by sputum culture and pathological examination; (2) patients underwent CT scan before diagnosis; (3) patients with complete baseline data; (4) patients with clinical manifestations of TB.
Exclusion criteria
(1) patients with inactive TB; (2) patients combined with nonsolid nodules; (3) patients with lymph node metastasis or distant metastasis; (4) patients with incomplete clinical data; and (5) those with complicated atelectasis.
CT detection method
CT detection was performed in both groups using a SIEMENS SOMATOM Definition Flash CT scanner (Aquilion; Siemens Medical Systems, Munich, Germany) with the following parameter settings: voltage 120-125 kV, current 200-250 mA, matrix 512×512, slice thickness 2.5-10 mm, with interval length and pitch setting to 10 mm and 1.0 mm, respectively, reconstruction slice thickness setting to 7 mm, mediastinal window setting to 100 HU and 40 HU, and the lung window setting to 1400 HU and -450 HU.
The patients were instructed to hold their breath before the test and were scanned from the tip of the lung to the angle of the rib diaphragm. A thin 2 mm layer scan was performed for some unclear area or areas of interest, and an enhanced scan was performed if the results were unclear, namely, an injection of 60-100 mL of iohexol from the patient’s superficial vein at the elbow at a rate of 2.5-3.0 mL per second. The test results were evaluated by two experienced imaging physicians using a double-blind method, and the support of a third physician or a medical institution was sought in case of disagreement to form a unified opinion.
Outcome measurement
(1) The diagnostic value of CT for TB alone and TB complicated with lung cancer was calculated using sputum culture results and pathological results (the applied bacterial culture box was purchased from Beijing Biopike Technology Co., Ltd.) as gold standards, respectively; (2) The differences in CT results (spiculation, lobulation, vacuole sign, and cavitation) of TB alone and TB complicated with lung cancer were compared; (3) The characteristics of tissue structures adjacent to the lesions were compared between the two groups.
Statistical analysis
SPSS22.0 statistical software was used to analyze the data, in which the measurement data were expressed as mean ± standard deviation and were tested for normal distribution and homogeneity of variance. T-test was used for the difference between groups conforming to normal distribution and homogeneity of variance. Enumeration data were expressed as n (%), and chi-square test was used for the difference of enumeration data between groups. When P<0.05, the difference was considered statistically significant. The Graphpad Prism 8.3 was used for figure plotting.
Results
Comparison of general data between the two groups
In TB+LCA group, there were 18 males and 32 females with a mean age of 57.29±10.22 years (ranged from 32-76 years), including 24 cases with a history of smoking. The history of TB in TB+LCA group was about 1-19 years and the history of lung cancer was about 5 months - 4 years. There were 20 cases of squamous cell carcinoma of lung and 30 cases of adenocarcinoma of lung, among them, 4 cases were of concomitant hypertension and 2 cases of concomitant diabetes.
In TB group, there were 40 males and 20 females with a mean age of 57.43±9.29 years (ranged from 30-75 years), including 20 cases with a history of smoking. The patients in TB group had a history of tuberculosis of 1-20 years. There were 5 cases of concomitant hypertension and 1 case of concomitant diabetes.
Patients in both groups presented cough, sputum, chest tightness, chest pain, and emaciation.
The diagnostic value of CT for TB alone and TB complicated with lung cancer
The diagnostic accuracy of CT in TB patients was 91.67% (55/60), while 2 of the remaining 5 patients were misdiagnosed as TB+LCA and 3 had unclear CT signs that were not detected by CT, resulting in a missed diagnosis rate of 5.00% (3/60). The diagnostic accuracy of CT in TB+LCA patients was 92.00% (46/50), while the remaining 4 patients were misdiagnosed as TB, with a misdiagnosis rate of 8.00% (4/50). There was no statistically significant difference between the groups in the diagnostic accuracy of CT for TB and TB+LCA (X2 =0.004, P=0.949) (Table 1).
Table 1.
Comparison of the diagnostic value of CT for TB alone and TB+LCA
| Diagnosis results | n | Accuracy case of CT diagnosis | Accuracy rate of CT diagnosis | Diagnostic error | |
|---|---|---|---|---|---|
|
| |||||
| Misdiagnosis | Missed diagnosis | ||||
| TB | 60 | 55 | 91.67% | 2 | 3 |
| TB+LCA | 50 | 46 | 92.00% | 4 | 0 |
| χ2 | - | - | 0.004 | 1.152 | 3.093 |
| P | - | - | 0.949 | 0.283 | 0.079 |
Differences in CT features between TB alone and TB complicated with lung cancer
The detection rates of spiculation, lobulation and cavitation in TB+LCA group were significantly higher than those in TB group (P<0.05) (Table 2 and Figure 1). The cavitation in TB group was mostly located in the middle lobe or the lingual lobe of the lung, whereas that in TB+LCA group was mostly located in the lower lobe of the lung, with statistically significant differences between the two groups (P<0.05). There were also significant differences between the two groups in the size and wall thickness of the TB cavity (P<0.05) (Table 3 and Figure 2).
Table 2.
Differential comparison of CT signs between TB alone and TB complicated with lung cancer [n (%)]
| CT imaging signs | TB+LCA group (n=50) | TB group (n=60) | χ2 | P |
|---|---|---|---|---|
| Spiculation | 45 (90.00) | 29 (48.33) | 21.506 | <0.001 |
| Lobulation | 40 (80.00) | 24 (40.00) | 17.935 | <0.001 |
| Pleural indentation | 36 (72.00) | 40 (66.67) | 0.363 | 0.547 |
| Pulmonary atelectasis | 41 (82.00) | 45 (75.00) | 0.783 | 0.376 |
| Cavitation | 42 (84.00) | 40 (66.67) | 4.318 | 0.038 |
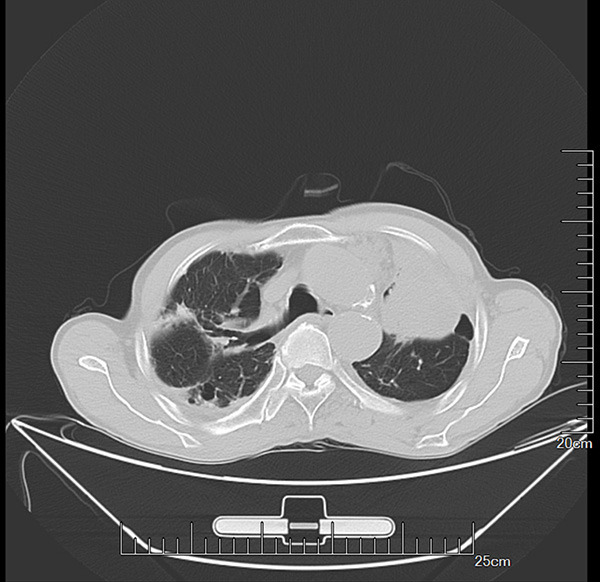
Figure 1.

CT imaging findings of patients with pulmonary tuberculosis alone and pulmonary tuberculosis complicated with lung cancer. (A) Pulmonary tuberculosis alone; (B) Pulmonary tuberculosis complicated with lung cancer. The cavitation was more pronounced in patients with pulmonary tuberculosis complicated with lung cancer (black arrow in B) than in patients with pulmonary tuberculosis alone (black arrow in A). The adhesions were more pronounced in patients with pulmonary tuberculosis complicated with lung cancer (red arrow in B) than in patients with pulmonary tuberculosis alone (red arrow in A). Black arrows indicate the cavitation, and red arrows indicate the adhesions.
Table 3.
Comparison of cavitation between the two groups (χ±sd)/n (%)
| General condition of cavitation | Patients with cavitation in TB+LCA group (n=42) | Patients with cavitation in TB group (n=40) | χ2 | P | |
|---|---|---|---|---|---|
| Location | Middle lobe of the lung | 7 (16.67) | 12 (30.00) | 14.339 | <0.001 |
| Pulmonary lingual lobe | 9 (21.43) | 20 (50.00) | |||
| Lower lobe of lung | 26 (61.90) | 8 (20.00) | |||
| Cavity wall thickness | ≤3 mm | 7 (16.67) | 36 (90.00) | 44.177 | <0.001 |
| >3 mm | 35 (83.33) | 4 (10.00) | |||
| Pulmonary tuberculosis cavity size (mm) | 40.11±5.59 | 28.39±4.20 | 10.693 | <0.001 | |
Figure 2.

Comparison of cavitation between pulmonary tuberculosis alone and pulmonary tuberculosis complicated with lung cancer. (A) Pulmonary tuberculosis alone; (B) Pulmonary tuberculosis complicated with lung cancer. In the TB group (red arrow in A), the cavities were mostly located in the middle lobe or lingula of the lung, while in the TB+LCA group, the cavities were mostly located in the lower lobe of lung (red arrow in B). Red arrows indicate the cavities.
Comparison of the structural characteristics of the tissue adjacent to the lesions
Patients in TB+LCA group had more pleural adhesions and pleural indentation around the cancerous tissues, while patients in TB group had more mediastinal lymph node calcification, peripheral satellite lesion, and mediastinal lymph node enlargement around the TB lesions. There were statistically significant differences between the two groups in terms of mediastinal lymph node enlargement, mediastinal lymph node calcification and peripheral satellite lesions (P<0.05) (Table 4).
Table 4.
Comparison of structural characteristics of the tissue adjacent to the lesion between the two groups [n (%)]
| CT imaging signs | TB+LCA group (n=50) | TB group (n=60) | χ2 | P |
|---|---|---|---|---|
| Inflammation | 35 (70.00) | 36 (60.00) | 1.192 | 0.275 |
| Pleural adhesions | 39 (78.00) | 43 (71.67) | 0.577 | 0.448 |
| Mediastinal lymph node enlargement | 3 (6.00) | 15 (25.00) | 7.194 | 0.007 |
| Mediastinal lymph node calcification | 4 (8.00) | 40 (66.67) | 39.111 | <0.001 |
| Peripheral satellite foci | 5 (10.00) | 35 (58.33) | 27.533 | <0.001 |
| Pleural indentation | 36 (72.00) | 40 (66.67) | 0.363 | 0.547 |
Case analysis of misdiagnosed or missed patients
The CT images of missed patients in TB group were analyzed, and it was found that the imaging manifestations such as cavitation signs and lung scarring were not typical, which might be attributed to the fact that the patients with missed diagnosis were in the early stage of TB infection, leading to less obvious imaging manifestations (Figure 3). In addition, the misdiagnosed patients in the TB group typically presented with more severe TB and developed tumor-like lesions of the lung such as vacuole sign and severe adhesions, leading to the misdiagnosis as TB+LCA (Figure 4). The CT images of misdiagnosed patients in TB+LCA group were analyzed, and it was found that there were certain changes in the CT images of such patients, which might be related to the distortion of the reception signal at the site of the lesion. Meanwhile, the misdiagnosed patients had lower pathological staging, and the typical manifestations of lung cancer such as enlarged lymph nodes, enlarged hilum, bronchial obstruction and bone destruction were not present in patients, which might be the main reason for the misdiagnosis (Figure 5).
Figure 3.

Typical images of missed patients in TB group. The patients were in the early stage of TB, with less obvious CT signs, and were confirmed as TB by pathogen detection.
Figure 4.
Typical images of patients misdiagnosed as TB+LCA in TB group. The patients were in the late stage of TB and were misdiagnosed as TB+LCA through CT examination. The reason may be related to the serious TB condition in such patients and the imaging manifestations similar to lung cancer.
Figure 5.

Typical images of patients misdiagnosed as TB in TB+LCA group. The patients were diagnosed as TB+LCA by pathological examination, but the CT image did not show the typical manifestations of lung cancer such as enlarged hilum, bronchial obstruction and bone destruction, leading to the misdiagnosis as TB.
Discussion
Patients with TB and lung cancer are clinically recommended to receive early diagnosis and intervention to improve the prognosis [12,13]. Data show that the number of patients with TB complicated with lung cancer has increased year by year. The reasons may be related to the fact that persistent TB lesions lead to pulmonary fibrosis, scarring, and bronchial mucosal proliferation, inducing lung cancer [14,15]. Imaging examination is a crucial means to distinguish TB from lung cancer [16]. TB and lung cancer are similar in terms of imaging performance, resulting in high misdiagnosis rate. Especially in some medical institutions that cannot perform pathological tests, misdiagnoses and inappropriate treatment opinions may affect the subsequent treatment. Therefore, it is of great significance to explore the differences of imaging results between patients with TB alone and TB with concurrent lung cancer for guiding the work of primary care institutions [17-19].
In this study, a comparative analysis of 50 patients with TB complicated with lung cancer and 60 patients with TB alone revealed that the diagnostic accuracy of CT for TB alone and TB complicated with lung cancer were basically similar. To investigate the imaging differences between patients with TB alone and those with TB complicated with lung cancer, the study further analyzed the specific manifestations such as spiculation, lobulation, pleural indentation, pulmonary atelectasis and cavitation of the two diseases. The results showed that the detection rates in patients with TB complicated with lung cancer were significantly higher than those in patients with TB alone, which was similar to the results of other studies [20]. In a controlled study of 60 patients with TB alone and 54 patients with TB complicated with lung cancer, the symptoms of spiculation and lobulation accounted for 62.96% and 72.22%, respectively in patients with TB complicated with lung cancer, which were significantly higher than 28.33% and 36.67% in patients with TB alone [21]. Another study of 31 patients with lung cancer combined with TB and 31 patients with TB alone found that the percentage of spiculation and lobulation in patients with lung cancer combined with TB was 90.32% and 80.65%, respectively, which was higher than 54.84% and 45.16% in patients with TB alone [22]. It was found that the data of the above studies differed from our results. The reasons may be related to differences in the stage of lung cancer and the location of lesions in the included patients. However, the research of the above-mentioned scholars as well as the present study has verified the feasibility of CT examination in the diagnosis and treatment of TB and lung cancer patients complicated with TB. The analysis provided new ideas and references for the diagnosis and treatment of TB complicated with lung cancer, avoiding the limitation of traditional pathological detection. On the one hand, it shortens the detection time, and on the other hand, it improves the repeatability of detection. Furthermore, it also helps to promote the diagnosis and treatment of TB complicated with lung cancer in primary medical institutions.
In order to investigate the factors affecting the imaging signs of TB, this study explored the differences of imaging signs between the two groups, and the results showed that sex, spiculation, lobulation, pleural indentation, pulmonary atelectasis and cavitation affected the CT signs. This study concluded that the results can be used for preliminary screening of the risk level of lung cancer combined with TB in clinical practice. For example, female TB patients with spiculation and lobulation should be evaluated on the risk of concurrent lung cancer, and pathological or laboratory index tests should be performed to improve the diagnostic accuracy [23]. Furthermore, the structural characteristics of the tissues adjacent to the lesions were compared between the two groups, exhibiting statistically significant differences between the two groups in terms of inflammatory changes, mediastinal lymph node enlargement, mediastinal lymph node calcification, peripheral satellite lesions and pleural indentation. This study concluded that the results were related to the fact that lung cancer is more aggressive, the tissues surrounding lung cancer are more likely to be invaded due to tissue adhesions, and the normal shape of the pleura would be affected due to excessive proliferation of lesions [24], all of which provide new ideas for differential diagnosis of TB complicated with lung cancer.
Finally, CT images of patients with missed diagnosis/misdiagnosis in TB group and TB+LCA group were screened, focusing on why the above phenomenon occurred. It was found that patients misdiagnosed as TB+LCA in the TB group had typical tumor-like lesions of the lung such as vacuole sign and severe adhesions on CT images, leading to the misdiagnosis, and the missed patients in the TB group were mostly in the early stage of the disease with mild TB, with no obvious imaging manifestations. In TB+LCA group, the patients misdiagnosed as TB did not show the typical manifestations of lung cancer such as enlarged hilum, bronchial obstruction and bone destruction, leading to the misdiagnosis as TB. No missed diagnosis occurred in TB+LCA group due to significant lung lesions and high CT detection rate in such patients.
The innovation of this study is that CT detection was used as an entry point to analyze in detail the differences in imaging features between patients with pulmonary tuberculosis and patients with TB complicated with lung cancer, providing new ideas and initiatives for the clinical syndrome differentiation. Overall, there are some similarities between the CT features of patients with TB alone and those with TB complicated with lung cancer, and it is difficult to differentiate them. The authors in this study believe that the two can be distinguished from each other from the aspects of vacuole sign, spiculation and lobulation, especially spiculation, which is a pathological manifestation caused by the invasion and stretching of the lung scaffold around the tumor, and has a high value of identification.
The deficiencies of this study are as follows: (1) the correlation between pathological features of lung cancer and CT features was not analyzed. In other words, patients with lung cancer complicated with TB still lack specific indications in CT findings. CT examination can be used as an auxiliary detection method for the differentiation of lung cancer in patients with suspected TB, providing certain determination support for subsequent laboratory testing and pathological examination. (2) Differentiation of CT signs in patients with TB complicated with lung cancer may require profound experience of imaging physicians, and some imaging physicians with less experience may have difficulty in distinguishing the difference of CT signs between TB alone and TB complicated with lung cancer. (3) This study should include larger numbers and more sources of patients to improve the reliability of the data.
In conclusion, CT has a good application value in distinguishing TB alone from TB complicated with lung cancer, and there are large differences in the imaging features of the two conditions, which can be considered as a differential tool for the primary screening diagnosis of lung cancer in clinical application.
Disclosure of conflict of interest
None.
References
- 1.Acuña-Villaorduña C, Jones-López EC, Fregona G, Marques-Rodrigues P, Gaeddert M, Geadas C, Hadad DJ, White LF, Pereira Dutra Molina L, Vinhas S, Ribeiro-Rodrigues R, Salgame P, Palaci M, Alland D, Ellner JJ, Dietze R. Intensity of exposure to pulmonary tuberculosis determines risk of tuberculosis infection and disease. Eur Respir J. 2018;51:1701578. doi: 10.1183/13993003.01578-2017. [DOI] [PMC free article] [PubMed] [Google Scholar]
- 2.Sari NIP, Mertaniasih NM, Soedarsono , Maruyama F. Application of serial tests for Mycobacterium tuberculosis detection to active lung tuberculosis cases in Indonesia. BMC Res Notes. 2019;12:313. doi: 10.1186/s13104-019-4350-9. [DOI] [PMC free article] [PubMed] [Google Scholar]
- 3.Gong X, Li Y, Wang J, Wu G, Mohemaiti A, Wushouer Q, Yao L, Lv J, Li R, Li P, Wang B. Treatment adherence among sputum smear-positive pulmonary tuberculosis patients in Xinjiang, China: a prospective study. RSC Adv. 2018;8:8983–8989. doi: 10.1039/c7ra11820a. [DOI] [PMC free article] [PubMed] [Google Scholar]
- 4.de Almeida CPB, Ziegelmann PK, Couban R, Wang L, Busse JW, Silva DR. Predictors of in-hospital mortality among patients with pulmonary tuberculosis: a systematic review and meta-analysis. Sci Rep. 2018;8:7230. doi: 10.1038/s41598-018-25409-5. [DOI] [PMC free article] [PubMed] [Google Scholar]
- 5.Murthy SE, Chatterjee F, Crook A, Dawson R, Mendel C, Murphy ME, Murray SR, Nunn AJ, Phillips PPJ, Singh KP, McHugh TD, Gillespie SH REMoxTB Consortium. Pretreatment chest x-ray severity and its relation to bacterial burden in smear positive pulmonary tuberculosis. BMC Med. 2018;16:73. doi: 10.1186/s12916-018-1053-3. [DOI] [PMC free article] [PubMed] [Google Scholar]
- 6.Nakiyingi L, Nakanwagi P, Briggs J, Agaba T, Mubiru F, Mugenyi M, Ssengooba W, Joloba ML, Manabe YC. Performance of loop-mediated isothermal amplification assay in the diagnosis of pulmonary tuberculosis in a high prevalence TB/HIV rural setting in Uganda. BMC Infect Dis. 2018;18:87. doi: 10.1186/s12879-018-2992-1. [DOI] [PMC free article] [PubMed] [Google Scholar]
- 7.Atif M, Anwar Z, Fatima RK, Malik I, Asghar S, Scahill S. Analysis of tuberculosis treatment outcomes among pulmonary tuberculosis patients in Bahawalpur, Pakistan. BMC Res Notes. 2018;11:370. doi: 10.1186/s13104-018-3473-8. [DOI] [PMC free article] [PubMed] [Google Scholar]
- 8.Pizzol D, Veronese N, Marotta C, Di Gennaro F, Moiane J, Chhaganlal K, Monno L, Putoto G, Mazzucco W, Saracino A. Predictors of therapy failure in newly diagnosed pulmonary tuberculosis cases in Beira, Mozambique. BMC Res Notes. 2018;11:99. doi: 10.1186/s13104-018-3209-9. [DOI] [PMC free article] [PubMed] [Google Scholar]
- 9.Veesa KS, John KR, Moonan PK, Kaliappan SP, Manjunath K, Sagili KD, Ravichandra C, Menon PA, Dolla C, Luke N, Munshi K, George K, Minz S. Diagnostic pathways and direct medical costs incurred by new adult pulmonary tuberculosis patients prior to anti-tuberculosis treatment - Tamil Nadu, India. PLoS One. 2018;13:e0191591. doi: 10.1371/journal.pone.0191591. [DOI] [PMC free article] [PubMed] [Google Scholar]
- 10.Kweza PF, Van Schalkwyk C, Abraham N, Uys M, Claassens MM, Medina-Marino A. Estimating the magnitude of pulmonary tuberculosis patients missed by primary health care clinics in South Africa. Int J Tuberc Lung Dis. 2018;22:264–272. doi: 10.5588/ijtld.17.0491. [DOI] [PubMed] [Google Scholar]
- 11.Sieiro TLA, Aurílio RB, Soares ECC, Chiang SS, Sant Anna CC. The role of the Xpert MTB/RIF assay among adolescents suspected of pulmonary tuberculosis in Rio de Janeiro, Brazil. Rev Soc Bras Med Trop. 2018;51:234–236. doi: 10.1590/0037-8682-0298-2017. [DOI] [PubMed] [Google Scholar]
- 12.Liu YH, Gao WW, Li L, Du J, Ma Y, Shu W, Lyu XY, Xie SH, Wang HH, Chen T. The effectiveness of individualized treatment regimen on smear-positive retreatment pulmonary tuberculosis with mono- and poly-drug resistance. Zhonghua Jie He He Hu Xi Za Zhi. 2018;41:25–31. doi: 10.3760/cma.j.issn.1001-0939.2018.01.008. [DOI] [PubMed] [Google Scholar]
- 13.Ye M, Bian LF. Association of serum leptin levels and pulmonary tuberculosis: a meta-analysis. J Thorac Dis. 2018;10:1027–1036. doi: 10.21037/jtd.2018.01.70. [DOI] [PMC free article] [PubMed] [Google Scholar]
- 14.Giacomelli IL, Schuhmacher Neto R, Marchiori E, Pereira M, Hochhegger B. Chest X-ray and chest CT findings in patients diagnosed with pulmonary tuberculosis following solid organ transplantation: a systematic review. J Bras Pneumol. 2018;44:161–166. doi: 10.1590/S1806-37562017000000459. [DOI] [PMC free article] [PubMed] [Google Scholar]
- 15.Beyanga M, Kidenya BR, Gerwing-Adima L, Ochodo E, Mshana SE, Kasang C. Investigation of household contacts of pulmonary tuberculosis patients increases case detection in Mwanza City, Tanzania. BMC Infect Dis. 2018;18:110. doi: 10.1186/s12879-018-3036-6. [DOI] [PMC free article] [PubMed] [Google Scholar]
- 16.Chattopadhya D, Baveja U. High Incidence of pulmonary tuberculosis in ART naive remunerated blood donors with human immunodeficiency virus type-1 infection: possible role of iron overload. J Biosci Med (Irvine) 2018;06:62–82. [Google Scholar]
- 17.Onyoh EF, Kuaban C, Lin HH. Pre-treatment loss to follow-up of pulmonary tuberculosis patients in two regions of Cameroon. Int J Tuberc Lung Dis. 2018;22:378–384. doi: 10.5588/ijtld.17.0676. [DOI] [PubMed] [Google Scholar]
- 18.Richterman A, Steer-Massaro J, Jarolimova J, Luong Nguyen LB, Werdenberg J, Ivers LC. Cash interventions to improve clinical outcomes for pulmonary tuberculosis: systematic review and meta-analysis. Bull World Health Organ. 2018;96:471–483. doi: 10.2471/BLT.18.208959. [DOI] [PMC free article] [PubMed] [Google Scholar]
- 19.Zhang Y, Zhu M, Wang L, Shi M, Deng H. Longitudinally extensive transverse myelitis with pulmonary tuberculosis: two case reports. Medicine (Baltimore) 2018;97:e9676. doi: 10.1097/MD.0000000000009676. [DOI] [PMC free article] [PubMed] [Google Scholar]
- 20.Rahman S, Salmah A, Dwinata I, Mallongi A. Risk prediction model of lung tuberculosis using spatial approach in the coastal area of Makassar city. Indian J Public Health Res Dev. 2019;10:1220. [Google Scholar]
- 21.Oluogun W, Adedokun K, Oyeniyi G, Eziyi A. Prostate tuberculosis: a rare complication of pulmonary tuberculosis with malignant features mimicking prostate cancer. Urol Sci. 2020;31:36–38. [Google Scholar]
- 22.Fiogbe AA, Agodokpessi G, Tessier JF, Affolabi D, Zannou DM, Adé G, Anagonou S, Raherison-Semjen C, Marcy O. Prevalence of lung function impairment in cured pulmonary tuberculosis patients in Cotonou, Benin. Int J Tuberc Lung Dis. 2019;23:195–202. doi: 10.5588/ijtld.18.0234. [DOI] [PubMed] [Google Scholar]
- 23.Lee J. Bronchial washing to diagnose smear-negative pulmonary tuberculosis. J Tuberc Res. 2019;07:143–147. [Google Scholar]
- 24.Harries AD, Schwoebel V, Monedero-Recuero I, Aung TK, Chadha S, Chiang CY, Conradie F, Dongo JP, Heldal E, Jensen P, Nyengele JPK, Koura KG, Kumar AMV, Lin Y, Mlilo N, Nakanwagi-Mukwaya A, Ncube RT, Nyinoburyo R, Oo NL, Patel LN, Piubello A, Rusen ID, Sanda T, Satyanarayana S, Syed I, Thu AS, Tonsing J, Trébucq A, Zamora V, Zishiri C, Hinderaker SG, Aït-Khaled N, Roggi A, Caminero Luna J, Graham SM, Dlodlo RA, Fujiwara PI. Challenges and opportunities to prevent tuberculosis in people living with HIV in low-income countries. Int J Tuberc Lung Dis. 2019;23:241–251. doi: 10.5588/ijtld.18.0207. [DOI] [PubMed] [Google Scholar]