

Abstract
Objective: We conducted an in-depth study of the immune system and ferroptosis to identify prognostic biomarkers and therapeutic targets for renal clear cell carcinoma. Methods: Immune ferroptosis-related differentially expressed genes (IFR-DEGs) were selected from The Cancer Genome Atlas (TCGA). A lasso-Cox risk scoring model was established; its prognostic value was determined using prognostic analysis and single multivariate Cox analysis. Model genes were subjected to subcellular fluorescence localization, mRNA and protein expression analyses, and single-cell RNA sequencing localization analysis. Risk score was analyzed using the immune score, immune infiltrating cell correlation, immune checkpoint, TIDE, and drug sensitivity. Results: A total of 103 IFR-DEGs were identified; a risk model comprising ACADSB, CHAC1, LURAP1L, and PLA2G6 was established. The survival curve, single multivariate Cox regression, and receiver operating characteristic (ROC) curve analysis showed that the model had good predictive ability (p < 0.05). It was also validated using the validation set and total cohort. Subcellular fluorescence localization revealed that ACADSB, CHAC1, and PLA2G6 were distributed in the cytoplasm and LURAP1L in the nucleus. The mRNA and protein expression trends were consistent. Single-cell RNA sequencing mapping revealed that ACADSB was enriched in distal tubule cell clusters. In the Kidney renal clear cell carcinoma (KIRC) mutation correlation analysis, 1.56% of the patients were found to have genetic alterations; The Spearman correlation analysis of model gene mutations showed that ACADSB was positively correlated with LURAP1L, which may have a synergistic effect; it was negatively correlated with CHAC1 and PLA2G6, and CHAC1 was negatively correlated with LURAP1L, which may have an antagonistic effect. Model and immune correlation analyses found that high-risk patients had significantly higher levels of CD8+ T cells, regulatory T cells (Tregs), immune checkpoints, immune scores, and immune escape than those in low-risk patients. High-risk patients had a higher susceptibility to small-molecule drugs. Conclusion: A novel prognostic model of immune ferroptosis-related genes (ACADSB, CHAC1, LURAP1L, and PLA2G6), which plays an important role in immune infiltration, microenvironment, and immune escape, was constructed. It effectively predicts the survival of patients with KIRC.
Keywords: Immunity, ferroptosis, renal clear cell carcinoma, prognosis, biomarker
Introduction
Renal cell carcinoma (RCC), the most common type of kidney cancer, is believed to originate from renal epithelial cells, affecting over 400,000 people worldwide annually [1]. RCC is divided into three main histological subtypes: clear cell RCC (KIRC), papillary cell RCC (pRCC or KIRP), and chromophobe cell RCC (chRCC). KIRC is the most common pathological type of adult renal cell carcinoma and accounts for over 80% of all clinical cases [2]. Most local KIRC can be ablated by partial or radical nephrectomy [3] or active monitoring [4]. For advanced or metastatic kidney cancer, many new therapies have emerged over the past 20 years, including vascular endothelial growth factor inhibitors and tyrosine kinase inhibitors, many of which have achieved good results. The etiology of KIRC is complex; the tumor tissue is highly heterogeneous, and because the kidneys are located inside the body, many patients have no symptoms of kidney cancer even when it reaches an advanced stage [5]. At the time of diagnosis, 30% of patients are diagnosed with distant metastases [6]. Although local RCC can be cured by surgical resection, approximately 40% of surgical patients eventually relapse, which has led to only small improvements in KIRC outcomes over the past two decades [7]. The diagnosis and treatment of patients remains poor. Thus, the study of the mechanism of KIRC is of great significance to improve the prognosis of patients.
There is growing evidence that the immune system plays a role in cancer [8]. The tumor immune microenvironment (TIME) is a cellular immune ecosystem composed of immune cells, the extracellular matrix, fibroblasts, endothelial cells, and various cytokines, which are closely related to the occurrence and development of tumors [9,10]. For example, various immune cells, including CD8+ T cells, CD4+ T cells, and NK cells, have been associated with KIRC tumors [11]. In recent years, it has been found that the prognosis of renal clear cell carcinoma is not only related to the pathological stage, but also that the tumor immune status may have an important influence on the prognosis of patients [12]. In recent decades, with the development of immunotherapy, tumor therapy has undergone revolutionary changes, with immunotherapy considered a promising therapeutic field [13]. Researchers have found that the immune microenvironment can serve as an important prognostic indicator, which could also improve the potential for precision therapy [14]. The analysis of the immune microenvironment will help improve the response to immunotherapy, wherein an in-depth understanding of TIME is essential to identify potential immunotherapeutic targets for RCC. In a sense, all tumors are immunogenic. The host immune system generates a T-cell response that recognizes and kills cancer cells [15]. A large number of studies have shown that KIRC is highly immunogenic [16] and that the existence of immune detection points allows tumor immune escape [17]. Therefore, immune checkpoint blockade (ICB) is a novel therapeutic strategy that has been used in many cancer types [18-21]. The treatment of renal cell carcinoma has also made rapid progress. Summarily, with the successful application of immune checkpoint inhibitors (ICIs), tyrosine kinase inhibitors, and vascular endothelial growth factor targeting drugs, ICB plays an important role in the individualized and comprehensive treatment of patients with renal cell carcinoma, especially metastatic renal cell carcinoma [22].
Ferroptosis is a type of cell death characterized by iron-dependence and superoxide lipid accumulation, with genetic, biochemical, and morphological characteristics [23]. The dysfunction of the cellular antioxidant glutathione peroxidase 4 (GPX4) is known to contribute to the ferroptosis process. GPX4 synthesis depends on intracellular cystine transported by the xCT system [24]. The solute carrier family of seven members 11 (SLC7A11) constitutes a major component of the xCT system and can inhibit ferroptosis by promoting cysteine uptake. Increasing evidence shows that ferroptosis is closely related to various physiological and pathological states of the human body [24,25]. Ferroptosis is also closely related to the occurrence and development of tumors. Studies have shown that ferroptosis-related factors or pathways can regulate the sensitivity of tumor cells to ferroptosis by affecting iron metabolism, reactive oxygen species (ROS) synthesis, antioxidant systems, and other related mechanisms. This suggests that SLC7A11, which is overexpressed in a variety of cancers, can promote tumor progression by delaying ferroptosis, leading to metabolic reprogramming [26]. It has been reported that ferritin phagocytosis is mediated by interaction with surface arginine residues in ferritin heavy chain 1 (FTH1) [27,28]. Nuclear receptor coactivator 4 (NCOA4) overexpression induces ferroptosis by increasing the intracellular free iron content, glutathione production, and ROS levels [29]. As ferroptosis plays a key role in a variety of diseases, including kidney cancer, targeting ferroptosis may be a potential treatment strategy for patients with KIRC.
A close relationship exists between tumor immunity and ferroptosis [30,31]. Tumor-associated macrophages are the main source of iron for tumor growth and release large amounts of iron into the tumor microenvironment [32]. Many studies on the relationship between immunity and ferroptosis have provided a new understanding of the pathogenesis of renal clear cell carcinoma, and ferroptosis intervention can effectively improve immunosuppression [33,34]. Owing to the close relationship between immune and ferroptosis-related genes and tumors, the expression of immune ferroptosis-related genes in tumor tissues can be used to predict the prognosis of patients.
In this study, by analyzing the expression of the KIRC gene in the TCGA database and comparing it with the expression of genes related to immune ferroptosis at different levels, a prognostic model containing multiple genes was established, which can effectively predict the survival of patients with KIRC. By studying the relationship between the immune microenvironment and risk score, a potential mechanism was discussed and drug sensitivity was predicted, providing a basis for the clinical diagnosis and treatment of cancers, as well as a novel direction for the identification of therapeutic targets.
Materials and methods
Resources
The Cancer Genome Atlas (TCGA)
The TCGA database (https://portal.gdc.cancer.gov/) was used to download KIRC patient’s clinical data and gene transcription information. The RNA-seq and clinical data of 539 patients with KIRC in the HT-SEQ-FPKM dataset were included in this study after excluding nine patients without clinical follow-up information. The clinical data included the extraction of clinical data with Perl software, where the row name was the gene name and the column name contained the matrix of the age, sex, survival time, survival status, grade, stage, and TNM stage information of the KIRC patients. RNA-seq raw data were normalized in UNITS transcripts per million (TPM) for subsequent analysis. TPM was used as an expression measure because it is considered to be more comparable between samples than Fregments Per Kilobase per Million (FPKM) and transcripts per million mapped readings. After extracting the transcribed data with Perl, the matrix under the ensemble ID and the row name as the sample name was obtained. ID transformation was performed to obtain the matrix including sample name, gene name, and gene expression level information. The TCGA cohort information is summarized in Table 1.
Table 1.
Baseline information of TCGA
| variable | layered | TCGA |
|---|---|---|
| Age (%) | 65 or less | 348 (65.7%) |
| > 65 | 182 (34.3%) | |
| Gender (%) | women | 189 (35.6%) |
| men | 341 (64.3%) | |
| Stage (%) | Stage I | 266 (50.1%) |
| Stage II | 56 (10.5%) | |
| Stage III | 125 (23.5%) | |
| Stage IV | 83 (15.6%) | |
| Grade (%) | G1 | 15 (2.8 %) |
| G2 | 229 (43.2%) | |
| G3 | 208 (39.2%) | |
| G4 | 78 (14.7%) |
Acquisition of genes related to immunity and ferroptosis
By integrating data from the literature [35], ferroptosis databases (the FerrDb database (http://www.datjar.com:40013/bt2104/#), and immune-related databases (genes data from the ImmPort database (https://immport.org/shared/home) and GeneCards database (www.genecards.org)), 398 genes related to ferroptosis and 17,500 immune-related gene sets were obtained.
Research design
The datasets used in this study are all accessible and downloadable from TCGA. Based on the genomic data from TCGA, a prognostic model of immune ferroptosis risk was established for four genes. Based on the median risk score, the samples were divided into high- and low-risk groups, and the clinical characteristics, immune microenvironment, drug treatment response, and prognosis between the two groups were subsequently analyzed.
Determination of differentially expressed genes (DEGs) related to the prognosis of immune ferroptosis
The “limma” package in R was used to determine the TCGA DEGs between tumor tissues and normal tissues (false discovery rate (FDR) < 0.05 and |log2 fold-change (FC)| > 1). Screening genes IFR-DEG that overlapped with immunity and ferroptosis by univariate Cox analysis, IFR-DEG and prognostic genes were intersected to obtain IFR-DEGs associated with the prognosis of immune ferroptosis.
Prognostic model construction and validation
Lasso-Cox regression analysis was used to identify the genes used to construct the model. Using survival and GLMNET (a software package that fits generalized linear and similar models by penalty maximum likelihood fit), the regularization path computes the lasso or elastic net penalty on the value (on a logarithmic scale) of the regularization parameter lambda. The algorithm is very fast and can take advantage of sparsity in the input matrix X. It is suitable for linear, logistic, polynomial, Poisson, and Cox regression models. Multi-response linear regression, customized generalized linear model, and relaxation lasso regression model can also be fitted. The best value of the penalty coefficient λ was selected and the genes included in the model were determined by running the 10-fold cross validation possibility 1,000 times. The prognosis model of renal clear cell carcinoma was established according to the following conditions: risk score = ∑ (Expi × β i), where “Exp” is model gene expression level and β is the model gene coefficient. The model was constructed by dividing the median risk score of patients with renal clear cell carcinoma from the TCGA database. All patients with renal clear cell carcinoma were classified as high-risk or low-risk, and KIRC in TCGA was randomly divided into training and verification sets at a ratio of 1:1.
Principal component analysis (PCA) and T-distributed stochastic neighbor embedding (t-SNE) analysis
PCA and t-SNE were applied to the high- and low-risk groups, respectively, according to the risk prognosis model. t-SNE for dimensionality reduction, which is convenient for visualization, was used to demonstrate the model’s ability to enable facile visual distinction between samples.
Prognostic model evaluation and survival analysis
By using the formula to derive the median value of the risk score, enrolled KIRC patients could be divided into high- and low-risk groups. Kaplan-Meier curves of the two risk groups were drawn using the “survival” package in R software. Risk score distribution, risk status, and risk heat map were used to evaluate the risk of predictive models. The receiver operating characteristic (ROC) curve of 1-year, 3-year, and 5-year overall survival (OS) rate of KIRC patients was drawn using the “survival” and “survival ROC” packages in R [36]. The area under the curve (AUC) values of 1-year, 3-year, and 5-year overall survival were also calculated to evaluate the sensitivity and specificity of the model. In addition, univariate and multivariate Cox regression analyses were performed on the prognostic models in combination with clinical information, such as age, sex, T, N, and M pathological stages, to verify whether the model scores could be independent predictors.
Construction and evaluation of the line chart
The independent prognostic factors identified were comprehensively analyzed using the RMS package in R [37], as well as for the estimation of the 1-, 3-, and 5-year survival of KIRC patients. The calibration curve of the line graph was plotted using the nomogramEx software package to evaluate the agreement between the predicted and observed values.
Enrichment analysis of functional pathways
According to the high- and low-risk groups between DEGs (|log2FC| ≥ 1, FDR < 0.05), the “clusterProfiler” package in R [38], Gene Ontology (GO), Kyoto Encyclopedia of Genes and Genomes, KEGG Enrichment Analysis, and Gene Set Enrichment Analysis (GSEA) were performed [38].
Protein level verification and immunofluorescence localization
Immunohistochemical images were based on TCGA database and the Human Protein Atlas (HPA) database [38]. The protein expression profiles of the Clinical Proteomic Tumor Analysis Consortium were used to detect prognostic model genes at cellular level by immunofluorescence localization and protein level verification.
ACADSB RNA sequencing expression measured at the single-cell level
To evaluate the expression of ferroptosis marker genes in different cell types, we obtained single-cell sequencing data from the PanglaoDB database, a user-friendly single-cell sequencing database that allows users to query and explore cell types, genetic pathways, and community-engineered markers based on single-cell clusters [39]. We applied the “sample” module to retrieve the data set in PanglaoDB. Renal tissue was selected (SRA640325; SRS2769051) for single-cell analysis.
TF-miRNA coregulatory network
The database of RegNetwork [40] (www.networkanalyst.ca/) can collect TF-miRNA co-regulation, which can help to detect miRNA of related genes regulated by post-transcription and transcription level and regulate TF. The TF-miRNA collaborative regulation network was visually processed by NetworkAnalyst. NetworkAnalyst allows researchers to easily view a large amount of data, so as to determine the biological characteristics and functions that cause biological effects [41].
cBioPortal
CBioPortal is a comprehensive database for KIRC (http://www.cbioportal.org/) gene mutation analysis, including amplification, mutations, and copy number variation. It also provides an overview of multi-gene genetic changes, visualization, and analysis of multi-dimensional cancer genomic data. Data is based on TCGA database. P < 0.05 was considered statistically significant.
Correlation analysis between risk score and tumor immune microenvironment
Infiltrating stromal cells and immune cells are important components of tumor tissue cells and play a key role in cancer biology. Two bioinformatics algorithms were used to assess immune cell infiltration in renal clear cell carcinoma tissues based on transcriptome sequencing data. Normalized enrichment score (NES) was used to quantify the relative abundance of each immune cell type in the tumor microenvironment of a single sample [42]. The algorithm can identify specific gene signals associated with stromal and immune cell infiltration in tumor tissues, predict the level of stromal and immune cell infiltration, and infer tumor purity by calculating stromal and immune scores through single-sample gene set enrichment analysis (ssGSEA).
The CIBERSORT algorithm is another common tumor immune microenvironment analysis method (https://cibersort.stanford.edu/about.php) [43]. This algorithm uses linear support vector regression to select genes from the feature matrix for deconvolution and can accurately quantify the relative levels of different immune cell types based on gene transcriptome data.
Immunotherapy and drug reactivity
The tumor immune dysfunction and exclusion (TIDE) tool (http://tide.dfci.harvard.edu/) was used to calculate the TIDE score for every tumor sample as a substitution parameter that predicted the immune response to treatment. Thereafter, the R package “pRRophetic” was applied [44] (version 0.5), depending on the Genomics of Drug Sensitivity in Cancer (GDSC), (https://www.cancerrxgene.org/), through ridge regression and 10-fold cross-validation estimation half inhibitory concentration (IC50) of each sample for drug sensitivity prediction. Differences in drug sensitivity between the high- and low-risk groups were subsequently assessed using the Wilcoxon rank-sum test between the two groups, including for cisplatin, etoposide, docetaxel, gefitinib, erlotinib, gemcitabine, and paclitaxel.
Statistical analysis
Statistical analysis was performed using R (version 3.6.3). Differences between subgroups were analyzed using the Mann-Whitney test, and P-values were corrected by the Benjamini and Hochberg methods to obtain the FDR. The survival difference between the two groups was analyzed by Kaplan-Meier curve and log-rank test. Gene correlation was analyzed using Pearson’s correlation coefficient test. Spearman correlation coefficient test was used to analyze the correlation between risk score and immune cells and immune regulatory genes. Univariate and multivariate Cox regression analyses were performed to determine the model’s risk score as an independent prognostic factor. P < 0.05 was considered statistically significant.
Results
A total of 530 patients with pathologically confirmed KIRC from TCGA cohort were included in this study and randomly divided equally into two groups: 265 patients were included in the training set and 265 patients were included in the validation set.
Determination of DEGs related to prognosis of immune-ferroptosis
According to the gene expression data of TCGA patients, 6,534 differential genes were obtained through differential analysis, and volcano maps were drawn according to the level of differential expression (Figure 1A). Genes related to immunity and ferroptosis were intersected using a Venn diagram (Figure 1B), yielding 103 intersected genes. Univariate Cox analysis was performed on genes related to immunity and ferroptosis. According to statistical significance (P < 0.05), 52 genes related to immunity and ferroptosis were obtained, from which forest maps were created: 23 low-risk genes and 29 high-risk genes were found (Figure 1C).
Figure 1.
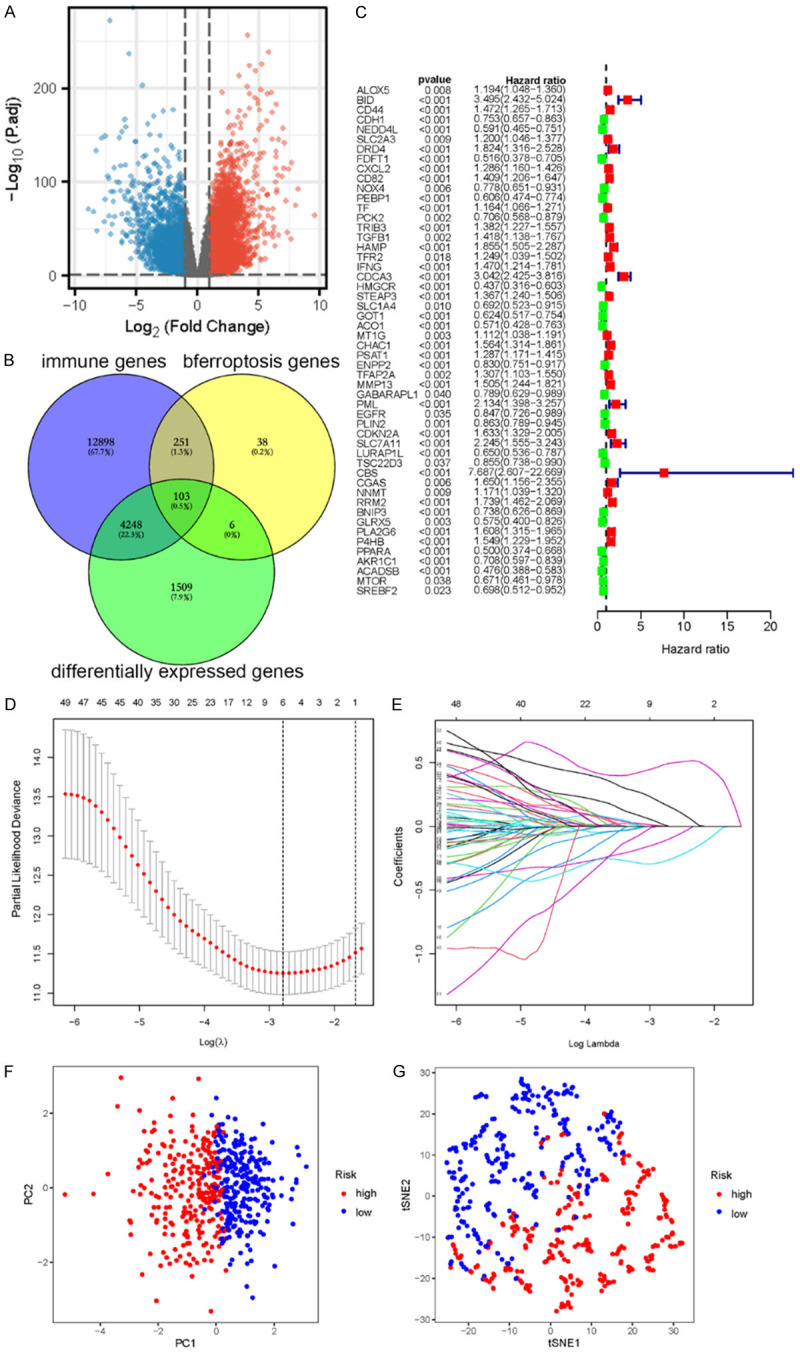
A. Volcano map of the differential genes. B. Intersection genes among the immune-related genes, ferroptosis related genes, and differential expression genes. C. Forest map of prognostic gene differences in survival in patients with renal clear cell carcinoma. “HR < 1” indicates low risk, denoted in green; “HR > 1” indicates high risk, denoted in red. Low-risk genes are good for patient prognosis, whereas high-risk genes are bad for prognosis. D. Cross validation diagram. E. LASSO coefficients of prognostic genes. F. PCA diagram of TCGA. G. t-SNE diagram of TCGA. PCA, Principal component analysis; t-SNE, T-distributed stochastic neighbor embedding; TCGA, The Cancer Genome Atlas.
Construction of an immune-ferroptosis gene marker prognostic model (IFRSig)
Lasso-Cox regression was performed on prognostic genes using the GLNMET package in R to screen for the best prognostic genes. The Cox multivariate regression analysis coefficients of the prognostic genes were extracted (Figure 1D and 1E). Risk scores were calculated based on gene expression levels using the following formula: Risk score= ∑ (Expi × β i), where “Expi” denotes the gene expression level and β i represents the Cox risk ratio coefficient of genes. The risk score of this model was calculated as follows:
-0.578*ACADSB+0.287*CHAC1-0.397*LURAP1L+0.447*PLA2G6.
According to the median risk score of TCGA cohort, the patients were divided into a high-risk group and low-risk group, then randomly divided into training set, validation set, and cohort at a ratio of 1:1 for verification.
To intuitively analyze the high- and low-risk groups, we adopted PCA and t-SNE methods, in which data dimensionality is reduced to a two-dimensional plane, according to the dangerous degree of the median value of PCA and t-SNE image processing. According to the visualization images, most patients could be divided into high- and low-risk groups, and only a minority of patients could not be classified. This indicates that the model had a high sensitivity (Figure 1F and 1G).
Validation of prognostic models
In the training set, high-risk patients had significantly lower survival rates than that of low-risk patients (Figure 2A, 2D). This result was confirmed in the validation set and cohort (Figure 2B-F). Heat maps were constructed to show the expression levels of the four prognostic genes in the high- and low-risk groups in the three cohorts (Figure 2G-I).
Figure 2.

Risk score of KIRC patients calculated according to the model and division of high- and low-risk groups, survival status, and four gene expression heat maps, Kaplan-Meier survival curves, and subject operating characteristic curves of patients with overall survival (OS) at 1, 3, and 5 years. (A, D, G, J, K for training set; B, E, H, L, M for validation set; C, F, I, N, O for TCGA cohort). KIRC, clear cell carcinoma of kidney; TCGA, The Cancer Genome Atlas.
Further survival analysis showed that the OS of high-risk patients in the training set was significantly lower than that in the low-risk group (Figure 2J, P < 0.001), which was confirmed by the validation set and cohort (Figure 2L and 2N, P < 0.001). The predictive ability of the risk score on OS was evaluated using time-dependent ROC curve analysis. The results showed that the AUC of the training set cohort were 0.802 (1 year), 0.746 (3 years), and 0.752 (5 years) (Figure 2K), while the AUC of the verification set cohort were 0.696 (1 year), 0.699 (3 years), and 0.726 (5 years) (Figure 2M). The AUC of TCGA cohort was 0.750 (1 year), 0.726 (3 years), and 0.736 (5 years) (Figure 2O), suggesting that the model had good predictive ability.
Independent prognostic analysis of risk scores
To verify whether the risk score was independent of other prognostic factors, univariate and multivariate Cox proportional risk regression analyses were performed in the training set, validation set, and cohort, respectively. Univariate and multivariate Cox regression analyses were performed for age, sex, tumor stage, grade, and risk score, as shown in Figure 3. The risk score and tumor stage of the training set, validation set, and total TCGA cohort were found to be significantly associated with OS, suggesting that tumor stage and risk score were independent predictors of OS (training set: HR = 1.313, 95% CI: 1.154-1.493, P < 0.001; validation set: HR = 1.178, 95% CI: 1.065-1.303, P < 0.001); total TCGA cohort: HR = 1.229, 95% CI: 1.140-1.326, P < 0.001).
Figure 3.

Univariate Cox regression analysis of prognostic index validation of genes associated with immune ferroptosis (A, C, E). Multivariate Cox regression analysis (B, D, F). Training set (A, B); validation set (C, D); TCGA cohort (E, F). Construction and validation of a column diagram (G, H). (G) Survival nomogram based on the TCGA cohort. (H) Calibration curves to predict 1-, 3-, and 5-year survival for KIRC patients in the TCGA cohort. KIRC, clear cell carcinoma of kidney; TCGA, The Cancer Genome Atlas.
Construction of the prediction column chart
To predict the survival probability of patients with KIRC, a 1-, 3-, and 5-year nomograph were established in the cohort based on the prediction model (risk score) and clinical factors (T, N, and M) (Figure 3G). According to the scoring results of each factor, the total value of the line graph can be obtained from the sum of the single scores of each factor associated with the overall score, which was used to estimate patient survival at 1, 3, and 5 years. The calibration curve was used to evaluate the predictive power of the prognostic model of the nomograph. The calibration curve was approximately 45 degrees, acting as the base line (Figure 3H), thereby indicating good consistency between the actual and expected survival rates of the model.
The high-risk group was closely associated with poor prognosis in patients with KIRC
To further evaluate the predictive power of the model, we re-assigned age, gender, G1-2, G3-4, T1-2, T3-4, M0, M1, N0, N1-3, Stage I-II, and Stage III-IV as prognostic and clinicopathological factors in KIRC patients in the TCGA cohort according to different conditions. In multiple clinical subgroups, age ≤ 65 (P < 0.001), age > 65 (P = 0.001), female (P < 0.001), male (P = 0.007), T1-2 (P = 0.009), T3-4 (P < 0.001), M0 (P < 0.001), M1 (P = 0.008), N0 (P < 0.001), N1-3 (P = 0.866), Stage I-II (P = 0.016), and Stage III-IV (P < 0.001) were indicative of the relationship between a high-risk score and prognosis. We found that the Kaplan-Meier survival analysis and survival rate of each subgroup showed that regardless of age and gender and TM Stage and Stage, the survival time of patients in the low-risk prognostic model group was significantly prolonged, except that the high-risk prognostic curve in the N1-3 subgroup was insignificant. This suggests that the prognostic model has good predictive power in most subclinical subgroups (Figure 4).
Figure 4.

Kaplan-Meier survival curve comparing the survival of risk prediction models in KIRC. A-L. OS curves of age, sex, G1-2, G3-4, T1-2, T3-4, M0, M1, N0, N1-3, Stage I-II, and Stage III-IV of KIRC patients in the high- and low-risk groups. KIRC, clear cell carcinoma of kidney; OS, overall survival.
Enrichment analysis of functional pathways of DEGs
To elucidate why the model differentiated high- and low-risk patients with KIRC, the gene enrichment in high- and low-risk patients with KIRC was further compared. Using GO analysis, the differential genes were found to be enriched in biological process (BP), cell component (CC), and molecular function (MF) (Figure 5A, Table 2). Differential genes were mainly enriched in complement activation (classical pathway) and complement activation of humoral immune response mediated by circulating immunoglobulins. Differential genes were mainly enriched in immunoglobulin complex, circulating immunoglobulin complex, blood particles, and other functions. In MF, the differential genes were mainly enriched in antigen binding, immunoglobulin receptor binding, chemokine activity, and other functions. In KEGG enrichment analysis, the differential genes were enriched in viral protein and cytokine and cytokine receptor interaction, cytokine-cytokine receptor interaction, PPAR signaling pathway, and other pathways. In GSEA analysis (Figure 5B), the high-risk group showed abundant gene enrichment in diseases, immune system, innate immune system, hemostasis, and infectious diseases (P < 0.05). These results indicate that these functions and pathways were closely related to the development of KIRC.
Figure 5.

A. Bubbles of functional enrichment analysis in the high- and low-risk groups of the TCGA cohort. B. GSEA analysis results diagram. BP, biological process; CC, cell composition; MF, molecular function. C. Clinically relevant heat maps created using clinicopathological data from patients based on the risk characteristics associated with prognosis. The higher the intensity of red, the higher the level of expression. The higher the intensity of blue, the lower the expression (*P < 0.05, **P < 0.01, and ***P < 0.001). TCGA, The Cancer Genome Atlas; GSEA, Gene Set Enrichment Analysis.
Table 2.
Functional enrichment analysis of high and low risk groups in the TCGA cohort
| ONTOLOGY | ID | Description | Gene Ratio | Bg Ratio | p-value | p.adjust | q-value |
|---|---|---|---|---|---|---|---|
| BP | GO:0006958 | complement activation, classical pathway | 42/152 | 137/18670 | 7.04 e-56 | 1.64 e-52 | 1.43 e-52 |
| BP | GO:0002455 | humoral immune response mediated by circulating immunoglobulin | 42/152 | 150/18670 | 5.81 e-54 | 6.76 e-51 | 5.90 e-51 |
| BP | GO:0006956 | complement activation | 42/152 | 175/18670 | 8.80 e-51 | 6.83 e-48 | 5.96 e-48 |
| BP | GO:0072376 | protein activation cascade | 42/152 | 198/18670 | 2.70 e-48 | 1.57 e-45 | 1.37 e-45 |
| BP | GO:0016064 | immunoglobulin mediated immune response | 43/152 | 218/18670 | 5.32 e-48 | 2.48 e-45 | 2.16 e-45 |
| CC | GO:0019814 | immunoglobulin complex | 50/158 | 159/19717 | 1.00 e-67 | 1.57 e-65 | 1.50 e-65 |
| CC | GO:0042571 | immunoglobulin complex, circulating | 27/158 | 72/19717 | 8.58 e-39 | 6.73 e-37 | 6.41 e-37 |
| CC | GO:0072562 | blood microparticle | 21/158 | 147/19717 | 1.48 e-20 | 7.73 e-19 | 7.36 e-19 |
| CC | GO:0009897 | external side of plasma membrane | 29/158 | 393/19717 | 7.06 e-20 | 2.77 e-18 | 2.64 e-18 |
| CC | GO:0034364 | high-density lipoprotein particle | 4/158 | 26/19717 | 5.17 e-05 | 0.002 | 0.002 |
| MF | GO:0003823 | antigen binding | 42/133 | 160/17697 | 1.76 e-54 | 4.76 e-52 | 4.20 e-52 |
| MF | GO:0034987 | immunoglobulin receptor binding | 26/133 | 76/17697 | 5.08 e-37 | 6.86 e-35 | 6.04 e-35 |
| MF | GO:0008009 | chemokine activity | 5/133 | 49/17697 | 3.25 e-05 | 0.003 | 0.003 |
| MF | GO:0042379 | chemokine receptor binding | 5/133 | 66/17697 | 1.38 e-04 | 0.008 | 0.007 |
| MF | GO:0015926 | glucosidase activity | 3/133 | 14/17697 | 1.42 e-04 | 0.008 | 0.007 |
| KEGG | hsa04061 | Viral protein interaction with cytokine and cytokine receptor | 8/57 | 100/8076 | 4.17 e-07 | 5.76 e-05 | 5.19 e-05 |
| KEGG | hsa04060 | Cytokine-cytokine receptor interaction | 9/57 | 295/8076 | 1.97 e-04 | 0.010 | 0.009 |
| KEGG | hsa03320 | PPAR signaling pathway | 5/57 | 78/8076 | 2.09 e-04 | 0.010 | 0.009 |
| KEGG | hsa05323 | Rheumatoid arthritis | 5/57 | 93/8076 | 4.74 e-04 | 0.016 | 0.015 |
| KEGG | hsa04978 | Mineral absorption | 4/57 | 59/8076 | 7.61 e-04 | 0.021 | 0.019 |
Clinically relevant heat map
To observe the expression of prognostic model genes in clinical features, we constructed an expression heat map based on the correlation of clinical features to observe the expression relationship between the prognostic model genes in high- and low-risk groups, as well as patient age, sex, metastasis, tumor stage, grade, and immune score (Figure 5C).
Expression and immunofluorescence localization of model genes in KIRC
According to the median value of gene expression in the prognostic model, patients with TCGA renal clear cell carcinoma data were divided into high- and low-expression groups. The mRNA expression levels of ACADSB and CHAC1 in renal clear cell carcinoma tissues were significantly lower than those in normal tissues (Figure 6A, 6B). The mRNA expression levels of LURAP1L and PLA2G6 were significantly higher than those in the normal tissues (Figure 6C, 6D). To investigate the subcellular localization of ACADSB, CHAC1, LURAP1L, and PLA2G6 in cancer cells, we used the HPA database to evaluate the distribution of ACADSB, CHAC1, LURAP1L, and PLA2G6 in renal tissue. As shown in Figure 6E-H ACADSB and CHAC1 were mainly distributed in the mitochondria of U-2OS cells, whereas LURAP1L was mainly distributed in the nucleoli of A-431 cells. PLA2G6 was mainly distributed in the cytoplasm of the central line satellite of U-2OS cells.
Figure 6.
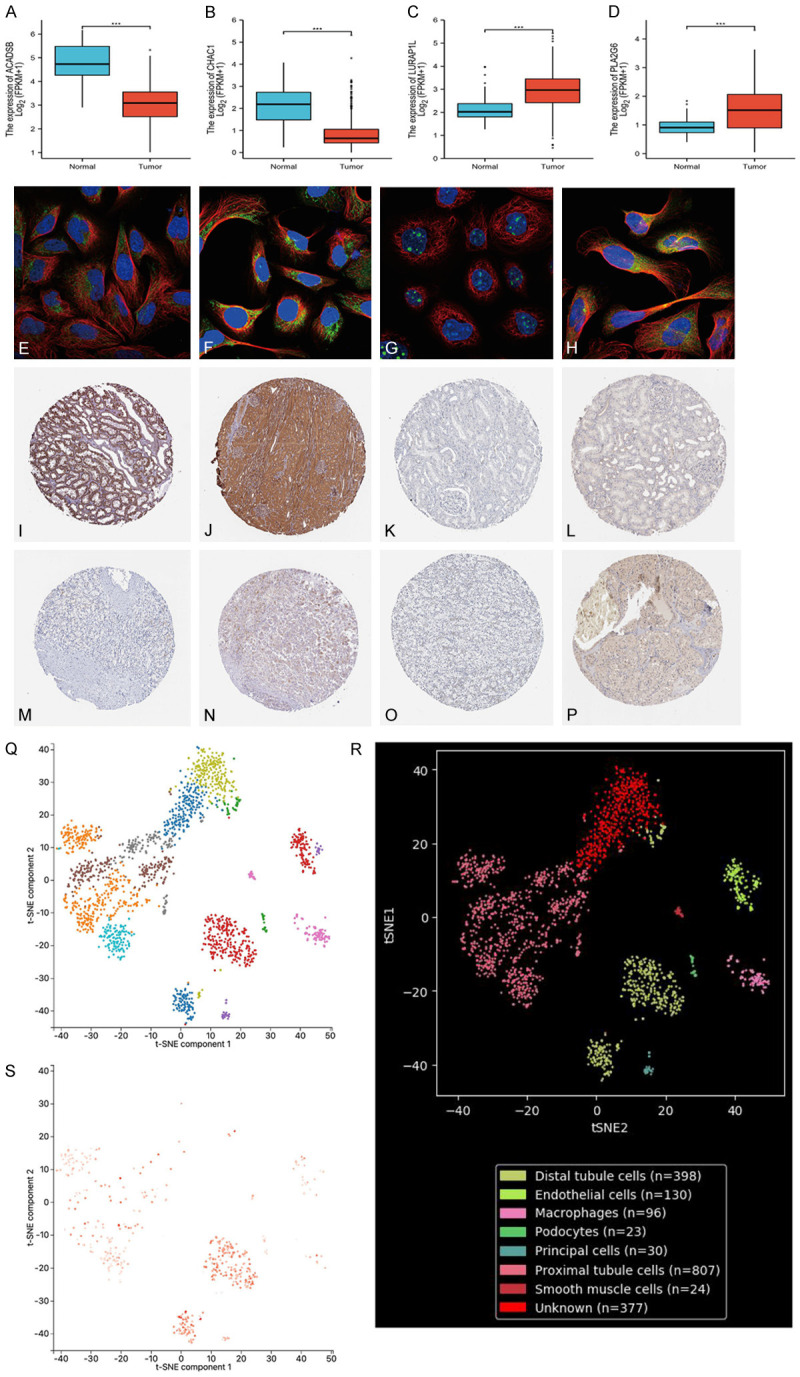
(A-D) Expression of ACADSB, CHAC1, LURAP1L, and PLA2G6 in tumor and normal tissues in the TCGA renal clear cell carcinoma dataset. (E-H) Subcellular localization of ACADSB, CHAC1, LURAP1L, and PLA2G6 in cells, with blue representing the nucleus, red representing microtubules, and green representing antibodies. (I-P) Protein expression levels of ACADSB (I: normal tissue, M: tumor tissue), CHAC1 (J: normal tissue, N: tumor tissue), LURAP1L (K: normal tissue, O: tumor tissue), and PLA2G6 (L: normal tissue, P: tumor tissue). (Q-S) Localization analysis of ACADSB using single-cell RNA sequencing. (Q, R) Renal tissue cells were divided into eight cell clusters. (S) ACADSB was enriched in clusters of distal tubules. TCGA, The Cancer Genome Atlas.
In the TCGA-KIRC cohort, ACADSB and CHAC1 were low in renal clear cell carcinoma, whereas LURAP1L and PLA2G6 were higher in renal clear cell carcinoma than in adjacent non-tumor renal tissue. To confirm the expression of these four genes in clinical samples, we further validated the expression of proteins encoded by the four model genes using clinical samples from HPA. Immunohistochemical images of four gene signatures in normal kidney tissue and renal carcinoma are shown in Figure 6I-P.
Single-cell RNA sequencing localization analysis of the ACADSB gene
To evaluate the localization of model genes in single cells, we used the PanglaoDB dataset for single-cell RNA sequencing localization analysis; however, only ACADSB was found to be included in renal tissues. Therefore, we conducted ACADSB single-cell RNA sequence localization analysis. As shown in Figure 6Q and 6R, renal tissue cells were divided into eight cell clusters: distal tubule cells (P = 5.647E-14), endothelial cells (P = 1.14415E-19), macrophages (P = 1.38073E-10), podocytes (P = 5.62787E-05), main cells (P = 3.46711E-30), proximal tubule cells (P = 7.06537E-35), smooth muscle cells (P = 1.31683E-23), and unknown (P = 0.000803306). ACADSB was set as the superimposed expression of genes, and according to single-cell analysis, ACADSB was found to be enriched in clusters of distal tubule cells (Figure 6S). This suggests that a decreased expression of ACADSB in the distal tubules plays an important role in the carcinogenesis of KIRC.
Mutation and correlation analysis of four model genes
To evaluate the mutation of four model genes in KIRC, we used cBioPortal database for data analysis. A total of 1.56% (7/448) of the patients were found to have genetic changes. Genetic changes in ACADSB included depth loss and splicing mutation, whereas genetic changes in CHAC1 included deep deletions. Similarly, genetic changes in LURAP1L included non-frameshift mutation and missense mutation, whereas genetic changes in PLA2G6 included missense mutations (Figure 7A, 7B).
Figure 7.

Mutation and correlation analysis of four model genes in KIRC. A. Mutation frequency of model genes. C. Correlation between each of the two model genes. B. Mutations of each model gene in each sample. D. Analysis of tumor infiltrating cells in patients at high and low risk. Violin plot of the abundance of 22 immune cells in the risk group. The x-axis represents 22 types of immune cells, and the y-axis represents the relative abundance of immune cells. E-T. Relationship between risk score and immune cells. KIRC, clear cell carcinoma of kidney.
The Spearman correlation analysis of model gene mutations showed that ACADSB was positively correlated with LURAP1L, which may have a synergistic effect; it was negatively correlated with CHAC1 and PLA2G6, and CHAC1 was negatively correlated with LURAP1L, which may have an antagonistic effect (Figure 7C).
TF-miRNA coregulatory network
The TF-miRNA coregulatory network was generated using NetworkAnalyst. The analysis of the TF-miRNA coregulatory network delivers miRNAs and TFs interaction with the model genes. This interaction could be the reason for regulating the expression of the model genes. The network created for TF-miRNA coregulatory network comprised 66 nodes and 77 edges. Thirty-two miRNAs and 29 TF-genes have interacted with the model genes. The TF-miRNA coregulatory network is shown in Supplementary Figure 1.
Correlation between the model and immune cell infiltration
To better investigate the complex cross-talk between the prognostic model and immune characteristics, we evaluated the immune infiltrate profiles of 22 immune cells in clear renal cell carcinoma tissues between the high- and low-risk groups in the KIRC sample using the CIBERSORT algorithm (data visualized in a violin plot). The results showed that CD8+ T cells (P < 0.001), follicular helper T cells (P < 0.001), regulatory T cells (Tregs) (P < 0.001), activated NK cells (P = 0.011), and macrophage M0 (P = 0.01) were significantly increased in the high-risk group of KIRC patients. In contrast, monocytes (P < 0.001), macrophage M1 (P < 0.001), and macrophage M2 (P < 0.001) were significantly reduced in the high-risk group of KIRC patients (Figure 7D).
Correlation analysis between risk score and immune cell abundance
With regards to correlation between the risk score and immune cell abundance, Spearman correlation analysis showed that risk score was positively correlated with regulatory T cells (Tregs), macrophages M0, activated NK cells, plasma cells, CD8+ T cells, and follicular helper T cells (Figure 7E-T). Risk scores were negatively correlated with naive B cells, active dendritic cells, resting dendritic cells, eosinophils, macrophages M1, macrophages M2, monocytes, neutrophils, resting mast cells, and resting memory CD4+ T cells (Figure 7E-T).
Correlation of immune cells
The correlation of these 22 different immune cells was explored, and the results showed that Treg cells were positively correlated with CD8+ T cells and follicular helper T cells. CD8+ T cells were positively correlated with follicular helper T cells and T cells γδ. Naive B cells were positively correlated with plasma cell. Activated dendritic cells were positively correlated with eosinophils. Macrophage M2 cells were negatively correlated with CD8+ T cells and follicular helper T cells. The resting CD4 memory T cells were negatively correlated with CD8+ T cells and follicular helper T cells (Figure 8A).
Figure 8.

A. Correlation of different immune cells. Heat maps of correlations between 22 immune cells. Blue and red represent positive and negative correlations, respectively. B. Relationship between risk score and immune cell infiltration and related functions as analyzed by ssGSEA. The score refers to the immune score; the higher the score, the deeper the immune cell infiltration (*P < 0.05, **P < 0.01, and ***P < 0.001). C-H. Immune microenvironment and prognosis. KM survival analysis showed that Treg cells, CD4+ T memory cells, follicular helper T cells, monocytes, resting mast cells, and resting dendritic cells were significantly correlated with survival time. ssGSEA, single-sample gene set enrichment analysis.
Risk score and immune-related function
Based on ssGSEA, correlations between the risk scores and immune-related functions were determined, as shown in the boxplot in Figure 8B. As a result, the high-risk group was found to have better immune function in terms of immune checkpoint activity, cytolysis activity, proinflammatory activity, T cell co-inhibition, and type II interferon response.
Kaplan-Meier survival analysis of immune cells
Subsequently, Kaplan-Meier survival analysis of immune cells was performed. The results showed that Treg cells, CD4+ T memory cells, follicular helper T cells, monocytes, resting mast cells, and resting dendritic cells had a good predictive ability for OS (Figure 8C-H).
Immune microenvironment and immune escape
To explore the relationship between the tumor microenvironment (TME), we calculated TME scores and found that high-risk patients had higher immune scores and higher ESTIMATE scores than low-risk patients (Figure 9A-C). To assess the potential of risk scores as biomarkers for immunotherapy or chemotherapy, we used the TIDE online tool to predict responses to immunotherapy in different risk groups. The TIDE score was found to be negatively correlated with the efficacy of immunotherapy, and the results showed that TIDE score of high-risk patients significantly increased (P < 0.001) (Figure 9D-F), suggesting that the efficacy of immunotherapy in the high-risk group was less than that in the low-risk group.
Figure 9.
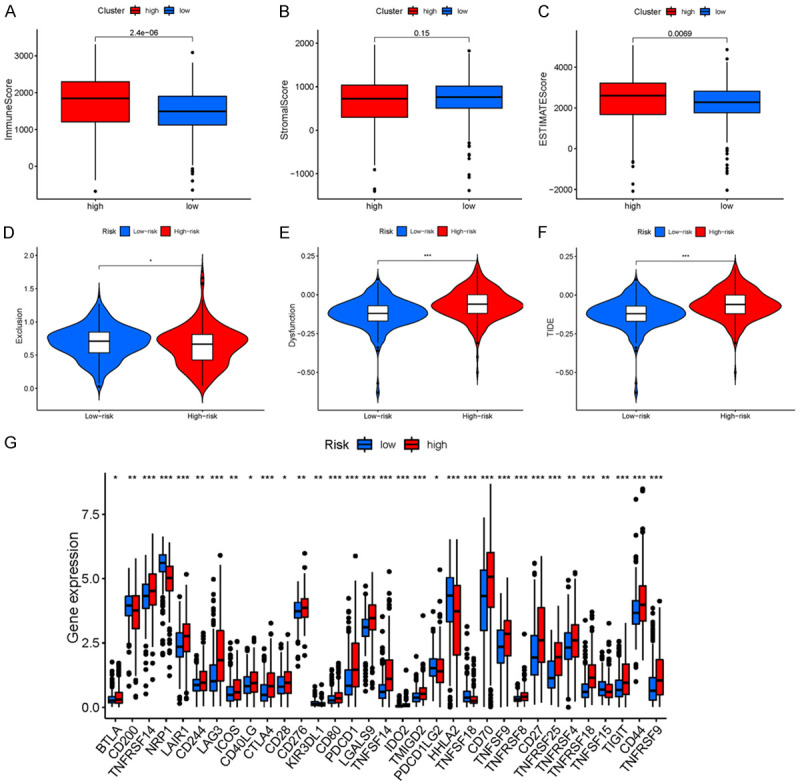
(A-F) Immune microenvironment and immune escape. (A) Immune score, (B) Stromal score, (C) ESTIMATE score, (D) Exclusion score, (E) Dysfunction score, and (F) TIDE score (*P < 0.05, **P < 0.01, and ***P < 0.001). (G) Expression of immune checkpoints between KIRC patients with two different risk groups. Expression of two immune checkpoints (e.g., CD274, CTLA4, LAG3, and PDCD1) in TCGA cohort. ANOVA was used to test for significance (*P < 0.05, **P < 0.01, ***P < 0.001). KIRC, clear cell carcinoma of kidney; TCGA, The Cancer Genome Atlas.
Immune checkpoints
Based on the importance of immunotherapy with checkpoint inhibitors, we further investigated the expression of immune checkpoints in both risk groups. The results showed that most immune checkpoints were more active in high-risk populations. The expression of immune checkpoints was significantly increased in high-risk patients. In particular, the expression of molecules, such as CD70, cytotoxic T lymphocyte-associated protein 4 (CTLA4), and PDCD1, were significantly elevated in the high-risk group (Figure 9G). These results suggest that the immune microenvironment in high-risk groups may be suppressed by the upregulation of immunosuppressive cytokines and immune checkpoints.
Small molecule drugs
Many small molecule drugs often elicit drug resistance during the process of cancer treatment, resulting in poor drug efficacy, leading to renal clear cell carcinoma and poorer clinical prognosis. To validate the use of drugs in different risk groups, we compared the median maximum inhibitory concentration (IC50), which can help quantify the therapeutic ability of drugs to induce cancer cell apoptosis, which is inversely proportional to the sensitivity of small molecule drugs. Using the pRRophetic algorithm, we calculated the chemotherapy effect of 12 common small molecule drugs (sunitinib, rapamycin, pyrimethamine, paclitaxel, lenalidomide, imatinib, gemcitabine, gefitinib, erlotinib, cytarabine, cisplatin, and bosutinib) on KIRC patients to evaluate the relationship between risk score and small molecule drug resistance based on IC50. As shown in Figure 10, the IC50 for imatinib, gemcitabine, erlotinib, and cisplatin (P < 0.001) was significantly higher in the high-risk group than in the low-risk group, suggesting that high-risk patients may not benefit from these drugs. Sunitinib, rapamycin, pyrimethamine, paclitaxel, lenalidomide, gefitinib, cytarabine, and bosutinib were significantly reduced in the high-risk group, indicating that these small molecule drugs may be more sensitive and have a greater impact on high-risk patients. These results indicate that the risk prognostic model could not only classify individuals into different risk groups, but also assist in the selection of small molecule drug treatments according to the corresponding sensitivity values of clinically observed KIRC patients.
Figure 10.

A-L. 50% maximum inhibitory concentrations (IC50) of 12 common small molecule drugs (sunitinib, rapamycin, pyrimethamine, paclitaxel, lenalidomide, imatinib, gemcitabine, gefitinib, erlotinib, cytarabine, cisplatin, and bosutinib).
Discussion
KIRC is the most common primary malignant tumor of adult renal carcinoma, affecting over 400,000 people worldwide each year [45]. As early clinical symptoms are difficult to identify, KIRC is typically diagnosed at the later stages of disease [45]. Previous studies have reported that KIRC is a hypermetabolic disease and that fetal tumors may underlie the development of renal cancer-related deaths [46]. TNM staging is a classic method for predicting KIRC prognosis based on clinical information; however, TNM staging does not take into account any genetic characteristics. Therefore, to provide personalized treatment, it is important to identify genetic characteristics and construct prognostic models to screen patients with different risks and outcomes.
In recent years, several studies have shown that immunotherapy can benefit patients with KIRC [47]. A number of published studies have described the role of immune cells in the host defense against cancer and infection [48]. There have also been studies on kidney cancer [49] immune-related characteristics involving a large number of specific cell types [50]. Immunity has proved to play a key role in the proliferation, differentiation, invasion, and metastasis of renal tumors through different pathways of tumor progression and pathogenesis [51-53].
Ferroptosis is also closely related to the prognosis of KIRC. Research has found that KIRC is sensitive to ferroptosis, and many studies have suggested the targeted activation of ferroptosis as a potential treatment for KIRC [54,55]. In recent years, several studies have reported that the regulation of ferroptosis-related genes can influence the course and prognosis of KIRC [56].
The role of immunity and ferroptosis in tumors is also very similar [30,31]. Recently, studies have shown that ferroptosis exhibits crosstalk with radiation therapy and the immune system, coupled with the metabolic vulnerability of tumor cells and sensitivity differences caused by different cell states [57-59]. Many studies on the relationship between ferroptosis and immunity have provided new insights into the pathogenesis of cancer [34,60], which can effectively improve immunosuppression [33,61]. Our group recently learned that immune ferroptosis-related genes are closely associated with cancer, and their expression levels vary at different cancer stages. However, few studies have linked the prognosis and treatment of KIRC to ferroptosis-related genes, and we hope to have illustrated this correlation through our analysis.
In this study, we performed a Venn diagram analysis based on the differential genes of renal clear cell carcinoma and the genes associated with immune ferroptosis in TCGA. We obtained 103 co-expressed immune-ferroptosis associated DEGs and established prognostic risk models following Lasso-Cox regression analysis to gain insights into the pathogenesis of KIRC, as well as establishing an effective tool for predicting treatment outcomes of KIRC with the aim of improving the treatment and prognosis of this disease. We also screened four immune-ferroptosis-related genes from 52 immune-ferroptosis-related prognostic genes and effectively divided KIRC patients into high- and low-risk groups based on the median risk score. Risk score is the dominant factor in prognostic risk models and nomograms. Our results were well correlated with clinical outcomes, suggesting that the model is a good predictor of risk factor.
By conducting high/low risk differential analysis and GO enrichment analysis, we found that risk differential genes were not only involved in complement activation (classical approach) and the complement activation of circulating immunoglobulin mediated humoral immune response, but also in antigen binding, immunoglobulin receptor binding, and chemokine activity, among other functions. The activity of chemokines plays an important role in the development and differentiation of immune cells in the immune microenvironment. At the same time, we performed GSEA analysis, which revealed enrichment in diseases, immune system, innate immune system, hemostasis, and infectious diseases. These findings confirm the role of differential genes in the development and progression of KIRC and validate the correlation of prognostic models with KIRC immune regulation.
Genes, such as CCDC134, play an important role in tumor progression [62]. Among these, STEAP1 [63] is expected to be a potential target for predicting the prognosis of different types of cancer. We further evaluated the expression of four prognostic genes by protein, subcellular localization, and single-cell analysis. As a result, the mRNA and protein expression levels of LURAP1L and PLA2G6 in renal carcinoma were found to be significantly higher than those in normal tissues, while the expression levels of ACADSB and CHAC1 were significantly lower than those in normal tissues. In subcellular localization analysis, ACADSB and CHAC1 were found to be mainly distributed in the mitochondria of U-2OS cells, while LURAP1L was mainly distributed in the nucleoli of A-431 cells. PLA2G6 was mainly distributed in the cytoplasm and the central line satellite of U-2OS cells. This provides a basis for subsequent research on the corresponding mechanism of action.
Four model genes play important roles in tumors and other diseases. For ACADSB, studies have found that the down-regulation of ACADSB may induce the growth of cancer cells through pathways such as fatty-acid catabolism, branched-chain amino acid catabolism and ferroptosis in ccRCC. ACADSB can affect colorectal cancer (CRC) cell migration, invasion, and proliferation by regulating CRC cell ferroptosis [64]. For CHAC1, dihydroartemisinin (DHA) may effectively induce ferroptosis in PLC cells (primary liver cancer) by up-regulating the expression of CHAC1 [65]. Moreover, CHAC1 has broad application prospects in breast cancer diagnosis and prognosis analysis [66]. Interestingly, previous studies have found that CHAC1 is an effective indicator of poor prognosis in clear cell renal cell carcinoma [67]. The ferroptosis-related gene LURAP1L has an important regulatory role for non-small cell lung cancer, oral squamous cell carcinoma, etc. [68,69]. Regarding the PLA2G6 gene, studies have found that knockdown of the ferroptosis-related protein PLA2G6 significantly inhibits melanoma cell proliferation and metastasis and promotes apoptosis [70]. Another study found that human trophoblasts are particularly sensitive to ferroptosis caused by the depletion or inhibition of GPX4 or the lipase PLA2G6 [71]. Moreover, PLA2G6 is closely related to neurological diseases [72-74].
The correlation of four genes still warrants further study. Regulatory biomolecules act as potential biomarkers in many complex diseases. Visual analysis of miRNA and TF gene activities is used to regulate model genes in TF-miRNA co-regulation network. In this study, 32 miRNA and 29 TF genes were found. In the TF with the most interaction, SP1 has a higher degree of 3. It has been found that the upregulation of lncRNA TUG1 mediated by SP1 emphasizes the carcinogenic characteristics of colorectal cancer [75]. Copy number amplification and SP1-activated lncRNA MELTF-AS1 regulates tumorigenesis by driving phase separation of YBX1 to activate ANXA8 in non-small cell lung cancer [76]. Overexpression of Sp1 is associated with the progression and poor prognosis of bladder urothelial carcinoma [77]. Additionally, hsa-miR-361-5p, as the hub miRNA of LURAP1L and ACADSB, is also worthy of further study. Some studies have found that miR-361-5p can pass through the cancer genome atlas as the breast cancer prognosis markers [78]. Another study found that miR-361-5p as a promising qrt-PCR internal control for tumor and normal breast tissues [79]. TF-genes are a reactor for regulating gene expression, which is regulated by binding with target genes and miRNA. It can also regulate gene expression by mRNA degradation [80]. These intriguing results present new questions for our next study on the mechanism of interactions between genes.
In the tumor microenvironment, cancer cells and immune cells exert a large number of chemokines and cytokines to regulate the pathogenesis and progression of tumor. In this study, we found a particularly significant increase in regulatory T cells. The powerful immunosuppressive microenvironment in cancer is a key challenge for cancer therapy. Tregs and tumor-associated macrophages can directly reduce the activity of T cells in the immune microenvironment, resulting in suppression of immune function. It can also affect the aggressiveness of tumors by affecting lactic acid metabolism. In this study, immune infiltration analysis found an increase in the number of infiltrating immune cells, such as CD8+ T in the high-risk group. However, this grouping was positively correlated with PD-1 expression. Therefore, although this gene can recruit immune cells into tumor tissue, the high expression of PD-1 inactivates T cells. Therefore, the high-risk group continued to exhibit an inhibitory effect on tumor immune response.
SsGSEA showed higher immune function in the high-risk group in terms of immune checkpoint, cytolysis activity, proinflammatory, T cell co-inhibition, and type II interferon response. Significant differences were observed among the different risk groups of KIRC patients. The combination of ferroptosis and ICI can synergistically promote anti-tumor activity, even in ICI resistance [81]. Owing to the importance of checkpoint inhibitor-based immunotherapy, our data showed significant differences in the expression of immune checkpoint-related genes between the two groups of KIRC patients, highlighting the potential significance of IFRSig in regulating ICI.
Some studies have confirmed that the TIDE algorithm can be used as a predictive model for immunotherapy [82]. The immune avoidance mechanisms adapted by renal clear cell carcinoma include the downregulation of antigen presentation or recognition, a lack of immune effector cells, the obstruction of anti-tumor immune cell maturation, an accumulation of immunosuppressive cells, the production of inhibitory cytokines, chemokines, or ligands/receptors, and the upregulation of immune checkpoint modulators. Together with altered metabolism and hypoxia conditions, these factors constitute the tumor microenvironment, suggesting that IFRSig in KIRC patients may be involved in immune escape.
Antibodies based on immune checkpoint inhibitors have been reported to improve survival in patients with a variety of cancers, including lung cancer, malignant melanoma, and bladder cancer [83]. High levels of CD80 help maintain tolerance and immunosuppression in epithelial ovarian cancer [84]. The tumor microenvironment induces CTLA4+ regulatory T cell migration through CC-motif chemokine ligand 22 (CCL22) and CC-motif chemokine receptor 4 (CCR4) [85,86]. CTLA4 immunotherapy in tumors [87] has shown good anticancer effects. Pd-l1 interacts with the corresponding receptors to inhibit the anti-tumor activity of immune cells and enable cancer cells to evade immune surveillance [88]. Drug-resistant tumor cells show an inhibition of immune-stimulating molecules and an increased expression of CD274 [89]. In this study, we further evaluated the expression levels of these immunosuppressive checkpoint inhibitors and found significant differences in CTLA4, PDCD1, CD276, CD70, and other immune checkpoints in the high- and low-risk groups. In particular, both CTLA4 and PDCD1 were upregulated in the high-risk group, suggesting that these immune checkpoints play an important immunosuppressive role in KIRC.
Finally, the differences observed in the survival time of KIRC patients in the high- and low-risk groups may also be due to their different sensitivities to chemotherapy drugs. Patients with clear cell carcinoma of the kidney usually survive longer after receiving drug chemotherapy, while patients who are insensitive to chemotherapy drugs should receive an alternative treatment in a timely manner. To improve the prognosis of patients, as well as in response to the fact that a lack of response to drugs has implications on clinical decision making, we analyzed the chemotherapy drug resistance and sensitivity as well as that of small drug molecules, to predict IFRSig potential to determine the efficacy of treatment.
Based on the four genes analyzed, diagnostic and prognostic kits for KIRC can be developed that provide potential comprehensive targets for future therapeutic interventions of KIRC. We believe that in the future, more prominent translational and clinical studies will be able to confirm the results observed in our work. Although our results provide new insights into the underlying mechanisms of immune ferroptosis that can predict the prognosis of KIRC, several limitations remain and further study is required. First, only samples from the TCGA cohort were used to build our model, and it will be necessary to use different groups and databases, such as the GEO database or multi-center cohort, to verify the accuracy of this model. Second, traceability data from a common database was used to build and validate the model. Prospective data to evaluate the clinical efficacy of KIRC are limited, and its molecular mechanism has not been determined. Therefore, further experiments and clinical data will be needed to validate the interaction between renal clear cell carcinoma and the expression of immune-ferroptosis genes.
Conclusion
In this study, genes associated with immune ferroptosis with independent prognostic value were identified through comprehensive bioinformatics analysis and used to establish a prognostic risk model. Significant correlations were observed between immune ferroptosis related genes and immune score, immune checkpoint, and small molecule drugs. From this, IFRSig was found to be an independent prognostic feature that may be able to estimate OS and clinical treatment response in patients with KIRC. Furthermore, ACADSB, CHAC1, LURAP1L, and PLA2G6 were identified as potential targets and effective prognostic biomarkers of immune-combined ferroptosis. Therefore, this study provides new perspectives on the role of immune ferroptosis genes in the development of KIRC. Taken together, the model developed in this study, IFRSig, is closely related to the prognosis of KIRC and can be used to better estimate OS and predict patient responses to the clinical treatment combined with immunological characteristics.
Acknowledgements
This study was supported by the Fujian Province Medical Innovation Foundation (2019-CXB-4, 2021-CXB001), Fujian Province Natural Science Key Fund Project (2021J02053, 2021J01704), and Special Funds for Education and Scientific Research in Fujian Province (No. [2021]848 #), China.
Disclosure of conflict of interest
None.
Supporting Information
References
- 1.Reustle A, Di Marco M, Meyerhoff C, Nelde A, Walz JS, Winter S, Kandabarau S, Buttner F, Haag M, Backert L, Kowalewski DJ, Rausch S, Hennenlotter J, Stuhler V, Scharpf M, Fend F, Stenzl A, Rammensee HG, Bedke J, Stevanovic S, Schwab M, Schaeffeler E. Integrative-omics and HLA-ligandomics analysis to identify novel drug targets for ccRCC immunotherapy. Genome Med. 2020;12:32. doi: 10.1186/s13073-020-00731-8. [DOI] [PMC free article] [PubMed] [Google Scholar]
- 2.Ricketts CJ, De Cubas AA, Fan H, Smith CC, Lang M, Reznik E, Bowlby R, Gibb EA, Akbani R, Beroukhim R, Bottaro DP, Choueiri TK, Gibbs RA, Godwin AK, Haake S, Hakimi AA, Henske EP, Hsieh JJ, Ho TH, Kanchi RS, Krishnan B, Kwiatkowski DJ, Lui W, Merino MJ, Mills GB, Myers J, Nickerson ML, Reuter VE, Schmidt LS, Shelley CS, Shen H, Shuch B, Signoretti S, Srinivasan R, Tamboli P, Thomas G, Vincent BG, Vocke CD, Wheeler DA, Yang L, Kim WY, Robertson AG Cancer Genome Atlas Research Network. Spellman PT, Rathmell WK, Linehan WM. The cancer genome atlas comprehensive molecular characterization of renal cell carcinoma. Cell Rep. 2018;23:3698. doi: 10.1016/j.celrep.2018.06.032. [DOI] [PubMed] [Google Scholar]
- 3.Yin L, Li W, Xu A, Shi H, Wang K, Yang H, Wang R, Peng B. SH3BGRL2 inhibits growth and metastasis in clear cell renal cell carcinoma via activating hippo/TEAD1-Twist1 pathway. EBioMedicine. 2020;51:102596. doi: 10.1016/j.ebiom.2019.12.005. [DOI] [PMC free article] [PubMed] [Google Scholar]
- 4.Ljungberg B, Bensalah K, Canfield S, Dabestani S, Hofmann F, Hora M, Kuczyk MA, Lam T, Marconi L, Merseburger AS, Mulders P, Powles T, Staehler M, Volpe A, Bex A. EAU guidelines on renal cell carcinoma: 2014 update. Eur Urol. 2015;67:913–924. doi: 10.1016/j.eururo.2015.01.005. [DOI] [PubMed] [Google Scholar]
- 5.Moch H, Cubilla AL, Humphrey PA, Reuter VE, Ulbright TM. The 2016 WHO classification of tumours of the urinary system and male genital organs-part a: renal, penile, and testicular tumours. Eur Urol. 2016;70:93–105. doi: 10.1016/j.eururo.2016.02.029. [DOI] [PubMed] [Google Scholar]
- 6.Gupta K, Miller JD, Li JZ, Russell MW, Charbonneau C. Epidemiologic and socioeconomic burden of metastatic renal cell carcinoma (mRCC): a literature review. Cancer Treat Rev. 2008;34:193–205. doi: 10.1016/j.ctrv.2007.12.001. [DOI] [PubMed] [Google Scholar]
- 7.Zhou J, Wang J, Hong B, Ma K, Xie H, Li L, Zhang K, Zhou B, Cai L, Gong K. Gene signatures and prognostic values of m6A regulators in clear cell renal cell carcinoma - a retrospective study using TCGA database. Aging (Albany NY) 2019;11:1633–1647. doi: 10.18632/aging.101856. [DOI] [PMC free article] [PubMed] [Google Scholar]
- 8.Hanahan D, Weinberg RA. Hallmarks of cancer: the next generation. Cell. 2011;144:646–674. doi: 10.1016/j.cell.2011.02.013. [DOI] [PubMed] [Google Scholar]
- 9.Cooper LA, Gutman DA, Chisolm C, Appin C, Kong J, Rong Y, Kurc T, Van Meir EG, Saltz JH, Moreno CS, Brat DJ. The tumor microenvironment strongly impacts master transcriptional regulators and gene expression class of glioblastoma. Am J Pathol. 2012;180:2108–2119. doi: 10.1016/j.ajpath.2012.01.040. [DOI] [PMC free article] [PubMed] [Google Scholar]
- 10.Sima P, Vannucci L, Vetvicka V. Immunity in cancer and atherosclerosis. Ann Transl Med. 2019;7:204. doi: 10.21037/atm.2019.04.56. [DOI] [PMC free article] [PubMed] [Google Scholar]
- 11.Komohara Y, Hasita H, Ohnishi K, Fujiwara Y, Suzu S, Eto M, Takeya M. Macrophage infiltration and its prognostic relevance in clear cell renal cell carcinoma. Cancer Sci. 2011;102:1424–1431. doi: 10.1111/j.1349-7006.2011.01945.x. [DOI] [PubMed] [Google Scholar]
- 12.Chan TA, Yarchoan M, Jaffee E, Swanton C, Quezada SA, Stenzinger A, Peters S. Development of tumor mutation burden as an immunotherapy biomarker: utility for the oncology clinic. Ann Oncol. 2019;30:44–56. doi: 10.1093/annonc/mdy495. [DOI] [PMC free article] [PubMed] [Google Scholar]
- 13.Aoun F, Rassy EE, Assi T, Albisinni S, Katan J. Advances in urothelial bladder cancer immunotherapy, dawn of a new age of treatment. Immunotherapy. 2017;9:451–460. doi: 10.2217/imt-2017-0007. [DOI] [PubMed] [Google Scholar]
- 14.Vuong L, Kotecha RR, Voss MH, Hakimi AA. Tumor microenvironment dynamics in clear-cell renal cell carcinoma. Cancer Discov. 2019;9:1349–1357. doi: 10.1158/2159-8290.CD-19-0499. [DOI] [PMC free article] [PubMed] [Google Scholar]
- 15.Refolo MG, Lotesoriere C, Messa C, Caruso MG, D’Alessandro R. Integrated immune gene expression signature and molecular classification in gastric cancer: new insights. J Leukoc Biol. 2020;108:633–646. doi: 10.1002/JLB.4MR0120-221R. [DOI] [PubMed] [Google Scholar]
- 16.Senbabaoglu Y, Gejman RS, Winer AG, Liu M, Van Allen EM, de Velasco G, Miao D, Ostrovnaya I, Drill E, Luna A, Weinhold N, Lee W, Manley BJ, Khalil DN, Kaffenberger SD, Chen Y, Danilova L, Voss MH, Coleman JA, Russo P, Reuter VE, Chan TA, Cheng EH, Scheinberg DA, Li MO, Choueiri TK, Hsieh JJ, Sander C, Hakimi AA. Tumor immune microenvironment characterization in clear cell renal cell carcinoma identifies prognostic and immunotherapeutically relevant messenger RNA signatures. Genome Biol. 2016;17:231. doi: 10.1186/s13059-016-1092-z. [DOI] [PMC free article] [PubMed] [Google Scholar]
- 17.Escudier B. Emerging immunotherapies for renal cell carcinoma. Ann Oncol. 2012;23(Suppl 8):viii35–40. doi: 10.1093/annonc/mds261. [DOI] [PubMed] [Google Scholar]
- 18.Porter R, Matulonis UA. Immunotherapy for ovarian cancer. Clin Adv Hematol Oncol. 2022;20:240–253. [PubMed] [Google Scholar]
- 19.Rosenbaum E, Antonescu CR, Smith S, Bradic M, Kashani D, Richards AL, Donoghue M, Kelly CM, Nacev B, Chan JE, Chi P, Dickson MA, Keohan ML, Gounder MM, Movva S, Avutu V, Thornton K, Zehir A, Bowman AS, Singer S, Tap W, D’Angelo S. Clinical, genomic, and transcriptomic correlates of response to immune checkpoint blockade-based therapy in a cohort of patients with angiosarcoma treated at a single center. J Immunother Cancer. 2022;10:e004149. doi: 10.1136/jitc-2021-004149. [DOI] [PMC free article] [PubMed] [Google Scholar]
- 20.Wolf Y, Samuels Y. Intratumor heterogeneity and anti-tumor immunity shape one another bidirectionally. Clin Cancer Res. 2022;28:2994–3001. doi: 10.1158/1078-0432.CCR-21-1355. [DOI] [PMC free article] [PubMed] [Google Scholar]
- 21.Xiong X, Chen S, Shen J, You H, Yang H, Yan C, Fang Z, Zhang J, Cai X, Dong X, Kang T, Li W, Zhou P. Cannabis suppresses anti-tumor immunity by inhibiting JAK/STAT signaling in T cells through CNR2. Signal Transduct Target Ther. 2022;7:99. doi: 10.1038/s41392-022-00918-y. [DOI] [PMC free article] [PubMed] [Google Scholar]
- 22.Angulo JC, Shapiro O. The changing therapeutic landscape of metastatic renal cancer. Cancers (Basel) 2019;11:1227. doi: 10.3390/cancers11091227. [DOI] [PMC free article] [PubMed] [Google Scholar]
- 23.Hirschhorn T, Stockwell BR. The development of the concept of ferroptosis. Free Radic Biol Med. 2019;133:130–143. doi: 10.1016/j.freeradbiomed.2018.09.043. [DOI] [PMC free article] [PubMed] [Google Scholar]
- 24.Liu L, Liu R, Liu Y, Li G, Chen Q, Liu X, Ma S. Cystine-glutamate antiporter xCT as a therapeutic target for cancer. Cell Biochem Funct. 2021;39:174–179. doi: 10.1002/cbf.3581. [DOI] [PubMed] [Google Scholar]
- 25.Dixon SJ, Lemberg KM, Lamprecht MR, Skouta R, Zaitsev EM, Gleason CE, Patel DN, Bauer AJ, Cantley AM, Yang WS, Morrison B 3rd, Stockwell BR. Ferroptosis: an iron-dependent form of nonapoptotic cell death. Cell. 2012;149:1060–1072. doi: 10.1016/j.cell.2012.03.042. [DOI] [PMC free article] [PubMed] [Google Scholar]
- 26.Koppula P, Zhuang L, Gan B. Cystine transporter SLC7A11/xCT in cancer: ferroptosis, nutrient dependency, and cancer therapy. Protein Cell. 2021;12:599–620. doi: 10.1007/s13238-020-00789-5. [DOI] [PMC free article] [PubMed] [Google Scholar]
- 27.Zhang Y, Kong Y, Ma Y, Ni S, Wikerholmen T, Xi K, Zhao F, Zhao Z, Wang J, Huang B, Chen A, Yao Z, Han M, Feng Z, Hu Y, Thorsen F, Wang J, Li X. Loss of COPZ1 induces NCOA4 mediated autophagy and ferroptosis in glioblastoma cell lines. Oncogene. 2021;40:1425–1439. doi: 10.1038/s41388-020-01622-3. [DOI] [PMC free article] [PubMed] [Google Scholar]
- 28.Fang Y, Chen X, Tan Q, Zhou H, Xu J, Gu Q. Inhibiting ferroptosis through disrupting the NCOA4-FTH1 interaction: a new mechanism of action. ACS Cent Sci. 2021;7:980–989. doi: 10.1021/acscentsci.0c01592. [DOI] [PMC free article] [PubMed] [Google Scholar]
- 29.Tsai Y, Xia C, Sun Z. The inhibitory effect of 6-Gingerol on ubiquitin-specific peptidase 14 enhances autophagy-dependent ferroptosis and anti-tumor in vivo and in vitro. Front Pharmacol. 2020;11:598555. doi: 10.3389/fphar.2020.598555. [DOI] [PMC free article] [PubMed] [Google Scholar]
- 30.Jiang X, Stockwell BR, Conrad M. Ferroptosis: mechanisms, biology and role in disease. Nat Rev Mol Cell Biol. 2021;22:266–282. doi: 10.1038/s41580-020-00324-8. [DOI] [PMC free article] [PubMed] [Google Scholar]
- 31.Xu H, Ye D, Ren M, Zhang H, Bi F. Ferroptosis in the tumor microenvironment: perspectives for immunotherapy. Trends Mol Med. 2021;27:856–867. doi: 10.1016/j.molmed.2021.06.014. [DOI] [PubMed] [Google Scholar]
- 32.Schnetz M, Meier JK, Rehwald C, Mertens C, Urbschat A, Tomat E, Akam EA, Baer P, Roos FC, Brune B, Jung M. The disturbed iron phenotype of tumor cells and macrophages in renal cell carcinoma influences tumor growth. Cancers (Basel) 2020;12:530. doi: 10.3390/cancers12030530. [DOI] [PMC free article] [PubMed] [Google Scholar]
- 33.Gao M, Monian P, Quadri N, Ramasamy R, Jiang X. Glutaminolysis and transferrin regulate ferroptosis. Mol Cell. 2015;59:298–308. doi: 10.1016/j.molcel.2015.06.011. [DOI] [PMC free article] [PubMed] [Google Scholar]
- 34.Sun X, Niu X, Chen R, He W, Chen D, Kang R, Tang D. Metallothionein-1G facilitates sorafenib resistance through inhibition of ferroptosis. Hepatology. 2016;64:488–500. doi: 10.1002/hep.28574. [DOI] [PMC free article] [PubMed] [Google Scholar]
- 35.Song Y, Tian S, Zhang P, Zhang N, Shen Y, Deng J. Construction and validation of a novel ferroptosis-related prognostic model for acute myeloid leukemia. Front Genet. 2021;12:708699. doi: 10.3389/fgene.2021.708699. [DOI] [PMC free article] [PubMed] [Google Scholar]
- 36.Blanche P, Dartigues JF, Jacqmin-Gadda H. Estimating and comparing time-dependent areas under receiver operating characteristic curves for censored event times with competing risks. Stat Med. 2013;32:5381–5397. doi: 10.1002/sim.5958. [DOI] [PubMed] [Google Scholar]
- 37.Liu J, Lichtenberg T, Hoadley KA, Poisson LM, Lazar AJ, Cherniack AD, Kovatich AJ, Benz CC, Levine DA, Lee AV, Omberg L, Wolf DM, Shriver CD, Thorsson V Cancer Genome Atlas Research Network. Hu H. An Integrated TCGA pan-cancer clinical data resource to drive high-quality survival outcome analytics. Cell. 2018;173:400–416. e411. doi: 10.1016/j.cell.2018.02.052. [DOI] [PMC free article] [PubMed] [Google Scholar]
- 38.Yu G, Wang LG, Han Y, He QY. clusterProfiler: an R package for comparing biological themes among gene clusters. OMICS. 2012;16:284–287. doi: 10.1089/omi.2011.0118. [DOI] [PMC free article] [PubMed] [Google Scholar]
- 39.Franzen O, Gan LM, Bjorkegren JLM. PanglaoDB: a web server for exploration of mouse and human single-cell RNA sequencing data. Database (Oxford) 2019;2019:baz046. doi: 10.1093/database/baz046. [DOI] [PMC free article] [PubMed] [Google Scholar]
- 40.Liu ZP, Wu C, Miao H, Wu H. RegNetwork: an integrated database of transcriptional and post-transcriptional regulatory networks in human and mouse. Database (Oxford) 2015;2015:bav095. doi: 10.1093/database/bav095. [DOI] [PMC free article] [PubMed] [Google Scholar]
- 41.Xia J, Gill EE, Hancock RE. NetworkAnalyst for statistical, visual and network-based meta-analysis of gene expression data. Nat Protoc. 2015;10:823–844. doi: 10.1038/nprot.2015.052. [DOI] [PubMed] [Google Scholar]
- 42.Yoshihara K, Shahmoradgoli M, Martinez E, Vegesna R, Kim H, Torres-Garcia W, Trevino V, Shen H, Laird PW, Levine DA, Carter SL, Getz G, Stemke-Hale K, Mills GB, Verhaak RG. Inferring tumour purity and stromal and immune cell admixture from expression data. Nat Commun. 2013;4:2612. doi: 10.1038/ncomms3612. [DOI] [PMC free article] [PubMed] [Google Scholar]
- 43.Newman AM, Liu CL, Green MR, Gentles AJ, Feng W, Xu Y, Hoang CD, Diehn M, Alizadeh AA. Robust enumeration of cell subsets from tissue expression profiles. Nat Methods. 2015;12:453–457. doi: 10.1038/nmeth.3337. [DOI] [PMC free article] [PubMed] [Google Scholar]
- 44.Geeleher P, Cox N, Huang RS. pRRophetic: an R package for prediction of clinical chemotherapeutic response from tumor gene expression levels. PLoS One. 2014;9:e107468. doi: 10.1371/journal.pone.0107468. [DOI] [PMC free article] [PubMed] [Google Scholar]
- 45.Bray F, Ferlay J, Soerjomataram I, Siegel RL, Torre LA, Jemal A. Global cancer statistics 2018: GLOBOCAN estimates of incidence and mortality worldwide for 36 cancers in 185 countries. CA Cancer J Clin. 2018;68:394–424. doi: 10.3322/caac.21492. [DOI] [PubMed] [Google Scholar]
- 46.Hsieh JJ, Purdue MP, Signoretti S, Swanton C, Albiges L, Schmidinger M, Heng DY, Larkin J, Ficarra V. Renal cell carcinoma. Nat Rev Dis Primers. 2017;3:17009. doi: 10.1038/nrdp.2017.9. [DOI] [PMC free article] [PubMed] [Google Scholar]
- 47.Chevrier S, Levine JH, Zanotelli VRT, Silina K, Schulz D, Bacac M, Ries CH, Ailles L, Jewett MAS, Moch H, van den Broek M, Beisel C, Stadler MB, Gedye C, Reis B, Pe’er D, Bodenmiller B. An immune Atlas of clear cell renal cell carcinoma. Cell. 2017;169:736–749. e718. doi: 10.1016/j.cell.2017.04.016. [DOI] [PMC free article] [PubMed] [Google Scholar]
- 48.Biswas SK. Metabolic reprogramming of immune cells in cancer progression. Immunity. 2015;43:435–449. doi: 10.1016/j.immuni.2015.09.001. [DOI] [PubMed] [Google Scholar]
- 49.Zhang J, Yan A, Cao W, Shi H, Cao K, Liu X. Development and validation of a VHL-associated immune prognostic signature for clear cell renal cell carcinoma. Cancer Cell Int. 2020;20:584. doi: 10.1186/s12935-020-01670-5. [DOI] [PMC free article] [PubMed] [Google Scholar]
- 50.Liu Y, Wu J, Huang W, Weng S, Wang B, Chen Y, Wang H. Development and validation of a hypoxia-immune-based microenvironment gene signature for risk stratification in gastric cancer. J Transl Med. 2020;18:201. doi: 10.1186/s12967-020-02366-0. [DOI] [PMC free article] [PubMed] [Google Scholar]
- 51.He M, Li M, Guan Y, Wan Z, Tian J, Xu F, Zhou H, Gao M, Bi H, Chong T. A new prognostic risk score: based on the analysis of autophagy-related genes and renal cell carcinoma. Front Genet. 2021;12:820154. doi: 10.3389/fgene.2021.820154. [DOI] [PMC free article] [PubMed] [Google Scholar]
- 52.Li W, Meng X, Yuan H, Xiao W, Zhang X. A novel immune-related cerna network and relative potential therapeutic drug prediction in ccRCC. Front Genet. 2021;12:755706. doi: 10.3389/fgene.2021.755706. [DOI] [PMC free article] [PubMed] [Google Scholar]
- 53.Huang Y, Chen S, Xiao L, Qin W, Li L, Wang Y, Ma L, Yuan X. A novel prognostic signature for survival prediction and immune implication based on SARS-CoV-2-related genes in kidney renal clear cell carcinoma. Front Bioeng Biotechnol. 2021;9:744659. doi: 10.3389/fbioe.2021.744659. [DOI] [PMC free article] [PubMed] [Google Scholar]
- 54.Yang WS, SriRamaratnam R, Welsch ME, Shimada K, Skouta R, Viswanathan VS, Cheah JH, Clemons PA, Shamji AF, Clish CB, Brown LM, Girotti AW, Cornish VW, Schreiber SL, Stockwell BR. Regulation of ferroptotic cancer cell death by GPX4. Cell. 2014;156:317–331. doi: 10.1016/j.cell.2013.12.010. [DOI] [PMC free article] [PubMed] [Google Scholar]
- 55.Yang WH, Ding CC, Sun T, Rupprecht G, Lin CC, Hsu D, Chi JT. The hippo pathway effector TAZ regulates ferroptosis in renal cell carcinoma. Cell Rep. 2019;28:2501–2508. e2504. doi: 10.1016/j.celrep.2019.07.107. [DOI] [PMC free article] [PubMed] [Google Scholar]
- 56.Mou Y, Wu J, Zhang Y, Abdihamid O, Duan C, Li B. Low expression of ferritinophagy-related NCOA4 gene in relation to unfavorable outcome and defective immune cells infiltration in clear cell renal carcinoma. BMC Cancer. 2021;21:18. doi: 10.1186/s12885-020-07726-z. [DOI] [PMC free article] [PubMed] [Google Scholar]
- 57.Yamaguchi H, Hsu JL, Chen CT, Wang YN, Hsu MC, Chang SS, Du Y, Ko HW, Herbst R, Hung MC. Caspase-independent cell death is involved in the negative effect of EGF receptor inhibitors on cisplatin in non-small cell lung cancer cells. Clin Cancer Res. 2013;19:845–854. doi: 10.1158/1078-0432.CCR-12-2621. [DOI] [PMC free article] [PubMed] [Google Scholar]
- 58.Lv C, Qu H, Zhu W, Xu K, Xu A, Jia B, Qing Y, Li H, Wei HJ, Zhao HY. Low-dose paclitaxel inhibits tumor cell growth by regulating glutaminolysis in colorectal carcinoma cells. Front Pharmacol. 2017;8:244. doi: 10.3389/fphar.2017.00244. [DOI] [PMC free article] [PubMed] [Google Scholar]
- 59.Yang ND, Tan SH, Ng S, Shi Y, Zhou J, Tan KS, Wong WS, Shen HM. Artesunate induces cell death in human cancer cells via enhancing lysosomal function and lysosomal degradation of ferritin. J Biol Chem. 2014;289:33425–33441. doi: 10.1074/jbc.M114.564567. [DOI] [PMC free article] [PubMed] [Google Scholar]
- 60.Wang G, Xie L, Li B, Sang W, Yan J, Li J, Tian H, Li W, Zhang Z, Tian Y, Dai Y. A nanounit strategy reverses immune suppression of exosomal PD-L1 and is associated with enhanced ferroptosis. Nat Commun. 2021;12:5733. doi: 10.1038/s41467-021-25990-w. [DOI] [PMC free article] [PubMed] [Google Scholar]
- 61.Ou Y, Wang SJ, Li D, Chu B, Gu W. Activation of SAT1 engages polyamine metabolism with p53-mediated ferroptotic responses. Proc Natl Acad Sci U S A. 2016;113:E6806–E6812. doi: 10.1073/pnas.1607152113. [DOI] [PMC free article] [PubMed] [Google Scholar]
- 62.Huang Z, Yang L, Chen J, Li S, Huang J, Chen Y, Liu J, Wang H, Yu H. CCDC134 as a prognostic-related biomarker in breast cancer correlating with immune infiltrates. Front Oncol. 2022;12:858487. doi: 10.3389/fonc.2022.858487. [DOI] [PMC free article] [PubMed] [Google Scholar]
- 63.Zhao C, Xiong K, Ji Z, Liu F, Li X. The prognostic value and immunological role of STEAP1 in pan-cancer: a result of data-based analysis. Oxid Med Cell Longev. 2022;2022:8297011. doi: 10.1155/2022/8297011. [DOI] [PMC free article] [PubMed] [Google Scholar]
- 64.Lu D, Yang Z, Xia Q, Gao S, Sun S, Luo X, Li Z, Zhang X, Li X. ACADSB regulates ferroptosis and affects the migration, invasion, and proliferation of colorectal cancer cells. Cell Biol Int. 2020;44:2334–2343. doi: 10.1002/cbin.11443. [DOI] [PubMed] [Google Scholar]
- 65.Wang Z, Li M, Liu Y, Qiao Z, Bai T, Yang L, Liu B. Dihydroartemisinin triggers ferroptosis in primary liver cancer cells by promoting and unfolded protein responseinduced upregulation of CHAC1 expression. Oncol Rep. 2021;46:240. doi: 10.3892/or.2021.8191. [DOI] [PMC free article] [PubMed] [Google Scholar]
- 66.Mehta V, Meena J, Kasana H, Munshi A, Chander H. Prognostic significance of CHAC1 expression in breast cancer. Mol Biol Rep. 2022;49:8517–8526. doi: 10.1007/s11033-022-07673-x. [DOI] [PubMed] [Google Scholar]
- 67.Li D, Liu S, Xu J, Chen L, Xu C, Chen F, Xu Z, Zhang Y, Xia S, Shao Y, Wang Y. Ferroptosis-related gene CHAC1 is a valid indicator for the poor prognosis of kidney renal clear cell carcinoma. J Cell Mol Med. 2021;25:3610–3621. doi: 10.1111/jcmm.16458. [DOI] [PMC free article] [PubMed] [Google Scholar]
- 68.Ren X, Li L, Wu J, Lin K, He Y, Bian L. PDGF-BB regulates the transformation of fibroblasts into cancer-associated fibroblasts via the lncRNA LURAP1L-AS1/LURAP1L/IKK/IkappaB/NF-kappaB signaling pathway. Oncol Lett. 2021;22:537. doi: 10.3892/ol.2021.12798. [DOI] [PMC free article] [PubMed] [Google Scholar]
- 69.Huang F, Zheng Y, Li X, Luo H, Luo L. Ferroptosis-related gene AKR1C1 predicts the prognosis of non-small cell lung cancer. Cancer Cell Int. 2021;21:567. doi: 10.1186/s12935-021-02267-2. [DOI] [PMC free article] [PubMed] [Google Scholar]
- 70.Wang Y, Song H, Miao Q, Wang Y, Qi J, Xu X, Sun J. PLA2G6 silencing suppresses melanoma progression and affects ferroptosis revealed by quantitative proteomics. Front Oncol. 2022;12:819235. doi: 10.3389/fonc.2022.819235. [DOI] [PMC free article] [PubMed] [Google Scholar]
- 71.Kajiwara K, Beharier O, Chng CP, Goff JP, Ouyang Y, St Croix CM, Huang C, Kagan VE, Hsia KJ, Sadovsky Y. Ferroptosis induces membrane blebbing in placental trophoblasts. J Cell Sci. 2022;135:jcs255737. doi: 10.1242/jcs.255737. [DOI] [PMC free article] [PubMed] [Google Scholar]
- 72.Vithayathil J, Adang L, Alves C. Widening the MRI findings of PLA2G6-associated neurodegeneration. Neuropediatrics. 2021;52:509–510. doi: 10.1055/s-0041-1731804. [DOI] [PubMed] [Google Scholar]
- 73.Sakhardande KA, Reddi VSK, Mishra S, Navin K, Ramu A, Arunachal G, Mangalore S, Yadav R, Jain S. Homozygous PLA2G6 (PARK 14) gene mutation associated neuropsychiatric phenotypes from southern India. Parkinsonism Relat Disord. 2021;90:49–51. doi: 10.1016/j.parkreldis.2021.07.026. [DOI] [PubMed] [Google Scholar]
- 74.Cavestro C, Panteghini C, Reale C, Nasca A, Fenu S, Salsano E, Chiapparini L, Garavaglia B, Pareyson D, Di Meo I, Tiranti V. Novel deep intronic mutation in PLA2G6 causing early-onset Parkinson’s disease with brain iron accumulation through pseudo-exon activation. Neurogenetics. 2021;22:347–351. doi: 10.1007/s10048-021-00667-0. [DOI] [PMC free article] [PubMed] [Google Scholar]
- 75.Liu W, Meng J, Su R, Shen C, Zhang S, Zhao Y, Liu W, Du J, Zhu S, Li P, Wang Z, Li X. SP1-mediated up-regulation of lncRNA TUG1 underlines an oncogenic property in colorectal cancer. Cell Death Dis. 2022;13:433. doi: 10.1038/s41419-022-04805-w. [DOI] [PMC free article] [PubMed] [Google Scholar]
- 76.Lu X, Wang J, Wang W, Lu C, Qu T, He X, Liu X, Guo R, Zhang E. Copy number amplification and SP1-activated lncRNA MELTF-AS1 regulates tumorigenesis by driving phase separation of YBX1 to activate ANXA8 in non-small cell lung cancer. Oncogene. 2022;41:3222–3238. doi: 10.1038/s41388-022-02292-z. [DOI] [PubMed] [Google Scholar]
- 77.Zhu J, Lu Z, Ke M, Cai X. Sp1 is overexpressed and associated with progression and poor prognosis in bladder urothelial carcinoma patients. Int Urol Nephrol. 2022;54:1505–1512. doi: 10.1007/s11255-022-03212-6. [DOI] [PubMed] [Google Scholar]
- 78.Chang JT, Wang F, Chapin W, Huang RS. Identification of micrornas as breast cancer prognosis markers through the cancer genome atlas. PLoS One. 2016;11:e0168284. doi: 10.1371/journal.pone.0168284. [DOI] [PMC free article] [PubMed] [Google Scholar]
- 79.Ghanbari S, Salimi A, Rahmani S, Nafissi N, Sharifi-Zarchi A, Mowla SJ. miR-361-5p as a promising qRT-PCR internal control for tumor and normal breast tissues. PLoS One. 2021;16:e0253009. doi: 10.1371/journal.pone.0253009. [DOI] [PMC free article] [PubMed] [Google Scholar]
- 80.Zhang HM, Kuang S, Xiong X, Gao T, Liu C, Guo AY. Transcription factor and microRNA co-regulatory loops: important regulatory motifs in biological processes and diseases. Brief Bioinform. 2015;16:45–58. doi: 10.1093/bib/bbt085. [DOI] [PubMed] [Google Scholar]
- 81.Tang R, Xu J, Zhang B, Liu J, Liang C, Hua J, Meng Q, Yu X, Shi S. Ferroptosis, necroptosis, and pyroptosis in anticancer immunity. J Hematol Oncol. 2020;13:110. doi: 10.1186/s13045-020-00946-7. [DOI] [PMC free article] [PubMed] [Google Scholar]
- 82.Xu F, Huang X, Li Y, Chen Y, Lin L. m(6)A-related lncRNAs are potential biomarkers for predicting prognoses and immune responses in patients with LUAD. Mol Ther Nucleic Acids. 2021;24:780–791. doi: 10.1016/j.omtn.2021.04.003. [DOI] [PMC free article] [PubMed] [Google Scholar]
- 83.Wei Y, Ou T, Lu Y, Wu G, Long Y, Pan X, Yao D. Classification of ovarian cancer associated with BRCA1 mutations, immune checkpoints, and tumor microenvironment based on immunogenomic profiling. PeerJ. 2020;8:e10414. doi: 10.7717/peerj.10414. [DOI] [PMC free article] [PubMed] [Google Scholar]
- 84.Macpherson AM, Barry SC, Ricciardelli C, Oehler MK. Epithelial ovarian cancer and the immune system: biology, interactions, challenges and potential advances for immunotherapy. J Clin Med. 2020;9:2967. doi: 10.3390/jcm9092967. [DOI] [PMC free article] [PubMed] [Google Scholar]
- 85.Curiel TJ, Coukos G, Zou L, Alvarez X, Cheng P, Mottram P, Evdemon-Hogan M, Conejo-Garcia JR, Zhang L, Burow M, Zhu Y, Wei S, Kryczek I, Daniel B, Gordon A, Myers L, Lackner A, Disis ML, Knutson KL, Chen L, Zou W. Specific recruitment of regulatory T cells in ovarian carcinoma fosters immune privilege and predicts reduced survival. Nat Med. 2004;10:942–949. doi: 10.1038/nm1093. [DOI] [PubMed] [Google Scholar]
- 86.Landskron J, Helland O, Torgersen KM, Aandahl EM, Gjertsen BT, Bjorge L, Tasken K. Activated regulatory and memory T-cells accumulate in malignant ascites from ovarian carcinoma patients. Cancer Immunol Immunother. 2015;64:337–347. doi: 10.1007/s00262-014-1636-6. [DOI] [PMC free article] [PubMed] [Google Scholar]
- 87.Wei C, Liu X, Wang Q, Li Q, Xie M. Identification of hypoxia signature to assess the tumor immune microenvironment and predict prognosis in patients with ovarian cancer. Int J Endocrinol. 2021;2021:4156187. doi: 10.1155/2021/4156187. [DOI] [PMC free article] [PubMed] [Google Scholar]
- 88.Chen J, Jiang CC, Jin L, Zhang XD. Regulation of PD-L1: a novel role of pro-survival signalling in cancer. Ann Oncol. 2016;27:409–416. doi: 10.1093/annonc/mdv615. [DOI] [PubMed] [Google Scholar]
- 89.Cacan E. Epigenetic-mediated immune suppression of positive co-stimulatory molecules in chemoresistant ovarian cancer cells. Cell Biol Int. 2017;41:328–339. doi: 10.1002/cbin.10729. [DOI] [PubMed] [Google Scholar]
Associated Data
This section collects any data citations, data availability statements, or supplementary materials included in this article.