

Summary
Probiotics have demonstrated the potential to ameliorate hyperuricemia in animals, but their effectiveness and mechanism of action in humans has been understudied. A randomized, double-blinded, controlled research was conducted with 120 volunteers, who consume either a probiotic yogurt containing a UA-degrading strain Limosilactobacillus fermentum GR-3 or a conventional yogurt for 2 months, to investigate probiotic yogurt helped decrease uric acid levels in the at-risk human population. Serum UA levels showed that the probiotic yogurt caused a significant decrease than the consumption of conventional yogurt (26.2% ± 2.3% vs. 8.6% ± 1.1%), and contributed to the UA excretion in the feces and urine (7.4% ± 2.1% and 13.8% ± 3.4%, respectively, 1.9% ± 1.1% and 5.1% ± 2.2%, respectively). Metabolomics and microbial community analysis showed a positive correlation with enhanced anti-inflammation of the host. Our findings suggest an effective and economical therapeutic adjuvant in treating hyperuricemia.
Subject areas: Health sciences, Nephrology, Human physiology, Dietary supplement
Graphical abstract
Highlights
-
•
A probiotic Limosilactobacillus fermentum GR-3 was isolated from fermented food
-
•
L. fermentum GR-3 can degrade uric acid to reduce accumulation
-
•
Probiotic GR-3 improves serum biochemical indexes for promoting uric acid excretion
-
•
Probiotic GR-3 regulate gut microbiome and metabolism for reducing uric acid level
Health sciences; Nephrology; Human physiology; Dietary supplement
Introduction
Hyperuricemia (HUA) deriving from purine metabolic disorders associated with gout has become a global health problem (Bardin and Richette, 2014). As lifestyle develops, HUA has become more common in Asia than in Western countries (Mattiuzzi and Lippi, 2020). Gout, urolithiasis, and urate nephropathy are symptoms of HUA due to urate crystal formation in the bones, joints, and kidneys (Yamanaka, 2011). In contrast to other diseases, including metabolic syndrome, cardiovascular disease, and kidney disease, HUA is an independent risk factor (Juraschek et al., 2013). Conventional treatment methods for hyperuricemia contain diet control and drug usage (Poon et al., 2009). A dietary intervention involving the limitation of purine-rich foods is less successful because it is difficult to maintain a long-term dietary restriction (Kaneko et al., 2014). Although some drugs (e,g, allopurinol, febuxostat, and benzbromarone) have achieved good clinical therapeutic effects for treating hyperuricemia by reducing uric acid (UA) production or increasing UA excretion (Ahn et al., 2016; Becker et al., 2005; Azevedo et al., 2019; Sundy and Hershfield, 2007), they can have some side effects on the human body when consumed in high doses (Agnoletti et al., 2021). Thus, it is essential to develop a feasible and acceptable method with fewer side effects to treat hyperuricemia.
UA (2,6,8 trioxypurine-C5H4N4O3) is a byproduct of purine metabolism in humans that cannot be further processed due to lack of uricase activity (Keebaugh and Thomas, 2010). An increase in UA accumulation or a decrease in its excretion and even both may trigger hyperuricemia (Merriman and Dalbeth, 2011). Humans generate 600–700 mg of UA, two-thirds of which is excreted via the kidneys and one-third of which is excreted through the intestine (Dalbeth et al., 2016). Conversely, uric acid accumulation occurs in humans via two mechanisms (de Oliveira and Burini, 2012). One of these mechanisms involves the endogenous production of UA, which occurs mostly via purine metabolism in the liver, intestines, and other tissues such as muscles and kidneys (Chaudhary et al., 2013). Another means of UA accumulation is an exogenous diet involving the intake of purine-rich foods (Choi et al., 2004). The gut microbiota is a significant predictor of blood UA levels because it is directly involved in food digestion and absorption (Ebrahimpour-Koujan et al., 2020). Furthermore, a previous study found that gut microbiota dysbiosis was usually associated with a high-purine diet, highlighting its vital role in purine breakdown and UA balance (Liu et al., 2020). Owing to its role in UA formation and excretion, the digestive tract can help prevent and treat hyperuricemia under normal conditions.
Probiotics are typical dietary food supplements (Shi et al., 2016); it has been found to be effective in the treatment of metabolic syndrome (Cao et al., 2017). Several known probiotics, such as Lactobacillus reuteri (TSR332) and L. fermentum (TSF331) strains, can therapy hyperuricemia by utilizing purine to reduce UA synthesis (Kuo et al., 2021), whereas other Lactobacilli strains including Lactobacillus brevis (DM9218) and L. gasseri (PA-3) have also been shown to be effective in the treatment of hyperuricemia by degrading purine metabolic intermediates (Li et al., 2014; Yamada et al., 2017). However, the protective mechanism of probiotics in limited quantities warrants further investigation. “Gut remediation” is an emerging high-efficiency approach, which functions using probiotics as dietary supplements to interact with the gut microbiota (Wu et al., 2017). In our previous study, an L. fermentum GR-3 strain with the ability to degrade UA was isolated from a traditional fermented food item (Jiangshui); this strain was found to be effective in lowering UA levels in a UA-induced hyperuricemia mouse model. However, its effectiveness and mechanism of action in humans have received limited attention. This study aimed to explore the potential of a probiotic yogurt containing strain GR-3 in decreasing UA levels in humans and investigate the possible roles of gut microbiota in the probiotic-mediated gut remediation process and their implications on host metabolism.
Results
Participant profiles and study procedure
Overall, 120 patients with high serum UA levels (>420 umol/L) were enrolled in this clinical trial and randomly assigned either into the conventional yogurt group (n = 60) or the GR-3 yogurt group (n = 60) for 2 months to determine the effect of strain GR-3 on the decrease in serum UA levels (see Figure 1 for the study flow chart). The baseline characteristics of participants in the two groups are listed in Table 1. The number of men was higher than that of women in the two groups (3:1 in the CK yogurt group and 4:1 in the GR-3 yogurt group), and the average age was 38 (24–54) years and 41 (25–57) years, respectively. The body mass index of the participants was similar in the CK yogurt and GR-3 yogurt groups, which was 28.8 (20.2–42.7) and 28.6 (19.7–42.2) in men and women, respectively. Furthermore, no considerable differences were observed in the baseline serum UA levels between the two groups, with the average being 544.03 (483–651) in the CK yogurt group and 544.15 (480–653) in the GR-3 yogurt group. A total of 97 individuals were included in the primary analysis at the end of the intervention (45 in the CK yogurt group and 52 in the GR-3 yogurt group).
Figure 1.

Flow diagram of participants cohort in the trial
(A) Study design of the human trial.
(B) Flow diagram of subject recruitment.
Table 1.
Demographics and baseline characteristics of the participants
| CK yogurt (n = 60) | GR-3 yogurt (n = 60) | ||
|---|---|---|---|
| Gender, n (%) | Male | 42 (70%) | 47 (78%) |
| Female | 18 (30%) | 13 (22%) | |
| Age at inclusion, years | Average (range) | 38 (24–54) | 41 (25–57) |
| BMIa at inclusion (kg·m−2) | Average (range) | 28.8 (20.2–42.7) | 28.6 (19.7–42.2) |
| Uric acid level in serum (μmol/L) | Average (range) | 544.03 (483–651) | 544.15 (480–653) |
Body mass index (BMI) is the weight in kilograms divided by the square of the height in meters. No significant differences were observed among the three groups in any of the baseline characteristics.
GR-3 yogurt significantly decreased serum UA levels in a period of 2 months of trial
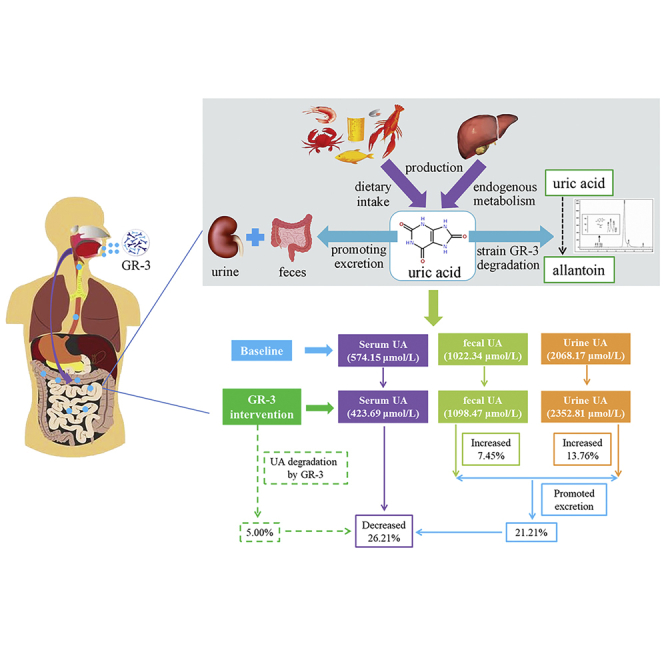
The serum UA levels at baseline and post-intervention in each of the two groups were determined. In the GR-3 probiotic yogurt group, participants exhibited significantly decreased serum UA levels compared with the baseline serum UA levels 2 months after intervention (574.15 ± 45.44 vs. 423.70 ± 13.17 μmol/L, p < 0.0001); whereas participants from conventional yogurt group only exhibited a slight decrease in the same period (574.03 ± 44.78 vs. 524.76 ± 30.45 μmol/L) (Figure 2A). Furthermore, a significant decrease in serum UA levels was also observed as early as 1 month after the first GR-3 probiotic yogurt supplementation (574.15 ± 45.44 vs. 496.37 ± 32.00 μmol/L, p < 0.0001); in comparison, the conventional yogurt showed no significant effect.
Figure 2.

Probiotic yogurt significantly decreased serum uric acid levels in participants
(A) Changes in serum uric acid concentrations of participants in the two groups during the trial.
(B) Serum uric acid concentrations varied in the high (>30%), medium (15%–30%), and low (<15%) degradation groups throughout the trial.
(C) The absolute copies of GR-3 in feces of participants orally fed with GR-3 in the different subsets.
(D) Correlation analysis between the absolute copies of GR-3 and uric acid removal rates.
Allantoin concentrations in urine (E) and feces (F) of participants during the trial.
(G) The uric acid degradation by the feces of participants (randomly selected, n = 9) in the two groups after the trial.
Data are shown as mean ± SEM. Statistical analysis was performed using a one-way ANOVA with Tukey’s post hoc analysis with the GraphPad Prism (version 8.0.1) (∗p < 0.05, ∗∗p < 0.01, ∗∗∗p < 0.001, ∗∗∗∗p < 0.0001, ns represents no significant).
Given the heterogeneity of the decreased serum UA levels 2 months after intervention in the GR-3 yogurt group, the group was stratified into three sets: low (<15%), medium (15%–30%), and high decrease (>30%) sets (Figure 2B). Additionally, the relative abundance of the GR-3 strain was determined in the feces of different group settings. After the initial GR-3 yogurt supplementation for two months, GR-3 was significantly enriched in the fecal samples (p < 0.0001), indicating good adherence to the intervention by the participants. Significant differences were observed among different group settings; the GR-3 strain was significantly enriched in the high decrease set (0.4216% ± 0.0354%) compared with the medium (0.3285% ± 0.0368%) and low decrease sets (0.3166% ± 0.0315%) (Figure 2C). Pearson correlation analysis showed that the UA removal rate in the serum was significantly associated with the percentage of strain GR-3 in the feces (p < 0.01) (Figure 2D). At the end of the trial, allantoin levels, a UA degradation product of strain GR-3, in the feces and urine were also determined. Urine allantoin levels approximately increased by 4-folds (from 6.1217 ± 2.6195 to 24.2673 ± 7.0234 μmol/L) after 2 months intervention using the GR-3 strain, which was superior to the findings recorded for the conventional yogurt group (Figure 2E). Allantoin levels in the feces of the GR-3 yogurt group were also considerably higher than those in the control group (Figure 2F). Allantoin levels in the urine and feces of groups with different serum UA removal efficiencies shared similar trend (Figure S1). To further evaluate the degradation ability of strain GR-3, fecal samples of participants were randomly collected from two groups; the fecal samples of the GR-3 yogurt group can degrade UA but not UA degradation ability in the conventional group (Figure 2G). These findings indicate that strain GR-3 can successfully colonize in the intestine and effectively digest UA, thus lowering the blood UA level.
GR-3 yogurt significantly improved serum biochemical indices for promoting UA excretion
To investigate the effects of GR-3 yogurt on the intestine and kidney of participants with high serum UA levels, the biochemical indices of serum were examined after two months intervention. The serum inflammatory marker levels of tumor necrosis factor (TNF)-α and interleukin (IL)-6 in both groups were depicted in Figures 3A and 3B. The TNF-α and IL-6 levels in the GR-3 yogurt group were significantly lower than those in the baseline group (p = 0.0020 and p = 0.0152, respectively), whereas no significant effect was observed in the conventional yogurt group, indicating that the GR-3 yogurt promoted the host’s anti-inflammatory response. We also determined the serum diamine oxidase (DAO) and D-Lac levels in each group (Figures 3C and 3D); blood DAO and D-Lac levels in the GR-3 yogurt group decreased significantly compared with the baseline group (p < 0.0001 and p = 0.0011, respectively). There was no significant difference in the serum DAO and D-Lac levels between the GR-3 and conventional yogurt groups, indicating that the GR-3 yogurt enhanced gut barrier permeability. Serum blood urea nitrogen (BUN) and creatinine (Cr) levels were also evaluated in the two groups (Figures 3E and 3F). Similar results were observed in case of the measured renal function, wherein BUN and Cr levels in the GR-3 yogurt group decreased significantly after two months intervention (p < 0.0001) and no significant effect was observed in the conventional yogurt group, indicating that the GR-3 yogurt effectively ameliorated renal injury.
Figure 3.

Probiotic yogurt significantly improved serum biochemical indices for promoting uric acid excretion
Serum TNF-α (A), IL-6 (B), diamine oxidase (DAO) (C), d-lactate (D-Lac) (D), urea nitrogen (BUN) (E), and creatinine (F) in participants. Uric acid concentrations in urine (G) and feces (H). Data are shown as mean ± SEM. (∗p < 0.05, ∗∗p < 0.01, ∗∗∗p < 0.001, ∗∗∗∗p < 0.0001, ns represents no significant).
With improvement in the serum biochemical indices among the participants, the UA levels in urine samples increased significantly after two months intervention using strain GR-3 compared with the baseline group (2352.81 ± 200.1 vs. 2068.17 ± 246.2 μmol/L, p < 0.0001), whereas only a slight increase was noted in the conventional yogurt group. A significant difference could be observed between the two yogurt intervention groups within the same period (p = 0.0009 in 1 month and p = 0.0125 in 2 months, respectively) (Figure 3G). Distinct from slight increase of UA levels in the conventional yogurt group, the UA levels increased significantly in the GR-3 yogurt group after two months intervention (1098.47 ± 69.36 vs. 1018.13 ± 75.15 μmol/L, p < 0.0001) (Figure 3H); a significant difference was also noted in the UA levels between the GR-3 and conventional yogurt groups (p < 0.0001). These findings indicate that GR-3 yogurt not only effectively degraded UA directly and reduced inflammation in the host but also protected kidney and intestinal function via UA excretion.
GR-3 yogurt significantly modulated the taxonomic composition of gut microbiota
Nine fecal samples of the high removal efficiency group were randomly selected for 16S rRNA gene sequencing at baseline and at the end of the study to evaluate the effect of strain GR-3 on the hyperuricemic participants. In total, 1257 amplicon sequence variants were identified in 18 fecal samples. Shannon and Chao indices of the INT group were higher than those of the HUA group (Figure 4A). However, no significant differences existed between the two groups. As for the β-diversity, strain GR-3 resulted in a difference in the distribution of gut microbiota between the two groups using main coordinate analysis (Figure 4B). The scattered sample dots indicated that the INT microbiota community structure was distinct from the HUA microbiota community structure. These findings suggested that strain GR-3 could modulate the gut microbiota.
Figure 4.

Probiotic yogurt significantly altered gut microbiome symbiosis two months after intervention
(A) The α-diversity of gut microbiota based on Chao and Shannon indices.
(B) The β-diversity of gut microbiota based on principal coordinate analysis (PCoA). Relative abundance of the intestinal microbial community in each group at the phylum (C) and genus (D) level. The relative abundance of Proteobacteria, Escherichia, Prevotella, Enterococcus, Intestinimonas, and Ruminococcus2 (E) Data are shown as mean ± SD (n = 9).
(F) Heatmap of correlation between gut microbiota and several parameters like serum uric acid, urine uric acid, and fecal uric acid. ∗p < 0.05; ∗∗p < 0.01 versus HUA group.
To further investigate the effect of strain GR-3 on the gut microbiota in detail, the relative abundance of the bacterial profile was determined at the phylum and genus levels. Each group was dominated by Bacteroidetes and Firmicutes (Figure 4C). Firmicutes in INT group increased from 53.71% to 65.66% in relative abundance compared with the HUA group, but HUA group had a higher Firmicutes-to-Bacteroidetes ratio. The relative abundance of Proteobacteria in the INT group reduced considerably from 15.64% to 4.34% (p = 0.004) compared with the HUA group (Figure 4E). At the genus level, the INT group had a microbial community structure distinct from that of the HUA group. Bacteroides were more abundant in the HUA group; however, Bifidobacterium and Lactobacillus were less abundant in the HUA group than in the INT group (Figure 4D). In contrast, the lower abundance of Prevotella, Intestinimonas, and Ruminococcus 2 significantly increased after two months GR-3 yogurt intervention in the INT group, along with a decreased relative abundance of Escherichia/Shigella and Enterococcus in the INT group (p < 0.01) (Figure 4E). In addition, correlation analysis was conducted to determine the relationship between environmental parameters (UA level, TNF-α, IL-6, Cr, BUN, DAO, and D-Lac) and the bacterial community (Figure 4F). Escherichia/Shigella and Enterococcus showed a positive correlation with the serum UA (SUA) level and other serum biochemical indices, including TNF-α, IL-6, Cr, BUN, DAO, and D-Lac, and showed a negative correlation with fecal UA (FUA) and urine UA (UUA) levels. In contrast, the SUA and serum biochemical indices showed a negative correlation with Prevotella, Intestinimonas, and Ruminococcus 2 and a positive correlation with FUA and UUA levels. The same results were also observed in other genera such as Butyricimonas, Akkermansia, and Ruminococcus. These results were consistent with our experimental results in that the intervention using strain GR-3 can modify the gut microbiota, further reduce inflammation, and improve the gastrointestinal barrier function by decreasing serum UA levels.
GR-3 yogurt alters the fecal, urine, and serum metabolomes of the participants
The fecal, urine, and serum metabolites associated with the gut microbiome were analyzed using liquid gas chromatography-mass spectrometry (LC-MS). The orthogonal projections to latent structures discriminant analysis (OPLS-DA) was used to further define the HUA and INT groups. A variable importance in the projection value of >1 and a p-value of <0.05 were considered statistically significant. Score plots from OPLS-DA revealed complete separation between the HUA and INT groups, indicating that the two groups had significantly different metabolic profiles (Figure 5A). Compared with the HUA group, 98 divergent metabolites were detected in the fecal samples of INT group, 36 of which were upregulated and 62 were downregulated. In the urine samples of INT group, 231 differential metabolites were detected, 131 of which were upregulated and 100 were downregulated, whereas 466 differential metabolites (93 upregulated and 373 downregulated) were observed in the serum samples of INT group (Figure 5B). The changes in significant variable metabolites in different groups are shown in Figure 5C. Compared with the HUA group, the levels of DL-mandelic acid, prostaglandin F3a, ethyl oleate, tetradecanoyl-l-carnitine, palmitoylcarnitine, linoleyl carnitine, and oleoyl-l-carnitine decreased considerably in INT group, whereas those of uric acid, D-malic acid, and adenine increased. In contrast to the urine samples of HUA group, the levels of inosine, hypoxanthine, xanthine, taurine, kynurenic acid, phenylacetylglutamine, and uric acid increased substantially in the INT group, and the levels of adenine, 1,7-Dimethyluric acid, and paraxanthine decreased. After GR-3 yogurt intervention, serum metabolite levels differed significantly in the INT group compared with the HUA group, which showed increased levels of inosine, hypoxanthine, uridine, N-acetylornithine, and L-glutamic acid and decreased levels of uric acid, xanthine, 2-hydroxy-2-methylbutyric acid, 11,12-epoxyeicosatrienoic acid, 12,13-dihydroxy-9-octadecenoic acid, succinic acid, eicosapentaenoic acid, tetradecanoyl-l-carnitine, and bilirubin. Meanwhile, UA levels in the fecal, urine, and serum samples were consistent with those recorded in earlier experiments. Correlation analysis between differential metabolites and clinical indicators is shown in Figure S2. Metabolic pathway enrichment analysis was performed using differential metabolites based on the KEGG database. Twenty pathways were identified with an impact value at the comprehensive level in the serum metabolome, including the biosynthesis of unsaturated fatty acids; citrate cycle (TCA cycle); alanine, aspartate, and glutamate metabolism; glyoxylate and dicarboxylate metabolism; cysteine and methionine metabolism; butanoate metabolism; synthesis and degradation of ketone bodies; linoleic acid metabolism; propanoate metabolism; fatty acid biosynthesis; arachidonic acid metabolism; arginine and proline metabolism; primary bile acid biosynthesis; purine metabolism; tyrosine metabolism; glutathione metabolism; histidine metabolism; tryptophan metabolism; nicotinate and nicotinamide metabolism; and pyrimidine metabolism (Figure 5D). The TCA cycle, amino acid metabolism, taurine metabolism, purine metabolism, and pyrimidine metabolism are the respective metabolic pathways, as shown in Figure 5E, based on the upstream and downstream interactions between the possible metabolites in this study. Several metabolic pathways associated with the potential biomarkers were found to be regulated by the intervention using strain GR-3 to ameliorate the serum UA levels.
Figure 5.

Probiotic yogurt altered serum, urine, and fecal metabolome two months after treatment
(A) Partial least-squares discriminant analysis (PLS-DA) score plots of HUA and INT groups (n = 9).
(B) Volcano plots of serum, urine, and fecal metabolome. Red, significantly upregulated (p < 0.05).
(C) Histograms show the relative signal intensities for marker metabolites of the HUA and INT groups in serum, urine, and fecal.∗p < 0.05; ∗∗p < 0.01 versus HUA group.
(D) Disturbed pathways in response to HUA and INT groups.
(E) Schematic overview of the metabolites and relevant pathways changing for GR-3 intervention according to the KEGG PATHWAY database. The important correlation networks of the potential biomarkers in the experiment. Metabolites with a blue dashed area present a significant decrease in the INT group compared to the HUA group. Metabolites with a red dashed area present a significant increase in the INT group compared to the HUA group.
16S rRNA sequencing alterations correlated with metabolome changes in the study participants
An interatomic correlation analysis was conducted between the abundance of variable gut microbiota, feces, urine, and serum metabolites to further investigate the relationships between gut microbiota and the fecal, urine, and serum metabolome. Tight linkages were found in samples obtained from both the HUA and the INT groups (Figure 6). Each enriched metabolite relevant to anti-inflammation showed a positive correlation with most of the enriched strains in the participants after GR-3 yogurt intervention, suggesting that functional enhancement in anti-inflammation is associated with the enrichment of some strains. Furthermore, some functional modules of the gut microbiota significantly co-varied with the levels of their antioxidation-related metabolites among feces, urine, and serum samples, implying that the energy availability increased after yogurt consumption. Furthermore, most enriched strains and metabolites showed a negative correlation with serum UA levels, whereas some other metabolites showed a positive correlation with the fecal and urine UA levels, suggesting that the composition of microbiota and host metabolism were responsive to the UA level.
Figure 6.

Correlation analysis of the altered gut microbiota and metabolites in the HUA and INT groups
Green squares indicate enrichment in the HUA group, and red squares indicate enrichment in the INT group; the significance of the correlation is closely related to the depth of color.
Discussion
Hyperuricemia can cause gout and other metabolic disorders, it often occurs as a result of metabolic problems or an excessive intake of purine-rich foods (Zhao et al., 2022). Probiotics have been demonstrated the potential to ameliorate hyperuricemia in animals. However, their effectiveness and mechanism of action in humans is understudied. To the best of our knowledge, this is the first piece of evidence demonstrating that probiotics have an effect on hyperuricemia in humans, thus establishing a theoretical foundation for probiotics as a preventive and therapeutic intervention for hyperuricemia.
In this study, L. fermentum GR-3 with strong UA-degrading ability was isolated from a traditional fermented food item consumed in Northwestern China named “Jiangshui”, which is rich in lactic acid bacteria. In the human trial of this study, yogurt containing probiotic GR-3 supplementation considerably reduced serum UA levels (22.14 vs. 3.6%) and promoted UA excretion in feces (16.48% and 5.09%, respectively) and urine (13.76% and 5.13%, respectively) compared with the conventional yogurt. Numerous probiotics, including Lactobacillus, Bifidobacterium, Enterococcus, and Streptococcus, have succeeded in preventing or treating various metabolic illnesses, including hyperuricemia. Lactobacillus, including Lactobacillus plantarum (Iswantini et al., 2014), L. s reuteri (Kuo et al., 2021), L. fermentum (Wu et al., 2021), L. brevis (Wang et al., 2019), and Lactobacillus gasseri (Kano et al., 2018), is the most common type of probiotic bacterium for alleviating hyperuricemia. However, probiotics decreased serum UA levels using various methods. One of the probiotic techniques for treating hyperuricemia is to increase UA excretion. The promoting pathway was also observed in our study. Furthermore, another major mechanism was to reduce UA biosynthesis. Increased UA excretion is an effective strategy utilized by probiotics to cure hyperuricemia. Probiotics are live microorganisms that benefit their hosts by regulating their gut microbiota, reducing host oxidation, and inflammation, thereby protecting their intestines and kidney function, and subsequently enhancing UA excretion and decreasing the body’s UA concentration (Yamada et al., 2017; Pavelcova and Bohata, 2020). The primary objective of treating hyperuricemia using probiotics is to decrease the serum UA level. Unlike other studies, this study focused on the direct effect of probiotics on UA degradation. Allantoin, a UA byproduct of strain GR-3 was also detected, which has been reported as a general metabolite production of UA by bacteria (Iwadate and Kato, 2019). After two months GR-3 yogurt treatment, the strain was found in the feces of participants, showing that this strain survived in the intestine of the participants throughout the experiment. The UA removal rate in the serum was associated with the percentage of strain GR-3 in the feces. However, the number of probiotic strains colonizing the digestive tract is extremely small; how a limited number of probiotics exert protective effects remains unknown.
Gut remediation is a simple and successful treatment for humans that involves supplementation with specific probiotics that interact with the gut bacteria (Wu et al., 2017). Changes in the gut microbiota affect the integrity of the intestinal barrier (Hamilton et al., 2015). Hyperuricemia is strongly associated with a high-purine diet consumption, which can result in gut microbiota dysbiosis (Anhê et al., 2015). Our findings indicated that UA exposure (HUA group) substantially reduced the variety and abundance of gut microbiota compared with the intervention group (INT group), which was regulated by strain GR-3 therapy, suggesting that GR-3 improves the gut microbiota disrupted by UA exposure. Consistent with earlier findings, a decrease in the relative abundance of Firmicutes and an increase in the relative abundance of Bacteroidetes were detected in the HUA group, which confers critical functions, such as metabolic, developmental, and immunologic features, on the host (Ley et al., 2006). Increased Bacteroidetes/Firmicutes ratios may be a symptom of hyperuricemia-induced disturbances in the microbiota, whereas GR-3 treatment may inhibit these changes. In this study, an increase in opportunistic infections by Bacteroides was also observed, whereas the quantity of beneficial bacteria, such as Prevotella, Intestinimonas, and Ruminococcus2, considerably decreased in the HUA group compared with the INT group. In the INT group, intervention using strain GR-3 increased the amounts of Akkermansia and Ruminococcus, which are both involved in the generation of short-chain fatty acids, and their relative abundance has been linked to improved host health (Lee et al., 2018). Akkermansia is a type of probiotic found in the gut microbial population as a member of the phylum Verrucomicrobia. Increased abundance of Akkermansia is associated with improved metabolic profiles, including glucose intolerance, insulin resistance, steatohepatitis, and chronic inflammation (Jayachandran et al., 2020). Our results showed that Prevotella, Intestinimonas, and Ruminococcus2 showed a negative correlation with SUA levels and serum biochemical indices such as TNF-α and IL-6; they showed a positive correlation with FUA and UUA levels. Similar results were also observed with other beneficial genera, such as Butyricimonas, Akkermansia, and Ruminococcus, after the GR-3 intervention. Subsequently, the related metabolic pathways, including the TCA cycle, the metabolism of amino acids, taurine, purines, and pyrimidines were described. These metabolic pathways were mainly linked to glucose degradation, the primary energy consumption, inflammation related to lipid-oxidation and oxidative stress, and UA biosynthesis in response to hyperuricemia (Martínez-Reyes and Chandel, 2020). The strain GR-3 was found to modulate the gut microbiota and influence host metabolism.
Uric acid is a byproduct of purine metabolism produced in humans due to the loss of uricase function caused by various mutations in its gene, resulting in higher UA levels in humans than in other mammals (Álvarez-Lario and Macarrón-Vicente, 2010). Hepatic metabolism is principally responsible for maintaining uric acid homeostasis, and superfluous uric acid is excreted through urine and feces (Tasic et al., 2016). Therefore, the kidney and gut’s functioning state is critical for UA metabolism. The expression of inflammatory mediators, TNF-α and IL-6, was decreased after GR-3 yogurt intervention, indicating that the individuals' inflammatory response was lowered. Similar results were also observed in a previous study that used a natural product (chicory) to ameliorate hyperuricemia (Bian et al., 2020). The regulation of oxidative stress and inflammation contributes to protecting the health and functionality of the intestine and kidneys (Xu et al., 2015). Consequently, the DAO and D-Lac levels in serum were measured, which are markers of intestinal permeability. After strain GR-3 intervention, the levels reduced significantly, suggesting that GR-3 could repair the damage to intestinal mucosa and improve the permeability of the intestinal barrier in the state of hyperuricemia. Furthermore, a decrease in serum BUN and Cr levels after strain GR-3 administration in the INT group suggested that strain GR-3 could effectively alleviate kidney lesions and promote uric acid excretion (Finco and Duncan, 1976). This revealed that strain GR-3 intervention could maintain the functional status of the intestine and kidneys by promoting UA excretion.
In summary, L. fermentum GR-3 is a candidate probiotic strain isolated from fermented dairy products. The rationale for using probiotic yogurt in this study is that GR-3 is a probiotic strain with the specific function of strong UA degradation, and yogurt as a dairy product is a better medium for distributing active probiotic bacteria than capsules (Barengolts et al., 2019). Strain GR-3 could affect hyperuricemia in various ways. Strain GR-3 can destroy UA in the gut and decreased the amount of serum UA, as a result, lowering the quantity of UA reabsorbed by the intestinal epithelium and entering the bloodstream. Additionally, strain GR-3 as a probiotic can reduce inflammation in the body, protect intestinal and renal function, and promote UA excretion.
Although we observed that there is a strong correlation between uric acid degradation and bacterial colonization in the gut, such individual differences were closely related to their gut microbiota. Moreover, patients with different initial uric acid levels may need tailored-made yogurt consumption to alleviate hyperuricemia (Figure 2B). In our study, most patients with mild or moderate hyperuricemia prefer yogurt to medicines. Noteworthy, this study does not provide a comparative analysis of probiotic and full-dosed drugs (e.g. allopurinol or febuxostat). Existing studies confirmed that the superiority over allopurinol 300 mg/day was demonstrated for febuxostat 60 mg/day at week 16 for hyperuricemic Chinese subjects with gout (66.3% vs. 51.2%) (Zhang et al., 2019) as well as that febuxostat may be more renoprotective than allopurinol in patients with both hyperuricemia and chronic kidney disease (Hu and Brown, 2020). Therefore, further studies are needed to determine whether probiotics are more cost-effective than some drugs.
Limitations of the study
In this study, a probiotic namely L. fermentum GR-3 with strong UA-degrading ability was isolated from a traditional fermented food item consumed in Northwestern China named “Jiangshui”. Our study showed that the probiotic yogurt caused a significant decrease than the consumption of conventional yogurt and contributed to the UA excretion in the feces and urine. Metabolomics and microbial community analysis showed a positive correlation with enhanced anti-inflammation of the host. However, it is worth noting that this study does not provide a comparative analysis of probiotic and full-dosed drugs. Further studies are needed to determine whether probiotics are more cost-effective than some drugs.
STAR★Methods
Key resources table
| REAGENT or RESOURCE | SOURCE | IDENTIFIER |
|---|---|---|
| Chemicals, peptides and recombinant proteins | ||
| PBS buffer | Solarbio Biological Technology, Co., Ltd, China | P1022 |
| Peptone | Solarbio Biological Technology, Co., Ltd, China | CAS: 73049-73-7 |
| Yeast extract | Solarbio Biological Technology, Co., Ltd, China | CAS: 119-44-8 |
| NaCl | Solarbio Biological Technology, Co., Ltd, China | CAS: 7647-14-5 |
| K2HPO4 | Solarbio Biological Technology, Co., Ltd, China | CAS: 7758-11-4 |
| KH2PO4 | Solarbio Biological Technology, Co., Ltd, China | CAS: 7778-77-0 |
| MgSO4.7H2O | Solarbio Biological Technology, Co., Ltd, China | CAS: 10034-99-8 |
| CaCl2.6H2O | Solarbio Biological Technology, Co., Ltd, China | CAS: 10043-52-4 |
| NaHCO3 | Solarbio Biological Technology, Co., Ltd, China | CAS: 144-55-8 |
| Tween 80 | Solarbio Biological Technology, Co., Ltd, China | CAS: 9005-65-6 |
| Glucose | Solarbio Biological Technology, Co., Ltd, China | CAS: 50-99-7 |
| Vitamin K1 | Solarbio Biological Technology, Co., Ltd, China | CAS: 84-80-0 |
| Cysteine HCl | Solarbio Biological Technology, Co., Ltd, China | CAS: 52-89-1 |
| Bile salts | Solarbio Biological Technology, Co., Ltd, China | CAS: 8008-63-7 |
| Critical commercial assays | ||
| Human allantoin ELISA Kit | Shanghai Jonln Biological Technology, Co., Ltd, China | JL-47385 |
| UA detection kit | Shanghai Jonln Biological Technology, Co., Ltd, China | JL-T1018 |
| D-lactate (D-Lac) and serum diamine oxidase (DAO) assay kit | Nanjing Jiancheng Biological Technology, Co., Ltd, China | H263-1-2 A088-1-1 |
| Urea nitrogen and creatinine assay kit | Nanjing Jiancheng Biological Technology, Co., Ltd, China | C013-2-1 C011-2-1 |
| Deposited data | ||
| Human serum, feces and urine samples | Pingliang Rehabilitation Center Hospital, Gansu, China | |
| 16S rRNA sequence data | National Center for Biotechnology Information | PRJNA818122 |
| Metabolomics data | MetaboLights | MTBLS4558 |
Resource availability
Lead contact
Further information and requests for resources and reagents should be directed to and will be fulfilled by the lead contact, Xiangkai Li (xkli@lzu.edu.cn).
Materials availability
All materials are from commercial sources and are widely available.
Experimental model and subject details
Totally 120 volunteers with high serum uric acid levels (>420 μmol/L) were collected from Pingliang city (Gansu, China). Basic anthropometric measurements (height, weight, gender, ages etc.) of all participants were recorded before the experiments. The urine, feces, and serum samples of all participants at the baseline and one-month intervals were subsequently collected by the Pingliang Rehabilitation Center Hospital. All samples were labeled with the participant identification number and transferred to the laboratory using dry ice. All samples were maintained at −80°C in the laboratory for further investigation. The number of men was higher than that of women in the two groups (3:1 in the CK yogurt group and 4:1 in the GR-3 yogurt group), and the average age was 38 (24–54) years and 41 (25–57) years, respectively.
Method details
Study design and human samples collection
We collected 120 volunteers with high serum uric acid levels (>420 μmol/L) from Pingliang city (Gansu, China). Then, the participants were randomly assigned to two independent cohorts: 60 volunteers as the control cohort with conventional yogurt and 60 as the test cohort with probiotic yogurt. Both yogurts contained L. bulgaricus and S. thermophiles, while the probiotic group also contained strain L. fermentum GR-3. The participants were instructed to drink 250-g yogurt daily (which contained at least 2.0 × 10¹² CFU/g of each bacterial strain) during two months experiment. All yogurt products in this study were made by a local dairy manufacturer and distributed to the participants. The treatment aims were kept a secret from both the researchers and participants. No participant used antibiotics or other probiotics during the experiment. The randomized and double-blind clinical trial for this investigation was approved by the Health Sciences Research ethics board of The First Hospital of Lanzhou University and was registered in the Chinese Clinical Trial Registry (Registration number: ChiCTR2100053287). All participants were enrolled between June 10, 2021 and July 20, 2021 and provided signed informed consent before experiments.
Uric acid and allantoin quantification
To break up the stool sample, the feces were combined with PBS buffer and vortexed for 5 min. Centrifugation at 2000 rpm for 5 min was used to collect the supernatant. Human urine and serum samples were heated to 60°C to eliminate urate deposits in preparation for testing. All samples were analyzed according to the manufacturer’s instructions for the UA detection kit (Nanjing Jiancheng Biological Technology, Co., Ltd, China). The in vitro culture of fecal materials was conducted as described previously (Yu et al., 2021). 15 mL of the processed fecal sample was placed in a jar along with 135-mL sterile basal growth medium (BGM). The composition of the BGM medium was 2-g/L peptone water, 2-g/L yeast extract, 0.1-g/L NaCl, 0.04-g/L K2HPO4, 0.04-g/L KH2PO4, 0.01-g/L MgSO4.7H2O, 0.01-g/L CaCl2.6H2O, 2-g/L NaHCO3, 2-mL Tween 80, 10-g/L glucose, 10-μL vitamin K1, 0.5-g/L cysteine HCl, and 0.5-g/L bile salts (pH 7.0). A circulating water jacket kept the vessel at 37°C, and nitrogen was added to maintain an anaerobic condition. As stated in the manufacturer’s instructions, the allantoin contents in urine and feces of the participants were measured using human allantoin ELISA Kit test kits (Shanghai Jonln Biological Technology, Co., Ltd, China).
Hematological parameters and biochemical indices
All participants' hematological parameters and biochemical indices were determined using serum samples. TNF-α and IL-6 levels were determined via enzyme-linked immunosorbent assay kits (mlbio, Shanghai, China), as stated in the manufacturer’s instructions. For the intestinal permeability test, d-lactate (D-Lac) and serum diamine oxidase (DAO) were detected using an assay kit (Nanjing Jiancheng Biological Technology, Co., Ltd, China) according to the manufacturer’s instructions. The urea nitrogen (BUN) and creatinine were measured using a test kit (Nanjing Jiancheng Biological Technology, Co., Ltd, China) to evaluate the renal function of the participants.
Real-time (RT) qPCR analysis
As stated in the manufacturer’s instructions, the fecal DNA after strain GR-3 intervention was extracted using the TIANamp Stool DNA kit (TIANGEN BIOTECH (BEIJING) CO., LTD.). The sequence of specific primers for strain GR-3 (Forward: ACGTATGAACAGTTACTCTCATACGT; Reverse: CCTGATTGATTTGGTCGCCAAC) was designed according to our previous study (Wu et al., 2021). The total bacteria of feces were performed universal primers (Forward: GCAGGCCTAACACATGCAAGTC; Reverse: CTGCTGCCTCCCGTAGGAGT). For RT-PCR performed, the DNA of GR-3 and total bacteria using the primers combined with TB GreenTM PCR Premix (TaKaRa, Japan) and reactions were run on a LightCycler 96 RT-PCR system (Applied Biosystems, USA). Then, we constructed standard curves with two different recombined pMD18T (TaKaRa, Japan) plasmids (E.Z.N.A., Omega, USA) with 103, 104, 105, 106, 107, 108, 109, and 1010 copies of the plasmids per reaction used for calibration as described previously (Peng et al., 2012). Cycling conditions were 95°C for 30 s, followed by 50 cycles of 95°C for 5 s, 60°C for 30 s, and 95°C for 10 s, 65–95°C for 5 s. The absolute number of copies of GR-3 and total bacteria in the same sample was estimated per the standard curve. The relative abundance of GR-3 was expressed as the copy number of GR-3/the copy number of total bacteria∗100.
16S rRNA amplification and analysis
The fecal DNA was extracted as described above. The DNA concentration was also detected using a NanoDrop™ spectrophotometer (Thermo Fisher Scientific, Waltham, MA, USA). The universal amplification primers, Bac 338F (5′-ACTCCTACGGGAGGCAGCAG-3′) and Bac 806R (5′-GGACTACHVGGGTWTCTAAT-3′), were used to target the hypervariable region V3-V4 of the 16S rRNA genes of microbes in the samples. Purification of the result following PCR amplification was accomplished using the DNA Gel Extraction Kit (OMEGA). The purified amplicons were sequenced using the Illumina MiSeq platform. QIIME was used to evaluate the 16S rRNA sequencing data of the gut microbiota (Quantitative Insights into Microbial Ecology, v1.8.0).
Metabolism analysis of serum, urine, and fecal samples
The serum and urine samples (100 mL) were completely mixed with 300-mL methanol before being ultrasonicated at 4°C for 30 min, incubated at −40°C for 1 h, and vortexed for 30 s. For the fecal samples, approximately 50 mg of fecal samples were transferred into 2 mL centrifuge tubes and added 800 μL of 80% methanol, then, the mixture was ground for 90 s at 70 Hz with an automatic liquid nitrogen tissue freezing grinder (JXFSTPRP-II-01, Shanghai Jingxin, China). Then, the tubes were ultrasound at 4°C for 30 min. All pretreatment serum, urine, and fecal samples were standing for 0.5 h at 4°C and centrifuged (12,000 rpm, 15 min, 4°C) to collect the supernatant. Then, 5-μL 0.14-mg/mL DL-o-Chlorophenylalanine was added to 200 μL of the supernatant for a test. Untargeted metabolomics was performed using an LC-MS test detector (Waters, UPLC; Thermo, Q Exactive) according to a previous study (Cui et al., 2013). The associations between blood, urine, and fecal metabolites and the gut microbiota were evaluated using Spearman correlation analysis. To build the global network patterns, 16S amplicon sequencing and metabolomic data were initially pooled together in each group.
Quantification and statistical analysis
The study data were statistically analyzed using GraphPad Prism 8.0. The normal distribution was tested using Anderson-darling. When the data is in normal distribution (p > 0.1), Student’s t-test (two tail, unpaired) was used for two groups’ comparison, and ANOVA with Bonferroni post-test was used for multiple groups’ comparison. For the data with unknown overall distribution, Kruskal-Wallis test was used, and p values were corrected using a Benjamini-Hochberg false discovery rate correction method. Kaplan-Meier analysis and log rank test were used to analyze survivability.
Acknowledgments
We thank all patients and their families for their dedication to this study. We also thank the clinical staff for their dedication to saving lives and collecting samples. This study was supported by the National Natural Science Foundation of China (No. 31870082 and 32070117) and Gansu Association for Science and Technology Innovation-Driven Boosting Project (No: GKX20210506-16-5).
Author contributions
X.L. was involved in the manuscript’s conceptualization and design. S.Z. performed the study and wrote the manuscript. Data collection and statistical analysis were assisted by P.F. The data were gathered by X.H. and W.C. H.H. and W.J. oversaw the research, helped to revise the text, and made helpful comments. The manuscript was critically amended by all of the authors, and the final version was approved by them all.
Declaration of interests
The authors declare no competing interests. Informed consent was obtained from all subjects involved in the study.
Published: October 21, 2022
Footnotes
Supplemental information can be found online at https://doi.org/10.1016/j.isci.2022.105198.
Contributor Information
Huawen Han, Email: hhw@lzu.edu.cn.
Weilin Jin, Email: ldyy_jinwl@lzu.edu.cn.
Xiangkai Li, Email: xkli@lzu.edu.cn.
Supplemental information
Data and code availability
-
•
The 16S rRNA sequence data have been deposited at the National Center for Biotechnology Information (NCBI) under the accession number PRJNA818122. The raw data for serum and feces metabolomics can be found in the MetaboLights database under the accession number MTBLS4558.
-
•
This paper does not report the original code.
-
•
Any additional information required to reanalyze the data reported in this paper is available from the lead contact upon request.
References
- Agnoletti D., Cicero A.F.G., Borghi C. The impact of uric acid and hyperuricemia on cardiovascular and renal systems. Cardiol. Clin. 2021;39:365–376. doi: 10.1016/j.ccl.2021.04.009. [DOI] [PubMed] [Google Scholar]
- Ahn S.O., Ohtomo S., Kiyokawa J., Nakagawa T., Yamane M., Lee K.J., Kim K.H., Kim B.H., Tanaka J., Kawabe Y., Horiba N. Stronger uricosuric effects of the novel selective URAT1 inhibitor UR-1102 lowered plasma urate in tufted capuchin monkeys to a greater extent than benzbromarone. J. Pharmacol. Exp. Ther. 2016;357:157–166. doi: 10.1124/jpet.115.231647. [DOI] [PubMed] [Google Scholar]
- Álvarez-Lario B., Macarrón-Vicente J. Uric acid and evolution. Rheumatology. 2010;49:2010–2015. doi: 10.1093/rheumatology/keq204. [DOI] [PubMed] [Google Scholar]
- Anhê F.F., Roy D., Pilon G., Dudonn S., Matamoros S., Varin T.V., Garofalo C., Moine Q., Desjardins Y., Levy E., Marette A. A polyphenol-rich cranberry extract protects from diet-induced obesity, insulin resistance and intestinal inflammation in association with increased Akkermansia spp. population in the gut microbiota of mice. Gut. 2015;64:872–883. doi: 10.1136/gutjnl-2014-307142. [DOI] [PubMed] [Google Scholar]
- Azevedo V.F., Kos I.A., Vargas-Santos A.B., da Rocha Castelar Pinheiro G., Dos Santos Paiva E. Benzbromarone in the treatment of gout. Adv. Rheumatol. 2019;59 doi: 10.1186/s42358-019-0080-x. [DOI] [PubMed] [Google Scholar]
- Bardin T., Richette P. Definition of hyperuricemia and gouty conditions. Curr. Opin. Rheumatol. 2014;26:186–191. doi: 10.1097/BOR.0000000000000028. [DOI] [PubMed] [Google Scholar]
- Barengolts E., Smith E.D., Reutrakul S. The effect of probiotic yogurt on glycemic control in type 2 diabetes or obesity: a meta-analysis of nine randomized controlled trials. Nutrients. 2019;11 doi: 10.3390/nu11030671. [DOI] [PMC free article] [PubMed] [Google Scholar]
- Becker M.A., Schumacher H.R., Wortmann R.L., Macdonald P.A., Eustace D., Palo W.A., Streit J., Joseph-Ridge N. Febuxostat compared with allopurinol in patients with hyperuricemia and gout. N. Engl. J. Med. 2005;353:2450–2461. doi: 10.1056/NEJMoa050373. [DOI] [PubMed] [Google Scholar]
- Bian M., Wang J., Wang Y., Nie A., Zhu C., Sun Z., Zhou Z., Zhang B. Chicory ameliorates hyperuricemia via modulating gut microbiota and alleviating LPS/TLR4 axis in quail. Biomed. Pharmacother. 2020;131:110719. doi: 10.1016/j.biopha.2020.110719. [DOI] [PubMed] [Google Scholar]
- Cao T., Li X., Mao T., Liu H., Zhao Q., Ding X., Li C., Zhang L., Tian Z. Probiotic therapy alleviates hyperuricemia in C57BL/6 mouse model. Biomed. Res. 2017;28:2244–2249. [Google Scholar]
- Chaudhary K., Malhotra K., Sowers J., Aroor A. Uric acid - key ingredient in the recipe for cardiorenal metabolic syndrome. Cardiorenal. Med. 2013;3:208–220. doi: 10.1159/000355405. [DOI] [PMC free article] [PubMed] [Google Scholar]
- Choi H.K., Atkinson K., Karlson E.W., Willett W., Curhan G. Purine-rich foods, dairy and protein intake, and the risk of gout in men. N. Engl. J. Med. 2004;350:1093–1103. doi: 10.1056/NEJMoa035700. [DOI] [PubMed] [Google Scholar]
- Cui L., Lee Y.H., Kumar Y., Xu F., Lu K., Ooi E.E., Tannenbaum S.R., Ong C.N. Serum metabolome and lipidome changes in adult patients with primary dengue infection. PLoS Negl. Trop. Dis. 2013;7:e2373. doi: 10.1371/journal.pntd.0002373. [DOI] [PMC free article] [PubMed] [Google Scholar]
- Dalbeth N., Merriman T.R., Stamp L.K. Gout. Lancet. 2016;388:2039–2052. doi: 10.1016/S0140-6736(16)00346-9. [DOI] [PubMed] [Google Scholar]
- de Oliveira E.P., Burini R.C. High plasma uric acid concentration: causes and consequences. Diabetol. Metab. Syndrome. 2012;4:12. doi: 10.1186/1758-5996-4-12. [DOI] [PMC free article] [PubMed] [Google Scholar]
- Ebrahimpour-Koujan S., Saneei P., Larijani B., Esmaillzadeh A. Consumption of sugar sweetened beverages and dietary fructose in relation to risk of gout and hyperuricemia: a systematic review and meta-analysis. Crit. Rev. Food Sci. Nutr. 2020;60:1–10. doi: 10.1080/10408398.2018.1503155. [DOI] [PubMed] [Google Scholar]
- Finco D.R., Duncan J.R. Evaluation of blood urea nitrogen and serum creatinine concentrations as indicators of renal dysfunction: a study of 111 cases and a review of related literature. J. Am. Vet. Med. Assoc. 1976;168:593–601. [PubMed] [Google Scholar]
- Hamilton M.K., Boudry G., Lemay D.G., Raybould H.E. Changes in intestinal barrier function and gut microbiota in high-fat diet-fed rats are dynamic and region dependent. Am. J. Physiol. Gastrointest. Liver Physiol. 2015;308:G840–G851. doi: 10.1152/ajpgi.00029.2015. [DOI] [PMC free article] [PubMed] [Google Scholar]
- Hu A.M., Brown J.N. Comparative effect of allopurinol and febuxostat on long-term renal outcomes in patients with hyperuricemia and chronic kidney disease: a systematic review. Clin. Rheumatol. 2020;39:3287–3294. doi: 10.1007/s10067-020-05079-3. [DOI] [PubMed] [Google Scholar]
- Iswantini D., Nurhidayat N., Trivadila, Widiyatmoko O. Activity and stability of uricase from Lactobacillus plantarum immobilizated on natural zeolite for uric acid biosensor. Pak J. Biol. Sci. 2014;17:277–281. doi: 10.3923/pjbs.2014.277.281. [DOI] [PubMed] [Google Scholar]
- Iwadate Y., Kato J.I. Identification of a formate-dependent uric acid degradation pathway in Escherichia coli. J. Bacteriol. 2019;201 doi: 10.1128/JB.00573-18. [DOI] [PMC free article] [PubMed] [Google Scholar]
- Jayachandran M., Chung S.S.M., Xu B. A critical review of the relationship between dietary components, the gut microbe Akkermansia muciniphila, and human health. Crit. Rev. Food Sci. Nutr. 2020;60:2265–2276. doi: 10.1080/10408398.2019.1632789. [DOI] [PubMed] [Google Scholar]
- Juraschek S., Kovell L., Miller E., Gelber A. Dose-response association of uncontrolled blood pressure and cardiovascular disease risk factors with hyperuricemia and gout. PLoS One. 2013;8:e56546. doi: 10.1371/journal.pone.0056546. [DOI] [PMC free article] [PubMed] [Google Scholar]
- Kaneko K., Aoyagi Y., Fukuuchi T., Inazawa K., Yamaoka N. Total purine and purine base content of common foodstuffs for facilitating nutritional therapy for gout and hyperuricemia. Biol. Pharm. Bull. 2014;37:709–721. doi: 10.1248/bpb.b13-00967. [DOI] [PubMed] [Google Scholar]
- Kano H., Yamada N., Saito C., Murayama-Chiba Y., Asami Y., Ito H. Lactobacillus gasseri PA-3, but not L. gasseri OLL2996, reduces the absorption of purine nucleosides in rats. Nucleosides Nucleotides Nucleic Acids. 2018;37:353–360. doi: 10.1080/15257770.2018.1469760. [DOI] [PubMed] [Google Scholar]
- Keebaugh A.C., Thomas J.W. The evolutionary fate of the genes encoding the purine catabolic enzymes in hominoids, birds, and reptiles. Mol. Biol. Evol. 2010;27:1359–1369. doi: 10.1093/molbev/msq022. [DOI] [PMC free article] [PubMed] [Google Scholar]
- Kuo Y.-W., Hsieh S.-H., Chen J.-F., Liu C.-R., Chen C.-W., Huang Y.-F., Ho H.-H. Lactobacillus reuteri TSR332 and Lactobacillus fermentum TSF331 stabilize serum uric acid levels and prevent hyperuricemia in rats. PeerJ. 2021;9:e11209. doi: 10.7717/peerj.11209. [DOI] [PMC free article] [PubMed] [Google Scholar]
- Lee H., Lee Y., Kim J., An J., Lee S., Kong H., Song Y., Lee C.K., Kim K. Modulation of the gut microbiota by metformin improves metabolic profiles in aged obese mice. Gut Microb. 2018;9:155–165. doi: 10.1080/19490976.2017.1405209. [DOI] [PMC free article] [PubMed] [Google Scholar]
- Ley R.E., Turnbaugh P.J., Klein S., Gordon J.I. Human gut microbes associated with obesity. Nature. 2006;444:1022–1023. doi: 10.1038/4441022a. [DOI] [PubMed] [Google Scholar]
- Li M., Yang D., Mei L., Yuan L., Xie A., Yuan J. Screening and characterization of purine nucleoside degrading lactic acid bacteria isolated from Chinese sauerkraut and evaluation of the serum uric acid lowering effect in hyperuricemic rats. PLoS One. 2014;9:e105577. doi: 10.1371/journal.pone.0105577. [DOI] [PMC free article] [PubMed] [Google Scholar]
- Liu X., Lv Q., Ren H., Gao L., Zhao P., Yang X., Yang G., Xu D., Wang G., Yang W., et al. The altered gut microbiota of high-purine-induced hyperuricemia rats and its correlation with hyperuricemia. PeerJ. 2020;8:e8664. doi: 10.7717/peerj.8664. [DOI] [PMC free article] [PubMed] [Google Scholar]
- Martínez-Reyes I., Chandel N.S. Mitochondrial TCA cycle metabolites control physiology and disease. Nat. Commun. 2020;11:102. doi: 10.1038/s41467-019-13668-3. [DOI] [PMC free article] [PubMed] [Google Scholar]
- Mattiuzzi C., Lippi G. Recent updates on worldwide gout epidemiology. Clin. Rheumatol. 2020;39:1061–1063. doi: 10.1007/s10067-019-04868-9. [DOI] [PubMed] [Google Scholar]
- Merriman T.R., Dalbeth N. The genetic basis of hyperuricaemia and gout. Joint Bone Spine. 2011;78:35–40. doi: 10.1016/j.jbspin.2010.02.027. [DOI] [PubMed] [Google Scholar]
- Pavelcova K., Bohata J. Evaluation of the influence of genetic variants of SLC2A9 (GLUT9) and SLC22A12 (URAT1) on the development of hyperuricemia and gout. J. Clin. Med. 2020;9 doi: 10.3390/jcm9082510. [DOI] [PMC free article] [PubMed] [Google Scholar]
- Peng J., Sarkar S., Chang S.L. Opioid receptor expression in human brain and peripheral tissues using absolute quantitative real-time RT-PCR. Drug Alcohol Depend. 2012;124:223–228. doi: 10.1016/j.drugalcdep.2012.01.013. [DOI] [PMC free article] [PubMed] [Google Scholar]
- Poon S.H., Hall H.A., Zimmermann B. Approach to the treatment of hyperuricemia. Med. Health R. I. 2009;92:359–362. [PubMed] [Google Scholar]
- Shi L.H., Balakrishnan K., Thiagarajah K., Mohd Ismail N.I., Yin O.S. Beneficial properties of probiotics. Trop. Life Sci. Res. 2016;27:73–90. doi: 10.21315/tlsr2016.27.2.6. [DOI] [PMC free article] [PubMed] [Google Scholar]
- Sundy J.S., Hershfield M.S. Uricase and other novel agents for the management of patients with treatment-failure gout. Curr. Rheumatol. Rep. 2007;9:258–264. doi: 10.1007/s11926-007-0041-y. [DOI] [PubMed] [Google Scholar]
- Tasic V., Janchevska A., Emini N., Sahpazova E., Gucev Z., Polenakovic M. Chronic kidney disease - pediatric risk factors. Pril (Makedon Akad Nauk Umet Odd Med Nauki) 2016;37:9–13. doi: 10.1515/prilozi-2016-0003. [DOI] [PubMed] [Google Scholar]
- Wang H., Mei L., Deng Y., Liu Y., Wei X., Liu M., Zhou J., Ma H., Zheng P., Yuan J., Li M. Lactobacillus brevis DM9218 ameliorates fructose-induced hyperuricemia through inosine degradation and manipulation of intestinal dysbiosis. Nutrition. 2019;62:63–73. doi: 10.1016/j.nut.2018.11.018. [DOI] [PubMed] [Google Scholar]
- Wu G., Xiao X., Feng P., Xie F., Yu Z., Yuan W., Liu P., Li X. Gut remediation: a potential approach to reducing chromium accumulation using Lactobacillus plantarum TW1-1. Sci. Rep. 2017;7:15000. doi: 10.1038/s41598-017-15216-9. [DOI] [PMC free article] [PubMed] [Google Scholar]
- Wu Y., Ye Z., Feng P., Li R., Chen X., Tian X., Han R., Kakade A., Liu P., Li X. Limosilactobacillus fermentum JL-3 isolated from “Jiangshui” ameliorates hyperuricemia by degrading uric acid. Gut Microb. 2021;13:1–18. doi: 10.1080/19490976.2021.1897211. [DOI] [PMC free article] [PubMed] [Google Scholar]
- Xu G., Luo K., Liu H., Huang T., Fang X., Tu W. The progress of inflammation and oxidative stress in patients with chronic kidney disease. Ren. Fail. 2015;37:45–49. doi: 10.3109/0886022X.2014.964141. [DOI] [PubMed] [Google Scholar]
- Yamada N., Saito-Iwamoto C., Nakamura M., Soeda M., Chiba Y., Kano H., Asami Y. Lactobacillus gasseri PA-3 Uses the purines IMP, inosine and hypoxanthine and reduces their absorption in rats. Microorganisms. 2017;5 doi: 10.3390/microorganisms5010010. [DOI] [PMC free article] [PubMed] [Google Scholar]
- Yamanaka H. Japanese guideline for the management of hyperuricemia and gout: second edition. Nucleosides Nucleotides Nucleic Acids. 2011;30:1018–1029. doi: 10.1080/15257770.2011.596496. [DOI] [PubMed] [Google Scholar]
- Yu L., Duan H., Kellingray L., Cen S., Tian F., Zhao J., Zhang H., Gall G.L., Mayer M.J., Zhai Q., et al. Lactobacillus plantarum-mediated regulation of dietary aluminum induces changes in the human gut microbiota: an in vitro colonic fermentation study. Probiotics and Antimicrob Proteins. 2021;13:398–412. doi: 10.1007/s12602-020-09677-0. [DOI] [PubMed] [Google Scholar]
- Zhang F., Liu Z., Jiang L., Zhang H., Zhao D., Li Y., Zou H., Wang X., Li X., Shi B., et al. A randomized, double-blind, non-inferiority study of febuxostat versus allopurinol in hyperuricemic Chinese subjects with or without gout. Rheumatol. Ther. 2019;6:543–557. doi: 10.1007/s40744-019-00173-8. [DOI] [PMC free article] [PubMed] [Google Scholar]
- Zhao H., Lu Z., Lu Y. The potential of probiotics in the amelioration of hyperuricemia. Food Funct. 2022;13:2394–2414. doi: 10.1039/d1fo03206b. [DOI] [PubMed] [Google Scholar]
Associated Data
This section collects any data citations, data availability statements, or supplementary materials included in this article.
Supplementary Materials
Data Availability Statement
-
•
The 16S rRNA sequence data have been deposited at the National Center for Biotechnology Information (NCBI) under the accession number PRJNA818122. The raw data for serum and feces metabolomics can be found in the MetaboLights database under the accession number MTBLS4558.
-
•
This paper does not report the original code.
-
•
Any additional information required to reanalyze the data reported in this paper is available from the lead contact upon request.