

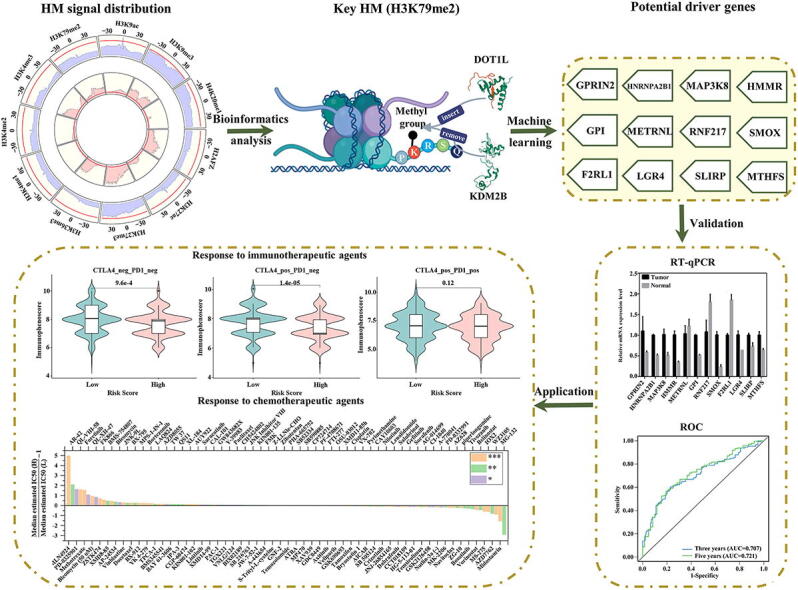
Graphical abstract
Keywords: Lung adenocarcinoma, Gene expression, H3K79me2, Driver genes
Highlights
-
•
The efficacy of H3K79me2 on gene expression regulation is affirmed in LUAD.
-
•
An open-source algorithm for identifying LUAD-related driver genes is presented.
-
•
12 H3K79me2-targeted driver genes with clinical values are verified by qPCR.
-
•
The regions with obvious H3K79me2 signals changes on driver genes are pinpointed.
Abstract
Lung adenocarcinoma is a malignancy with a low overall survival and a poor prognosis. Studies have shown that lung adenocarcinoma progression relates to locus-specific/global changes in histone modifications. To explore the relationship between histone modification and gene expression changes, we focused on 11 histone modifications and quantitatively analyzed their influences on gene expression. We found that, among the studied histone modifications, H3K79me2 displayed the greatest impact on gene expression regulation. Based on the Shannon entropy, 867 genes with differential H3K79me2 levels during tumorigenesis were identified. Enrichment analyses showed that these genes were involved in 16 common cancer pathways and 11 tumors and were target-regulated by trans-regulatory elements, such as Tp53 and WT1. Then, an open-source computational framework was presented (https://github.com/zlq-imu/Identification-of-potential-LUND-driver-genes). Twelve potential driver genes were extracted from the genes with differential H3K79me2 levels during tumorigenesis. The expression levels of these potential driver genes were significantly increased/decreased in tumor cells, as assayed by RT–qPCR. A risk score model comprising these driver genes was further constructed, and this model was strongly negatively associated with the overall survival of patients in different datasets. The proportional hazards assumption and outlier test indicated that this model could robustly distinguish patients with different survival rates. Immune analyses and responses to immunotherapeutic and chemotherapeutic agents showed that patients in the high and low-risk groups may have distinct tendencies for clinical selection. Finally, the regions with clear H3K79me2 signal changes on these driver genes were accurately identified. Our research may offer potential molecular biomarkers for lung adenocarcinoma treatment.
1. Introduction
Lung adenocarcinoma (LUAD) is a cancer that occurs due to abnormal and uncontrolled cell growth in the lung, usually in the peripheral lung [1]. As the most common histological type of non-small cell lung cancer, the incidence and mortality of LUAD are increasing in China, accounting for 40% of all lung cancers [2]. In recent decades, although many strategies have been developed, such as chemotherapy, targeted agents and immunotherapy, the 5-year survival rate of LUAD remains below 20% [3]. Therefore, further understanding the molecular mechanisms of LUAD tumorigenesis and identifying the oncogenic drivers of LUAD have attracted wide attention.
Epigenetic disorders are considered markers of cancer development and progression. Abnormalities in epigenetic modifications can be observed in gene promoters, gene coding regions and other functional elements [4], [5]. Locus-specific changes in histone modifications (HMs) can adversely affect the expression of nearby genes. Global changes in specific HMs can define previously unrecognized subgroups of cancer patients [6]. Recent studies have reported that elevated H3K27me3 levels in the promoter region of FTO inhibit FTO expression. Down-regulated FTO expression significantly increases the m6A modifications on MYC, resulting in the binding of YTHDF1 to promote MYC mRNA translation and LUAD tumor cell glycolysis and growth [7]. The loss of H3K4me3 is associated with defects in activation-induced cytidine deaminase-induced DNA breakage and reduces mutation frequencies in LUAD-related genes, such as MALAT1 and SNHG3 [8]. Genome-wide loss of histone acetylation can induce tumor suppressor gene silencing and abnormal transcription, and this mechanism has emerged as a promising therapeutic target for numerous cancers [9], [10]. H3K36me3 inhibits tumor growth by suppressing CXCL1-mediated cell cycle activation in LUAD [11]. In addition, high LUAD incidence rates are related to genetic alterations and outdoor pollution [12], [13], and HMs can establish a link between genetic background and environmental exposure [14]. Thus, abnormal HM patterns can serve as clinical tools or predictive biomarkers to assist clinical choices of treatment strategies. As an essential HM, H3K79me2 is associated with transcriptional regulation, maintenance of enhancer-promoter interactions, DNA replication initiation and DNA damage responses [15], [16]. It also plays important regulatory roles in MLL-rearranged leukemia [17], breast cancer [18] and colorectal cancer [19]. Not surprisingly, the broad roles of H3K79me2 make it increasingly important, and thus, it may become a critical therapeutic target for various cancers.
Based on these findings, we hoped to identify the HM with the greatest effect on gene expression regulation in LUAD. Therefore, we first calculated the distribution patterns of 11 HMs shared by LUAD tumor and normal cells and quantitatively assessed the influences of HM signal changes on LUAD-related gene expression. On this basis, the genes with differential H3K79me2 levels during tumorigenesis were screened. An open-source computational framework was presented to extract potential LUAD driver genes (PLDGs) from the genes with differential H3K79me2 levels during tumorigenesis. Then, the relative expression levels of PLDGs in LUAD tumor and normal cells were detected by RT–qPCR. To accelerate clinical applications, the expression values of PLDGs in the TCGA cohort were transformed into a risk score model. The reliability of the model was assessed via the proportional hazards (PH) assumption and outlier test and validated in a GEO cohort. Moreover, the infiltration levels of immune cells and responses to therapeutic agents for LUAD patients in the high- and low-risk groups were evaluated. Finally, by refocusing on the signal distributions of H3K79me2 on the 12 PLDGs, we accurately located the regions where H3K79me2 signals were significantly altered.
2. Materials and methods
2.1. Data
Human reference genome annotation data (GRCH38) are available in the UCSC Genome Browser (https://genome.ucsc.edu/). Protein-coding genes were extracted. For genes with multiple transcripts, only one transcript was randomly retained.
The genome-wide profiles of 11 HMs and polyA+ RNA-seq data for A549 cells (LUAD cells, tumor) and IMR90 cells (lung fibroblasts cells, normal) were indexed from the ENCODE database (https://www.encodeproject.org/). Their corresponding accession numbers are provided in Supplementary file Table S1. Gene expression levels were normalized using transcripts per million [20].
Raw clinical profiles and RNA-seq data for patients with LUAD were retrieved from the TCGA dataset (https://portal.gdc.cancer.gov/). 475 cancer samples and 27 normal samples with survival and clinical information were included. Gene expression levels were standardized by transcripts per million. The neoantigen data of LUAD patients in the TCGA dataset were separated from The Cancer Immunome Atlas (https://tcia.at/). In addition, an independent GEO dataset (GSE30219) containing clinical and microarray data of 307 LUAD patients was indexed at https://www.ncbi.nlm.nih.gov/geo/. The microarray data were background-corrected and quantile-normalized using the robust multiarray average algorithm.
2.2. Formulation of histone modification signals
To analyze the distributions of HMs and evaluate their roles, we extracted the +/- 5 kb region around the transcription start site (TSS) and divided the region into 100 bins with a size of 100 bp. The signals of HMs within normal and tumor samples were normalized by Eq. (1), as described in our previous studies [21].
| (1) |
where denotes the l-th HM signal in the i-bin of the j-th gene within the m-th sample, describes the read counts of the l-th HM mapped into the i-bin of the j-th gene in the m-th sample, and is the total read counts of the l-th HM in the m-th sample. 100 bp is the length of the j-th bin.
Meanwhile, we quantified the l-th HM signal level in the -5∼+5 kb DNA region flanking the TSS by Eq. (2) to explore the impacts of HM combinations on LUAD-related gene expression.
| (2) |
where represents the signal of the l-th HM in the j-th gene of the m-th sample, and denotes the l-th HM read counts mapped into the -5∼+5 kb DNA region in the j-th gene within the m-th sample. Then, 10,000 bp describes the length of the DNA region.
2.3. Selection and prediction of differentially expressed genes (DEGs)
The DEGs between LUAD tumor and normal cells were identified by the ‘DESeq2’ R package. As a result, 3404 up-regulated DEGs (up-DEGs) and 3477 down-regulated DEGs (down-DEGs) were obtained with an adjusted p < 0.01 and |log2(FC)|>1.
To assess the effects of HMs on LUAD-related gene expression changes, the DEGs were randomly split into two sets: two-thirds were used as the training set, and the rest were selected as the validation set. The random forest (RF) algorithm was applied in the training dataset and testing dataset to discriminate up-DEGs from down-DEGs. The signal changes of each HM in the 100 bins, the signal changes of 11 HMs in the DNA regions flanking the TSS (-5 to 5 kb), or the signal changes of 11 HMs in the same bin during tumorigenesis were selected as the information parameters. In this process, the number of decision trees was set to 800, and the number of information parameters for the best split at each node was sqrt(p), where p was the number of information parameters. 10-fold cross validation method was adopted to test the prediction quality. The averaged receiver operating characteristic curve (AUC) was used to measure the impacts of HM signals on LUAD-related gene expression changes. To avoid any potential bias, the general linear model (GLM) and support vector machine (SVM) algorithms with default settings as described in ref. [22] were adopted to validate the analytical results.
2.4. Identification of genes with differential H3K79me2 levels during tumorigenesis
To recognize genes with differential H3K79me2 levels during tumorigenesis, the following strategies were adopted (as shown in Supplementary file Fig. S1A):
Fig. 1.

Correlation analysis of HM signals and gene expression. (A, C) Up-DEGs, (B, D) Down-DEGs. (A, B) HM signal changes (purple bars) and significant differences (pink bars) during LUAD tumorigenesis. The red lines in the 1st and 2nd circles correspond to the change ratio of HM signal = 1 and –log10(P value) = 2. (C, D) Spearman correlation coefficients between gene expression changes and HM signal changes in each of the 100 bins. (For interpretation of the references to colour in this figure legend, the reader is referred to the web version of this article.)
(i) In the m-th sample, the mean () and standard deviation () of were calculated for all genes, and the that was greater than three standard deviations from the mean was replaced by ;
(ii) The minimum () and maximum () values of were used to standardize H3K79me2 levels as , which ranged from 0 to 1;
| (3) |
(iii) For the j-th gene, the standardized H3K79me2 levels across the n samples of LUAD tumor and normal cells were quantified as , and the Shannon entropy () was measured through Eq.(4);
| (4) |
(iv) Genes with < 2.239 were dubbed as the genes with differential H3K79me2 levels in tumorigenesis [23], [24].
2.5. Extraction of potential LUAD driver genes (PLDGs)
By combining the genes with differential H3K79me2 levels in tumorigenesis, RNA-Seq data and clinical profiles from the TCGA cohort, an integrated tool for identifying PLDGs was presented. First, univariate Cox analysis was employed to estimate the relationship between each gene with differential H3K79me2 levels in tumorigenesis and survival time, and the genes with P values < 0.05 were retained as survival-related seed genes (Supplementary file Fig. S1B). Second, the stepwise regression analysis indexed the seed gene that had the strongest prediction power for survival time. Then, all seed genes were added or removed one by one to achieve better prediction accuracy and statistical significance. Finally, the optimal genes were identified based on the lowest Akaike information criteria (AIC) (Supplementary file Fig. S1C). Third, the least absolute shrinkage and selection operator (LASSO) model of the correlation between the expression of optimal genes and survival time was fitted to obtain the weighted coefficient for each gene. Here, the model was achieved by the ‘glmnet’ function with the parameters alpha = 1, nlamda = 100 and lambda.min.ratio = 0.2. Then, leave-10%-out cross-validation was used to test the fitting results. This fitting process was repeated 1000 times, and genes with non-zero coefficients in > 950 iterations were retained as PLDGs (Supplementary file Fig. S1D). The available R scripts and sample data have been deposited in https://github.com/zlq-imu/Identification-of-potential-LUND-driver-genes.
2.6. Cell culture
The A549 and IMR90 cell lines were purchased from the BeNa Culture Collection (Henan, China). These cells were maintained in DMEM medium (GIBCO BRL, USA) supplemented with 10% fetal bovine serum (GIBCO BRL, USA) at 37 °C and 5% CO2. The medium was changed every 2 days. Once cell confluence reached 80%, these cells were digested with 0.25% trypsin and then passaged. Third-generation cells were incubated in 6-well plates and prepared into cell suspensions with a cell density of 2 × 10⁶, which were then cultured for 24 h to form monolayer cells.
2.7. RNA extraction
In each well, the culture solution was discarded, and 1 ml of TRIzol reagent (Invitrogen, USA) was added and shaken three times within 15 min. Next, 0.2 ml of chloroform was supplemented and mixed. This mixture was incubated for 3 min at room temperature, followed by centrifugation at 12,000×g for 15 min at 4 °C. The upper phase was subsequently collected in a new tube, and 0.5 ml of isopropyl alcohol was added and incubated for 10 min. After centrifugation at 12,000×g for 10 min at 4 °C, the pellet was washed with 1 ml of 75% ethanol, vortexed and centrifuged at 7,500×g for 5 min at 4 °C. The resultant pellet was dried and dissolved in 50 μl of DEPC-treated H2O at 55 °C for 10 min.
2.8. cDNA synthesis
For A549/IMR90 cell lines, 13.5 μl of the RNA mixtures (1.0 μl RNA, 1.0 μl OligodT primer (100 pmol/μl) and DEPC-treated H2O) were subjected to the following conditions: primer extension (5 min, 25 °C), denaturation (10 min, 65 °C), and ice bath (2 min). Then, 4.0 μl of 5× buffer, 1.0 μl of dNTPs (10 mmol/l; Takara, Japan), 0.5 μl of RNasin (40 U/μl; Takara, Japan) and 1.0 μl of M−MLV (200 U/μl; Takara, Japan) were added to the mixtures and incubated for 30 min at 42 °C to synthesize cDNA. Finally, the mixtures were heat-inactivated (70 °C, 10 min) and stored at −20 °C.
2.9. RT–qPCR validation
The expression of PLDGs in LUAD tumor and normal cell lines was tested via RT–qPCR. The reaction conditions were as follows: initial denaturation (94 °C, 4 min), followed by 40 cycles of denaturation (94 °C, 30 s), annealing (60 °C, 30 s) and extension (72 °C, 30 s). GAPDH was used as the internal reference. was used to calculate the relative expression levels [25]. Three biological replicates were performed for all qPCRs using SYBR Premix Ex Taq (Takara, Japan). The RT–qPCR primer sequences for the PLDGs and GAPDH are listed in Supplementary file Table S2.
2.10. Gene set enrichment analysis
Pathway enrichment analysis of the genes with differential H3K79me2 levels during tumorigenesis was performed by the ‘Metascape’ [26]. Terms with P values < 0.01, containing at least 3 genes, and enrichment of observed/expected gene counts > 1.5 were collected and grouped according to their membership similarities. The top 20 terms with similarities > 0.3 were connected and visualized using the Cytoscape [27]. Common human diseases associated with the genes with differential H3K79me2 levels were retrieved via the DisGeNET database [28]. Trans-regulatory elements targeting these genes with differential H3K79me2 levels were uncovered through the TRRUST database [29].
2.11. Statistical analysis
Patients were divided into either the high- or the low-risk group according to the optimal cut-off of risk score and ascertained by the ‘surv_cutpoint’ function. Kaplan–Meier survival curves were plotted to show the survival distribution differences between the high- and low-risk patient groups via the ‘survfit’ and ‘survdiff’ functions, and P values were computed by the log-rank test. Univariate and multivariate Cox analyses for the clinical characteristics, PLDGs and the risk score model were performed through the ‘coxph’ function. RF, GLM and SVM algorithms were selected to train models and implemented via the ‘randomForest’, ‘mlr’ and ‘e1071’ R packages. Stepwise regression analysis was conducted through the ‘step’ function. Time-dependent receiver-operating characteristic (ROC) curves were drawn by the ‘timeROC’ function. The PH assumption for each PLDG was checked by scaled Schoenfeld residuals and achieved by the ‘cox.zph’ function. The outlier test for each PLDG was assessed by DFbeta residuals statistics and implemented by the ‘ggcoxdiagnostics’ function. The 50% inhibiting concentration (IC50) values for 251 chemotherapy agents were inferred using the pRRophetic algorithm. Patient responses to immunotherapy agents were quantified by immunophenoscore. Correlations were calculated by the Spearman method, and P values were evaluated via the t-test. All statistical analyses were conducted in R version 4.0.1.
3. Results
3.1. Histone modification signals are strongly correlated with gene expression
Recent pathological studies have shown that changes in HMs can affect LUAD progression [30], [31], [32]. Hence, to explore the relationship between HMs and gene expression, we first screened the DEGs and defined HM signal changes as the ratios of average HM signals in tumor cells to those in normal cells (purple parts in Fig. 1A and 1B). The significant differences of HM signals in LUAD tumor and normal cells were examined and -log10-transformed (pink parts in Fig. 1A and 1B). For the up-DEGs (Fig. 1A), some HMs, such as H3K79me2 and H3K9ac, were markedly enhanced in tumor cells, with P values < 0.01 in all bins. H3K27me3 was significantly reduced in tumor cells (P values < 0.01 in all bins). For the down-DEGs (Fig. 1B), almost all HMs including H3K79me2 decreased remarkably in tumor cells with P values < 0.01 in nearly all bins.
Furthermore, we calculated the correlation between the HM signal and gene expression in each of the 100 bins using the Spearman method. For the up-DEGs, the effects of HM signal changes on gene expression changes were stronger in the proximal regions of TSS than those in the distal regions (Fig. 1C). Regarding the down-DEGs, HM signal changes in the distal regions of TSS contributed more to gene expression changes than those in the proximal regions (Fig. 1D).
3.2. H3K79me2 may contribute more to gene expression regulation
Although HMs cooperatively regulate gene expression, their physiological importance is not the same [33], [34]. To reveal the influences of HMs on LUAD-related gene expression, we performed three experiments based on the ratios of averaged HM signals in tumor cells to those in normal cells. First, to determine which HM plays the most important role in LUAD-related gene expression, we used the signal ratios of each HM in the 100 bins as the features to discriminate up- from down-DEGs. We found that, among the 11 HMs, H3K79me2 produced the best outcome (AUCRF = 0.891, AUCGLM = 0.897 and AUCSVM = 0.798) (Fig. 2A and 2B). The ROCs of the top five HMs obtained by the RF algorithm are shown in Fig. 2A. Meanwhile, the impact of each HM signal in each bin on LUAD-related gene expression was inferred by the percent increase in the mean squared error (IncMSE) function in the RF algorithm [35] and converted to a rank value (top-ranked HMs indicated higher IncMSE values and greater effects on gene expression). The top five vital bins for each HM are shown in Fig. 2B. The results showed that HM signals in the downstream regions of TSS contributed more to LUAD-related gene expression compared to the signals in the upstream regions.
Fig. 2.

H3K79me2 signals are strongly correlated with gene expression levels in LUAD tested via random forest algorithm. (A) ROC curves for the top five HMs. (B) The prediction results tested by the RF, GLM and SVM algorithms and the top five vital bins for each HM obtained by the RF algorithm. (C) AUC distributions for HM combinations with the same number of HMs. (D) and (E) HM occurrence times in the studied 5-HM-based models and 6-HM-based models, respectively. (F) AUC distributions for 11 HMs in the same bin across the 100 bins around the TSS. (G) The ranks of 11 HMs in the same bin. Top-ranked HMs indicate higher ‘IncMSE’ values and greater effects on gene expression.
Subsequently, we investigated the capabilities of HM combinations to distinguish between up-DEGs and down-DEGs. For the 11 HMs, there were 2047 HM combinations. Thus, a total of 2047 () HM-based models were constructed. The results for all combinations and their AUCs are displayed in Supplementary Table 1, Fig. 2C, Supplementary file Fig. S2A and S2D. The comparison showed that the predictive abilities will reach the peak when the models are trained on 5 types of HMs. And H3K79me2 was included in the best five-HM-based model (RF: H3K79me2, H3K4me2, H3K36me3, H3K27me3 and H2AFZ (AUCRF = 0.871); GLM: H3K79me2, H3K36me3, H3K27me3, H3K4me1, and H3K27ac (AUCGLM = 0.848); SVM: H3K79me2, H3K27me3, H3K27ac, H3K4me2 and H2AFZ (AUCSVM = 0.864)). Furthermore, we focused on the five- and six-HM-based models whose AUCs reached at least 95% of the AUC of the 11-HM-based model. By counting the number of HM occurrences, we found that H3K79me2 appeared most frequently (RF: H3K79me2 appeared in 178 of 215 five-HM-based models (Fig. 2D) and 228 of 300 six-HM-based models (Fig. 2E); GLM: H3K79me2 existed in 199 of 262 five-HM-based models (Supplementary file Fig. S2B) and 245 of 324 six-HM-based models (Supplementary file Fig. S2C); SVM: H3K79me2 presented in 118 of 134 five-HM-based models (Supplementary file Fig. S2E) and 178 of 207 six-HM-based models (Supplementary file Fig. S2F)). These analyses once again showed the important regulatory role of H3K79me2 in LUAD-related gene expression.
Finally, we conducted verification by choosing the signals of 11 HMs in the same bin as the inputs of the RF algorithm to predict the up- and down-DEGs. The results are displayed in Fig. 2F. In the 5 kb regions downstream of TSS, the AUCs altered slightly. In the 5 kb regions upstream of TSS, the AUCs altered appreciably, and the further away from the TSS, the worse the prediction. The best predictive result appeared in the +13th bin (AUC = 0.844). We also calculated the ‘IncMSE’ values for the 11 HMs in the same bin. As shown in Figure 2G, H3K79me2 signal almost played the most important role in the bins from -37th to +50th. These findings, together with previous reports in MLL-rearranged leukemia [17] and pediatric AML [36], lead us to believe that H3K79me2 signal changes can affect gene expression in LUAD.
3.3. Genes with differential H3K79me2 levels during tumorigenesis participate in LUAD progression
In view of these findings, we preprocessed the H3K79me2 signals, calculated the relative probabilities of H3K79me2 signals and performed the Shannon entropy strategy to extract the genes with differential H3K79me2 levels in tumorigenesis (for details, see Materials and methods). In total, 867 genes (Supplementary Table 2) were recognized using a threshold (2.239) [23], [24] and submitted to execute pathway enrichment analyses. Fig. 3A depicts the top 20 significant pathways involving these genes. Fig. 3B shows the interconnections of these pathways. As shown in Fig. 3A, 16 of the 20 pathways were demonstrated to drive oncogenesis (drawn in orange font). We then explored the diseases in which these genes are involved through the DisGeNET database. Of the top 20 diseases, 11 were cancers. The number of genes participating in each disease is shown in Fig. 3C. Besides, we used the TRRUST database to mine the trans-regulatory elements targeting these genes. Analyses have shown that oncogenic trans-regulatory elements, such as Tp53 [37], HDAC2 [38] and WT1 [39], are participated in the regulation of these genes. Fig. 3D shows the corresponding number of genes regulated by these trans-regulatory elements. In summary, these studies collectively suggest that the genes with differential H3K79me2 levels during tumorigenesis can act as LUAD driver genes.
Fig. 3.

Enrichment analyses of the genes with differential H3K79me2 levels during oncogenesis. (A) The top 20 significant pathways in which the genes with differential H3K79me2 levels participated. (B) The interconnections of the 20 pathways described in A. (C) The top 20 diseases related to the genes with differential H3K79me2 levels and the corresponding number of genes in each disease. (D) The top 20 trans-regulatory elements and the number of genes regulated by these trans-regulatory elements.
3.4. Computational identification of LUAD driver genes
To screen the PLDGs, we retrieved the raw clinical profiles and RNA-seq data of LUAD patients from the TCGA dataset and removed the genes with zero expression in > 10% patient samples. By intersecting these genes and the 867 genes with differential H3K79me2 levels, 824 genes with differential H3K79me2 levels in tumorigenesis were identified and analyzed by univariate Cox regression. Forty-eight survival-related seed genes with P values < 0.05 were identified (Supplementary Table 3). Subsequently, stepwise regression analysis was performed on these seed genes, and 14 genes with the lowest AIC were retained as the optimal gene set (Supplementary Table 3). Then, the LASSO Cox regression model was fitted to simulate the relationship between the expression levels of the 14 optimal genes and survival time. In 1000 interactions, 12 genes with nonzero coefficients in at least 950 iterations were determined as the final PLDGs (Supplementary Table 4). For these 12 PLDGs, RT–qPCR assays were performed to determine whether the expression of PLDGs changed significantly in LUAD tumorigenesis (Fig. 4A). The RT–qPCR analysis showed that the expression levels of GPRIN2, HMMR, GPI, HNRNPA2B1, MAP3K8, SMOX, LGR4, SLIRP and MTHFS were enhanced, while the expression levels of METRNL, RNF217 and F2RL1 were suppressed in LUAD tumor cells.
Fig. 4.

Construction, evaluation and validation of the risk score model. (A) RT–qPCR analyses for the 12 PLDGs. The relative expression levels were calculated via. (B and D) Kaplan–Meier survival curves for all-, high- and low-risk groups in the TCGA and GEO cohorts. (C and E) ROC curves for the risk score model in the TCGA and GEO databases. The distributions of the risk scores in LUAD patients with different (F) T-categories, (G) N-categories, (H) M-categories and (I) tumor stages. (J) Univariate and (K) multivariate Cox analyses for the risk score model and clinical characteristics.
3.5. A risk score model constructed by the potential LUAD driver genes can serve as an independent prognostic factor
To accelerate the clinical application, the expression levels of the 12 PLDGs in the TCGA set were weighted by the average coefficients obtained from 1000 iterations and transformed into a risk score model. The risk score was calculated as follows:
Risk score = -0.094 × GPRIN2 + 0.257 × HNRNPA2B1-0.190 × MAP3K8 + 0.214 × GPI + 0.183 × HMMR + 0.174 × METRNL + 0.125 × RNF217 + 0.122 × SMOX + 0.180 × MTHFS + 0.106 × F2RL1 + 0.118 × LGR4 + 0.235 × SLIRP.
Then, the 475 patients were divided into low-risk or high-risk groups based on the optimal cut-off of the risk score. As displayed in Fig. 4B, patients with low-risk scores had longer overall survival than patients with high-risk scores (P value = 5.662 × 10⁻¹⁵). The 5-year survival rate for the low-risk group was 54.4%, which was higher than the 17.9% in the high-risk group. For 3-year and 5-year overall survival, the AUCs of the model were 0.707 and 0.721, respectively (Fig. 4C).
The prognostic efficacy of the risk score model was first assessed via the PH test and outlier test. Under the PH test, the P values for these PLDGs (except SMOX) ranged from 0.039 to 0.852, indicating that these genes may be robust information parameters (Supplementary file Fig. S3). The outlier test demonstrated that there were no genes with undue influence (Supplementary file Fig. S4). Subsequently, the model was assessed on an independent LUAD dataset (GSE30219) covering 10 PLDGs except for LGR4 and MTHFS. Similar results were obtained. The overall survival rates of patients in the low- and high-risk groups were 60.6% and 31.1%, respectively, with a P value=3.022 × 10⁻⁹ (Fig. 4D). The AUCs for 3-year and 5-year overall survival were 0.702 and 0.729, respectively (Fig. 4E). Finally, we randomly picked one HM (H3K36me3), identified the genes with differential H3K36me3 levels in tumorigenesis and refitted a risk score model. Comparing to the model built by the genes with differential H3K79me2 levels in tumorigenesis, this model presented lower prognostic power. For 3-year and 5-year overall survival, the AUCs of this model were 0.704 and 0.715, respectively (Supplementary file Fig. S5). These analyses suggested that the risk score model constructed by the genes with differential H3K79me2 levels is significantly correlated with the overall survival of LUAD patients.
To examine whether the model can serve as an independent prognostic factor, the risk score distributions of patients with different tumor (T), node (N), metastasis (M) categories and tumor stages were investigated. As shown in Fig. 4F ∼ 4I, patients with poorer LUAD pathologic stages had higher risk scores, suggesting that this model may be used as a clinical prognostic factor. To verify this hypothesis, we performed univariate and multivariate Cox analyses. The results revealed that the risk score model could serve as an independent prognostic factor to predict the progression of LUAD patients (univariate analysis: HR = 2.330, 95% CI 1.887–2.876, P value = 3.502 × 10⁻¹⁵; multivariate analysis: HR = 2.273, 95% CI 1.750–2.952, P value = 7.378 × 10⁻¹⁰) (Fig. 4J and 4 K).
3.6. Risk score model predicts therapeutic benefit
To assess the value of the risk score model as a biomarker, the infiltrating levels of immune cells between the high- and low-risk groups were first inferred by the xCell tool (Fig. 5A). We noted that most immune cells displayed significant differences between the high- and low-risk groups. Among them, T helper 2 (TH2) cells infiltrated more and showed the strongest positive correlation with the risk scores in the high-risk group accompanied by fewer TH1 cells (Spearman coefficient = 0.493, P value = 5.792 × 10⁻¹⁸) (Fig. 5B). M1 and M2 macrophages presented higher densities in the low-risk group, which were associated with a better prognosis. Patients in the low-risk group tended to have higher immune, stromal and microenvironment scores than those in the high-risk group.
Fig. 5.

The risk score model predicts the sensitivities of drug therapies. (A) Landscape of immune cell infiltrations in the high- and low-risk groups. Red and blue represent cells with higher and lower infiltration levels, respectively. *P < 0.05; **P < 0.01; ***P < 0.001; ns not significant. (B) Association between risk scores and immune cell infiltration (all P < 0.001). Immunophenoscores comparison between the high- and low-risk groups for LUAD patients treated with (C) CTLA4_neg_PD1_neg, (D) CTLA4_neg_PD‐1_pos, (E) CTLA4_ pos_PD‐1_neg, and (F) CTLA4_ pos_PD‐1_pos. PD‐1_pos or CTLA4_pos indicates anti‐PD‐1 or anti‐CTLA4 therapy, respectively. (G) The ratios of normalized IC50 values of the 112 drugs between the high- and low-risk groups. (For interpretation of the references to colour in this figure legend, the reader is referred to the web version of this article.)
Besides, the immunophenoscores of LUAD patients receiving PD1, CTLA4, and CTLA4 + PD1 inhibitors were applied to estimate the potential clinical application of immune checkpoint inhibitors. As shown in Fig. 5C-F, the immunophenoscores were increased in the low-risk group treated with anti-PD-1/anti-CTLA4 monotherapy or a combination of anti-PD-1 and anti-CTLA4. The significant result in the group treated with anti-CTLA4 (P value = 1.4 × 10⁻⁵) indicated that patients in the low-risk group may benefit more from anti-CTLA4 agents.
Subsequently, based on TCGA expression data, the IC50 values of 251 agents were quantified, and 112 drugs showed significance for patients in the high- and low-risk groups. Fig. 5G suggests that patients in the high-risk group may be more sensitive to MLN4924, AR-42, QL-VIII-58, etc., while patients in the low-risk group may be more sensitive to MG-132, midostaurin, WZ3105, etc. In brief, these findings suggest that this model may be helpful for guiding clinical treatment.
3.7. Identification of regions with significant H3K79me2 signal changes on the potential LUAD driver genes
For the 12 PLDGs closely associated with H3K79me2, we reanalyzed the distribution levels of H3K79me2 on the 12 PLDGs in LUAD tumor and normal cells. As shown in Fig. 6 and Supplementary Table 5, H3K79me2 exhibited obvious changes in tumorigenesis, and even partial changes exceeded hundreds of times. Among these changes, although some H3K79me2 signal alterations occurred in the upstream regions of the TSS, the apparent increases in H3K79me2 signals tended to concentrate in the downstream regions of the TSS. Some examples were summarized as follows. H3K79me2 signals improved 1,292- and 1,000-fold in the +29th and +11th bins of HNRNPA2B1 during tumorigenesis, respectively. Compared with normal cells, the signals in the +49th, +29th and +50th bins of MAP3K8 within the tumor cells were increased 799-, 786- and 764-fold, respectively. The gains of H3K79me2 signals in > 50% bins of HMMR in cancer cells were at least 10-fold greater than those in normal cells.
Fig. 6.

The distributions of H3K79me2 signals on the 12 potential LUAD driver genes. The green and yellow histograms represent the average distributions of H3K79me2 in LUAD tumor cells and normal cells, respectively. The grey lines show the ratios of H3K79me2 signal changes. (For interpretation of the references to colour in this figure legend, the reader is referred to the web version of this article.)
4. Discussion
Lung cancer is the leading cause of cancer-related deaths worldwide, and LUAD represents the most common lung cancer subtype. In the last two decades, epigenetic studies related to LUAD have focused on DNA methylation, especially on how promoter hypermethylation inhibits tumor suppressor gene expression and how hypomethylation promotes the up-regulation of oncogenes [31], [32]. However, the low 5-year overall survival rate and pessimistic prognosis [4], [40] indicate that other strategies for treating LUAD need to be studied. As an important research topic in epigenetics, aberrations in HM levels and distributions may also lead to tumorigenesis [5]. Therefore, the first question we raised is which HM signal changes contribute more to LUAD-related gene expression changes. To address this question, we used different algorithms to predict the up- and down-DEGs by the HM signals across the 100 bins. Among the 11 HMs, H3K79me2 exhibited the strongest predictive ability. Subsequent supplementary verifications suggested that H3K79me2 appeared the most frequently in the studied five-/six-HM-based models and ranked at the anterior-most position in almost all bins. One possible reason behind this phenomenon may be that H3K79me2 induces variations in chromatin accessibility and provides greater flexibility for gene expression regulation [41].
Based on these findings and the extensive roles of H3K79me2, we immediately explored whether genes with differential H3K79me2 levels during tumorigenesis can function as LUAD driver genes. As a result, 867 genes with differential H3K79me2 levels were recognized and the enrichment analyses revealed that they were involved in the regulation of LUAD tumorigenesis. Furthermore, an open-source computational framework was presented, and the expression levels of the 12 identified PLDGs were markedly increased/decreased in tumor cells as detected by RT–qPCR. Indeed, three-quarters of the PLDGs have been verified to be related to LUAD. F2RL1 is a G protein-coupled receptor that can promote the proliferation of LUAD A549 cells by regulating EGFR-related signaling pathways [42] and enhance cell migratory ability by suppressing miR-125b [43]. GPI and SMOX are negatively correlated with the overall survival of LUAD patients [44], [45]. Knockdown of GPI induces cell proliferation inhibition and G2/M cell cycle arrest in A549 cells [46]. SMOX dysregulation alters the homeostasis of ROS. This imbalance builds a link between inflammation and DNA damage, which leads to the mutagenic changes necessary for the progression of epithelial cancers, including stomach, lung, and prostate cancers [47], [48]. High HMMR expression combined with high lncRNA HCG18 levels and low miR-34a-5p levels can accelerate LUAD occurrence and distant metastasis [49], [50]. HNRNPA2B1, a m6A regulatory factor, can interact with miR-122-5p [51], miRNA-17, -198 and -93 [52] to promote LUAD progression. MAP3K8 is highly expressed in the lung, and its ubiquitous deficiency is reported to exacerbate eosinophilic inflammation when challenged with OVA [53] and to promote urethane-induced lung carcinogenesis [54]. Besides, MAP3K8 has been shown to be involved in the regulation of pulmonary fibrosis [55], which is a major risk factor for the development of lung cancer [56]. LGR4, together with its family members LGR5 and LGR6, accelerates LUAD cell proliferation by binding to R-spondins-1-4 and activating the Wnt signaling pathway [57], [58]. SLIRP is a novel putative bcl-2-interacting protein that participates in LUAD development by regulating mitochondrial-encoded mRNA [59]. The copy number variation deletion of RNF217 has been described as a hereditary marker of LUAD [60]. Although there are few reports on the roles of the remaining three genes (METRNL, GPRIN2 and MTHFS) in LUAD, they are related to bladder squamous cell carcinoma [61], neuroblastoma [62] and cervical cancer [63]. In summary, these findings suggest that the 12 recognized genes may be driver genes of LUAD.
To facilitate the clinical application of the PLDGs, a risk score model was constructed. And Kaplan–Meier survival curves, time-dependent ROC curves and comparation with other model showed the superiority of the model. The PH test and outlier test confirmed that the genes in the prognostic model were robust information parameters. Moreover, the distributions of risk scores for patients with distinct clinicopathologic factors, as well as univariate and multivariate Cox analyses, suggested that the model can serve as an independent prognostic factor. Additionally, immune analysis and responses to immunotherapeutic and chemotherapeutic agents showed that patients in the high and low-risk groups may have distinct tendencies for clinical selection [3], [64]. Finally, we switched back to the distribution levels of H3K79me2 on the PLDGs. By comparing H3K79me2 signals in tumor cells with those in normal cells, we located the regions where H3K79me2 signals were significantly altered. Taken together, these results indicate that the model developed using H3K79me2-related driver genes can serve as a supplement to existing signatures.
In this study, although the significance of H3K79me2 and the potential prognostic values of the risk score model were explored, and an open-source computational framework for extracting PLDGs was constructed, there are still some drawbacks. First, the underlying mechanisms of the PLDGs remain unclear in LUAD. Second, although literature validation and RT–qPCR assays were performed, additional analyses using in vitro and in vivo animal models are still required. Perhaps we can design some animal models to verify the results of this study in the future.
5. Conclusions
We demonstrated the significance and efficacy of H3K79me2 in regulating LUAD-related gene expression and presented an open-source computational framework to extract PLDGs from the genes with differential H3K79me2 levels in tumorigenesis. RT–qPCR experiments demonstrated that the expression levels of the recognized PLDGs were significantly increased/decreased within LUAD tumor cells. A risk score model comprising the 12 H3K79me2-targeted PLDGs was developed for the first time, and its prognostic efficacy was evaluated by multiple datasets, statistical tests and benefits to therapeutic agents. Finally, the regions with obvious H3K79me2 signal changes on the 12 PLDGs were accurately located. In conclusion, our research may offer potential molecular biomarkers for LUAD treatment.
CRediT authorship contribution statement
Lu-Qiang Zhang: Conceptualization, Methodology, Writing – original draft. Hao Yang: Validation, Data curation, Writing – review & editing. Jun-Jie Liu: Investigation, Writing – review & editing. Li-Rong Zhang: Investigation, Writing – review & editing. Yu-Duo Hao: Software. Jun-Mei Guo: Validation. Hao Lin: Conceptualization, Methodology, Writing – review & editing.
Declaration of Competing Interest
The authors declare that they have no known competing financial interests or personal relationships that could have appeared to influence the work reported in this paper.
Acknowledgements
This work was supported by the National Natural Science Foundation of China (Nos. 62062053, 61962041, 62161033, 32160216), the Sichuan Provincial Science Fund for Distinguished Young Scholars (2020JDJQ0012), the Natural Science Foundation of Inner Mongolia Autonomous Region of China (2021BS06001) and the Scientific Research Program at Universities of Inner Mongolia Autonomous Region (NJZZ21002).
Footnotes
Supplementary data to this article can be found online at https://doi.org/10.1016/j.csbj.2022.10.004.
Contributor Information
Lu-Qiang Zhang, Email: 111989025@imu.edu.cn.
Hao Lin, Email: hlin@uestc.edu.cn.
Appendix A. Supplementary data
The following are the Supplementary data to this article:
References
- 1.Qiu M.T., Xia W.J., Chen R., Wang S.W., Xu Y.T., et al. The circular RNA circPRKCI promotes tumor growth in lung adenocarcinoma. Cancer Res. 2018;78(1):2839–2851. doi: 10.1158/0008-5472.CAN-17-2808. [DOI] [PubMed] [Google Scholar]
- 2.Chen W.Q., Zheng R.S., Baade P.D., Zhang S.W., Zeng H.M., et al. Cancer statistics in China, 2015. Ca-Cancer J Clin. 2016;66:115–132. doi: 10.3322/caac.21338. [DOI] [PubMed] [Google Scholar]
- 3.Wu J., Li L., Zhang H.B., Zhao Y.Q., Zhang H.H., et al. A risk model developed based on tumor microenvironment predicts overall survival and associates with tumor immunity of patients with lung adenocarcinoma. Oncogene. 2021;40:4413–4424. doi: 10.1038/s41388-021-01853-y. [DOI] [PubMed] [Google Scholar]
- 4.Wang Y.Y., Zheng D.F., Chen T.X., Zhang J., Yao F., et al. Survival prediction and adjuvant chemotherapy based on tumor marker for stage IB lung adenocarcinoma. Ann Thorac Surg. 2020;109:927–937. doi: 10.1016/j.athoracsur.2019.09.029. [DOI] [PubMed] [Google Scholar]
- 5.Papikian A., Liu W., Gallego-Bartolome J., Jacobsen S.E. Site-specific manipulation of Arabidopsis loci using CRISPR-Cas9 SunTag systems. Nat Commun. 2019;10:729. doi: 10.1038/s41467-019-08736-7. [DOI] [PMC free article] [PubMed] [Google Scholar]
- 6.Chervona Y., Costa M. Histone modifications and cancer: biomarkers of prognosis? Am J Cancer Res. 2012;2:589–597. [PMC free article] [PubMed] [Google Scholar]
- 7.Yang X.Y., Shao F., Guo D., Wang W., Wang J.H., et al. WNT/beta-catenin-suppressed FTO expression increases m(6)A of c-Myc mRNA to promote tumor cell glycolysis and tumorigenesis. Cell Death Dis. 2021;12:462. doi: 10.1038/s41419-021-03739-z. [DOI] [PMC free article] [PubMed] [Google Scholar]
- 8.Begum N.A., Stanlie A., Nakata M., Akiyama H., Honjo T. The histone chaperone Spt6 is required for activation-induced cytidine deaminase target determination through H3K4me3 regulation. J Biol Chem. 2012;287:32415–32429. doi: 10.1074/jbc.M112.351569. [DOI] [PMC free article] [PubMed] [Google Scholar]
- 9.Li T., Zhang C., Hassan S., Liu X.Y., Song F.J. Histone deacetylase 6 in cancer. J Hematol Oncol. 2018;11:111. doi: 10.1186/s13045-018-0654-9. [DOI] [PMC free article] [PubMed] [Google Scholar]
- 10.Bajbouj K., Al-Ali A., Ramakrishnan R.K., Saber-Ayad M., Hamid Q. Histone modification in NSCLC: molecular mechanisms and therapeutic targets. Int J Mol Sci. 2021;22(21):11701. doi: 10.3390/ijms222111701. [DOI] [PMC free article] [PubMed] [Google Scholar]
- 11.Zhou Y., Zheng X., Xu B., Deng H.F., Chen L.J., et al. Histone methvItransferase SETD2 inhibits tumor growth via sunoressine CXCL1-mediated activation of cell cycle in lung adenocaranoma. Aging-Us. 2020;12:25189–25206. doi: 10.18632/aging.104120. [DOI] [PMC free article] [PubMed] [Google Scholar]
- 12.Hamra G.B., Guha N., Cohen A., Laden F., Raaschou-Nielsen O., et al. Outdoor particulate matter exposure and lung cancer: A systematic review and meta-analysis. Environ Health Persp. 2014;122:906–911. doi: 10.1289/ehp/1408092. [DOI] [PMC free article] [PubMed] [Google Scholar]
- 13.Sato M., Shames D.S., Gazdar A.F., Minna J.D. A translational view of the molecular pathogenesis of lung cancer. J Thorac Oncol. 2007;2:327–343. doi: 10.1097/01.JTO.0000263718.69320.4c. [DOI] [PubMed] [Google Scholar]
- 14.Wu Y., Zhang H., Tang M., Guo C., Deng A., et al. High methylation of lysine acetyltransferase 6B is associated with the Cobb angle in patients with congenital scoliosis. J Transl Med. 2020;18:210. doi: 10.1186/s12967-020-02367-z. [DOI] [PMC free article] [PubMed] [Google Scholar]
- 15.Fu H., Maunakea A.K., Martin M.M., Huang L., Zhang Y., et al. Methylation of histone H3 on lysine 79 associates with a group of replication origins and helps limit DNA replication once per cell cycle. Plos Genet. 2013;9:e1003542. doi: 10.1371/journal.pgen.1003542. [DOI] [PMC free article] [PubMed] [Google Scholar]
- 16.Godfrey L., Crump N.T., O'Byrne S., Lau I.J., Rice S., et al. H3K79me2/3 controls enhancer-promoter interactions and activation of the pan-cancer stem cell marker PROM1/CD133 in MLL-AF4 leukemia cells. Leukemia. 2021;35:90–106. doi: 10.1038/s41375-020-0808-y. [DOI] [PMC free article] [PubMed] [Google Scholar]
- 17.Bu J., Chen A., Yan X., He F., Dong Y., et al. SETD2-mediated crosstalk between H3K36me3 and H3K79me2 in MLL-rearranged leukemia. Leukemia. 2018;32:890–899. doi: 10.1038/leu.2017.339. [DOI] [PMC free article] [PubMed] [Google Scholar]
- 18.Jin W., Li Q.Z., Liu Y., Zuo Y.C. Effect of the key histone modifications on the expression of genes related to breast cancer. Genomics. 2020;112:853–858. doi: 10.1016/j.ygeno.2019.05.026. [DOI] [PubMed] [Google Scholar]
- 19.Yang L.Q., Lei Q., Li L., Yang J., Dong Z., et al. Silencing or inhibition of H3K79 methyltransferase DOT1L induces cell cycle arrest by epigenetically modulating c-Myc expression in colorectal cancer. Clin Epigenet. 2019;11:199. doi: 10.1186/s13148-019-0778-y. [DOI] [PMC free article] [PubMed] [Google Scholar]
- 20.Wagner G.P., Kin K., Lynch V.J. Measurement of mRNA abundance using RNA-seq data: RPKM measure is inconsistent among samples. Theory Biosci. 2012;131:281–285. doi: 10.1007/s12064-012-0162-3. [DOI] [PubMed] [Google Scholar]
- 21.Zhang L.Q., Liu J.J., Liu L., Fan G.L., Li Y.N., et al. The impact of gene-body H3K36me3 patterns on gene expression level changes in chronic myelogenous leukemia. Gene. 2021;802 doi: 10.1016/j.gene.2021.145862. [DOI] [PubMed] [Google Scholar]
- 22.Zhang L.Q., Li Q.Z., Jin W., Zuo Y.C., Guo S.C. Genome-wide analysis of H3K36me3 and its regulations to cancer-related genes expression in human cell lines. Biosystems. 2018;171:59–65. doi: 10.1016/j.biosystems.2018.07.004. [DOI] [PubMed] [Google Scholar]
- 23.Liu H.B., Chen Y.J., Lv J., Liu H., Zhu R.F., et al. Quantitative epigenetic co-variation in CpG islands and co-regulation of developmental genes. Sci Rep. 2013;3:2576. doi: 10.1038/srep02576. [DOI] [PMC free article] [PubMed] [Google Scholar]
- 24.Zhang Y., Liu H., Lv J., Xiao X., Zhu J., et al. QDMR: a quantitative method for identification of differentially methylated regions by entropy. Nucleic Acids Res. 2011;39:e58. doi: 10.1093/nar/gkr053. [DOI] [PMC free article] [PubMed] [Google Scholar]
- 25.Livak K.J., Schmittgen T.D. Analysis of relative gene expression data using real-time quantitative PCR and the 2(T)(-Delta Delta C) method. Methods. 2001;25:402–408. doi: 10.1006/meth.2001.1262. [DOI] [PubMed] [Google Scholar]
- 26.Zhou Y., Zhou B., Pache L., Chang M., Khodabakhshi A.H., et al. Metascape provides a biologist-oriented resource for the analysis of systems-level datasets. Nat Commun. 2019;10:1523. doi: 10.1038/s41467-019-09234-6. [DOI] [PMC free article] [PubMed] [Google Scholar]
- 27.Shannon P., Markiel A., Ozier O., Baliga N.S., Wang J.T., et al. Cytoscape: A software environment for integrated models of biomolecular interaction networks. Genome Res. 2003;13:2498–2504. doi: 10.1101/gr.1239303. [DOI] [PMC free article] [PubMed] [Google Scholar]
- 28.Pinero J., Bravo A., Queralt-Rosinach N., Gutierrez-Sacristan A., Deu-Pons J., et al. DisGeNET: a comprehensive platform integrating information on human disease-associated genes and variants. Nucleic Acids Res. 2017;45:D833–D839. doi: 10.1093/nar/gkw943. [DOI] [PMC free article] [PubMed] [Google Scholar]
- 29.Han H., Cho J.W., Lee S., Yun A., Kim H., et al. TRRUST v2: an expanded reference database of human and mouse transcriptional regulatory interactions. Nucleic Acids Res. 2018;46:D380–D386. doi: 10.1093/nar/gkx1013. [DOI] [PMC free article] [PubMed] [Google Scholar]
- 30.LaFave L.M., Kartha V.K., Ma S., Meli K., Del Priore I., et al. Epigenomic state transitions characterize tumor progression in mouse lung adenocarcinoma. Cancer Cell. 2020;38:212–228. doi: 10.1016/j.ccell.2020.06.006. [DOI] [PMC free article] [PubMed] [Google Scholar]
- 31.Sun L., Liu W.K., Du X.W., Liu X.L., Li G., et al. Large-scale transcriptome analysis identified RNA methylation regulators as novel prognostic signatures for lung adenocarcinoma. Ann Transl Med. 2020;8:751. doi: 10.21037/atm-20-3744. [DOI] [PMC free article] [PubMed] [Google Scholar]
- 32.Li R., Yang Y.E., Yin Y.H., Zhang M.Y., Li H., et al. Methylation and transcriptome analysis reveal lung adenocarcinoma-specific diagnostic biomarkers. J Transl Med. 2019;17:324. doi: 10.1186/s12967-019-2068-z. [DOI] [PMC free article] [PubMed] [Google Scholar]
- 33.Zhang L.Q., Li Q.Z. Estimating the effects of transcription factors binding and histone modifications on gene expression levels in human cells. Oncotarget. 2017;8:40090–40103. doi: 10.18632/oncotarget.16988. [DOI] [PMC free article] [PubMed] [Google Scholar]
- 34.Liu Y.X., Li Q.Z., Cao Y.N., Zhang L.Q. Identification of key genes and important histone modifications in hepatocellular carcinoma. Comput Struct Biotechnol J. 2020;18:2657–2669. doi: 10.1016/j.csbj.2020.09.013. [DOI] [PMC free article] [PubMed] [Google Scholar]
- 35.Hu L.T., Bentler P.M. Cutoff criteria for fit indexes in covariance structure analysis: conventional criteria versus new alternatives. Struct Equ Modeling. 1999;6:1–55. [Google Scholar]
- 36.Lonetti A., Indio V., Laginestra M.A., Tarantino G., Chiarini F., et al. Inhibition of methyltransferase DOT1L sensitizes to sorafenib treatment AML cells irrespective of MLL-rearrangements: a novel therapeutic strategy for pediatric AML. Cancers. 2020;12:1972. doi: 10.3390/cancers12071972. [DOI] [PMC free article] [PubMed] [Google Scholar]
- 37.Sun H., Liu S.Y., Zhou J.Y., Xu J.T., Zhang H.K., et al. Specific TP53 subtype as biomarker for immune checkpoint inhibitors in lung adenocarcinoma. Ebiomedicine. 2020;60 doi: 10.1016/j.ebiom.2020.102990. [DOI] [PMC free article] [PubMed] [Google Scholar]
- 38.Cai S.X., Chen W.S., Zeng W., Cheng X.F., Lin M.B., et al. Roles of HDAC2, eIF5, and eIF6 in lung cancer tumorigenesis. Curr Med Sci. 2021;41:764–769. doi: 10.1007/s11596-021-2389-z. [DOI] [PubMed] [Google Scholar]
- 39.Wu Z.Q., Qiu M.H., Mi Z.Y., Meng M.B., Guo Y., et al. WT1-interacting protein inhibits cell proliferation and tumorigenicity in non-small-cell lung cancer via the AKT/FOXO1 axis. Mol Oncol. 2019;13:1059–1074. doi: 10.1002/1878-0261.12462. [DOI] [PMC free article] [PubMed] [Google Scholar]
- 40.Li B., Severson E., Pignon J.C., Zhao H.Q., Li T.W., et al. Comprehensive analyses of tumor immunity: implications for cancer immunotherapy. Genome Biol. 2016;17:174. doi: 10.1186/s13059-016-1028-7. [DOI] [PMC free article] [PubMed] [Google Scholar]
- 41.Zhang L.Q., Fan G.L., Liu J.J., Liu L., Li Q.Z., et al. Identification of key histone modifications and their regulatory regions on gene expression level changes in chronic myelogenous leukemia. Front Cell Dev Biol. 2021;8 doi: 10.3389/fcell.2020.621578. [DOI] [PMC free article] [PubMed] [Google Scholar]
- 42.Wu K., Xu L., Cheng L. PAR2 promoter hypomethylation regulates PAR2 gene expression and promotes lung adenocarcinoma cell progression. Comput Math Methods Med. 2021;2021:5542485. doi: 10.1155/2021/5542485. [DOI] [PMC free article] [PubMed] [Google Scholar]
- 43.Yang L., Ma Y.M., Han W.X., Li W.W., Cui L., et al. Proteinase-activated receptor 2 promotes cancer cell migration through RNA methylation-mediated repression of miR-125b. J Biol Chem. 2015;290:26627–26637. doi: 10.1074/jbc.M115.667717. [DOI] [PMC free article] [PubMed] [Google Scholar]
- 44.Wei B., Kong W., Mou X., Wang S. Comprehensive analysis of tumor immune infiltration associated with endogenous competitive RNA networks in lung adenocarcinoma. Pathol Res Pract. 2019;215:159–170. doi: 10.1016/j.prp.2018.10.032. [DOI] [PubMed] [Google Scholar]
- 45.Chen S.M., Duan Y.M., Wu Y.H., Yang D.S., An J. A novel integrated metabolism-immunity gene expression model predicts the prognosis of lung adenocarcinoma patients. Front Pharmacol. 2021;12 doi: 10.3389/fphar.2021.728368. [DOI] [PMC free article] [PubMed] [Google Scholar]
- 46.Han J.H., Deng X.Z., Sun R.H., Luo M., Liang M., et al. GPI Is a Prognostic biomarker and correlates with immune infiltrates in lung adenocarcinoma. Front Oncol. 2021;11 doi: 10.3389/fonc.2021.752642. [DOI] [PMC free article] [PubMed] [Google Scholar]
- 47.Babbar N., Casero R.A. Tumor necrosis factor-alpha increases reactive oxygen species by inducing spermine oxidase in human lung epithelial cells: A potential mechanism for inflammation-induced carcinogenesis. Cancer Res. 2006;66:11125–11130. doi: 10.1158/0008-5472.CAN-06-3174. [DOI] [PubMed] [Google Scholar]
- 48.Kamat M.A., Blackshaw J.A., Young R., Surendran P., Burgess S., et al. PhenoScanner V2: an expanded tool for searching human genotype-phenotype associations. Bioinformatics. 2019;35:4851–4853. doi: 10.1093/bioinformatics/btz469. [DOI] [PMC free article] [PubMed] [Google Scholar]
- 49.Stevens L.E., Cheung W.K.C., Adua S.J., Arnal-Estape A., Zhao M.H., et al. Extracellular matrix receptor expression in subtypes of lung adenocarcinoma potentiates outgrowth of micrometastases. Cancer Res. 2017;77:1905–1917. doi: 10.1158/0008-5472.CAN-16-1978. [DOI] [PMC free article] [PubMed] [Google Scholar]
- 50.Li W., Pan T., Jiang W., Zhao H. HCG18/miR-34a-5p/HMMR axis accelerates the progression of lung adenocarcinoma. Biomed Pharmacother. 2020;129 doi: 10.1016/j.biopha.2020.110217. [DOI] [PubMed] [Google Scholar]
- 51.Li C., Qin F., Wang W., Ni Y., Gao M., et al. hnRNPA2B1-mediated extracellular vesicles sorting of miR-122-5p potentially promotes lung cancer progression. Int J Mol Sci. 2021;22(23):12866. doi: 10.3390/ijms222312866. [DOI] [PMC free article] [PubMed] [Google Scholar]
- 52.Villarroya-Beltri C., Gutierrez-Vazquez C., Sanchez-Cabo F., Perez-Hernandez D., Vazquez J., et al. Sumoylated hnRNPA2B1 controls the sorting of miRNAs into exosomes through binding to specific motifs. Nat Commun. 2013;4:2980. doi: 10.1038/ncomms3980. [DOI] [PMC free article] [PubMed] [Google Scholar]
- 53.Watford W.T., Wang C.C., Tsatsanis C., Mielke L.A., Eliopoulos A.G., et al. Ablation of tumor progression locus 2 promotes a type 2th cell response in ovalbumin-immunized mice. J Immunol. 2010;184:105–113. doi: 10.4049/jimmunol.0803730. [DOI] [PMC free article] [PubMed] [Google Scholar]
- 54.Gkirtzimanaki K., Gkouskou K.K., Oleksiewicz U., Nikolaidis G., Vyrla D., et al. TPL2 kinase is a suppressor of lung carcinogenesis. Proc Natl Acad Sci USA. 2013;110:E1470–E1479. doi: 10.1073/pnas.1215938110. [DOI] [PMC free article] [PubMed] [Google Scholar]
- 55.Zannikou M., Barbayianni I., Fanidis D., Grigorakaki T., Vlachopoulou E., et al. MAP3K8 regulates Cox-2-mediated prostaglandin E-2 production in the lung and suppresses pulmonary inflammation and fibrosis. J Immunol. 2021;206:607–620. doi: 10.4049/jimmunol.2000862. [DOI] [PubMed] [Google Scholar]
- 56.Karampitsakos T., Tzilas V., Tringidou R., Steiropoulos P., Aidinis V., et al. Lung cancer in patients with idiopathic pulmonary fibrosis. Pulm Pharmacol Ther. 2017;45:1–10. doi: 10.1016/j.pupt.2017.03.016. [DOI] [PubMed] [Google Scholar]
- 57.Liang F., Yue J.M., Wang J.Y., Zhang L.J., Fan R., et al. GPCR48/LGR4 promotes tumorigenesis of prostate cancer via PI3K/Akt signaling pathway. Med Oncol. 2015;32:49. doi: 10.1007/s12032-015-0486-1. [DOI] [PubMed] [Google Scholar]
- 58.de Lau W., Barker N., Low T.Y., Koo B.-K., Li V.S.W., et al. Lgr5 homologues associate with Wnt receptors and mediate R-spondin signalling. Nature. 2011;476:293–297. doi: 10.1038/nature10337. [DOI] [PubMed] [Google Scholar]
- 59.Trisciuoglio D., Desideri M., Farini V., De Luca T., Di Martile M., et al. Affinity purification-mass spectrometry analysis of bcl-2 interactome identified SLIRP as a novel interacting protein. Cell Death Dis. 2016;7:e2090. doi: 10.1038/cddis.2015.357. [DOI] [PMC free article] [PubMed] [Google Scholar]
- 60.Lu T.P., Hsiao C.K., Lai L.C., Tsai M.H., Hsu C.P., et al. Identification of regulatory SNPs associated with genetic modifications in lung adenocarcinoma. BMC Res Notes. 2015;8:92. doi: 10.1186/s13104-015-1053-8. [DOI] [PMC free article] [PubMed] [Google Scholar]
- 61.Shivakumar M., Lee Y., Bang L.S., Garg T., Sohn K.A., et al. Identification of epigenetic interactions between miRNA and DNA methylation associated with gene expression as potential prognostic markers in bladder cancer. BMC Med Genomics. 2017;10:65–75. doi: 10.1186/s12920-017-0269-y. [DOI] [PMC free article] [PubMed] [Google Scholar]
- 62.Duan C., Wang H., Chen Y., Chu P., Xing T.Y., et al. Whole exome sequencing reveals novel somatic alterations in neuroblastoma patients with chemotherapy. Cancer Cell Int. 2018;18:21. doi: 10.1186/s12935-018-0521-3. [DOI] [PMC free article] [PubMed] [Google Scholar]
- 63.Yi K., Yang L.Y., Lan Z., Xi M.R. The association between MTHFR polymorphisms and cervical cancer risk: a system review and meta analysis. Arch Gynecol Obstet. 2016;294:579–588. doi: 10.1007/s00404-016-4037-6. [DOI] [PubMed] [Google Scholar]
- 64.Jiang P., Gu S.Q., Pan D., Fu J.X., Sahu A., et al. Signatures of T cell dysfunction and exclusion predict cancer immunotherapy response. Nat Med. 2018;24:1550–1558. doi: 10.1038/s41591-018-0136-1. [DOI] [PMC free article] [PubMed] [Google Scholar]
Associated Data
This section collects any data citations, data availability statements, or supplementary materials included in this article.