Abstract
A short-period autonomous respiratory ultradian oscillation (period ≈ 40 min) occurs during aerobic Saccharomyces cerevisiae continuous culture and is most conveniently studied by monitoring dissolved O2 concentrations. The resulting data are high quality and reveal fundamental information regarding cellular dynamics. The phase diagram and discrete fast Fourier transformation of the dissolved O2 values revealed a square waveform with at least eight harmonic peaks. Stepwise changes in temperature revealed that the oscillation was temperature compensated at temperatures ranging from 27 to 34°C when either glucose (temperature quotient [Q10] = 1.02) or ethanol (Q10 = 0.82) was used as a carbon source. After alteration of the temperature beyond the temperature compensation region, phase coherence events for individual cells were quickly lost. As the cell doubling rate decreased from 15.5 to 9.2 h (a factor of 1.68), the periodicity decreased by a factor of 1.26. This indicated that there was a degree of nutrient compensation. Outside the range of dilution rates at which stable oscillation occurred, the mode of oscillation changed. The oscillation in respiratory output is therefore under clock control.
Oscillatory dynamics, which range from those observed in particle physics to those of yearly clocks, are ubiquitous, and in most cases knowledge concerning the underlying processes that dictate the time base, synchronization, and regulation of systems remains rudimentary. In living organisms dynamic behavior provides a unique window through which the intricate spatiotemporal organization of cells can be viewed.
Clocks are universal and fundamental to living organisms and are the basis of temporal control of metabolism and behavior (20). The majority of research has focused on the daily clock (circadian clock) that is found in the entire range of organisms from cyanobacteria to humans (6, 9). However, several classes of shorter-period temperature-compensated clocks also exist. Examples of these clocks include the millisecond clock observed during the courtship of Drosophila (19), the 40-s defecation clock (fast clock) found in nematodes (10), and the ultradian clock (period ≈ 1 h) found in Acanthamoeba castellanii (21) and in Paramecium tetraurelia (15). Biological clocks can be differentiated from biological oscillators and rhythms by two properties: they must run continuously under constant conditions and have temperature compensation (6, 20, 24)
The effects of temperature on the frequencies of biological oscillations have been extensively studied (25, 32). The periods of glycolytic oscillators (4) and cell cycle oscillators (1) are temperature dependent, and the oscillation periods are usually halved when there is a 10°C increase in temperature; i.e., the temperature quotient (Q10) is ∼2. Such oscillators have no intrinsic timekeeping function, although clocks can drive them (16). Temperature-compensated oscillators have a Q10 of ∼1; i.e., there is little alteration in the period when the temperature changes (16). Ultradian clock function as an intracellular co-coordinating time base has been studied in many lower eukaryotes, including Acanthamoeba castellanii (21) and Schizosaccharomyces pombe (17).
The ultradian oscillations of Saccharomyces cerevisiae grown under continuous conditions can be classified into two general groups. The oscillations in the first group occur when the cell cycle is synchronized (period > 100 min) and are due to events and processes that occur at well-defined stages of the cell division cycle. During the oscillations the cell doubling time is around 10 h, and the period is usually a fraction of the cell doubling time and is dependent on the dilution rate (i.e., a doubling of the cell doubling rate results in a doubling of the period) (1). A possible explanation of this phenomenon is the asynchronous budding pattern of S. cerevisiae that results in segregated synchronized subpopulations (7, 34) (i.e., the population balance model). The oscillations in the second group occur when there is no observable cell cycle synchronization, there is no dependence on the dilution rate, and synchronicity is driven metabolically (12, 27).
The oscillations studied here are the latter type, a short-period ultradian rhythm (period ≈ 40 min) that occurs when cells are grown under continuous aerobic culture conditions (27). Perturbation and free-running experiments suggest that the population synchronization is mediated by hydrogen sulfide (29) and acetaldehyde (12), possibly produced during redox switching (23) involving ethanol and glutathione cycling (22). Periodicity is not affected by changes in the aeration rate for rates between 30 and 600 cm3 min−1, by changes in the percentage of oxygen in the inlet gas up to a value of 40% oxygen (13), or during administration of micromolar concentrations of NO⋅ radicals (23). However, low (micromolar) concentrations of NO+ caused large perturbations.
These oscillations differ fundamentally from oscillations in which the cell cycle synchronizes; i.e., synchronization of the division cycle is not observed (27). Key metabolites respond differently in cultures in which cell cycle synchrony occurs; e.g., oscillation is independent of storage carbohydrates, and acetate oscillates 180° out of phase with ethanol (14), whereas these fermentation products oscillate in phase during oscillations when the cell cycle is synchronized (2). Coherent behavior of populations of cells or organisms can arise by coupling of the limit cycle oscillators of individuals initiating collective synchronization of the population around a basin of attraction (i.e., mode of oscillation) (31).
Fermentation systems with continuous on-line data analysis provide high-quality data and can be analyzed by fast Fourier transformation (FFT) to determine periodicity. These facts were recently used to determine periodicity data and information for synchronicity in a yeast culture in which oscillation in the cell division cycle was observed (3).
In this work we used multiple successive stepwise changes in temperature or in dilution rate to reveal that the ultradian respiratory oscillation is an output from a clock.
MATERIALS AND METHODS
All analytical techniques used in this study were similar to techniques used in previous studies (27).
Strains and precultures.
The S. cerevisiae strain used in this study was polyploid strain IFO 0233, which was maintained on YEPD agar slopes containing (per kilogram) 15 g of agar, 1 g of Difco yeast extract, 1 g of Polypeptone, and 5 g of glucose monohydrate at 4°C. Preculture preparation involved inoculation into YEPD broth (20 ml) and incubation in an orbital incubator for 48 h at 125 rpm and 30°C.
Medium composition.
The basic medium contained (per kilogram) 5 g of (NH4)2SO4, 2 g of KH2PO4, 0.5 g of MgSO4 · 7H2O, 0.1 g of CaCl2 · 2H2O, 0.02 g of FeSO4 · 7H2O, 0.01 g of ZnSO4 · 7H2O, 0.005 g of CuSO4 · 5H2O, 0.001 g of MnCl2 · 4H2O, 1 cm3 of 70% H2SO4, and 1 g of Difco yeast extract. Glucose medium was supplemented with glucose monohydrate (22 g kg−1) and Sigma Antifoam A (1 cm3 kg−1). Ethanol medium was supplemented with ethanol (15.7 g kg−1), Asahidenka Adecanol LG-294 antifoam agent (0.6 cm3 kg−1), and Nihon Seiyaku Polypeptone (1 g kg−1).
Continuous culture.
Continuous cultures were grown as previously described (14). Unless otherwise stated, continuous cultures in glucose medium were grown in a fermentor (BioLab; B. Braun) operated at pH 3.4 and 30°C with an agitation rate of 750 rpm, a working volume of 1 dm3, a dilution rate of 0.090 h−1, and an airflow rate of 200 cm3 min−1. Continuous cultures in ethanol medium were grown in the laboratory of H. Kuriyama by using BioFlo fermentors (New Brunswick) operated at pH 3.4 and 30°C with an agitation rate of 800 rpm, a working volume of 1.2 liters, an airflow rate of 180 cm3 min−1, and a dilution rate of 0.085 h−1 .
A continuous culture was initiated after a batch culture was starved for 6 h. Autonomous respiratory oscillation stabilized 16 h after the start of the continuous culture. During each continuous culture precautions ensured that no periodic triggering by environmental influences (e.g., alkali addition or temperature fluctuations) occurred.
Data acquisition, calculations, and signal processing.
When cells were grown continuously on glucose medium, data were acquired with a high-speed data acquisition board driven by in-house software. The instrument sampling time was 100 ms, and the data-logging rate was user defined (100 ms to 1 min); each data log was a running average of the total data acquired. In order to restrict the data file size, logging rates were restricted to every 10 s. When cells were grown continuously in ethanol medium, data were acquired as previously described (11).
Periods were estimated from the dissolved O2 signals by a program (Period Analyzer) that extracts the time of a peak maximum and subtracts this time from the time of the previous peak maximum. The values for at least 20 stable oscillations were used to calculate periods and their standard deviations. A phase diagram for dissolved oxygen was constructed as previously described (12). FFTs with a Hanning window were carried out by using Sigma Plot 2000. The fundamental was derived from the FFTs and used to calculate the period.
RESULTS
After the switch to continuous culture oscillatory dynamics remained robust for months. Normally, the periods remained between 40 and 50 min; however, during transitions amplitudes were unstable until a new stable oscillatory state had been achieved.
Analysis of oscillation.
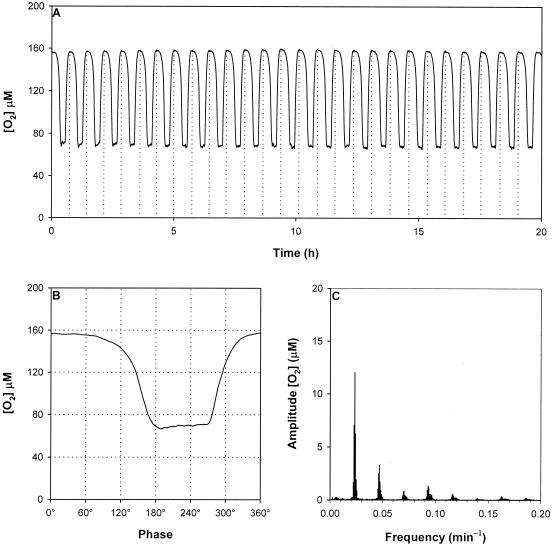
Oscillation was allowed to stabilize for 24 h and then was analyzed to determine the period, waveform, and power spectrum. The dissolved oxygen output was the most accessible output from the oscillator and was characterized (Fig. 1A) by repetitive cyclic switching between phases of high respiration (low dissolved O2 content) and phases of low respiration (high dissolved O2 content). The period at 30°C was 43.9 ± 1.6 min. When the phase diagram was constructed (Fig 1B), there were two distinct phases of oscillation. A period of low respiration lasting from 0° to 100° (158 μM dissolved oxygen) preceded a rapid increase in respiration between 100° and 150° (158 to 75 μM dissolved oxygen). This period continued until 260°, when respiration decreased rapidly (160 μM dissolved oxygen). FFT analysis (Fig. 1C) revealed a periodicity of 42.7 ± 2.6 min and seven additional subharmonic peaks that correspond to one-half, one-third, one-fourth, one-fifth, one-sixth, one-seventh, and one-eighth of the dominant cycle.
FIG. 1.
Analysis of the ultradian clock of S. cerevisiae grown continuously in glucose medium at 30°C. (A) Oscillation observed for dissolved O2 concentration. The vertical dotted lines indicate peak maxima calculated by the Period Analyzer software. (B) Phase diagram of dissolved O2 concentrations. (C) Power spectrum of the dissolved O2 concentrations.
Temperature compensation.
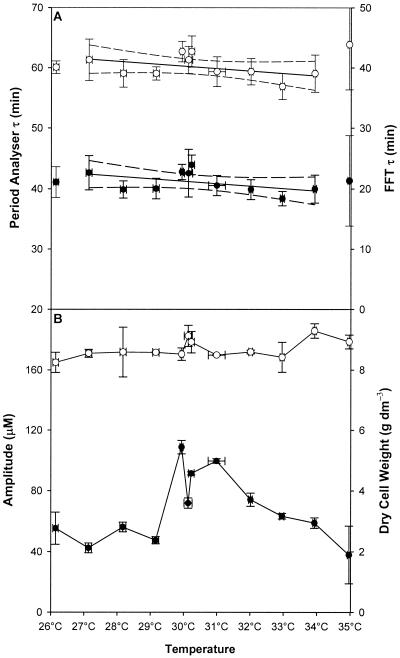
The effects of temperature changes on the ultradian oscillation that occurred during continuous growth on glucose semidefined medium were analyzed (Fig. 2). Stable respiratory oscillation occurred at temperatures between 27 and 34°C. Between these two temperatures, periodicity and waveform were not affected by temperature changes. The periods derived by using the Period Analyzer software and from FFT are shown in Fig. 2A. Data for points at which sustained oscillation occurred were analyzed by using linear regression, and the resulting fit produced almost horizontal fits with most of the points in the 95% confidence interval. Q10 values were derived from the linear regression fit of the data and were 1.06 ± 0.22 for the Period Analyzer data and 1.02 ± 0.15 for periods derived by FFT. The cell dry weight (Fig. 2B) during this period remained relatively unchanged (8.6 ± 0.5 g dm−3). Oscillation amplitudes during the temperature shifts peaked at 30°C, and lower-amplitude oscillations were observed on the fringes of the temperature range where sustained oscillation occurred.
FIG. 2.
Influence of temperature on clock periodicity, amplitude, and cell dry weight during yeast continuous culture in glucose medium. (A) Periods (τ) calculated by Period Analyzer (●) and FFT analysis (○). The solid lines indicate linear regressions of the data when stable oscillation occurred, and the dashed lines indicate the 95% confidence levels of the fits. (B) Amplitude (●) and cell dry weight (○) during the experiments. The data points for 26 and 35°C are shown for reference purposes only and were not included in any calculations because oscillation was unstable at these temperatures.
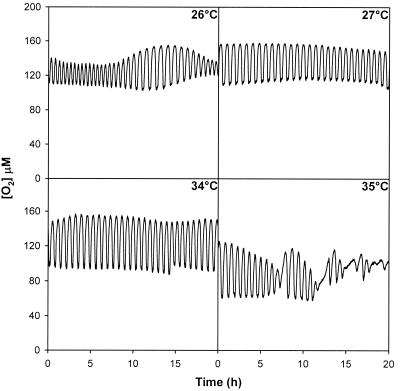
Figure 3 shows the oscillation profiles produced at the minimum and maximum temperatures at which stable oscillation occurred (27 and 34°C, respectively) and the unstable dynamic events that occurred after the temperature was changed to values that caused unstable oscillation (26 and 35°C). After exposure to 26 and 35°C oscillation was reinitiated by changing the temperature to 30°C.
FIG. 3.
Respiratory dynamics in yeast continuous cultures grown in glucose medium at 26, 27, 34, and 35°C: dissolved oxygen concentrations during stable oscillation at 27 and 34°C and FFT analysis for the cycles that occurred transiently after the temperature was shifted from 27 to 26°C and from 34 to 35°C.
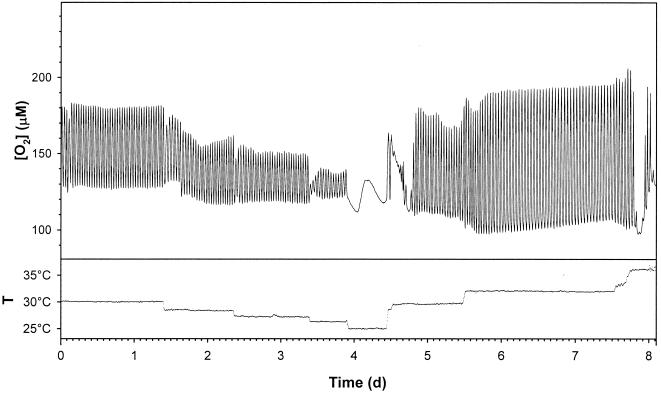
Similar results were obtained for the oscillation observed during continuous growth on ethanol medium (Fig 4). The Q10 in the temperature range that produced stable oscillation (period = 45.3 ± 2.5 min) was 0.82 ± 0.33, as determined by the Period Analyzer software. However, the oscillation amplitude increased when the temperature was increased. The differences in Q10 and the amplitude changes that occurred as the temperature increased may have been due to increased ethanol evaporation rates at higher temperatures. The cell dry weight remained constant (5.4 ± 0.4 g dm−3), indicating that cell density was not an important factor for the maintenance of stable oscillation (the cell dry weight when cells were grown on glucose medium was 8.6 ± 0.5 g dm−3).
FIG. 4.
Influence of temperature shifts on the ultradian respiratory clock in a continuous aerobic S. cerevisiae culture grown in ethanol medium. Dissolved O2 concentration and temperature (T) were measured continuously on line.
Nutrient feed rate compensation.
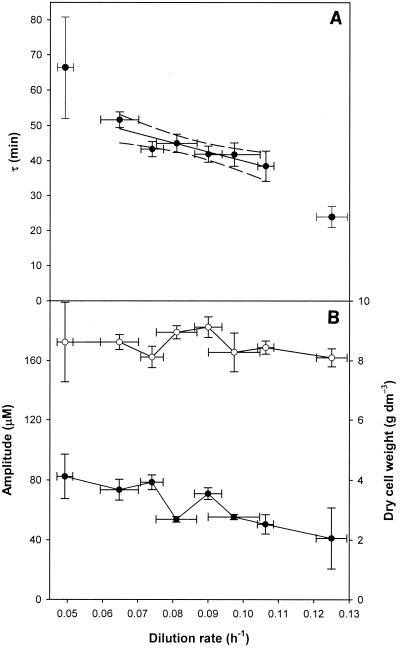
It is difficult to accurately measure the dilution rate during continuous culture because of problems with vessel level control; therefore, the errors can be substantial (3). The effects of stepwise changes in the dilution rate on the period of ultradian oscillation are shown in Fig. 5A. Cell dry weight (8.1 ± 0.4 g dm−3) was not affected by the changes in dilution rate (Fig. 5B). Stable oscillation occurred at dilution rates between 0.065 and 0.109 h−1 (i.e., when the dilution rate increased by a factor of 1.68). The values obtained are equivalent to a decrease in cell doubling time from 15.4 to 9.1 h. During the changes in dilution rate, periodicity decreased by a factor of 1.26 (as determined by a linear regression analysis), showing that oscillation had a degree of nutrient compensation (Fig 5A). The amplitude of oscillation decreased from ∼80.15 μM at a dilution rate of 0.065 h−1 to ∼48.92 μM at a dilution rate of 0.109 h−1 (Fig. 5B). The decline in amplitude (a factor of 1.64) was similar to the increase in the dilution rate (a factor of 1.68), indicating that oscillation amplitude may be related to growth and that to a limited extent the oscillation was nutrient feed rate compensated.
FIG. 5.
Influence of dilution rate on clock periodicity, amplitude, and cell dry weight for a yeast continuous culture grown in glucose medium. (A) Periods (τ) were calculated with Period Analyzer software. The solid line indicates linear regression of the data when stable oscillation occurred, and the dashed lines indicate the 95% confidence levels of the fit. (B) Amplitude (●) and cell dry weight (○) during the experiments. The data points for dilution rates of 0.05 and 0.125 h−1 are shown for reference purposes only and were not included in any calculations because oscillation was unstable at these dilution rates.
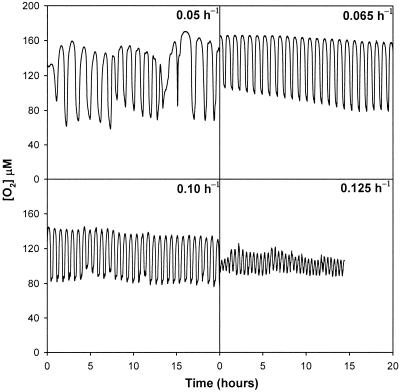
Figure 6 shows the oscillations in dissolved oxygen concentrations for the dilution rates at the limits of the range of values at which stable oscillation occurred (0.065 and 0.109 h−1) and for two dilution rates at which stable oscillation did not occur (0.05 and 0.125 h−1). The dissolved oxygen profile began a large series of unstable-period cycles that may have been related to cell cycle synchrony. Although oscillation was stable at a dilution rate of 0.109 h−1, irregularities in amplitude began to occur. Once the dilution rate was changed to 0.125 h−1, the periodicity quickly decreased to 24.0 ± 3.0 min, and the amplitude became unstable. However, the oscillation was found to be sustainable.
FIG. 6.
Respiratory dynamics in yeast continuous cultures at dilution rates of 0.05, 0.065, 0.109, and 0.125 h−1: dissolved oxygen concentrations during stable oscillations at dilution rates of 0.065 and 0.109 h−1 and cycles that occurred transiently after the dilution rate was shifted from 0.065 to 0.047 h−1 and from 0.109 to 0.125 h−1.
DISCUSSION
The results presented here clearly show that the ultradian oscillation in respiration is temperature compensated (Q10 = 1.02). The oscillation is also very robust and can be maintained for many weeks. This indicates that the respiratory oscillation is an output that is closely coupled to an ultradian clock. Biochemical control points that influence the regulation and synchronization of oscillation are located in the ethanol assimilation pathway (12), the glutathione redox cycling pathway(22), the sulfate assimilation pathway (28), and the mitochondrial respiratory chain (23, 29). However, none of these biochemical pathways alone can explain the temperature compensation of the cyclic metabolic and respiratory switching. Therefore, the temperature-compensated oscillating loop(s) must tightly regulate these metabolic events to generate the respiratory output observed.
The mode of oscillation changes significantly after small deviations from the stable oscillation temperature range. The metabolic synchronization of the population is probably mediated by an H2S (29)-acetaldehyde (12) dual synchronization mechanism. Both of these volatile compounds are produced by temperature-dependent biochemical reactions in individual cells. It seems likely that the rapid changes in oscillatory mode or the cessation of oscillation is due to loss of phase locking between individuals rather than a direct effect of temperature on the central oscillating loop.
Further work should involve dissecting the clock from its driven outputs, e.g., by constructing mutant strains that have abnormal cycle times or arrhythmic behavior, as has been achieved with systems used to study circadian behavior. Knockout targets include the putative S. cerevisiae clock gene GTS1 (38), which has partial homology with the circadian clock genes PER and FRQ. A Gts1 protein mutant shows pleiotropic effects, including reduced heat tolerance (36), defective sporulation; and reduced life span; however no clock function could be assigned to this gene (37). Interestingly, GTS1 deletion mutants exhibit a halving of the periodicity of oscillation in continuous cultures in which the cell cycle shows synchrony (35). Other targets include the four uncharacterized PAS domain-containing proteins as these domains play an important role in O2 sensing, in redox switching (33), and in clock mechanisms (6). PAS domains within proteins cause dimerization reactions, which are thought to be especially relevant to temperature compensation of period; i.e., point mutations of these domains cause temperature sensitivity in the Drosophila circadian clock (8). Other hypothetical mechanisms that could give rise to temperature compensation have been summarized recently (26).
Oscillation has a degree of nutrient feed rate compensation during growth on glucose medium at dilution rates between 0.065 and 0.109 h−1. However, in experiments in which the nutrient supply profile was altered, changes in periodicity were observed. For example, when acetaldehyde was used as the sole carbon source (12), the period of the respiratory output increased to 90 min, and when the sulfate concentration of the medium was reduced (28), periods of as little as 33 min were observed. One possible explanation for the nutrient tuning of periodicity may be the involvement of medium components in population synchrony; i.e., the extracellular environment tunes the timer to a different frequency. Unlike the clocks observed in metazoans and Neurospora crassa, those of S. cerevisiae can be studied under a diverse range of conditions; therefore, the system described here would be ideally suited to a study of how nutrients and growth phase interact with temperature-compensated systems.
The ultradian clock is not regulated by the cell cycle (12–14, 22, 23, 27), but it is very likely that, as with other unicellular ultradian clocks (20), there is cross-talk between the systems. Such dynamic interactions between growth rate and respirofermentative metabolism have been observed in S. cerevisiae continuous cultures (5). Interestingly, when the data from a cDNA microarray experiment in which the cell cycle was synchronized to 80 min (30) was reexamined by discrete wavelet transform analysis, oscillation of gene expression with a period of 30 to 40 min (18) was observed. It is plausible that the oscillators are the same. Work is under way and planned to analyze the transcriptome, proteome, and metabolome during oscillatory dynamics to address such questions.
Assigning a function to the clock is difficult, as there seems to be no necessity for a global signaling effect, such as the day-night changes of circadian systems. It is plausible that the ultradian clock may control a frequency generator for an extracellular sampling mechanism (analogous to a sample rate for digital sound systems). Alternatively, there may be a need for temporal partitioning of incompatible metabolic processes; e.g., the circadian clock partitions photosynthesis and nitrate assimilation in the cyanobacteria Synechococcus spp. (9).
This is the first description of an ultradian clock in the eukaryotic model organism S. cerevisiae. The use of S. cerevisiae for elucidation of ultradian clock and temperature compensation mechanisms has numerous advantages over other systems, not the least of which is the detailed biochemical, physiological, structural, and genetic information available for this organism. Mechanisms of temperature compensation and global control of metabolism can be easily elucidated, because the period of this ultradian clock is around 40 min; therefore, this clock is much more conveniently studied than the longer-period circadian clock. The population can be simply and precisely controlled or perturbed during continuous culture. Whereas studies of clock outputs and function have relied on discrete time samples with S. pombe (17), the noninvasive robust continuous readout methods available for continuous culture (13, 22) provide high-quality data with a high signal-to-noise ratio.
ACKNOWLEDGMENTS
We thank T. Hope and S. Jones for providing their mechanical expertise and for modifying the fermentor at South Bank University. M. Sakamoto and T. Higami assisted with fermentation work at NIBH. R. R. Klevecz critically reviewed the manuscript.
D.B.M. was supported by a South Bank University internal research fellowship and by a Return Royal Society STA (Japan) fellowship.
REFERENCES
- 1.Beuse M, Bartling R, Kopmann A, Diekmann H, Thoma M. Effect of the dilution rate on the mode of oscillation in continuous cultures of Saccharomyces cerevisiae. J Biotechnol. 1998;61:15–31. doi: 10.1016/s0168-1656(98)00016-9. [DOI] [PubMed] [Google Scholar]
- 2.Beuse M, Kopmann A, Diekmann H, Thoma M. Oxygen, pH value, and carbon source induced changes of the mode of oscillation in synchronous continuous culture of Saccharomyces cerevisiae. Biotechnol Bioeng. 1999;63:410–417. doi: 10.1002/(sici)1097-0290(19990520)63:4<410::aid-bit4>3.0.co;2-r. [DOI] [PubMed] [Google Scholar]
- 3.Birol G, Zamamiri A Q M, Hjortso M A. Frequency analysis of autonomously oscillating yeast cultures. Process Biochem. 2000;35:1085–1091. [Google Scholar]
- 4.Das J, Busse H G. Long term oscillation in glycolysis. J Biochem (Tokyo) 1985;97:719–727. doi: 10.1093/oxfordjournals.jbchem.a135111. [DOI] [PubMed] [Google Scholar]
- 5.Davey H M, Davey C L, Woodward A M, Edmonds A N, Lee A W, Kell D B. Oscillatory, stochastic and chaotic growth rate fluctuations in permittistatically controlled yeast cultures. Biosystems. 1996;39:43–61. doi: 10.1016/0303-2647(95)01577-9. [DOI] [PubMed] [Google Scholar]
- 6.Dunlap J C, Loros J J, Liu Y, Crosthwaite S K. Eukaryotic circadian systems: cycles in common. Genes Cells. 1999;4:1–10. doi: 10.1046/j.1365-2443.1999.00239.x. [DOI] [PubMed] [Google Scholar]
- 7.Hjortso M A. Population balance models of autonomous periodic dynamics in microbial cultures. Their use in process optimization. Can J Chem Eng. 1996;74:612–620. [Google Scholar]
- 8.Hong C I, Tyson J J. A proposal for temperature compensation of the circadian rhythm in Drosophila based on dimerization of the PER protein. Chronobiol Int. 1997;14:521–529. doi: 10.3109/07420529709001473. [DOI] [PubMed] [Google Scholar]
- 9.Iwasaki H, Dunlap J C. Microbial circadian oscillatory systems in Neurospora and Synechococcus: models for cellular clocks. Curr Opin Microbiol. 2000;3:189–196. doi: 10.1016/s1369-5274(00)00074-6. [DOI] [PubMed] [Google Scholar]
- 10.Iwasaki K, Liu D W, Thomas J H. Genes that control a temperature-compensated ultradian clock in Caenorhabditis elegans. Proc Natl Acad Sci USA. 1995;92:10317–10321. doi: 10.1073/pnas.92.22.10317. [DOI] [PMC free article] [PubMed] [Google Scholar]
- 11.Keulers M, Asaka T, Kuriyama H. A versatile data acquisition system for physiological modelling of laboratory fermentation processes. Biotechnol Tech. 1994;8:879–884. [Google Scholar]
- 12.Keulers M, Kuriyama H. Extracellular signalling in an oscillatory yeast culture. In: Holcombe W M L, Paton R, Holcombe M, editors. Information processing in cells and tissues. New York, N.Y: Plenum Press; 1998. pp. 85–94. [Google Scholar]
- 13.Keulers M, Satroutdinov A D, Suzuki T, Kuriyama H. Synchronization affector of autonomous short-period-sustained oscillation of Saccharomyces cerevisiae. Yeast. 1996;12:673–682. doi: 10.1002/(sici)1097-0061(19960615)12:7<673::aid-yea958>3.0.co;2-c. [DOI] [PubMed] [Google Scholar]
- 14.Keulers M, Suzuki T, Satroutdinov A D, Kuriyama H. Autonomous metabolic oscillation in continuous culture of Saccharomyces cerevisiae grown on ethanol. FEMS Microbiol Lett. 1996;142:253–258. doi: 10.1111/j.1574-6968.1996.tb08439.x. [DOI] [PubMed] [Google Scholar]
- 15.Kippert F. An ultradian clock controls locomotor behaviour and cell division in isolated cells of Paramecium tetraurelia. J Cell Sci. 1996;109:867–873. doi: 10.1242/jcs.109.4.867. [DOI] [PubMed] [Google Scholar]
- 16.Kippert F. The ultradian clocks of eukaryotic microbes: timekeeping devices displaying a homeostasis of the period. Chronobiol Int. 1997;14:469–479. doi: 10.3109/07420529709001469. [DOI] [PubMed] [Google Scholar]
- 17.Kippert F, Lloyd D. A temperature-compensated ultradian clock ticks in Schizosaccharomyces pombe. Microbiology. 1995;141:883–890. doi: 10.1099/13500872-141-4-883. [DOI] [PubMed] [Google Scholar]
- 18.Klevecz R R. Dynamic architecture of the yeast cell cycle uncovered by wavelet decomposition of expression microarray data. Funct Integrat Genom. 2000;1:186–192. doi: 10.1007/s101420000027. [DOI] [PubMed] [Google Scholar]
- 19.Kyriacou C P, Hall J C. Circadian rhythm mutations in Drosophila melanogaster affect short-term fluctuations in the male's courtship song. Proc Natl Acad Sci USA. 1980;77:6729–6733. doi: 10.1073/pnas.77.11.6729. [DOI] [PMC free article] [PubMed] [Google Scholar]
- 20.Lloyd D. Circadian and ultradian clock-controlled rhythms in unicellular microorganisms. Adv Microb Physiol. 1998;39:291–338. doi: 10.1016/s0065-2911(08)60019-3. [DOI] [PubMed] [Google Scholar]
- 21.Lloyd D, Edwards S W, Fry J C. Temperature-compensated oscillations in respiration and cellular protein content in synchronous cultures of Acanthamoeba castellanii. Proc Natl Acad Sci USA. 1982;79:3785–3788. doi: 10.1073/pnas.79.12.3785. [DOI] [PMC free article] [PubMed] [Google Scholar]
- 22.Murray D B, Engelen F, Lloyd D, Kuriyama H. Involvement of glutathione in the regulation of respiratory oscillation during a continuous culture of Saccharomyces cerevisiae. Microbiology. 1999;145:2739–2747. doi: 10.1099/00221287-145-10-2739. [DOI] [PubMed] [Google Scholar]
- 23.Murray D B, Engelen F A, Keulers M, Kuriyama H, Lloyd D. NO+, but not NO⋅, inhibits respiratory oscillations in ethanol-grown chemostat cultures of Saccharomyces cerevisiae. FEBS Lett. 1998;431:297–299. doi: 10.1016/s0014-5793(98)00777-7. [DOI] [PubMed] [Google Scholar]
- 24.Pittendrigh C. Circadian rhythms and the circadian organization of living systems. Cold Spring Harbor Symp Quant Biol. 1960;25:159–184. doi: 10.1101/sqb.1960.025.01.015. [DOI] [PubMed] [Google Scholar]
- 25.Rensing L, Mohsenzadeh S, Ruoff P, Meyer U. Temperature compensation of the circadian period length–a special case among general homeostatic mechanisms of gene expression? Chronobiol Int. 1997;14:481–498. doi: 10.3109/07420529709001470. [DOI] [PubMed] [Google Scholar]
- 26.Ruoff P, Vinsjevik M, Monnerjahn C, Rensing L U. The Goodwin oscillator: on the importance of degradation reactions in the circadian clock. J Biol Rhythms. 1999;14:469–479. doi: 10.1177/074873099129001037. [DOI] [PubMed] [Google Scholar]
- 27.Satroutdinov A D, Kuriyama H, Kobayashi H. Oscillatory metabolism of Saccharomyces cerevisiae in continuous culture. FEMS Microbiol Lett. 1992;77:261–267. doi: 10.1016/0378-1097(92)90167-m. [DOI] [PubMed] [Google Scholar]
- 28.Sohn H, Kuriyama H. Ultradian metabolic oscillation of Saccharomyces cerevisiae during aerobic continuous culture: hydrogen sulphide, a population synchronizer, is produced by sulphite reductase. Yeast. 2001;18:125–135. doi: 10.1002/1097-0061(20010130)18:2<125::AID-YEA655>3.0.CO;2-9. [DOI] [PubMed] [Google Scholar]
- 29.Sohn H Y, Murray D B, Kuriyama H. Ultradian oscillation of Saccharomyces cerevisiae during aerobic continuous culture: hydrogen sulphide mediates population synchrony. Yeast. 2000;16:1185–1190. doi: 10.1002/1097-0061(20000930)16:13<1185::AID-YEA619>3.0.CO;2-W. [DOI] [PubMed] [Google Scholar]
- 30.Spellman P T, Sherlock G, Zhang M Q, Iyer V R, Anders K, Eisen M B, Brown P O, Botstein D, Futcher B. Comprehensive identification of cell cycle-regulated genes of the yeast Saccharomyces cerevisiae by microarray hybridization. Mol Biol Cell. 1998;9:3273–3297. doi: 10.1091/mbc.9.12.3273. [DOI] [PMC free article] [PubMed] [Google Scholar]
- 31.Strogatz S H. From Kuramoto to Crawford: exploring the onset of synchronization in populations of coupled oscillators. Physica D. 2000;143:1–20. [Google Scholar]
- 32.Sweeney B M, Hastings J W. Effects of temperature upon diurnal rhythms. Cold Spring Harbor Symp Quant Biol. 1960;25:87–104. doi: 10.1101/sqb.1960.025.01.009. [DOI] [PubMed] [Google Scholar]
- 33.Taylor B L, Zhulin I B. PAS domains: internal sensors of oxygen, redox potential, and light. Microbiol Mol Biol Rev. 1999;63:479–506. doi: 10.1128/mmbr.63.2.479-506.1999. [DOI] [PMC free article] [PubMed] [Google Scholar]
- 34.Villadsen J. On the use of population balances. J Biotechnol. 1999;71:251–253. [Google Scholar]
- 35.Wang J Q, Liu W D, Mitsui K, Tsurugi K. Evidence for the involvement of the GTS1 gene product in the regulation of biological rhythms in the continuous culture of the yeast Saccharomyces cerevisiae. FEBS Lett. 2001;489:81–86. doi: 10.1016/s0014-5793(01)02083-x. [DOI] [PubMed] [Google Scholar]
- 36.Yaguchi S, Mitsui K, Iha H, Tsurugi K. Phosphorylation of the GTS1 gene product of the yeast Saccharomyces cerevisiae and its effect on heat tolerance and flocculation. FEMS Microbiol Lett. 2000;187:179–184. doi: 10.1111/j.1574-6968.2000.tb09157.x. [DOI] [PubMed] [Google Scholar]
- 37.Yaguchi S, Mitsui K, Kawabata K, Xu Z J, Tsurugi K. The pleiotropic effect of the GTS1 gene product on heat tolerance, sporulation and the life span of Saccharomyces cerevisiae. Biochem Biophys Res Commun. 1996;218:234–237. doi: 10.1006/bbrc.1996.0041. [DOI] [PubMed] [Google Scholar]
- 38.Yaguchi S, Mitsui K, Tsurugi K. Reexamination of the nucleotide sequence of GTS1, a candidate clock-related gene of Saccharomyces cerevisiae. Biochem Arch. 1997;13:97–105. [Google Scholar]


