

Summary
Mitochondrial Ca2+ uptake, mediated by the mitochondrial Ca2+ uniporter, regulates oxidative phosphorylation, apoptosis, and intracellular Ca2+ signaling. Previous studies suggest that non-neuronal uniporters are exclusively regulated by a MICU1-MICU2 heterodimer. Here, we show that skeletal-muscle and kidney uniporters also complex with a MICU1-MICU1 homodimer, and that human/mouse cardiac uniporters are largely devoid of MICUs. Cells employ protein-importation machineries to fine-tune the relative abundance of MICU1 homo- and heterodimers, and utilize a conserved MICU intersubunit disulfide to protect properly assembled dimers from proteolysis by YME1L1. Using the MICU1 homodimer or removing MICU1 allows mitochondria to more readily take up Ca2+ so that cells can produce more ATP in response to intracellular Ca2+ transients. However, the trade-off is elevated ROS, impaired basal metabolism, and higher susceptibility to death. These results provide mechanistic insights into how tissues can manipulate mitochondrial Ca2+ uptake properties to support their unique physiological functions.
Graphical Abstract

eTOC Blurb
Mitochondrial Ca2+ uptake regulates oxidative phosphorylation, cell death, and cytoplasmic Ca2+ signaling. Tsai et al. demonstrate how tissues can customize their mitochondrial Ca2+ uptake properties by modulating the composition and expression of the MICU subunits in their mitochondrial Ca2+ uniporter complexes, and also explore the physiological significance of such tissue-specificity.
Introduction
The mitochondrial calcium uniporter, which mediates mitochondrial Ca2+ uptake, is a multi-subunit Ca2+-activated Ca2+ channel in the inner mitochondrial membrane (IMM) (Kamer and Mootha, 2015; Rizzuto et al., 2012). When intracellular Ca2+ signals raise cytoplasmic [Ca2+], the uniporter can rapidly transport Ca2+ into the mitochondrial matrix to shape these Ca2+ signals. Moreover, by increasing matrix [Ca2+], the uniporter can stimulate Ca2+-dependent TCA-cycle dehydrogenases to enhance mitochondrial ATP production to support elevated cellular energy demands (e.g., during heart-rate increase) (Giorgi et al., 2018). Paradoxically, when the uniporter imports excessive Ca2+, it can trigger the mitochondrial permeability transition to initiate apoptosis, a condition implicated in cardiac ischemia-reperfusion injury and glutamate excitotoxicity, among other pathologies (Giorgi et al., 2018).
The uniporter possesses gating and transmembrane (TM) subunits. The TM subunits include MCU (Baughman et al., 2011; De Stefani et al., 2011), which tetramerizes to form a Ca2+ pore (Baradaran et al., 2018; Fan et al., 2018; Nguyen et al., 2018; Yoo et al., 2018), and EMRE (Sancak et al., 2013), which binds to MCU to stabilize the pore’s conducting conformation (Van Keuren et al., 2020; Wang et al., 2019) (Fig. 1A). The MICU proteins, including MICU1, MICU2, and the neuron-specific MICU3, are the uniporter’s gating subunits in the intermembrane space (IMS) (Mallilankaraman et al., 2012; Patron et al., 2019; Plovanich et al., 2013; Tsai et al., 2016). These MICUs, which contain two EF-hand Ca2+-binding motifs, can form homodimers or heterodimers (Wang et al., 2014; Wu et al., 2020; Xing et al., 2019). Only MICU1-containing dimers can dwell within the uniporter complex, as only MICU1 can physically interact with TM subunits (Fan et al., 2020; Tsai et al., 2016). Previous work argues that non-neuronal uniporters are exclusively regulated by a disulfide-connected MICU1-MICU2 heterodimer (MICU1–2D, D: disulfide) (Patron et al., 2014; Petrungaro et al., 2015). The MICU1 subunit in MICU1-2D is the “gatekeeper” that gates the MCU pore (Csordas et al., 2013; Mallilankaraman et al., 2012). We and others have established that MICU1 blocks the pore’s IMS entrance in resting cellular [Ca2+] (~100 nM) (Fig. 1A) (Fan et al., 2020; Paillard et al., 2018; Phillips et al., 2019). Upon elevation of IMS [Ca2+], MICU1 would dissociate from MCU, thus leading to channel opening (Fig. 1A). MICU1 is critical for physiology, as MICU1 mutations have been linked to human neuromuscular disorders (Logan et al., 2014) and MICU1-KO is perinatally lethal in mice (Antony et al., 2016).
Figure 1. Tissue-specific MICU dimerization and expression.

(A) Molecular mechanisms of Ca2+-dependent, MICU-mediated uniporter gating. (B-E) MICU dimers in mouse or rat tissues. M2-KO: MICU2-KO. 1-1: MICU1-1D. 1-2: MICU1-2D. COX2, VDAC, Tim23: loading control. (F-G) Uniporter subunit expression in human hearts. The bar chart presents the ratio of uniporter subunits and the COX2 loading control Western signals. NF: normal function. (H) Mouse MCU expression and MICU1:MCU ratio. (I-J) The rate of mitochondrial Ca2+ uptake in mouse tissues (I) or permeabilized MICU1-KD or -KO HEK cells (J). The MICU1:MCU ratio in J was measured by Western blot. Data are presented as mean ± SEM. See also Fig. S1.
The MICU2 subunit in MICU1-2D does not contact the TM subunits (Tsai et al., 2016). Structural work shows that Ca2+ binding to the EF hands of both MICU1 and MICU2 induces concerted conformational changes of both MICUs to disrupt MICU1 block (Fan et al., 2020). Thus, it is conceivable that MICU2 acts as a “modulator” that tunes MICU1’s response to intracellular Ca2+ signals. Indeed, a recent study (Ashrafi et al., 2020) demonstrates that substituting MICU3 for MICU2 allows the uniporter to be more readily activated by Ca2+.
Here, we surveyed multiple mouse/rat tissues to determine which MICU dimers are present (prior work focuses on cell lines). This led to our first key finding that the uniporter can also complex with a disulfide-connected MICU1-MICU1 homodimer (MICU1-1D), which confers a distinct Ca2+ activation profile than MICU1-2D (Figs. 1–2). Surprisingly, cardiac tissues have low MICU1 and MICU2, leading to constitutively open cardiac uniporters. Therefore, cells can achieve tissue-specific mitochondrial Ca2+ uptake by fine-tuning the relative abundance of MICU1-1D and MICU1-2D, or by removing MICUs as in the heart.
Figure 2. Kinetic analysis of mitochondrial Ca2+ uptake.

(A) [Ca2+] response of mitochondrial Ca2+ uptake in WT or MICU2-KO cells. (B) The kinetics of MICU1-free uniporters. Dashed line: WT-cell data from (A). (C) EMRE expression in WT vs. MICU1-KO HEK cells. Data are presented as mean ± SEM. See also Fig. S2.
These findings raise important mechanistic questions. First, how do cells control the ratio of MICU1-1D and MICU1-2D? It was reported that MICU1 has high affinity for MICU2 so MICU1 and MICU2 would spontaneously form heterodimers when they coexist (Kamer et al., 2017). However, we show that MICU1 actually tends to homodimerize than dimerizing with MICU2. Cells regulate the abundance of MICU1-1D and MICU1-2D mainly by varying the rates of MICU1 and MICU2 importation into mitochondria (Fig. 3). Second, what is the function of the conserved, Mia40-catalyzed (Petrungaro et al., 2015) intersubunit disulfide in MICU1-1D and MICU1-2D? This disulfide was proposed to be essential for MICU1 to gate MCU (Petrungaro et al., 2015), but we rejected this idea and show that it acts to protect MICU degradation by the protease YEM1L1 (Fig. 4).
Figure 3. Mechanisms of exclusive MICU1-2 heterodimerization.

(A-B) CoIP testing if MICU1 (A) or MICU2 (B) preferentially homodimerize or heterodimerize. ML: mitochondrial lysate. IP: eluent. Each point in the scatter plots is from an independent experiment. (C-D) Excess of MICU2ND over MICUIND. Green bands: COX2 (25 kDa) or VDAC (30 kDa) loading controls for human samples and Tim23 (20 kDa) for mouse samples. Hs: human. Mm: mouse. (E) Proposed mechanisms of exclusive MICU1-2D formation. (F) Degradation of MICU1ND or MICU2ND. Letm1: loading control. The MICU/Letm1 ratios at various time points were normalized to the ratio at time 0 and plotted in the right panel. (G-H) Recovery of MICUIND and MICU2ND. MICU1ND or MICU2ND at various time points were normalized to MICU2ND at time 0 (G). Red lines: linear fit. Data are presented as mean ± SEM. See also Figs. S3–S4.
Figure 4. The function of the MICU intersubunit disulfide.

(A) Expression and functional properties of MICU1D and MICU1ND. (B) Degradation of WT- and C463R-MICU1 in the same cell line. (C-D) Degradation of WT and mutant MICU1. (E) A uniporter-complex structure (PDB:6WDN) with the C-end helices of MICU1 and MICU2 bridged by a disulfide (red). (F) The effect of protease KD on uniporter-subunit expression. Control: no protease KD. Protein levels were normalized to COX2 in the bar chart. (G) C463S-MICU1 degradation with or without YME1L1 KD. Data are presented as mean ± SEM. See also Figs. S5–S6.
Finally, what is the physiological significance for cells to choose MICU1-1D MICU1-2D, or very low MICU1 for their uniporters? Assessing mitochondrial function in HEK293 cells (Figs. 5–6), we show that using MICU1-1D or removing MICU1 allows mitochondria to import more Ca2+ and produce more ATP in response to intracellular Ca2+ signals. However, the disadvantage is elevated matrix Ca2+ load, impaired basal metabolism, increased ROS, and higher susceptibility to death. The implications of these results will be further discussed.
Figure 5. Analyses of cells expressing MICU1-1D, MICU1-2D, or no MICU1.

(A) Matrix [Ca2+]. (B) Matrix pH. Higher 470/405 ratio reflects higher pH. (C) Total and phosphorylated PDH. (D) Whole cell TCA-cycle metabolites, NAD+, and ATP. (E) NAD(P)H autofluorescence. (F) Seahorse experiments. Oligo: oligomycin. Rot: rotenone. AA: antimycin A. (G) TMRM fluorescence. F/F0: the signal ratio before (F) and after (F0) adding FCCP. (H) Expression of mitochondrial proteins. (I) Mitochondrial H2O2. Higher 470/405 ratio indicates lower H2O2. (J) Cell death analyses. Thap: thapsigargin; Cis: cisplatin; Doxo: doxorubicin. Data are presented as mean ± SEM. See also Fig. S7.
Figure 6. Mitochondrial responses to ER Ca2+ release.
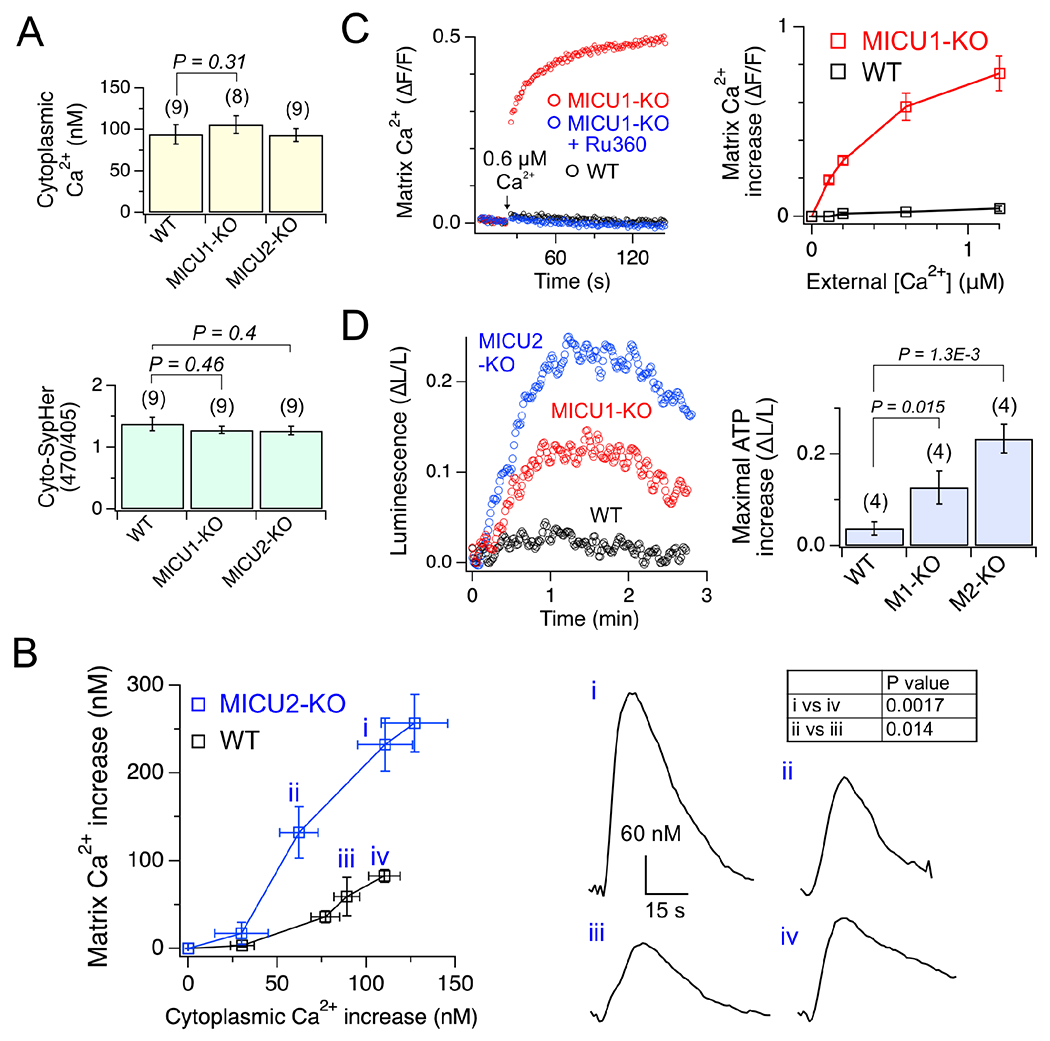
(A) Cytoplasmic pH and [Ca2+]. (B) Matrix Ca2+ increase in response to cytoplasmic Ca2+ transients. i–iv: representative matrix Ca2+ transients. (C) Matrix Ca2+ increase induced by extramitochondrial Ca2+ elevation. ΔF/F: fluorescence increase normalized to resting-level fluorescence. Ru360 is a uniporter inhibitor. (D) Enhancement of mitochondrial ATP production. 130-μM carbachol, which elicits ~100-nM cytoplasmic Ca2+ transients, was used. ΔL/L: maximal increases of luciferase signals normalized to initial signals. Data are presented as mean ± SEM. See also Fig. S7.
Results
Tissue-specific MICU1 dimerization and expression
Previous work has shown that MICU2 knockdown (KD) in HeLa or HEK293 cells shifts the MICU1 dimer band upward in Western blots (Patron et al., 2014; Petrungaro et al., 2015). This result, which we reproduced by comparing wild-type (WT) and MICU2-knockout (KO) HEK cells (Fig. 1B, left), indicates that (1) MICU1 exclusively forms MICU1-2D in WT HEK cells so that eliminating MICU2 can completely shift the MICU1 band, and (2) without MICU2, MICU1 forms MICU1-1D, which migrates more slowly than MICU1-2D as MICU1 has a larger molecular weight (MW) than MICU2 (55 vs. 50 kDa).
Here, we analyzed mouse tissues to determine which MICU1 dimers are present. Western blot shows that liver and spleen mitochondria possess only MICU1-2D, which travels to the same position as human MICU1-2D (Fig. 1B). (Mouse MICUs have essentially identical MW as the human homologues.) However, ~35% and 50% of MICU1-containing dimers in kidney and skeletal muscle, respectively, are MICU1-1D, which migrates to a position consistent with human MICU1-1D (Fig. 1B). Cardiac mitochondria contain MICU1-1D and MICU1-2D with a 1:3 ratio (Fig. S1A), but the overall MICU1 and MICU2 expression is much lower than in other tissues (Fig. 1B), leading to MICU-free uniporter subcomplexes observed in blue-native PAGE (Fig. S1B). As expected, an anti-MICU2 antibody detects only MICU1-2D but not MICU1-1D (Fig. 1B). In the cerebral cortex, MICU1 forms a heterodimer that travels faster than MICU1-2D (Fig. S1C). This dimer contains MICU3 but not MICU2 (Fig. S1C), corroborating previous findings that neuronal uniporters only complex with the MICU1-3 heterodimer (Patron et al., 2019). MICU3 was not detected in liver, spleen, and heart, but a small amount was found in skeletal muscle and kidney (Fig. S1D). These MICU3 will not be further studied, as it represents <5% of MICU1 dimers (Fig. S1D) and could be from neurons in these tissues. Fig. 1C summarizes the expression of MICU1-1D, MICU1-2D, MICU2, and total MICU1 dimers.
We then examined MICU1 dimerization in rat tissues. Rat liver contains only MICU1-2D, while ~30% and 40% of MICU1 dimers in skeletal muscle and kidneys, respectively, are MICU1-1D (Fig. 1D–E). In rat heart, the MICU1-1D:MICU1-2D ratio is ~2:1, but MICU1/2 levels are again much lower than in other tissues (Fig. 1D–E). To test if low cardiac MICU1/2 is just a rodent phenomenon, we assessed MICU expression in adult human hearts. Left-ventricular tissue from 8 individuals (4 males and 4 females, 20–60 years old) with normal cardiac function (ejection fraction >50%) was analyzed. Only MICU1-2D was observed (Fig. 1F). Strikingly, both MICU1 and MICU2 are barely detectable in these heart samples (Fig. 1F–G), with expression lower than 10% of MICUs in WT HEK cells. By contrast, human cardiac MCU and EMRE reach 50% of the expression in HEK cells (Fig. 1F–G). We thus conclude that both human and rodent hearts have low MICU1 and MICU2.
Next, we measured MICU1:MCU Western signal ratios in mouse tissues (Figs. 1H & S1E). Kidney has the highest ratio of 0.04. Skeletal muscle, liver, spleen, and cerebral cortex have a ratio of ~0.02. Heart has the lowest ratio of 0.004. These numbers do not report the MICU1:MCU molecular ratio as different antibodies were used to detect MCU and MICU1. Instead, they reflect the relative MICU1:MCU ratio in different tissues: Mouse hearts have 5–10 fold less available MICU1 per MCU than other tissues.
To test if low cardiac MICU1 availability translates to a deficit of MCU regulation by MICU1, we measured uniporter uptake of 45Ca2+ into isolated mouse tissue mitochondria (Fig. 1I). In 250-nM free Ca2+ (close to resting cellular [Ca2+]), minimal Ca2+ uptake was detected in kidney or liver mitochondria, suggesting enough copies of MICU1 to shut all MCU (Figs. 1I & S1F). By contrast, cardiac mitochondria import large quantities of Ca2+ (Figs. 1I & S1F), indicating that hearts have a population of MICU1-free, constitutively open uniporters. We then quantified uniporter activity in 10-μM Ca2+ to fully release MICU1 block of MCU. In this condition, the rate of mitochondrial Ca2+ uptake should be dictated by the density of MCU in mitochondria. Indeed, cardiac mitochondria, with an MCU expression ~50% of that in kidney or liver (Fig. 1H), take up Ca2+ at a ~50% slower rate (Fig. 1I).
In human hearts, the MICU1:MCU Western signal ratio is at least 5-fold lower than the ratio in HEK cells (Fig. 1G). Stable MICU1-KD in HEK cells shows that just a 2-fold reduction of the MICU1:MCU ratio induces unregulated mitochondrial uptake of 45Ca2+ in 250-nM free Ca2+, while a 5-fold decrease of MICU1 to mimic the MICU1:MCU ratio in human hearts elicits unregulated Ca2+ uptake almost as robust as that in MICU1-KO cells (Figs. 1J & S1F). These results argue that the uniporters in human cardiac mitochondria also operate mostly without MICU1, capable of constitutively loading Ca2+ into the matrix without Ca2+ regulation.
Functional properties of MICU1-1D and MICU1-2D
We performed co-immunoprecipitation (CoIP), showing that when MICU1-1D and MICU1-2D were expressed to similar levels, MCU complexes with MICU1-1D ~2-fold more than MICU1-2D (Fig. S2). This is likely because MICU1-1D can collide with MCU/EMRE to form a complex from either side of the dimer, while MICU1-2D only has one MICU1 to bind MCU/EMRE. Importantly, this result confirms that MICU1-1D can properly dwell within the uniporter complex.
To examine how MICU1-1D and MICU1-2D gate MCU differently, we measured mitochondrial 45Ca2+ uptake in the physiological range of free Ca2+ from 250 nM to 10 μM in WT HEK cells (only have MICU1-2D) or MICU2-KO cells (only possess MICU1-1D). At submicromolar [Ca2+], the rate of Ca2+ uptake rises along a sigmoidal Hill curve with increased [Ca2+] (inset, Fig. 2A). This is because Ca2+ binds to the MICU dimer in a cooperative manner to remove MICU1 block of MCU to increase the channel’s open probability (Po). Indeed, MICU1-KO abolishes this sigmoidal component in the same submicromolar [Ca2+] range (blue, inset, Fig 2B). As [Ca2+] rises to low-micromolar levels, MICU1 block is fully released and accordingly the Ca2+ response becomes linear (Fig. 2A). The data points were fit with the following equation (see Discussion):
where x is [Ca2+], f(x) is the rate of Ca2+ influx, s is the slope of the data points in the linear range, K0.5 is the half occupancy Ca2+ concentration for the MICU dimer, and n is the Hill coefficient. Both MICU1-1D and MICU1-2D confer strong cooperative uniporter Ca2+ activation with n ~4. The K0.5 for MICU1-1D and MICU1-2D are 0.6 and 1.2 μM, respectively, indicating that MICU1-1D renders the uniporter more readily activated by Ca2+. The 0.6 μM difference of K0.5 is highly significant, considering that typical intracellular Ca2+ signals have magnitudes of less than 1 μM. To assess how MICU1-1D affects mitochondrial Ca2+ uptake in tissues, we measured 45Ca2+ influx into kidney mitochondria (containing both MICU1-1D and MICU1-2D) and liver mitochondria (containing only MICU1-2D) in 600-nM Ca2+ (Figs. 1I & S1F). Kidney mitochondria take up >3-fold more Ca2+, consistent with the idea that uniporters with MICU1-1D are more sensitive to Ca2+ activation.
At submicromolar [Ca2+], mitochondrial Ca2+ uptake is faster in MICU1-KO cells than WT cells (inset, Fig. 2B) as the former has no MICU1 to shut MCU. However, when [Ca2+] rises to micromolar levels to fully release MICU1 block, mitochondria in WT cells become to take up Ca2+ more rapidly (Fig. 2B). This can be explained by the finding that MICU1-KO greatly reduces EMRE (Liu et al., 2016) in HEK cells (Fig. 2C), so that less EMRE-bound, transport-competent uniporters are present in MICU1-KO cells. Transfecting EMRE in MICU1-KO cells restores EMRE to WT levels, but cannot further boost EMRE expression in WT cells (Fig. 2C). This is because EMRE level is limited by MCU expression—EMRE must bind to MCU to avoid rapid degradation (Konig et al., 2016; Tsai et al., 2017). With EMRE expression rescued, MICU1-KO cells exhibit comparable rate of mitochondrial 45Ca2+ uptake as WT cells at micromolar [Ca2+] (Fig. 2B).
Do hearts lower MICU1 expression to reduce EMRE-bound MCU? We think the answer is no. The EMRE:MCU ratio in mouse/rat hearts is comparable to other tissues (Fig. S1E & S1G). Moreover, the EMRE:MCU ratio in human hearts is also similar to that in WT HEK cells (Fig. 1G). Thus, cardiac mitochondria appear to possess the ability to prevent or compensate for EMRE loss due to low MICU1 expression.
The control of MICU1-1D and MICU1-2D production
To gain insights into cellular control of the relative MICU1-1D and MICU1-2D population, we first investigated how some cells could possibly have only MICU1-2D, a challenging task considering that MICU1 also forms homodimers. The most likely scheme for MICU1-2D formation is:
where M indicates monomers and ND indicates non-disulfide. MICU1M and MICU2M first dimerize to form MICU1-2ND, before Mia40 catalyzes an intersubunit disulfide to produce MICU1-2D. It was reported that purified MICU1-1ND and MICU2-2ND, when mixed 1:1, fully reassemble into the MICU1-2ND dimer (Kamer et al., 2017). This implies that MICU1-1ND and MICU2-2ND monomerize easily to form a more stable MICU1-2ND, thus rendering MICU1-2D the dominant species in cells. This picture, however, contradicts our finding that multiple tissues have comparable amount of MICU1-1D and MICU1-2D. We thus conducted size-exclusion chromatography (SEC) to further investigate the dynamics of MICU dimerization. SEC shows that mixing purified MICU1-1ND and MICU2-2ND fails to produce MICU1-2ND (Fig. S3). Moreover, diluting MICU1-1ND or MICU2-2ND to 100 μg/mL for 12 h followed by further dilution in SEC failed to yield any monomers (Fig. S3). These results demonstrate that MICU1-1ND and MICU2-2ND are very stable dimers undergoing limited dissociation.
If MICU1-1ND is highly stable, cells must prevent MICU1 homodimerization in order to possess only MICU1-2D. We first considered the possibility that MICU1M might preferentially dimerize with MICU2M so that MICU1-1ND would rarely form whenever MICU2M exists. To test this, MICU1 and MICU2, both FLAG tagged, were co-expressed in MICU1-MICU2-KO (M1/2-KO) HEK cells, and were pulled down by 1D4-tagged MICU1 in CoIP experiments (cartoon, Fig. 3A). MICU1’s C463 residue, which mediates the MICU intersubunit disulfide (Patron et al., 2014), was mutated to Ser to block disulfide formation. Surprisingly, in order for MICU1-1D4 to precipitate equal amounts of MICU1- and MICU2-FLAG, the latter must be expressed 50-fold higher than the former (Fig. 3A). Thus, MICU1 actually has a much stronger tendency to homodimerize than to dimerize with MICU2. Using MICU2-1D4 to pull down co-expressed MICU2-FLAG and C463S-MICU1-FLAG shows that MICU2 binds MICU1 and MICU2 equally well (Fig. 3B). These results together demonstrate that the intrinsic molecular properties of MICUs do not favor MICU1-2D formation. It follows that additional cellular mechanisms must be invoked to force MICU1-MICU2 heterodimerization, but what could be such mechanisms?
Western blots show that in human cells with only MICU1-2D, including HEK, HeLa, U2-OS, and normal human heart cells, there is no band at the 50-kDa MICU1 monomer position (Fig. 3C), indicating that no MICU1M or MICU1-1ND is present. MICU1M and MICU1-1ND are collectively dubbed MICU1ND, as both travel to the same position in SDS-PAGE. By contrast, these cells all have a substantial amount of MICU2ND (a collection of MICU2M and MICU2-2ND), which migrates to the MICU2 monomer position (Fig. 3C–D). Mouse spleen and liver also have no MICU1ND (Fig. 3C–D). Although mouse spleen has abundant MICU2ND, we cannot determine if hepatic MICU2ND exists because of non-specific signals (Fig. 3C). These observations reveal an elegant mechanism by which cells promote MICU1-MICU2 dimerization. First, the absence of MICU1M indicates that MICU1-2D formation is rate-limited by MICU1M availability. Second, a steady-state presence of MICU2ND ensures that when an MICU1M is imported into mitochondria, it can only encounter MICU2M to dimerize with (Fig. 3E).
We then ask how cells maintain an excess of MICU2ND with MICU1ND depleted. The steady-state level of MICUND is controlled by protein importation and degradation. To test if MICU1ND is degraded faster than MICU2ND, we block protein synthesis using cycloheximide and then compare the elimination of MICU1ND in MICU2-KO HEK cells with the degradation of MICU2ND in MICU1-KO cells. (In MICU2-KO cells, most MICU1 forms MICU1-1D but a small amount of MICU1ND can be detected. In MICU1-KO cells, MICU2 exists solely as MICU2ND as MICU2 cannot form a disulfide-bridged homodimer). Cellular removal of MICU1ND and MICU2ND follows nearly identical kinetics with a half-life of ~4 h (Fig. 3F), indicating that proteolytic mechanisms cannot explain the excess of MICU2ND.
The kinetics of MICU1 and MICU2 importation into the matrix is then assessed by analyzing the recovery of MICU1ND and MICU2ND in mitochondria after 6 h of cycloheximide treatment (Fig. 3G). The Western signals of MICU1ND or MICU2ND were normalized to the signal of a reference MICU1-2D band (Ref in Fig. 3G) to calculate relative MICU1 and MICU2 importation rates, as further explained in Fig. S4A. Fig. 3H shows that mitochondria import MICU2 2.3-fold faster than MICU1. A pulse-chase assay similarly shows that MICU2 is imported 3.3-fold faster (Fig. S4B). A faster MICU2 importation would deplete MICU1ND to form MICU1-2D, while allowing MICU2ND to accumulate, so that newly imported MICU1M can only heterodimerize with existing MICU2M (Fig. 3E). We further postulate that if some cells import MICU1 slightly faster to reduce the difference in MICU1 and MICU2 importation rates, MICU1M, with its high tendency to homodimerize (Fig. 3A), would have chances to form homodimers to create a mixed population of MICU1-1D and MICU1-2D. Consistently, transient expression of MICU1 in WT HEK cells to boost MICU1 importation leads to mixed MICU1-1D and MICU1-2D with MICU1ND still depleted while MICU2ND remaining in excess (Fig. S4C). That MICU1M can form homodimers with MICU2ND in excess (Fig. S4C), again, disagrees with the idea that MICU1-1ND and MICU2-2ND can efficiently reassemble into MICU1-2ND (Kamer et al., 2017).
Functional roles of the MICU intersubunit disulfide
Next, we examined the functional roles of the conserved intersubunit disulfide in MICU1-1D and MICU1-2D. This disulfide is not required for MICUs to dimerize (Fig 3A–B) (Wang et al., 2014; Wu et al., 2020; Xing et al., 2019), and was thought to be necessary for MICU1 to gate MCU (Petrungaro et al., 2015). However, cryo-EM structures show that the disulfide is away from the surface that MICU1 blocks MCU (Fan et al., 2020). To further pursue this issue, we stably express WT or C463S-MICU1 in M1/2-KO HEK cells to produce comparable expression of MICU1-1D or MICU1ND, respectively (Fig. 4A). CoIP shows that both species bind MCU tightly (Fig. S5A), implying that MICU1ND can also block the MCU pore. Measuring mitochondrial 45Ca2+ uptake in both cell lines shows essentially identical Ca2+ dose responses (Fig. 4A), whose sigmoidal shape is diagnostic of proper MICU1 regulation. Taken together, these results demonstrate that MICU1 does not need the intersubunit disulfide to gate MCU.
We then employed CRISPR base-editor tools (Gaudelli et al., 2017) to mutate C463 to Arg in one copy of the MICU1 gene in MICU2-KO HEK cells so as to compare WT- (MICU1-1D) and C463R-MICU1 (MICU1ND) under the same promotor control in the same cells. The steady-state level of C463R-MICU1 is only 32 ± 7 % of WT-MICU1 (Fig. S5B), suggesting that the intersubunit disulfide might influence MICU1 stability. The degradation of C463R and WT MICU1 in the same cell was therefore compared following cycloheximide treatments (Fig. 4B), revealing that MICU1-1D is much more resistant to proteolysis than MICU1ND (black vs. blue, Fig. 4C). We note that C463R reduces MICU1 stability by abolishing the disulfide rather than non-specific effects, because C463R-MICU1, C463S-MICU1 (Fig. 4C–D), and WT MICU1ND (Fig. 3F) are degraded at similar rates (half-life ~4 h).
A clue to the question of how a disulfide bond can protect MICU1 against proteolysis is the fact that C463 is located in MICU1’s C-end helix, which is attached to the inner membrane and not well packed with MICU’s major domains (Fig. 4E). Such a loose helix is an excellent target for proteases to bind and initiate degradation. Indeed, truncating this C-end helix makes MICU1ND degradation as slow as the degradation of MICU1-1D (Fig. 4C–D). We propose that the intersubunit disulfide inhibits MICU1 proteolysis by increasing the energy barrier to unwind the C-end helix and by packing two helices together to reduce protease accessibility.
Further experiments show MICU1ND degradation is ATP-dependent (Fig. S6A). The ATP-dependence and the fact that MICU1 is a peripheral membrane protein attached to the IMS side of IMM strongly suggest that the mitochondrial iAAA protease YME1L1 is responsible for MICU1ND removal (YME1L1 is an IMM-bound protease using the energy of ATP hydrolysis to degrade IMS proteins (Quiros et al., 2015)). Indeed, stable YME1L1-KD increases steady-state MICU1ND (C463S-MICU1 stably expressed in M1/2-KO cells) by 4-fold without affecting MCU expression (Fig. 4F), and renders MICU1ND degradation as slow as MICU1-1D formed by WT-MICU1 (Fig. 4G). By contrast, knocking down the mAAA protease AFG3L2 (Quiros et al., 2015), which digests matrix proteins, does not affect MICU1ND or MCU expression (Fig. 4F). Figs. S6B–C show that YME1L1 also catalyzes rapid MICU2ND degradation. Altogether, these results demonstrate that the conserved MICU1 intersubunit disulfide acts to enhance MICU resistance to proteolysis by YME1L1. The significance of these findings will be discussed below.
Roles of MICU dimers in mitochondrial physiology
How do uniporters complexed with MICU1-1D, MICU1-2D, or no MICUs regulate mitochondrial processes differently? We approach this by analyzing WT (MICU1-2D), MICU1-KO, and MICU2-KO (MICU1-1D) HEK cells. Measuring free matrix [Ca2+] via a stably-expressed, mitochondria-targeted Ca2+-sensing protein mito-GCaMP6f (Ashrafi et al., 2020) yields 0.18 and 0.35 μM for WT and MICU2-KO cells, respectively (Fig. 5A). Thus, the higher sensitivity of MICU1-1D to Ca2+ activation leads to increased matrix [Ca2+], In MICU1-KO cells, the unregulated uniporters induce a massive matrix Ca2+ load of 2 μM (Fig. 5A), which is likely an underestimation as mito-GCaMP6f signals are nearly saturated. Since GCaMP fluorescence can be reduced by acidification, we probed matrix pH using a ratiometric pH-sensing protein mito-SypHer (Poburko et al., 2011). WT cells have higher matrix pH than MICU1- or MICU2-KO cells (Fig. 5B), suggesting that the actual differences in matrix [Ca2+] might be bigger than in Fig. 5A. Confirming GCaMP results, ratiometric measurements of matrix-targeted GEM-GECO1 (Zhao et al., 2011) yield matrix [Ca2+] of 0.12 ± 0.03 and 0.42 ± 0.05 μM (P = 0.02) for WT and MICU2-KO cells, respectively.
Elevated matrix [Ca2+] can induce E1ɑ-subunit dephosphorylation in the pyruvate dehydrogenase (PDH) to stimulate this enzyme complex (Rizzuto et al., 2012), but the three cell lines show no difference in E1ɑ phosphorylation (Fig. 5C). To further assess TCA cycle efficiency, steady-state TCA-cycle metabolites were analyzed using mass spectrometry (MS)-based metabolomics (Fig. 5D). The three cell lines have similar pyruvate levels, consistent with unaltered PDH E1ɑ phosphorylation. Moving into the TCA cycle, ɑ-ketoglutarate is decreased in both MICU1- and MICU2-KO cells (Fig. 5D), suggesting higher ɑ-ketoglutarate dehydrogenase activity induced by higher matrix [Ca2+]. No other differences in TCA-cycle metabolites were observed. Increased TCA-cycle enzyme activity should facilitate the reduction of NAD+ to generate NADH. Indeed, MS reveals a 20-30% decrease in NAD+ in MICU1- and MICU2-KO cells (Fig. 5D). Both cell lines also exhibit higher NAD(P)H autofluorescence than WT cells (Fig. 5E), indicating an overall elevated NADH:NAD+ ratio.
Higher TCA-cycle activity in MICU1- and MICU2-KO cells should enhance ATP synthesis via oxidative phosphorylation (OXPHOS), but MS does not reveal altered ATP in these lines (Fig. 5D). As MS captured ATP levels in all cellular compartments, we conducted a Seahorse assay to specifically quantify mitochondrial O2 consumption and ATP production. Surprisingly, WT cells exhibit 20% higher OXPHOS ATP output than MICU1- and MICU2-KO cells (Fig. 5F). By contrast, no difference in ATP generation via glycolysis was detected (Fig. 5F). Imaging TMRM shows that this difference in OXPHOS is not due to changes in the inner-membrane potential (Fig. 5G). A more plausible explanation is reduced respiratory-complex protein levels in MICU1- and MICU2-KO cells (Figs. 5H & S7A)—We found lower NDUFS1 and NDUFS3 in complex I, SDHA in complex II, and COX1 and COX2 in complex IV in these cells. Such reduction was not caused by non-specific loss of mitochondrial mass, as there were no changes of Rieske in complex III, VDAC in the outer mitochondrial membrane, and ATP5F1 in the FoF1-ATPase (Figs. 5H & S7A). Reduced respiratory-complex proteins in MICU1- and MICU2-KO cells would reduce H+ extrusion capacity of the electron transport chain, thus explaining the more acidic matrix pH in these cells (Fig. 5B).
An increase in matrix [Ca2+] and the NADH/NAD+ ratio are known to stimulate the production of reactive oxygen species (ROS) such as superoxide (Brookes et al., 2004; Murphy, 2009). Accordingly, we imaged matrix-targeted roGFP2-Orp1 (Gutscher et al., 2009) (pH insensitive in ratiometric measurements) to detect H2O2, the dismutation product of superoxide. Indeed, elevated basal H2O2 levels were observed in both MICU1- and MICU2-KO cells (Fig. 5I). Excessive Ca2+ and ROS are known to act synergistically to enhance mitochondrial cell-death pathways (Brookes et al., 2004; Murphy, 2009). We thus challenged these cells with death-inducing reagents, including H2O2, thapsigargin, doxorubicin, and cisplatin. Remarkably, cell susceptibility to death follows the anticipated trend of MICU1-KO (Ca2+ ↑↑; ROS ↑) > MICU2-KO (Ca2+↑; ROS ↑) > WT cells (Fig. 5J). Altogether, results in Fig. 5 suggest that using MICU1-1D or removing MICU1 can increase matrix Ca2+ load, boost ROS production, damage electron-transport chain complexes, impair basal mitochondrial metabolism, and prime the cells for death. Of note, these negative impacts are not caused by off-target effects, as expressing MICU1 or MICU2 in corresponding KO cells largely reversed the phenotypes (Fig. S7B–E).
Why would cells use MICU1-1D or no MICU1 considering all the negative effects above? We hypothesize that cells might benefit from enhanced uniporter Ca2+ uptake in response to intracellular Ca2+ signals to better boost mitochondrial ATP output. To test this, we used carbachol to induce endoplasmic-reticulum (ER) Ca2+ release in WT and MICU2-KO cells, and quantified matrix and cytoplasmic Ca2+ increases by imaging mito-GCaMP6f and cyto-GCaMP6f (Chen et al., 2013), respectively. All tested cell lines have similar cytoplasmic [Ca2+] and pH (Fig. 6A), enabling fair comparison of cyto-GCaMP6f signals. Fig. 6B shows that increasing [carbachol] elicits cytoplasmic Ca2+ transients up to ~120 nM, and similar cytoplasmic [Ca2+] elevations are indeed coupled to larger matrix Ca2+ increases in MICU2-KO cells. It is challenging to compare WT and MICU1-KO cells, as their >10-fold difference in matrix [Ca2+] makes it impossible for any Ca2+ indicators to reliably report matrix [Ca2+] in both lines. To overcome this problem, we isolated WT and MICU1-KO mitochondria to deplete matrix Ca2+, and then monitored matrix [Ca2+] using stably expressed mito-GCaMP6f. Fig. 6C shows that raising extramitochondrial [Ca2+], as hypothesized, leads to much larger matrix Ca2+ increase in MICU1-free mitochondria.
We then assessed mitochondrial ATP production using mitochondria-targeted luciferase. As in previous reports (Jouaville et al., 1999; Morciano et al., 2017), carbachol-induced ER Ca2+ release causes matrix ATP to rise to a peak level in ~1 min, followed by a slower time course back to the pre-stimulation level (Fig. 6D). Consistent with our hypothesis, MICU1- and MICU2-KO cells exhibit much bigger elevation of matrix ATP than WT cells (Fig. 6D). The ATP increase is less prominent in MICU1-than MICU2-KO cells, probably because MICU1-KO cells have higher basal matrix [Ca2+] so that ER Ca2+ release changes matrix [Ca2+] less significantly. Finally, the observations in Fig 6B–D are not caused by off-target effects, as they are reversed by restoring MICU expressions (Fig. S7F–H).
Discussion
Molecular mechanisms of MICU-mediated uniporter gating
Structural and functional work has established the core mechanism by which MICU1 gates the uniporter: MICU1 blocks the MCU pore in resting cellular [Ca2+], and Ca2+ elevation releases the block to open the channel (Fan et al., 2020; Paillard et al., 2018; Phillips et al., 2019; Tsai et al., 2016). However, the kinetic properties of this MICU1-dependent gating are poorly defined. The “threshold” concept has been widely used to describe MICU1 gating behaviors (Csordas et al., 2013; Kamer et al., 2017; Mallilankaraman et al., 2012; Payne et al., 2017). However, what it actually reports is not MICU1’s properties, but the [Ca2+] at which mitochondrial Ca2+ influx and efflux are equally fast. Other studies analyzed the [Ca2+] response of uniporter Ca2+ uptake, but the data have always been fit with the Hill equation alone (Csordas et al., 2013; Payne et al., 2017; Wescott et al., 2019; Williams et al., 2013), a treatment impossible to reflect channel behaviors. The rate of mitochondrial Ca2+ uptake (I) must be described as:
where N is the number of uniporters and i is the unitary transport rate. Po rises with increased [Ca2+] along a sigmoidal Hill-equation curve as Ca2+ binds cooperatively to the MICU dimer to release MICU1 block of the pore:
However, i is a hyperbolic function of [Ca2+] with a Km of ~20 mM as determined by electrophysiology (Kirichok et al., 2004; Tsai and Tsai, 2018). The physiological range of [Ca2+] is much lower than the Km, so i can be approximated as a linear function of [Ca2+]:
Thus, the rate of uniporter Ca2+ uptake is:
which cannot be fit with the Hill equation. This work determined the K0.5 and n of the MICUs, taking both the sigmoidal and linear components of Ca2+ dependence into consideration. MICU1-1D and MICU1-2D have distinct K0.5 (0.6 vs. 1.2 μM), which are qualitatively consistent with the equilibrium binding constants of Ca2+ to purified MICU1 or MICU2 (Kamer et al., 2017). Both dimers have an n of ~4, implying that Ca2+ must fully occupy the 4 EF-hands to trigger unblock of the pore.
A recent mitoplast-patch clamp study found that the uniporter conducts Na+ in low [Ca2+] and that MICU1-KO reduces Ca2+ currents (Garg et al., 2021). Accordingly, it was argued that MICU1 does not block MCU but potentiates the uniporter. Results in Fig. 2B–C suggest that MICU1-KO lowers uniporter activities because EMRE level is reduced, not because MICU1 has a potentiation function. Moreover, a related study (Tsai et al., 2021) shows that mitoplast production causes MICU1 dissociation from MCU/EMRE, thus creating MICU1-free uniporters that conduct Na+ in low Ca2+. (Note: Garg et al. reports that expressing EMRE in MICU1-KO cells does not affect uniporter currents, but EMRE levels were not measured using quantitative Western methods).
Cellular control of MICU dimerization and implications in pathophysiology
This work demonstrates that tissues can have both MICU1-1D and MICU1-2D. The implication is profound: Cells can fine-tune mitochondrial Ca2+ uptake properties by modifying the percentage of uniporters gated by each MICU dimer (Fig. 7). This would be impossible if cells only had MICU1-2D as previously suggested. We further show that cells control the relative population of MICU1-1D and MICU1-2D by importing MICU2 faster than MICU1 to deplete MICU1M in mitochondria (Fig. 7). Thus, when an MICU1M enters the matrix, it will only dimerize with MICU2M in cells with only MICU1-2D. To have mixed MICU1-1D and MICU1-2D, cells only have to increase MICU1M importation rate to be closer to that of MICU2M. This way, MICU1M, due to its tendency to homodimerize, will be able to form both MICU1-1D and MICU1-2D.
Figure 7.

Key concepts in this study.
This mechanism, however, has a potential problem. Imported MICU2M can form MICU2-2ND, which cannot bind to MCU/EMRE and can reduce available MICU2M to dimerize with MICU1M. We envision an elegant mechanism that cells can solve this problem. Unlike MICU1, MICU2 does not have a Mia40-recognition site (Petrungaro et al., 2015) so MICU2-2ND cannot be linked by an intersubunit disulfide. As a result, YME1L1 can effectively bind the C-end helix of MICU2-2ND to destroy this dimer. In this picture, the conserved MICU intersubunit disulfide plays a critical role of allowing cells to stabilize the useful MICU1-1D and MICU1-2D while targeting the potentially harmful MICU2-2ND for proteolytic disposal (Fig. 7). We rejected the idea that this disulfide is essential for MICU1 to gate MCU (Petrungaro et al., 2015). The previously observed loss of MICU1 regulation following disulfide removal is probably due to increased MICU1 degradation that creates unregulated, MICU1-free uniporters.
We show that tissues can customize their mitochondrial Ca2+ uptake by using both MICU1-1D and MICU1-2D, or by removing the MICUs. Two other mechanisms for tissue specificity have also been proposed before. First, mitoplast patch clamp revealed different densities of uniporter Ca+2 currents in multiple tissues (Fieni et al., 2012). Indeed, we also observed an up to 3-fold variation of MCU levels in mouse/rat tissues. Second, it was proposed that cells might modulate the MICU1:MCU ratio to alter the relative abundance of MICU1-free and -bound uniporters (Paillard et al., 2017). However, this argument relied heavily on fitting Ca2+ transport data with the Hill equation, a maneuver that yields undefined parameters. In our hands, tissues either have sufficient MICU1 to gate MCU, or have very little MICU1 as in the heart. Thus, altering the population of MICU1-free uniporters is unlikely a common strategy for cells to modulate mitochondrial Ca2+ uptake.
A general trend emerges from this work and a previous study (Ashrafi et al., 2020): Electrically excitable cells seem to configure their uniporters to be more easily activated by using MICU1-1D (skeletal muscle), MICU1-3D (neurons), or low MICUs (cardiomyocytes). Our cell-line studies suggest that such features could benefit these cells by allowing mitochondria to produce more ATP in response to intracellular Ca2+ signals to support energy-demanding processes (e.g., neurotransmission or muscle contraction) initiated by these Ca2+ signals (Fig. 7). Indeed, evidence suggests that MICU3 is required for mitochondria in hippocampal neurons to generate enough ATP to sustain neurotransmitter recycling (Ashrafi et al., 2020). The use of MICU1-1D or low MICU1, however, could come with disadvantages: Mitochondria can accumulate excessive matrix Ca2+, potentially leading to increased ROS, reduced basal metabolism, and higher sensitivity to death signals (Fig. 7). Thus, tissues with MICU1-1D or low MICU1 likely require mechanisms to prevent matrix Ca2+ overload. Indeed, it has been known for decades that excitable cells exhibit much stronger Na+-dependent mitochondrial Ca2+ efflux than non-excitable cells (Crompton et al., 1978).
We demonstrate that human hearts have low MICUs, leading to constitutively active cardiac uniporters. Consistent with cardiac uniporters being MICU-deregulated, it was shown recently that the rate of mitochondrial Ca2+ uptake in mouse heart rises linearly as [Ca2+] increases (Wescott et al., 2019). Cardiac MCU-KO suggests that the uniporter is dispensable for basal heart activities, but crucial for heart-rate increases upon β stimulation (Kwong et al., 2015; Liu and O’Rourke, 2008; Luongo et al., 2015; Maack et al., 2006; Wu et al., 2015), during which mitochondria are exposed to larger and more frequent cytoplasmic Ca2+ transients. We envision that MICU1 removal can facilitate β responses by (1) allowing all uniporters, not only those near the Ca2+ release sites in the sarcoplasmic reticulum, to import Ca2+ and enhance ATP supply, and (2) eliminating the potential delay associated with the large conformational change of MICU1 separation from the pore, thus allowing the uniporter to more rapidly respond to changes in cytoplasmic Ca2+ transients.
Low MICU expression has implications in heart diseases. During cardiac ischemia-reperfusion (I/R), Ca2+ entry into the matrix can trigger the mitochondrial permeability transition to cause cell death (Murphy and Steenbergen, 2008). Eliminating MICU1 would remove a major mechanism to shut the uniporter, perhaps exacerbating the severity of cardiac I/R injuries. Heart failure (HF) is a disease of complicated pathophysiology, but recent work increasingly highlights the critical roles of mitochondrial abnormalities in HF progression, including impaired OXPHOS, elevated ROS, and impaired mitochondrial Ca2+ homeostasis (Brown et al., 2017; Zhou and Tian, 2018). These are remarkably consistent with the negative effects caused by MICU1 depletion in HEK cells. As excessive mitochondrial Ca2+ uptake can facility HF in mice (Santulli et al., 2015), we wonder if a side effect of low MICUs could be faster deterioration of mitochondrial function that eventually leads to HF.
Limitations of the study
This work uses HEK cells to examine the physiological benefits and disadvantages for cells to use MICU1-1D or low MICU1. However, these results will not fully reflect the situation in tissues. They provide a concrete basis to formulate hypotheses about the pathophysiological significance of tissue-specific mitochondrial Ca2+ uptake, but ultimately the hypotheses will need to be tested using animal models in the future.
STAR Methods
Resource Availability
Lead contact
Further information and requests for resources should be directed to the Lead Contact, Ming-Feng Tsai (ming-feng.tsai@cuanschtuz.edu).
Materials availability
Unique cell lines and plasmids generated in this study will be made available upon request.
Data and code availability
Original Western-blot/protein-gel images and micrographs used in the main and supplementary figures have been deposited at Mendeley Data and are publicly available as of the date of publication. The DOI is listed in the key resources table. All other data reported in this paper will be shared by the lead contact upon request.
This paper does not report original code.
Any additional information required to reanalyze the data reported in this paper is available from the lead contact upon request.
Key resources table
| REAGENT or RESOURCE | SOURCE | IDENTIFIER |
|---|---|---|
| Antibodies | ||
| MCU | Cell Signaling | Cat#D2Z3B; RRID: AB_2721812 |
| EMRE | Santa Cruz | Cat#86337; RRID: AB_2250685 |
| MICU1 | Atlas Antibodies | Cat#HPA034780; RRID: AB_10696934 |
| MICU2 | Abcam | Cat#ab101465 |
| MICU3 | Atlas Antibodies | Cat# HPA024771; RRID: AB_1848022 |
| VDAC | Abcam | Cat# ab14734 RRID: AB_443084 |
| COX1 | Abcam | Cat#ab14705; RRID: AB_2084810 |
| COX2 | Abcam | Cat#ab14734 |
| Tim23 | Santa Cruz | Cat#sc-5114463 |
| FLAG | Sigma-Aldrich | Cat#F1804; RRID: AB_262044 |
| YME1L1 | Proteintech | Cat#11510-1-AP; RRID: AB_2217459 |
| AFG3L2 | Proteintech | Cat#14631-1-AP; RRID: AB_2242420 |
| Letm1 | Abcam | Cat#ab55434; RRID: AB_943985 |
| β-actin | Santa Cruz | Cat#sc-69879; RRID: AB_1119529 |
| NDUFS1 | Santa Cruz | Cat#sc-271510; RRID: AB10655669 |
| NDUFS3 | Santa Cruz | Cat#sc-374282; RRID: AB_10991315 |
| SDHA | Santa Cruz | Cat#sc-390381 |
| Rieske | Santa Cruz | Cat#sc-271609 RRID: AB_10655682 |
| ATP5F1 | Santa Cruz | Cat#sc-514419 |
| 1D4 | Home made | N/A |
| PDH-E1ɑ | Santa Cruz | Cat#sc-377092 RRID: AB_2716767 |
| S293 phosphorylated PDH-E1ɑ | Millipore | Cat#ABS204 RRID: AB_11205754 |
| IRDye 680RD goat-anti rabbit | LI-COR | Cat#925-68071; RRID: AB_2721181 |
| IRDye 800CW goat-anti mouse | LI-COR | Cat#925-32210; RRID: AB_2687825 |
| IRDye 680RD goat-anti mouse | LI-COR | Cat#925-68070 RRID: AB_2651128 |
| Alkaline phosphatase conjugated anti-rabbit secondary antibody | Promega | Cat# S373B |
| Bacterial and virus strains | ||
| E. coli: DH5ɑ competent cells | New England Biolabs | Cat#C2987H |
| E. coli: BL21(DE3) | Christopher Miller | Tsai et al., 2012 |
| Biological samples | ||
| Left ventricular tissues of non-failing human hearts | Adult Cardiac Tissue Bank at the University of Colorado Denver-Anschutz Medical campus | N/A |
| Chemicals, peptides, and recombinant proteins | ||
| Lipofectamine 3000 | Life Technologies | Cat#L3000150 |
| Lipofectamine 2000 | Life Technologies | Cat#11668019 |
| DDM, anagrade | Anatrace | Cat#D310 |
| RIPA buffer | Santa Cruz | Cat#sc-24948 |
| Intercept blocking buffer (TBS-based) | LI-COR | Cat#927-60001 |
| PVDF membranes | LI-COR | Cat#926-31097 |
| Protease inhibitor cocktail tablet | Roche | Cat#05892970001 |
| TALON cobalt affinity resin | Takara | Cat#635504 |
| CNBr-activated Sepharose 4B | GE Healthcare | Cat#17043001 |
| Cycloheximide | Sigma | Cat#C7698 |
| Oligomycin | Cayman | Cat#11342 |
| Rotenone | Cayman | Cat#13995 |
| Antimycin A | Sigma | Cat#A8674 |
| Ionomycin | Cayman | Cat#11932 |
| Carbachol | Cayman | Cat#114486 |
| 45Ca2+ radioisotope | Perkin-Elmer | Cat#NEZ013001MC |
| 35S-methionine | Perkin-Elmer | Cat#NEG009A001MC |
| Cysteine/methionine free medium | Sigma | Cat#D0422 |
| Protein A beads | Santa Cruz | Cat#sc-2001 |
| Thapsigargin | Cayman | Cat#10522 |
| Digitonin | Sigma-Aldrich | Cat#D141 |
| Calcium green 5N | Life Technologies | Cat#C3737 |
| TMRM | Invitrogen | Cat#T668 |
| FCCP | Cayman | Cat#15218 |
| Doxorubicin | Tokyo Chemical Industry | Cat#D4193 |
| Cisplatin | Tokyo Chemical Industry | Cat#D3371 |
| Annexin V CF488A | Biotium | Cat#29083 |
| Propidium Iodide | Cayman | Cat#14289 |
| Hoescht 33258 | Cayman | Cat#16756 |
| Luciferin | ThermoFisher | Cat#PI88291 |
| Critical commercial assays | ||
| Seahorse XF Real-time ATP Rate Assay Kit | Agilent | Cat#103591-100 |
| QuickChange II Kit | Agilent | Cat#200524 |
| BCA assay kit | Thermo | Cat#23225 |
| NativePAGE Sample Prep kit | Invitrogen | Cat#BN2008 |
| NativePAGE Running Buffer kit | Invitrogen | Cat#BN2007 |
| Deposited data | ||
| Unprocessed images used in the figures | This paper | doi:10.17632/shrtrdfhyt.1 |
| Experimental models: Cell lines | ||
| HEK 293T: wild type | ATCC | Cat#CRL-11268; RRID: CVCL_1926 |
| HeLa: wild type | ATCC | Cat#CCL-2; RRID: CVCL_0030 |
| U2OS: wild type | Cell Technologies Resource Center in the University of Colorado Anschutz Medical Campus | https://medschool.cuanschutz.edu/colorado-cancer-center/research/shared-resources/cell-technologies/cell-culture-services |
| HEK 293T: MICU1-KO | Home made | Tsai et al., 2017 |
| HEK 293T: MICU2-KO | Home made | Fan et al., 2020 |
| HEK 293T: MICU1-MICU2-KO | Home made | Fan et al., 2020 |
| HEK 239T: C463R-MICU1 (CRISPR base edited) | This paper | N/A |
| MEF cells: wild type | Vivek Garg | Garg et al., 2021 |
| MEF cells: MICU1-KO | Vivek Garg | Garg et al., 2021 |
| MEF cells: MICU2-KO | Vivek Garg | Garg et al., 2021 |
| Experimental models: Organisms/strains | ||
| C57BL/6J mouse: wild type | Jackson Laboratory | Cat#000664; RRID: IMSR_JAX:000664 |
| Sprague Dawley rats: wild type | Charles River Laboratory | Cat#001; RRID: RGD_734476 |
| Oligonucleotides | ||
| sgRNA sequence to mutate native MICU1 to C463R in HEK cells: 5’-ACACCTTCCTGTGCACATTTCCACAG | This paper | N/A |
| Recombinant DNA | ||
| MCU, EMRE, MICU1 or MICU2 in pcDNA3.1(+) | Home made | Tsai et al., 2016; Tasi et al., 2017 |
| MICU1 or MICU2 in pLJM1 | This paper | N/A |
| pLKO.hygro constructs to knockdown YME1L1 or AFG3L2 | Home made | Tasi et al., 2017 |
| pCMV_ABEmax | Koblan et al., 2018 | Addgene Cat#112095 |
| MLM3636 sgRNA expression plasmid | Keith Joung | Addgene Cat#43860 |
| Mito-GCaMP6f | Timothy Ryan | Ashrafi et al., 2020 |
| Cyto-GCaMP6f | Chen et al., 2013 | Addgene Cat#40755 |
| Mito-Sypher | Poburko et al., 2011 | Addgene Cat#48251 |
| Cyto-Sypher | Poburko et al., 2011 | Addgene Cat#48250 |
| Mito-roGFP2-Orp1 | Gutscher et al., 2009 | Addgene Cat#64992 |
| Mitochondria-targeted luciferase | Paolo Pinton | Morciano et al., 2017 |
| Mito-GEM-GECO1 | Zhao et al., 2011 | Addgene Cat#32461 |
| MBP-MICU1 in pET24a | This paper | N/A |
| MICU2 in pETDuet | This paper | N/A |
| Software and algorithms | ||
| Igor pro (version 8) | WaveMetrics | https://www.wavemetrics.com/products/igorpro |
| Image Studio (version 5.2) | LI-COR | https://www.licor.com/bio/image-studio/ |
| ImageJ (Mac OS X) | ImageJ website | https://imageJ.nih.gov/ij |
| Time Series Analyzer plug-in (version 3) | Balaji J | https://imagej.nih.gov/ij/plugins/time-series.html |
Experimental Model and Subject Details
Cell lines
HEK293T cells were obtained from ATCC (CRL-11268), authenticated by ATCC using short tandem repeat (STR) profiling when purchased in Jan 2012, and was re-authenticated by ATCC using STR profiling in May 2016. HeLa cells were obtained from ATCC (CCL-2), and was authenticated by ATCC using STR profiling in May 2016. U2OS cells were obtained from the Cell Technologies Shared Resource Center in the University of Colorado School of Medicine. Mouse embryonic fibroblast (MEF) cells were provided by Dr. Vivek Garg (Garg et al., 2021). All these cells were checked for mycoplasma contamination semi-annually using PCR. No contamination has been detected in our last test in December 2021. HEK, HeLa, and MEF cells were cultured in DMEM supplemented with 10% FBS. U2OS cells were grown in McCoy’s 5a Medium with 10% FBS. All cells were culture at 37 °C with 5% CO2.
Animals
All mouse and rat protocols are approved by the Institutional Animal Care and Use Committee at the University of Colorado Denver-Anschutz Medical Campus and adhered to NIH standards. C57BL/6J mice were obtained from the Jackson Laboratory (strain #000664). Sprague Dawley rats were purchased from the Charles River Laboratory (strain #001). Adult animals (10–16 weeks), half male and half female, were used for experiments.
Human subjects
Subjects included in this study gave written informed consent prior to inclusion in the study, and donated their hearts to the Institutional Review Board-approved Adult Cardiac Tissue Bank at the University of Colorado Denver-Anschutz Medical Campus. Subjects included in this study were males and females of all ethnic backgrounds. Normal function heart samples originated from brain dead organ donors with preserved systolic ventricular function (ejection fraction > 50%). These hearts could not be used for transplants due to lack of an appropriate recipient (e.g., size or blood type mismatch).
Method Details
Protein expression, mutagenesis, and RNAi
Genes encoding uniporter subunits were cloned into a pcDNA3.1(+) expression vector, with site-directed mutagenesis performed using the QuickChange kit (Agilent). Transient expression was performed using Lipofectamine 3000 (Life Technologies). Cells were subjected to downstream analysis 24–48 h after transfection. Stable protein expression or shRNA-mediated knockdown was performed via lentivirus transduction using pLJM1 (Addgene 19319) or pLKO.hygro (Addgene 24150), respectively. Cells were incubated with viruses at a multiplicity of infection of 3–20 for 12–14 h, selected by 2.5 μg/mL puromycin or 200 μg/mL hygromycin for 2 days, followed by maintaining and culturing in the presence of 0.25 μg/mL puromycin or 2 μg/mL hygromycin. Gene knockdown efficiency was evaluated by Western blot.
CRISPR knockout and base editing
Crispr/Cas9-mediated knockout of uniporter-subunit genes with insertion-deletion induced by DNA double-strand break has been described and verified in our previous work (Phillips et al., 2019; Tsai et al., 2017; Tsai et al., 2016). Precise MICU1 gene editing without double-strand break was performed using a CRISPR-mediated adenosine base editor (ABE) strategy (Anzalone et al., 2020; Gaudelli et al., 2017; Koblan et al., 2018). In brief, MICU2-KO HEK293 cells were co-transfected with an ABEmax plasmid (Addgene 112095) and an MLM3636 sgRNA expression plasmid (Addgene 43860) using Lipofectamine 2000 (Life Technologies). After two days of incubation, cells were diluted and seeded into 96-well plates to isolate single clones. The results of gene-editing was assessed after 4–6 weeks of cell expansion. Genomic DNA from single colonies was isolated, and then the MICU1 gene was PCR amplified and cloned into pcDNA3 to transform E. coli. Plasmid DNA isolated from at least 15 single E. coli colonies was then analyzed using Sanger sequencing. The sgRNA sequence to mutate native WT MICU1 to C463R: 5’-ACACCTTCCTGTGCACATTTCCACAG.
Mouse and rat mitochondria isolation
C57BL/6 mice were euthanized by CO2 chamber followed by cervical dislocation, with liver, spleen, kidney, heart, hind-leg skeletal muscle and cerebral cortex removed immediately. These organs were flash-frozen in liquid nitrogen and store at −80 °C for subsequent analyses. All the following steps were performed at 4 °C in the presence of a protease inhibitor cocktail (Roche, cOmplete Ultra). Briefly, organs were rinsed free of blood with an ice-cold mitochondrial isolation buffer (MIB, 10 mM Tris, 200 mM sucrose, 1 mM EGTA, pH 7.4-MOPS) and minced into small pieces. Tissues were homogenized by Dounce homogenizers, with debris removed by spinning down the homogenate at 600 g for 10 min. The supernatant was then spun down at 7000 g for 10 min, resuspended in 1 mL of MIB, and spun down again to pellet crude mitochondria. After repeating this step two more times, the mitochondria pellets were resuspended in desired volumes of MIB and the total protein was quantified using the BCA assay. Samples containing 50–150 μg of mitochondrial protein were spun down, resuspended in appropriate volumes of a RIPA buffer (Santa Cruz) supplemented with protease inhibitors, and centrifuged at 13000 g for 10 min to remove debris. The clarified supernatant was analyzed with Western blot.
Sprague Dawley rats were euthanized by Pentobarbital overdose (≥150mg/kg) intraperitoneal injection, with liver, kidney, skeletal muscle, and heart, removed immediately. These organs were flash-frozen in liquid nitrogen and store at −80 °C. Mitochondria extraction follows the sample procedure as mouse mitochondria.
Preparation of human cardiac mitochondria
At the time of cardiac explant, heart tissue was immediately cooled in ice cold oxygenated Tyrode’s solution in the operating room. Ventricular tissue was rapidly dissected and was flash frozen and stored at −80°C until further use. Human left-ventricular cardiac mitochondria were prepared following the mouse mitochondria extraction protocol with some modifications: the fat and scar tissues were carefully trimmed off, with 50–70 mg of cardiac tissues used for mitochondria extraction yielding 200–300 μg of total mitochondrial protein.
Coimmunoprecipitation (CoIP)
HEK cells cultured in 60-mm dishes were transfected at 70–80% confluency and were harvested for CoIP experiments after 2 days. Cells were washed with Tris-buffered saline (TBS, 100 mM NaCl, 20 mM Tris, pH 7.6-HCl) and pelleted. After breaking cells via passing through 27-gauge needles >20 times, mitochondria were isolated using differential centrifugation as above and lysed with 0.5 ml ice-cold solubilization buffer (SB, 150 mM NaCl, 50 mM HEPES, 4 mM DDM, pH 7.4-NaOH), supplemented with protease inhibitors (Roche, cOmplete Ultra). The lysate was clarified by centrifugation, and 10% of the supernatant was reserved for mitochondrial lysate (ML) analysis. 25 μL of 1D4-conjugated Sepharose 4B beads (homemade, 50% slurry) were added to the sample and incubated on a rotating wheel at 4 °C for 1 h. The beads were collected on a spin column, washed 5 times with 1-mL SB, and eluted with 140 μL of SDS loading buffer. ML samples and 30–80 μL of eluent were then used for SDS-PAGE and Western blot.
Protein degradation and recovery experiments
In a typical experiment, 50 μg/mL cycloheximide was added to HEK293 cells in 60-mm dishes. At desired time points, cells were resuspended, and mitochondria were isolated and lysed with ice-cold RIPA buffer supplemented with protease inhibitors. (For protein-recovery experiments, cycloheximide-treated cells were washed 3 times with fresh culture media and incubated for additional time). The samples were quantified by the BCA assay before Western analyses. To follow protein degradation in isolated mitochondria (Fig. S6A), mitochondria extracted from cells in 10-cm dishes were resuspended in a solution containing 250 mM sucrose, 10 mM HEPES, pH 7.2-KOH. Substrates for supporting ATP production (1 mM ADP, 10 mM succinic acid, 5 mM NaPi) or the FoF1-ATPase inhibitor oligomycin (2 μg/mL) were added as indicated. The mitochondrial suspension was gently agitated at a 37 °C incubator and sampled at various time points.
Pulse-chase experiments were performed following published procedures (Petrungaro et al., 2015) with slight modifications. WT HEK cells were starved in a DMEM medium free of cysteine and methionine (Sigma D0422) for 30 min at 37 °C. 35S-methionin (Pekin-Elmer) was then added at a concentration of 200 μCi/mL for 30 min at 37 °C, with pulse labeling quenched by adding 20 mM methionine. We performed a longer 30-min pulse labeling to accumulate more 35S in mitochondria to enhance signals. Mitochondria were isolated and lysed as in the Co-IP experiments. Protein A beads (Santa Cruz, sc-2001) conjugated with anti-MICU1 (Sigma, HPA034780) or anti-MICU2 (Abcam, ab101465) antibodies were added to the lysate and incubated at 4 °C overnight. Beads were loaded onto a filter column and washed five times, and were then transferred into scintillation vials for counting.
Western blots
Proteins were separated using SDS-PAGE and transferred to low-fluorescence PVDF membranes. Blocking was done using an Intercept blocking buffer (LI-COR). After incubating the membranes with primary antibody overnight at 4 °C, and fluorescent secondary antibody for 1 h in room temperature, Western images were acquired using the LI-COR Odyssey CLx imaging system and quantified using the LI-COR Image Studio software (version 5.2). Primary antibody and dilution are as follows: MCU (Cell Signaling, D2Z3B, 1:10000), EMRE (Santa Cruz, 86337, 1:1000), MICU1 (Sigma, HPA034780, 1:5000), MICU2 (Abcam, ab101465, 1:10000), MICU3 (Sigma, HPA024771, 1:5000), VDAC (Abcam, ab14734, 1:5000), COX1 (Abcam, ab14705, 1:5000), COX2 (Abcam, ab110258, 1:10000), Tim23 (Santa Cruz, 5114463, 1:1000), FLAG (Sigma, F1804, 1:10000), YME1L1 (Proteintech, 11510-1-AP, 1:2000), AFG3L2 (Proteintech, 14631-1-AP, 1:5000), Letm1 (Abcam, ab55434, 1:10000), β-actin (Santa Cruz, 69879, 1:2000), NDUFS1 (Santa Cruz, 271510, 1:1000), NDUFS3 (Santa Cruz, 374282, 1:1000), SDHA (Santa Cruz, 390381, 1:1000), Rieske (Santa Cruz, 271609, 1:1000), ATP5F1 (Santa Cruz, 514419, 1:1000), PDH-E1ɑ (Santa Cruz, 377092, 1:1000), S293 phosphorylated PDH-E1ɑ (Sigma-Aldrich, ABS204, 1:10000). Mouse monoclonal anti-1D4 antibody, produced in house, was used at 100 ng/mL. Secondary antibody and dilution: goat-anti rabbit IRDye 680RD (LI-COR 925-681817, 1:10000), goat-anti mouse 800CW (LI-COR 925-32210, 1:15000), and goat-anti mouse 680RD (LI-COR 925-68070, 1:15000). The specificity of the MICU1 and MICU2 antibodies against mouse MICU1 and MICU2 are verified by using MICU1-KO or MICU2-KO MEF cells (Fig. S1H).
MICU1/2 purification and cross-linking
Codon-optimized DNAs encoding human MICU2 or N-terminally maltose binding protein (MBP)-fused human MICU1, both with a hexahistidine tag, were cloned in to the pETDuet and pET24a expression vectors, respectively. Transformed BL21(DE3) cells (Tsai et al., 2012) were grown at 37 °C to OD 0.8 in terrific broth and induced for expression with 1 mM IPTG for 2 h. Cells were pelleted and resuspended in a breaking buffer (BB, 500 mM NaCl, 25 mM HEPES, pH 7.5), supplemented with 1 mM TCEP, 1 mM PMSF, and 1 mg/mL leupeptin and pepstatin. The cell suspension was sonicated on ice and spun down for 30 min at 4 °C at 16,000 g. The clarified lysate was then loaded onto a TALON cobalt-affinity column (Takara) pre-equilibrated with an FPLC buffer (FB, 230 mM NaCl, 25 mM HEPES, pH 7.5). The column was washed and eluted sequentially with 5 mM and 200 mM imidazole. Concentrated protein was further purified using a Superdex 200 Increase size-exclusion column pre-equilibrated with FB. Crosslinking was performed by adding 0.2% glutaraldehyde to 100 μg/mL protein samples for 30 min at room temperature, with the reaction quenched by adding 200 mM Tris. 1–2 μg of cross-linked protein was used for SDS-PAGE and coomassie stain.
Blue-native (BN) PAGE
The Novex Native PAGE Bis-Tris gel system (Invitrogen) was used to perform BN-PAGE. 135 μg of mouse tissues was dissolved in 20 μL of Native PAGE buffer supplied with digitonin, glycerol, and G-250 added to 4%, 4%, and 0.5%, respectively. Electrophoresis was run at 4 °C using 4-16% Bis-Tris gels, followed by transferring to 0.22 μm low-fluorescence PVDF membranes. The membranes were destained by 25% Methanol/10%Acetic acid and blocked with 5% milk in TBS, and then incubated with anti-MCU (Cell Signaling, D2Z3B, 1:5000), anti-MICU1 (Sigma, HPA034780, 1:5000), or anti-MICU2 (Abcam, ab101465, 1:5000) antibodies diluted in TBST (TBS + 0.05% Tween 20) at 4 °C overnight. For colorimetric detection, the membrane was incubated with anti-rabbit alkaline phosphatase-conjugated secondary antibodies (Promega, S373B, 1:5,000 in TBST), and exposed to NBT/BCIP substrates.
Mitochondrial 45Ca2+ flux
To measure 45Ca2+ flux into permeabilized HEK cells, 1.2 × 10⁶ cells were suspended in 1 ml of a wash buffer (WB, 120 mM KCl, 25 mM HEPES, 2 mM KH2PO4, 1 mM MgCl2, 50 μM EGTA, pH 7.2-KOH), spun down, and then resuspended in 120-μL WB, supplemented with 5-μM thapsigargin (Sigma-Aldrich, T9033), 1 mM pyruvate, 0.5 mM malate, and 30-μM digitonin. We have shown previously that digitonin treatments do not affect the driving force for Ca2+ influx (Van Keuren et al., 2020). To initiate mitochondrial Ca2+ uptake with Ca2+ below 1.5 μM, 100-μL cell suspension was transferred to 400-μL low-Ca2+ flux buffer (LCFB, RB + 0.69 mM EGTA, various concentrations of CaCl2, 15 μM 45CaCl2, 1 mM pyruvate, 0.5 mM malate, 30 μM digitonin, 5 μM thapsigargin, pH 7.2-KOH). At desired time points, Ca2+ uptake was terminated by adding 100 μL of the sample to 5-mL ice-cold WB. The mixture was then filtered through 0.45-μM nitrocellulose membranes on a vacuum filtration manifold. The membrane was washed immediately with 5-mL ice-cold WB, and later transferred into scintillation vials for counting. To measure mitochondrial Ca2+ uptake with Ca2+ above 3 μM, 100-uL cell suspension was transferred to 400-μL high-Ca2+ flux buffer (HCFB, 120 mM KCl, 25 mM HEPES, 2 mM KH2PO4, 1 mM MgCl2, various concentrations of 45CaCl2, 1 mM pyruvate, 0.5 mM malate, 30 μM digitonin, 5 μM thapsigargin, pH 7.2-KOH). Ca2+ flux was quenched as above and the samples were counted. 45Ca2+ radioisotope was obtained from Perkin Elmer, and has a specific activity of 10–15 mCi/mg. Free Ca2+ concentrations in all flux buffers were adjusted to desired values using calcium green 5N or Fluo-4. The rate of mitochondrial Ca2+ uptake was obtained by linear fit of data points, with a detailed instruction provided in our previous publications (Phillips et al., 2019; Rodriguez et al., 2021). Counting of radioisotope was performed using a Beckman LS6500 liquid scintillation counter.
To quantify 45Ca2+ flux into isolated mitochondria, mitochondria were first isolated using procedures described above and quantified using the BCA assay. 100 μg of mitochondria were then pelleted, washed with 1-mL WB, and spun down again. 45Ca2+ uptake was initiated by resuspending mitochondria in 500 μL of LCFB or HCFB (without digitonin and thapsigargin), with the uptake terminated by adding 100 μL of the suspension into 5 mL of ice-cold WB at desired time point. The sample was then filtered through 0.1-μm nitrocellulose membranes, with the membranes washed and transferred into scintillation vials four counting. Data analysis was performed in the same way as in permeabilized cells. All 45Ca2+ flux experiments were carried out at 25 °C.
Seahorse assays
The Seahorse XFP instrument (Agilent) was used to measure O2 consumption and extracellular acidification, with procedures slightly modified from the manufacturer’s protocols. Briefly, XFP miniplates were coated with 2 μg collagen (100 ug/mL) and incubated at room temperature for 30 minutes. Cells were seeded at 1.8 × 10⁴ cells/well, and cultured in a CO2 incubator at 37 °C for 18 hours. The assay was performed following the Real-Time ATP Rate Assay kit instructions (Agilent 103591), with the exception that 1.5 mM oligomycin (Cayman 11342) and 0.5 mM rotenone/antimycin A (Cayman 13995/Sigma A8674) stock solutions were prepared in-house. The assay was performed with cells incubated in a DMEM medium containing 10 mM glucose, 1 mM pyruvate, and 2 mM glutamine, pH 7.4, using the solutions supplied by the manufacturer. Raw data were normalized to in-cell Western signals. Briefly, cells in the XFP miniplate were fixed with 12% formaldehyde and permeabilized with 0.1% Triton X-100. After incubating with anti-actin primary antibody (Santa Cruz 69879, 1:200) and goat-anti mouse 680 secondary antibody (LI-COR 926-68070, 1:800), Western signals were obtained using the LI-COR CLx imager. Seahorse data were analyzed using the Agilent Analytics online server.
Measurements of matrix and cytoplasmic Ca2+
Ca2+ imaging was performed using a Zeiss Axiovert 200M inverted epifluorescence microscope equipped with a Thorslab Quantalux sCMOS camera. HEK cells stably expressing mito-GCaMP6f (provided by Dr. Timothy Ryan) or transiently expressing cyto-GCaMP6f (Addgene 40755) were seeded in glass coverslips and grew to 60–70% confluency. Before imaging experiments, the coverslip was washed twice with a modified Tyrode’s solution (TS, 130 mM NaCl, 5.4 mM KCl, 1 mM MgCl2, 2 mM CaCl2, 20 mM HEPES, 5 mM glucose, pH 7.4-NaOH), and was then transferred to a home-made laminar-flow perfusion chamber connected to an inline solution heater to maintain recording temperature at 25 °C. Images were acquired at 1 Hz using Zeiss filter set 38 HE (excitation: 470/40 nm; beamsplitter 495 nm; emission: 525/50 nm) and a Zeiss 20x/0.75 Fluar objective. Cells were perfused with TS during the entire experiment, with carbachol of various concentrations added when necessary. Ionomycin was added at the end of the experiments to move extracellular Ca2+ into the cytoplasm and the mitochondrial matrix to yield maximal GCaMP6f fluorescence (Fmax). Images were analyzed using the ImageJ Time Series Analyzer plug-in. At least 20 regions of interest (ROI), each including a single cell, were selected from each repeat and the fluorescence was measured over time. About 5 – 10% of cells expressing mito-GCaMP6f show mislocalization of mito-GCaMP6f to the cytoplasm, and were excluded from analysis. After subtracting the background obtained from an empty region, the fluorescence reading (F) was converted to free [Ca2+] using the equation:
where KD is the Ca2+ affinity to GCaMP6f, R is the dynamic range, and n is the Hill coefficient. These parameters were obtained from the original report of GCaMP6f (Chen et al., 2013). Ratiometric imaging of mito-GEM-GECO1 (Zhao et al., 2011) was performed similarly, but with the 445 nm/525 nm emission ratio (X) obtained with two filter combinations (ex: 390-420 nm; em: 445/50 nm or 525/50 nm). X was converted to free [Ca2+] using the equation:
where KD and n, obtained from the original paper (Zhao et al., 2011), are the apparent Ca2+ affinity to GEM-GECO1 and the Hill coefficient, respectively. After adding ionomycin to obtain the maximal 445/525 ratio Xmax, EGTA was added to obtain the minimal ratio Xmin.
To measure matrix Ca2+ increase in isolated mitochondria (Fig. 6C), mitochondria stably expressing mito-GCaMP6f were suspended in a recording buffer (100 mM K-gluconate, 5 mM KCl, 10 mM K2HPO4, 1.5 mM MgCl2, 25 mM HEPES, 20 μM EGTA, 1 mM pyruvate, 0.5 mM malate, pH 7.5) to 50 μg/mL, and were loaded into 96-well plates (200 μL/well) with the fluorescence measured by a BioTek Synergy H1M multi-mode plate reader (ex: 480 nm; em: 510 nm). Fluorescence increase (ΔF) in response to the injection of CaCl2 was normalized to the initial fluorescence (F) prior to Ca2+ addition. Free Ca2+ in the extramitochondrial solutions was determined using Calcium Green 5N. 20-μM EGTA was used in the recording buffer so that free [Ca2+] is well defined at time 0. The rather small amount of EGTA allows free [Ca2+] to drop significantly during mitochondrial Ca2+ uptake to mimic intracellular Ca2+ transients.
ΔΨ, pH, H2O2, and NAD(P)H measurements
ΔΨ, matrix pH, cytoplasmic pH, matrix H2O2, NAD(P)H levels were assessed by imaging TMRM, mito-SypHer (Addgene 48251), cyto-SypHer (Addgene 48250), mito-roGFP2-Orp1 (Addgene 64992), and NAD(P)H autofluorescence, respectively. The same imaging setup as above was used, with the exception that Zeiss filter set 20 (ex: 546/12 nm; bs: 560 nm; em: 575-640 nm) was used for TMRM, the following filter combination used for ratiometric measurements of SypHer and roGFP2-Orp1: (ex: 390-420 nm or 470/40 nm; bs: 495 nm; em: 535/30 nm), and Zeiss filter set 49 for NAD(P)H autofluorescence (ex: G365 nm; bs: 395 nm; em: 445/50). For ΔΨ, cells seeded in 35-mm glass-bottom dishes (Cellvis) were incubated with 40 nM TMRM in TS for 30 min at 37 °C. Cells were then washed with TS and imaged within 3 min at 25 °C. The TMRM fluorescence reading was normalized to the reading after adding FCCP to dissipate ΔΨ. For SypHer and roGFP2-Orp1, cells were transfected using 1.5 μg DNA/6-well and seeded into 35-mm glass-bottom dishes for imaging at 25 °C. Background subtracted fluorescence signals were processed using ImageJ. In each repeat, ~20 ROIs, each containing a single cell, were selected to obtain the average for that particular repeat.
Cell death analysis
Reagents that induce cell death (1 mM H2O2, 20 μM thapsigargin, 20 μM doxorubicin, or 300 μM cisplatin) were added to adherent cells in 24-well plates at ~80% confluency and incubated in a 37 °C CO2 incubator for 24 hours. Then, the media was replaced with 300 μL of TS containing 0.5 μg/ml Annexin V CF488A (Biotium 29083) to detect apoptotic cells, 1.5 μM propidium iodide to detect dead cells, and 50 μg/mL Hoescht 33258 to stain nuclei. Fluorescence images were captured using the same setup as above, except that a Zeiss 10x/0.3 Plan-Neofluar objective was used. Zeiss filter sets 38 HE, 20, and 49 were used for Annexin V, propidium iodide, and Hoescht 33258, respectively.
ATP production assays
Detection of matrix ATP in intact cells was performed following published procedures (Jouaville et al., 1999) with minor modifications. Transfected HEK cells (1 μg DNA/6-well) expressing mitochondria-targeted luciferase (construct provided by Dr. Paolo Pinton) (Morciano et al., 2017) were seeded in 96-well plates for 2 days to a confluency of 70–80%. Before experiments, the culture was washed 3 times with an ATP-assay buffer (AAB, 130 mM NaCl, 5.4 mM KCl, 2 mM CaCl2, 20 mM HEPES, 0.1 mM pyruvate, 1 mM Mg-lactate, pFH 7.4-NaOH), and then incubated at 37 °C for 1 h with 100-μL ABB. The plate was then loaded into the Synergy H1M plate reader with an incubation temperature of 25 °C. 100 μL of ABB containing 20 μM of luciferin (Fisher PI88291) and 1 mM DTT was injected followed by injection of 130 μM carbachol to induce ER Ca2+ release. Luminescence was recorded at a sampling frequency of 1 Hz for 3–5 min after adding carbachol.
Mass Spectrometry metabolomics
Metabolomics analysis was performed at the University of Colorado School of Medicine Metabolomics Core. Metabolites from frozen cell pellets were extracted at 2 · 106 cells/mL in ice cold 5:3:2 MeOH:acetonitrile:water (v/v/v). Extractions were performed using vigorous vortexing for 30 min at 4 °C. Supernatants were clarified by centrifugation at 18,000 g for 10 min at 4 °C. 10 μL of the sample was then analyzed using a Thermo Vanquish UHPLC coupled to a Thermo Q Exactive mass spectrometer. Global metabolomics analyses were performed using a 5 min C18 gradient in positive and negative ion modes (separate runs) with electrospray ionization as described elsewhere (Gehrke et al., 2019; Nemkov et al., 2019). For all analyses, the MS scanned in MS1 mode across the m/z range of 65 to 950. Peaks were annotated in conjunction with the KEGG database, integrated, and quality control performed using Maven (Princeton University) as described before (Nemkov et al., 2015).
Quantification and Statistical Analysis
All experiments were repeated at least three times. Data points are presented as mean ± S.E.M in all figures. Curve fitting was performed using Igor Pro (WeveMetrics, version 8). Quantitative Western analysis was done using the Image Studio software (Li-Cor, version 5.2). All statistical analyses were performed using two-tailed Student’s t-test, with significance defined as P < 0.05.
Supplementary Material
Highlights.
The uniporter can be gated by MICU1 homo/heterodimers or MICU-deregulated in tissues
Ca2+ more readily activates the uniporters with MICU1-MICU1 than MICU1-MICU2 dimers
The conserved MICU1 intersubunit disulfide protects MICUs against proteolysis
Tissue-specific MICU regulation comes with physiological benefits and disadvantages
Acknowledgements
We thank Ong Moua, Colin Peters, Sydney Shuff, and Jackson Haynes for technical assistance, Yung-Chi Tu for making the graphical abstract, Dr. Timothy Ryan for providing mito-GCaMP6f, Dr. Paolo Pinton for mtLuc, Dr. Vivek Garg for MICU1- & MICU2-KO mouse embryonic fibroblast cells, Dr. Christopher Miller, Dr. Carmen Sucharov, and Dr. Genevieve Sparagna for insightful discussions. CT, MXR, AMV, HMS, JEL, and MT are supported by the NIH grant R01-GM129345. CP is supported by R01-HL088427.
Footnotes
Publisher's Disclaimer: This is a PDF file of an unedited manuscript that has been accepted for publication. As a service to our customers we are providing this early version of the manuscript. The manuscript will undergo copyediting, typesetting, and review of the resulting proof before it is published in its final form. Please note that during the production process errors may be discovered which could affect the content, and all legal disclaimers that apply to the journal pertain.
Declaration of Interests
The authors declare no competing interests.
References
- Antony AN, Paillard M, Moffat C, Juskeviciute E, Correnti J, Bolon B, Rubin E, Csordas G, Seifert EL, Hoek JB, and Hajnoczky G (2016). MICU1 regulation of mitochondrial Ca(2+) uptake dictates survival and tissue regeneration. Nat Commun 7, 10955. 10.1038/ncomms10955. [DOI] [PMC free article] [PubMed] [Google Scholar]
- Anzalone AV, Koblan LW, and Liu DR (2020). Genome editing with CRISPR-Cas nucleases, base editors, transposases and prime editors. Nat Biotechnol 38, 824–844. 10.1038/s41587-020-0561-9. [DOI] [PubMed] [Google Scholar]
- Ashrafi G, de Juan-Sanz J, Farrell RJ, and Ryan TA (2020). Molecular Tuning of the Axonal Mitochondrial Ca(2+) Uniporter Ensures Metabolic Flexibility of Neurotransmission. Neuron 105, 678–687 e675. 10.1016/j.neuron.2019.11.020. [DOI] [PMC free article] [PubMed] [Google Scholar]
- Baradaran R, Wang C, Siliciano AF, and Long SB (2018). Cryo-EM structures of fungal and metazoan mitochondrial calcium uniporters. Nature. 10.1038/s41586-018-0331-8. [DOI] [PMC free article] [PubMed] [Google Scholar]
- Baughman JM, Perocchi F, Girgis HS, Plovanich M, Belcher-Timme CA, Sancak Y, Bao XR, Strittmatter L, Goldberger O, Bogorad RL, et al. (2011). Integrative genomics identifies MCU as an essential component of the mitochondrial calcium uniporter. Nature 476, 341–345. 10.1038/nature10234. [DOI] [PMC free article] [PubMed] [Google Scholar]
- Brookes PS, Yoon Y, Robotham JL, Anders MW, and Sheu SS (2004). Calcium, ATP, and ROS: a mitochondrial love-hate triangle. Am J Physiol Cell Physiol 287, C817–833. 10.1152/ajpcell.00139.2004. [DOI] [PubMed] [Google Scholar]
- Brown DA, Perry JB, Allen ME, Sabbah HN, Stauffer BL, Shaikh SR, Cleland JG, Colucci WS, Butler J, Voors AA, et al. (2017). Expert consensus document: Mitochondrial function as a therapeutic target in heart failure. Nat Rev Cardiol 14, 238–250. 10.1038/nrcardio.2016.203. [DOI] [PMC free article] [PubMed] [Google Scholar]
- Chen TW, Wardill TJ, Sun Y, Pulver SR, Renninger SL, Baohan A, Schreiter ER, Kerr RA, Orger MB, Jayaraman V, et al. (2013). Ultrasensitive fluorescent proteins for imaging neuronal activity. Nature 499, 295–300. 10.1038/nature12354. [DOI] [PMC free article] [PubMed] [Google Scholar]
- Crompton M, Moser R, Ludi H, and Carafoli E (1978). The interrelations between the transport of sodium and calcium in mitochondria of various mammalian tissues. Eur J Biochem 82, 25–31. 10.1111/j.1432-1033.1978.tb11993.x. [DOI] [PubMed] [Google Scholar]
- Csordas G, Golenar T, Seifert EL, Kamer KJ, Sancak Y, Perocchi F, Moffat C, Weaver D, de la Fuente Perez S, Bogorad R, et al. (2013). MICU1 controls both the threshold and cooperative activation of the mitochondrial Ca(2)(+) uniporter. Cell Metab 17, 976–987. 10.1016/j.cmet.2013.04.020. [DOI] [PMC free article] [PubMed] [Google Scholar]
- De Stefani D, Raffaello A, Teardo E, Szabo I, and Rizzuto R (2011). A forty-kilodalton protein of the inner membrane is the mitochondrial calcium uniporter. Nature 476, 336–340. 10.1038/nature10230. [DOI] [PMC free article] [PubMed] [Google Scholar]
- Fan C, Fan M, Orlando BJ, Fastman NM, Zhang J, Xu Y, Chambers MG, Xu X, Perry K, Liao M, and Feng L (2018). X-ray and cryo-EM structures of the mitochondrial calcium uniporter. Nature. 10.1038/s41586-018-0330-9. [DOI] [PMC free article] [PubMed] [Google Scholar]
- Fan M, Zhang J, Tsai CW, Orlando BJ, Rodriguez M, Xu Y, Liao M, Tsai MF, and Feng L (2020). Structure and mechanism of the mitochondrial Ca(2+) uniporter holocomplex. Nature 582, 129–133. 10.1038/s41586-020-2309-6. [DOI] [PMC free article] [PubMed] [Google Scholar]
- Fieni F, Lee SB, Jan YN, and Kirichok Y (2012). Activity of the mitochondrial calcium uniporter varies greatly between tissues. Nat Commun 3, 1317. 10.1038/ncomms2325. [DOI] [PMC free article] [PubMed] [Google Scholar]
- Garg V, Suzuki J, Paranjpe I, Unsulangi T, Boyman L, Milescu LS, Lederer WJ, and Kirichok Y (2021). The mechanism of MICU-dependent gating of the mitochondrial Ca(2+)uniporter. Elife 10. 10.7554/eLife.69312. [DOI] [PMC free article] [PubMed] [Google Scholar]
- Gaudelli NM, Komor AC, Rees HA, Packer MS, Badran AH, Bryson DI, and Liu DR (2017). Programmable base editing of A*T to G*C in genomic DNA without DNA cleavage. Nature 551, 464–471. 10.1038/nature24644. [DOI] [PMC free article] [PubMed] [Google Scholar]
- Gehrke S, Rice S, Stefanoni D, Wilkerson RB, Nemkov T, Reisz JA, Hansen KC, Lucas A, Cabrales P, Drew K, and D’Alessandro A (2019). Red Blood Cell Metabolic Responses to Torpor and Arousal in the Hibernator Arctic Ground Squirrel. J Proteome Res 18, 1827–1841. 10.1021/acs.jproteome.9b00018. [DOI] [PMC free article] [PubMed] [Google Scholar]
- Giorgi C, Marchi S, and Pinton P (2018). The machineries, regulation and cellular functions of mitochondrial calcium. Nat Rev Mol Cell Biol 19, 713–730. 10.1038/s41580-018-0052-8. [DOI] [PubMed] [Google Scholar]
- Gutscher M, Sobotta MC, Wabnitz GH, Ballikaya S, Meyer AJ, Samstag Y, and Dick TP (2009). Proximity-based protein thiol oxidation by H2O2-scavenging peroxidases. J Biol Chem 284, 31532–31540. 10.1074/jbc.M109.059246. [DOI] [PMC free article] [PubMed] [Google Scholar]
- Jouaville LS, Pinton P, Bastianutto C, Rutter GA, and Rizzuto R (1999). Regulation of mitochondrial ATP synthesis by calcium: evidence for a long-term metabolic priming. Proc Natl Acad Sci U S A 96, 13807–13812. 10.1073/pnas.96.24.13807. [DOI] [PMC free article] [PubMed] [Google Scholar]
- Kamer KJ, Grabarek Z, and Mootha VK (2017). High-affinity cooperative Ca(2+) binding by MICU1-MICU2 serves as an on-off switch for the uniporter. EMBO Rep 18, 1397–1411. 10.15252/embr.201643748. [DOI] [PMC free article] [PubMed] [Google Scholar]
- Kamer KJ, and Mootha VK (2015). The molecular era of the mitochondrial calcium uniporter. Nat Rev Mol Cell Biol 16, 545–553. 10.1038/nrm4039. [DOI] [PubMed] [Google Scholar]
- Kirichok Y, Krapivinsky G, and Clapham DE (2004). The mitochondrial calcium uniporter is a highly selective ion channel. Nature 427, 360–364. 10.1038/nature02246. [DOI] [PubMed] [Google Scholar]
- Koblan LW, Doman JL, Wilson C, Levy JM, Tay T, Newby GA, Maianti JP, Raguram A, and Liu DR (2018). Improving cytidine and adenine base editors by expression optimization and ancestral reconstruction. Nat Biotechnol 36, 843–846. 10.1038/nbt.4172. [DOI] [PMC free article] [PubMed] [Google Scholar]
- Konig T, Troder SE, Bakka K, Korwitz A, Richter-Dennerlein R, Lampe PA, Patron M, Muhlmeister M, Guerrero-Castillo S, Brandt U, et al. (2016). The m-AAA Protease Associated with Neurodegeneration Limits MCU Activity in Mitochondria. Mol Cell 64, 148–162. 10.1016/j.molcel.2016.08.020. [DOI] [PubMed] [Google Scholar]
- Kwong JQ, Lu X, Correll RN, Schwanekamp JA, Vagnozzi RJ, Sargent MA, York AJ, Zhang J, Bers DM, and Molkentin JD (2015). The Mitochondrial Calcium Uniporter Selectively Matches Metabolic Output to Acute Contractile Stress in the Heart. Cell Rep 12, 15–22. 10.1016/j.celrep.2015.06.002. [DOI] [PMC free article] [PubMed] [Google Scholar]
- Liu JC, Liu J, Holmstrom KM, Menazza S, Parks RJ, Fergusson MM, Yu ZX, Springer DA, Halsey C, Liu C, et al. (2016). MICU1 Serves as a Molecular Gatekeeper to Prevent In Vivo Mitochondrial Calcium Overload. Cell Rep 16, 1561–1573. 10.1016/j.celrep.2016.07.011. [DOI] [PMC free article] [PubMed] [Google Scholar]
- Liu T, and O’Rourke B (2008). Enhancing mitochondrial Ca2+ uptake in myocytes from failing hearts restores energy supply and demand matching. Circ Res 103, 279–288. 10.1161/CIRCRESAHA.108.175919. [DOI] [PMC free article] [PubMed] [Google Scholar]
- Logan CV, Szabadkai G, Sharpe JA, Parry DA, Torelli S, Childs AM, Kriek M, Phadke R, Johnson CA, Roberts NY, et al. (2014). Loss-of-function mutations in MICU1 cause a brain and muscle disorder linked to primary alterations in mitochondrial calcium signaling. Nat Genet 46, 188–193. 10.1038/ng.2851. [DOI] [PubMed] [Google Scholar]
- Luongo TS, Lambert JP, Yuan A, Zhang X, Gross P, Song J, Shanmughapriya S, Gao E, Jain M, Houser SR, et al. (2015). The Mitochondrial Calcium Uniporter Matches Energetic Supply with Cardiac Workload during Stress and Modulates Permeability Transition. Cell Rep 12, 23–34. 10.1016/j.celrep.2015.06.017. [DOI] [PMC free article] [PubMed] [Google Scholar]
- Maack C, Cortassa S, Aon MA, Ganesan AN, Liu T, and O’Rourke B (2006). Elevated cytosolic Na+ decreases mitochondrial Ca2+ uptake during excitation-contraction coupling and impairs energetic adaptation in cardiac myocytes. Circ Res 99, 172–182. 10.1161/01.RES.0000232546.92777.05. [DOI] [PMC free article] [PubMed] [Google Scholar]
- Mallilankaraman K, Doonan P, Cardenas C, Chandramoorthy HC, Muller M, Miller R, Hoffman NE, Gandhirajan RK, Molgo J, Birnbaum MJ, et al. (2012). MICU1 is an essential gatekeeper for MCU-mediated mitochondrial Ca(2+) uptake that regulates cell survival. Cell 151, 630–644. 10.1016/j.cell.2012.10.011. [DOI] [PMC free article] [PubMed] [Google Scholar]
- Morciano G, Sarti AC, Marchi S, Missiroli S, Falzoni S, Raffaghello L, Pistoia V, Giorgi C, Di Virgilio F, and Pinton P (2017). Use of luciferase probes to measure ATP in living cells and animals. Nat Protoc 12, 1542–1562. 10.1038/nprot.2017.052. [DOI] [PubMed] [Google Scholar]
- Murphy E, and Steenbergen C (2008). Mechanisms underlying acute protection from cardiac ischemia-reperfusion injury. Physiol Rev 88, 581–609. 10.1152/physrev.00024.2007. [DOI] [PMC free article] [PubMed] [Google Scholar]
- Murphy MP (2009). How mitochondria produce reactive oxygen species. Biochem J 417, 1–13. 10.1042/BJ20081386. [DOI] [PMC free article] [PubMed] [Google Scholar]
- Nemkov T, D’Alessandro A, and Hansen KC (2015). Three-minute method for amino acid analysis by UHPLC and high-resolution quadrupole orbitrap mass spectrometry. Amino Acids 47, 2345–2357. 10.1007/s00726-015-2019-9. [DOI] [PMC free article] [PubMed] [Google Scholar]
- Nemkov T, Reisz JA, Gehrke S, Hansen KC, and D’Alessandro A (2019). High-Throughput Metabolomics: Isocratic and Gradient Mass Spectrometry-Based Methods. Methods Mol Biol 1978, 13–26. 10.1007/978-1-4939-9236-2_2. [DOI] [PubMed] [Google Scholar]
- Nguyen NX, Armache JP, Lee C, Yang Y, Zeng W, Mootha VK, Cheng Y, Bai XC, and Jiang Y (2018). Cryo-EM structure of a fungal mitochondrial calcium uniporter. Nature. 10.1038/s41586-018-0333-6. [DOI] [PMC free article] [PubMed] [Google Scholar]
- Paillard M, Csordas G, Huang KT, Varnai P, Joseph SK, and Hajnoczky G (2018). MICU1 Interacts with the D-Ring of the MCU Pore to Control Its Ca(2+) Flux and Sensitivity to Ru360. Mol Cell 72, 778–785 e773. 10.1016/j.molcel.2018.09.008. [DOI] [PMC free article] [PubMed] [Google Scholar]
- Paillard M, Csordas G, Szanda G, Golenar T, Debattisti V, Bartok A, Wang N, Moffat C, Seifert EL, Spat A, and Hajnoczky G (2017). Tissue-Specific Mitochondrial Decoding of Cytoplasmic Ca(2+) Signals Is Controlled by the Stoichiometry of MICU1/2 and MCU. Cell Rep 18, 2291–2300. 10.1016/j.celrep.2017.02.032. [DOI] [PMC free article] [PubMed] [Google Scholar]
- Patron M, Checchetto V, Raffaello A, Teardo E, Vecellio Reane D, Mantoan M, Granatiero V, Szabo I, De Stefani D, and Rizzuto R (2014). MICU1 and MICU2 finely tune the mitochondrial Ca2+ uniporter by exerting opposite effects on MCU activity. Mol Cell 53, 726–737. 10.1016/j.molcel.2014.01.013. [DOI] [PMC free article] [PubMed] [Google Scholar]
- Patron M, Granatiero V, Espino J, Rizzuto R, and De Stefani D (2019). MICU3 is a tissue-specific enhancer of mitochondrial calcium uptake. Cell Death Differ 26, 179–195. 10.1038/s41418-018-0113-8. [DOI] [PMC free article] [PubMed] [Google Scholar]
- Payne R, Hoff H, Roskowski A, and Foskett JK (2017). MICU2 Restricts Spatial Crosstalk between InsP3R and MCU Channels by Regulating Threshold and Gain of MICU1-Mediated Inhibition and Activation of MCU. Cell Rep 21, 3141–3154. 10.1016/j.celrep.2017.11.064. [DOI] [PMC free article] [PubMed] [Google Scholar]
- Petrungaro C, Zimmermann KM, Kuttner V, Fischer M, Dengjel J, Bogeski I, and Riemer J (2015). The Ca(2+)-Dependent Release of the Mia40-Induced MICU1-MICU2 Dimer from MCU Regulates Mitochondrial Ca(2+) Uptake. Cell Metab 22, 721–733. 10.1016/j.cmet.2015.08.019. [DOI] [PubMed] [Google Scholar]
- Phillips CB, Tsai CW, and Tsai MF (2019). The conserved aspartate ring of MCU mediates MICU1 binding and regulation in the mitochondrial calcium uniporter complex. Elife 8. 10.7554/eLife.41112. [DOI] [PMC free article] [PubMed] [Google Scholar]
- Plovanich M, Bogorad RL, Sancak Y, Kamer KJ, Strittmatter L, Li AA, Girgis HS, Kuchimanchi S, De Groot J, Speciner L, et al. (2013). MICU2, a paralog of MICU1, resides within the mitochondrial uniporter complex to regulate calcium handling. PLoS One 8, e55785. 10.1371/journal.pone.0055785. [DOI] [PMC free article] [PubMed] [Google Scholar]
- Poburko D, Santo-Domingo J, and Demaurex N (2011). Dynamic regulation of the mitochondrial proton gradient during cytosolic calcium elevations. J Biol Chem 286, 11672–11684. 10.1074/jbc.M110.159962. [DOI] [PMC free article] [PubMed] [Google Scholar]
- Quiros PM, Langer T, and Lopez-Otin C (2015). New roles for mitochondrial proteases in health, ageing and disease. Nat Rev Mol Cell Biol 16, 345–359. 10.1038/nrm3984. [DOI] [PubMed] [Google Scholar]
- Rizzuto R, De Stefani D, Raffaello A, and Mammucari C (2012). Mitochondria as sensors and regulators of calcium signalling. Nat Rev Mol Cell Biol 13, 566–578. 10.1038/nrm3412. [DOI] [PubMed] [Google Scholar]
- Rodriguez MX, Van Keuren AM, and Tsai MF (2021). Quantitative assays to measure the transport activity of the mitochondrial calcium uniporter in cell lines or Xenopus oocytes. STAR Protoc 2, 100979. 10.1016/j.xpro.2021.100979. [DOI] [PMC free article] [PubMed] [Google Scholar]
- Sancak Y, Markhard AL, Kitami T, Kovacs-Bogdan E, Kamer KJ, Udeshi ND, Carr SA, Chaudhuri D, Clapham DE, Li AA, et al. (2013). EMRE is an essential component of the mitochondrial calcium uniporter complex. Science 342, 1379–1382. 10.1126/science.1242993. [DOI] [PMC free article] [PubMed] [Google Scholar]
- Santulli G, Xie W, Reiken SR, and Marks AR (2015). Mitochondrial calcium overload is a key determinant in heart failure. Proc Natl Acad Sci U S A 112, 11389–11394. 10.1073/pnas.1513047112. [DOI] [PMC free article] [PubMed] [Google Scholar]
- Tsai CW, and Tsai MF (2018). Electrical recordings of the mitochondrial calcium uniporter in Xenopus oocytes. J Gen Physiol 150, 1035–1043. 10.1085/jgp.201812015. [DOI] [PMC free article] [PubMed] [Google Scholar]
- Tsai CW, Van Keuren AM, Bankston J, Ma Z, and Tsai MF (2021). MICU1 occuldes MCU in the mitochondrial calcium uniporter complex. BioRxiv. 10.1101/2021.11.15.468501. [DOI] [Google Scholar]
- Tsai CW, Wu Y, Pao PC, Phillips CB, Williams C, Miller C, Ranaghan M, and Tsai MF (2017). Proteolytic control of the mitochondrial calcium uniporter complex. Proc Natl Acad Sci U S A 114, 4388–4393. 10.1073/pnas.1702938114. [DOI] [PMC free article] [PubMed] [Google Scholar]
- Tsai MF, Fang Y, and Miller C (2012). Sided functions of an arginine-agmatine antiporter oriented in liposomes. Biochemistry 51, 1577–1585. 10.1021/bi201897t. [DOI] [PMC free article] [PubMed] [Google Scholar]
- Tsai MF, Phillips CB, Ranaghan M, Tsai CW, Wu Y, Willliams C, and Miller C (2016). Dual functions of a small regulatory subunit in the mitochondrial calcium uniporter complex. Elife 5. 10.7554/eLife.15545. [DOI] [PMC free article] [PubMed] [Google Scholar]
- Van Keuren AM, Tsai CW, Balderas E, Rodriguez MX, Chaudhuri D, and Tsai MF (2020). Mechanisms of EMRE-Dependent MCU Opening in the Mitochondrial Calcium Uniporter Complex. Cell Rep 33, 108486. 10.1016/j.celrep.2020.108486. [DOI] [PMC free article] [PubMed] [Google Scholar]
- Wang L, Yang X, Li S, Wang Z, Liu Y, Feng J, Zhu Y, and Shen Y (2014). Structural and mechanistic insights into MICU1 regulation of mitochondrial calcium uptake. EMBO J 33, 594–604. 10.1002/embj.201386523. [DOI] [PMC free article] [PubMed] [Google Scholar]
- Wang Y, Nguyen NX, She J, Zeng W, Yang Y, Bai XC, and Jiang Y (2019). Structural Mechanism of EMRE-Dependent Gating of the Human Mitochondrial Calcium Uniporter. Cell 177, 1252–1261 e1213. 10.1016/j.cell.2019.03.050. [DOI] [PMC free article] [PubMed] [Google Scholar]
- Wescott AP, Kao JPY, Lederer WJ, and Boyman L (2019). Voltage-energized Calcium-sensitive ATP Production by Mitochondria. Nat Metab 1, 975–984. 10.1038/s42255-019-0126-8. [DOI] [PMC free article] [PubMed] [Google Scholar]
- Williams GS, Boyman L, Chikando AC, Khairallah RJ, and Lederer WJ (2013). Mitochondrial calcium uptake. Proc Natl Acad Sci U S A 110, 10479–10486. 10.1073/pnas.1300410110. [DOI] [PMC free article] [PubMed] [Google Scholar]
- Wu W, Shen Q, Zhang R, Qiu Z, Wang Y, Zheng J, and Jia Z (2020). The structure of the MICU1-MICU2 complex unveils the regulation of the mitochondrial calcium uniporter. EMBO J 39, e104285. 10.15252/embj.2019104285. [DOI] [PMC free article] [PubMed] [Google Scholar]
- Wu Y, Rasmussen TP, Koval OM, Joiner ML, Hall DD, Chen B, Luczak ED, Wang Q, Rokita AG, Wehrens XH, et al. (2015). The mitochondrial uniporter controls fight or flight heart rate increases. Nat Commun 6, 6081. 10.1038/ncomms7081. [DOI] [PMC free article] [PubMed] [Google Scholar]
- Xing Y, Wang M, Wang J, Nie Z, Wu G, Yang X, and Shen Y (2019). Dimerization of MICU Proteins Controls Ca(2+) Influx through the Mitochondrial Ca(2+) Uniporter. Cell Rep 26, 1203–1212 e1204. 10.1016/j.celrep.2019.01.022. [DOI] [PubMed] [Google Scholar]
- Yoo J, Wu M, Yin Y, Herzik MA Jr., Lander GC, and Lee SY (2018). Cryo-EM structure of a mitochondrial calcium uniporter. Science. 10.1126/science.aar4056. [DOI] [PMC free article] [PubMed] [Google Scholar]
- Zhao Y, Araki S, Wu J, Teramoto T, Chang YF, Nakano M, Abdelfattah AS, Fujiwara M, Ishihara T, Nagai T, and Campbell RE (2011). An expanded palette of genetically encoded Ca(2)(+) indicators. Science 333, 1888–1891. 10.1126/science.1208592. [DOI] [PMC free article] [PubMed] [Google Scholar]
- Zhou B, and Tian R (2018). Mitochondrial dysfunction in pathophysiology of heart failure. J Clin Invest 128, 3716–3726. 10.1172/JCI120849. [DOI] [PMC free article] [PubMed] [Google Scholar]
Associated Data
This section collects any data citations, data availability statements, or supplementary materials included in this article.
Supplementary Materials
Data Availability Statement
Original Western-blot/protein-gel images and micrographs used in the main and supplementary figures have been deposited at Mendeley Data and are publicly available as of the date of publication. The DOI is listed in the key resources table. All other data reported in this paper will be shared by the lead contact upon request.
This paper does not report original code.
Any additional information required to reanalyze the data reported in this paper is available from the lead contact upon request.
Key resources table
| REAGENT or RESOURCE | SOURCE | IDENTIFIER |
|---|---|---|
| Antibodies | ||
| MCU | Cell Signaling | Cat#D2Z3B; RRID: AB_2721812 |
| EMRE | Santa Cruz | Cat#86337; RRID: AB_2250685 |
| MICU1 | Atlas Antibodies | Cat#HPA034780; RRID: AB_10696934 |
| MICU2 | Abcam | Cat#ab101465 |
| MICU3 | Atlas Antibodies | Cat# HPA024771; RRID: AB_1848022 |
| VDAC | Abcam | Cat# ab14734 RRID: AB_443084 |
| COX1 | Abcam | Cat#ab14705; RRID: AB_2084810 |
| COX2 | Abcam | Cat#ab14734 |
| Tim23 | Santa Cruz | Cat#sc-5114463 |
| FLAG | Sigma-Aldrich | Cat#F1804; RRID: AB_262044 |
| YME1L1 | Proteintech | Cat#11510-1-AP; RRID: AB_2217459 |
| AFG3L2 | Proteintech | Cat#14631-1-AP; RRID: AB_2242420 |
| Letm1 | Abcam | Cat#ab55434; RRID: AB_943985 |
| β-actin | Santa Cruz | Cat#sc-69879; RRID: AB_1119529 |
| NDUFS1 | Santa Cruz | Cat#sc-271510; RRID: AB10655669 |
| NDUFS3 | Santa Cruz | Cat#sc-374282; RRID: AB_10991315 |
| SDHA | Santa Cruz | Cat#sc-390381 |
| Rieske | Santa Cruz | Cat#sc-271609 RRID: AB_10655682 |
| ATP5F1 | Santa Cruz | Cat#sc-514419 |
| 1D4 | Home made | N/A |
| PDH-E1ɑ | Santa Cruz | Cat#sc-377092 RRID: AB_2716767 |
| S293 phosphorylated PDH-E1ɑ | Millipore | Cat#ABS204 RRID: AB_11205754 |
| IRDye 680RD goat-anti rabbit | LI-COR | Cat#925-68071; RRID: AB_2721181 |
| IRDye 800CW goat-anti mouse | LI-COR | Cat#925-32210; RRID: AB_2687825 |
| IRDye 680RD goat-anti mouse | LI-COR | Cat#925-68070 RRID: AB_2651128 |
| Alkaline phosphatase conjugated anti-rabbit secondary antibody | Promega | Cat# S373B |
| Bacterial and virus strains | ||
| E. coli: DH5ɑ competent cells | New England Biolabs | Cat#C2987H |
| E. coli: BL21(DE3) | Christopher Miller | Tsai et al., 2012 |
| Biological samples | ||
| Left ventricular tissues of non-failing human hearts | Adult Cardiac Tissue Bank at the University of Colorado Denver-Anschutz Medical campus | N/A |
| Chemicals, peptides, and recombinant proteins | ||
| Lipofectamine 3000 | Life Technologies | Cat#L3000150 |
| Lipofectamine 2000 | Life Technologies | Cat#11668019 |
| DDM, anagrade | Anatrace | Cat#D310 |
| RIPA buffer | Santa Cruz | Cat#sc-24948 |
| Intercept blocking buffer (TBS-based) | LI-COR | Cat#927-60001 |
| PVDF membranes | LI-COR | Cat#926-31097 |
| Protease inhibitor cocktail tablet | Roche | Cat#05892970001 |
| TALON cobalt affinity resin | Takara | Cat#635504 |
| CNBr-activated Sepharose 4B | GE Healthcare | Cat#17043001 |
| Cycloheximide | Sigma | Cat#C7698 |
| Oligomycin | Cayman | Cat#11342 |
| Rotenone | Cayman | Cat#13995 |
| Antimycin A | Sigma | Cat#A8674 |
| Ionomycin | Cayman | Cat#11932 |
| Carbachol | Cayman | Cat#114486 |
| 45Ca2+ radioisotope | Perkin-Elmer | Cat#NEZ013001MC |
| 35S-methionine | Perkin-Elmer | Cat#NEG009A001MC |
| Cysteine/methionine free medium | Sigma | Cat#D0422 |
| Protein A beads | Santa Cruz | Cat#sc-2001 |
| Thapsigargin | Cayman | Cat#10522 |
| Digitonin | Sigma-Aldrich | Cat#D141 |
| Calcium green 5N | Life Technologies | Cat#C3737 |
| TMRM | Invitrogen | Cat#T668 |
| FCCP | Cayman | Cat#15218 |
| Doxorubicin | Tokyo Chemical Industry | Cat#D4193 |
| Cisplatin | Tokyo Chemical Industry | Cat#D3371 |
| Annexin V CF488A | Biotium | Cat#29083 |
| Propidium Iodide | Cayman | Cat#14289 |
| Hoescht 33258 | Cayman | Cat#16756 |
| Luciferin | ThermoFisher | Cat#PI88291 |
| Critical commercial assays | ||
| Seahorse XF Real-time ATP Rate Assay Kit | Agilent | Cat#103591-100 |
| QuickChange II Kit | Agilent | Cat#200524 |
| BCA assay kit | Thermo | Cat#23225 |
| NativePAGE Sample Prep kit | Invitrogen | Cat#BN2008 |
| NativePAGE Running Buffer kit | Invitrogen | Cat#BN2007 |
| Deposited data | ||
| Unprocessed images used in the figures | This paper | doi:10.17632/shrtrdfhyt.1 |
| Experimental models: Cell lines | ||
| HEK 293T: wild type | ATCC | Cat#CRL-11268; RRID: CVCL_1926 |
| HeLa: wild type | ATCC | Cat#CCL-2; RRID: CVCL_0030 |
| U2OS: wild type | Cell Technologies Resource Center in the University of Colorado Anschutz Medical Campus | https://medschool.cuanschutz.edu/colorado-cancer-center/research/shared-resources/cell-technologies/cell-culture-services |
| HEK 293T: MICU1-KO | Home made | Tsai et al., 2017 |
| HEK 293T: MICU2-KO | Home made | Fan et al., 2020 |
| HEK 293T: MICU1-MICU2-KO | Home made | Fan et al., 2020 |
| HEK 239T: C463R-MICU1 (CRISPR base edited) | This paper | N/A |
| MEF cells: wild type | Vivek Garg | Garg et al., 2021 |
| MEF cells: MICU1-KO | Vivek Garg | Garg et al., 2021 |
| MEF cells: MICU2-KO | Vivek Garg | Garg et al., 2021 |
| Experimental models: Organisms/strains | ||
| C57BL/6J mouse: wild type | Jackson Laboratory | Cat#000664; RRID: IMSR_JAX:000664 |
| Sprague Dawley rats: wild type | Charles River Laboratory | Cat#001; RRID: RGD_734476 |
| Oligonucleotides | ||
| sgRNA sequence to mutate native MICU1 to C463R in HEK cells: 5’-ACACCTTCCTGTGCACATTTCCACAG | This paper | N/A |
| Recombinant DNA | ||
| MCU, EMRE, MICU1 or MICU2 in pcDNA3.1(+) | Home made | Tsai et al., 2016; Tasi et al., 2017 |
| MICU1 or MICU2 in pLJM1 | This paper | N/A |
| pLKO.hygro constructs to knockdown YME1L1 or AFG3L2 | Home made | Tasi et al., 2017 |
| pCMV_ABEmax | Koblan et al., 2018 | Addgene Cat#112095 |
| MLM3636 sgRNA expression plasmid | Keith Joung | Addgene Cat#43860 |
| Mito-GCaMP6f | Timothy Ryan | Ashrafi et al., 2020 |
| Cyto-GCaMP6f | Chen et al., 2013 | Addgene Cat#40755 |
| Mito-Sypher | Poburko et al., 2011 | Addgene Cat#48251 |
| Cyto-Sypher | Poburko et al., 2011 | Addgene Cat#48250 |
| Mito-roGFP2-Orp1 | Gutscher et al., 2009 | Addgene Cat#64992 |
| Mitochondria-targeted luciferase | Paolo Pinton | Morciano et al., 2017 |
| Mito-GEM-GECO1 | Zhao et al., 2011 | Addgene Cat#32461 |
| MBP-MICU1 in pET24a | This paper | N/A |
| MICU2 in pETDuet | This paper | N/A |
| Software and algorithms | ||
| Igor pro (version 8) | WaveMetrics | https://www.wavemetrics.com/products/igorpro |
| Image Studio (version 5.2) | LI-COR | https://www.licor.com/bio/image-studio/ |
| ImageJ (Mac OS X) | ImageJ website | https://imageJ.nih.gov/ij |
| Time Series Analyzer plug-in (version 3) | Balaji J | https://imagej.nih.gov/ij/plugins/time-series.html |