

SUMMARY
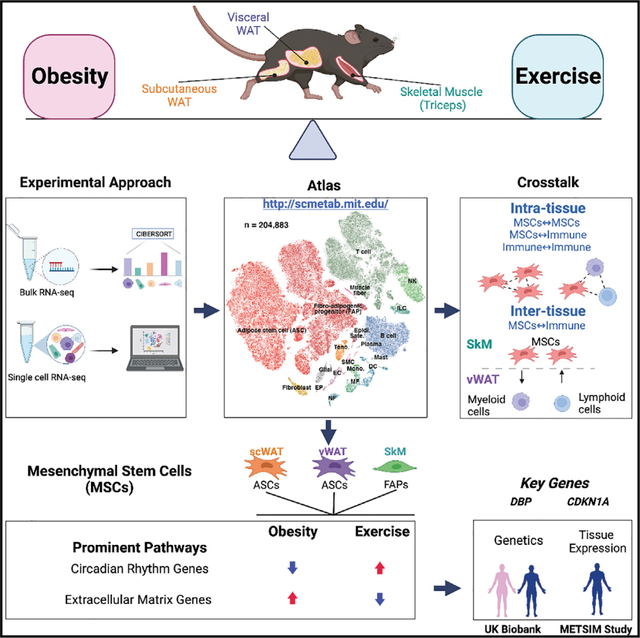
Exercise training is critical for the prevention and treatment of obesity, but its underlying mechanisms remain incompletely understood given the challenge of profiling heterogeneous effects across multiple tissues and cell types. Here, we address this challenge and opposing effects of exercise and high-fat diet (HFD)-induced obesity at single-cell resolution in subcutaneous and visceral white adipose tissue and skeletal muscle in mice with diet and exercise training interventions. We identify a prominent role of mesenchymal stem cells (MSCs) in obesity and exercise-induced tissue adaptation. Among the pathways regulated by exercise and HFD in MSCs across the three tissues, extracellular matrix remodeling and circadian rhythm are the most prominent. Inferred cell-cell interactions implicate within- and multi-tissue crosstalk centered around MSCs. Overall, our work reveals the intricacies and diversity of multi-tissue molecular responses to exercise and obesity and uncovers a previously underappreciated role of MSCs in tissue-specific and multi-tissue beneficial effects of exercise.
In brief
In this paper, Yang et al. provide a high-quality single-cell atlas of obesity-exercise interactions in subcutaneous and visceral white adipose tissue and skeletal muscle in mice. It uncovers a previously underappreciated role of mesenchymal stem cells in the response to obesity and exercise training in these three tissues.
Graphical Abstract
INTRODUCTION
Regular physical exercise is a well-established intervention to prevent and treat people with obesity and diabetes (Kirwan et al., 2017). Determining the molecular mechanisms mediating the beneficial effects of exercise can lead to the identification of biomarkers and therapeutic targets (Sanford et al., 2020). However, this has been a challenging task because exercise is a complex physiological stimulus that induces beneficial adaptations to different organ systems by altering expression of key genes and proteins. We hypothesize that this occurs by directly impacting heterogeneous cell types within individual tissues and by modulating intra- and inter-tissue communication. Here, taking advantage of recent single-cell technologies and advancements in computational biology, we address the challenge by simultaneously investigating responses to exercise and obesity on the molecular, cell-type-specific, and cross-tissue levels.
White adipose tissue (WAT) and skeletal muscle (SkM) are among the most dynamic endocrine organs impacted by obesity and exercise, and as such have been the focus of studies on the tissue level (Gonzalez-Gil and Elizondo-Montemayor, 2020; Leal et al., 2018; Nigro et al., 2021; Sakurai et al., 2013; Stanford et al., 2015; Takahashi et al., 2019). Subcutaneous and visceral WAT (scWAT and vWAT), the two major WAT depots, as well as SkM are highly heterogeneous tissues with complex structures consisting of different cellular components. Both WAT depots are composed of mature adipocytes and the stromal vascular fraction (SVF), which consists of multiple cell types including adipose stem cells (ASCs) and a variety of immune cells (Stenkula and Erlanson-Albertsson, 2018). SkM consists of myofibers, surrounded by connective tissue; MSCs, including satellite cells and fibro-adipogenic progenitors (FAPs); and immune cells (Camps et al., 2020; Dos Santos et al., 2020; Oprescu et al., 2020; Rubenstein et al., 2020). Dissection of WAT using single-cell or single-nucleus RNA sequencing has been presented in the context of obesity, cold exposure, or beta-adrenergic treatment but not following exercise interventions (Henriques et al., 2020; Rajbhandari et al., 2019; Sárvári et al., 2021; Vijay et al., 2020). In SkM, single-cell efforts have been limited compared to WAT and the existing studies have focused on SkM cell-type characterization and tissue regeneration (Camps et al., 2020; Dos Santos et al., 2020; Rubenstein et al., 2020). There have been no investigations of the beneficial effects of exercise to combat obesity at a single-cell resolution and spanning multiple tissues.
In this study, we dissect the opposing effects of exercise training and diet-induced obesity in scWAT, vWAT, and SkM at both tissue-level and single-cell resolution. Our results provide a reference atlas of obesity-exercise single-cell changes in metabolic tissues (Figures 1A and 1B; http://scmetab.mit.edu/) and reveal key roles for MSCs in potentially mediating tissue-specific and inter-tissue communication changes in response to obesity and exercise interventions.
Figure 1. Study overview, highlighted results, and phenotypic responses.
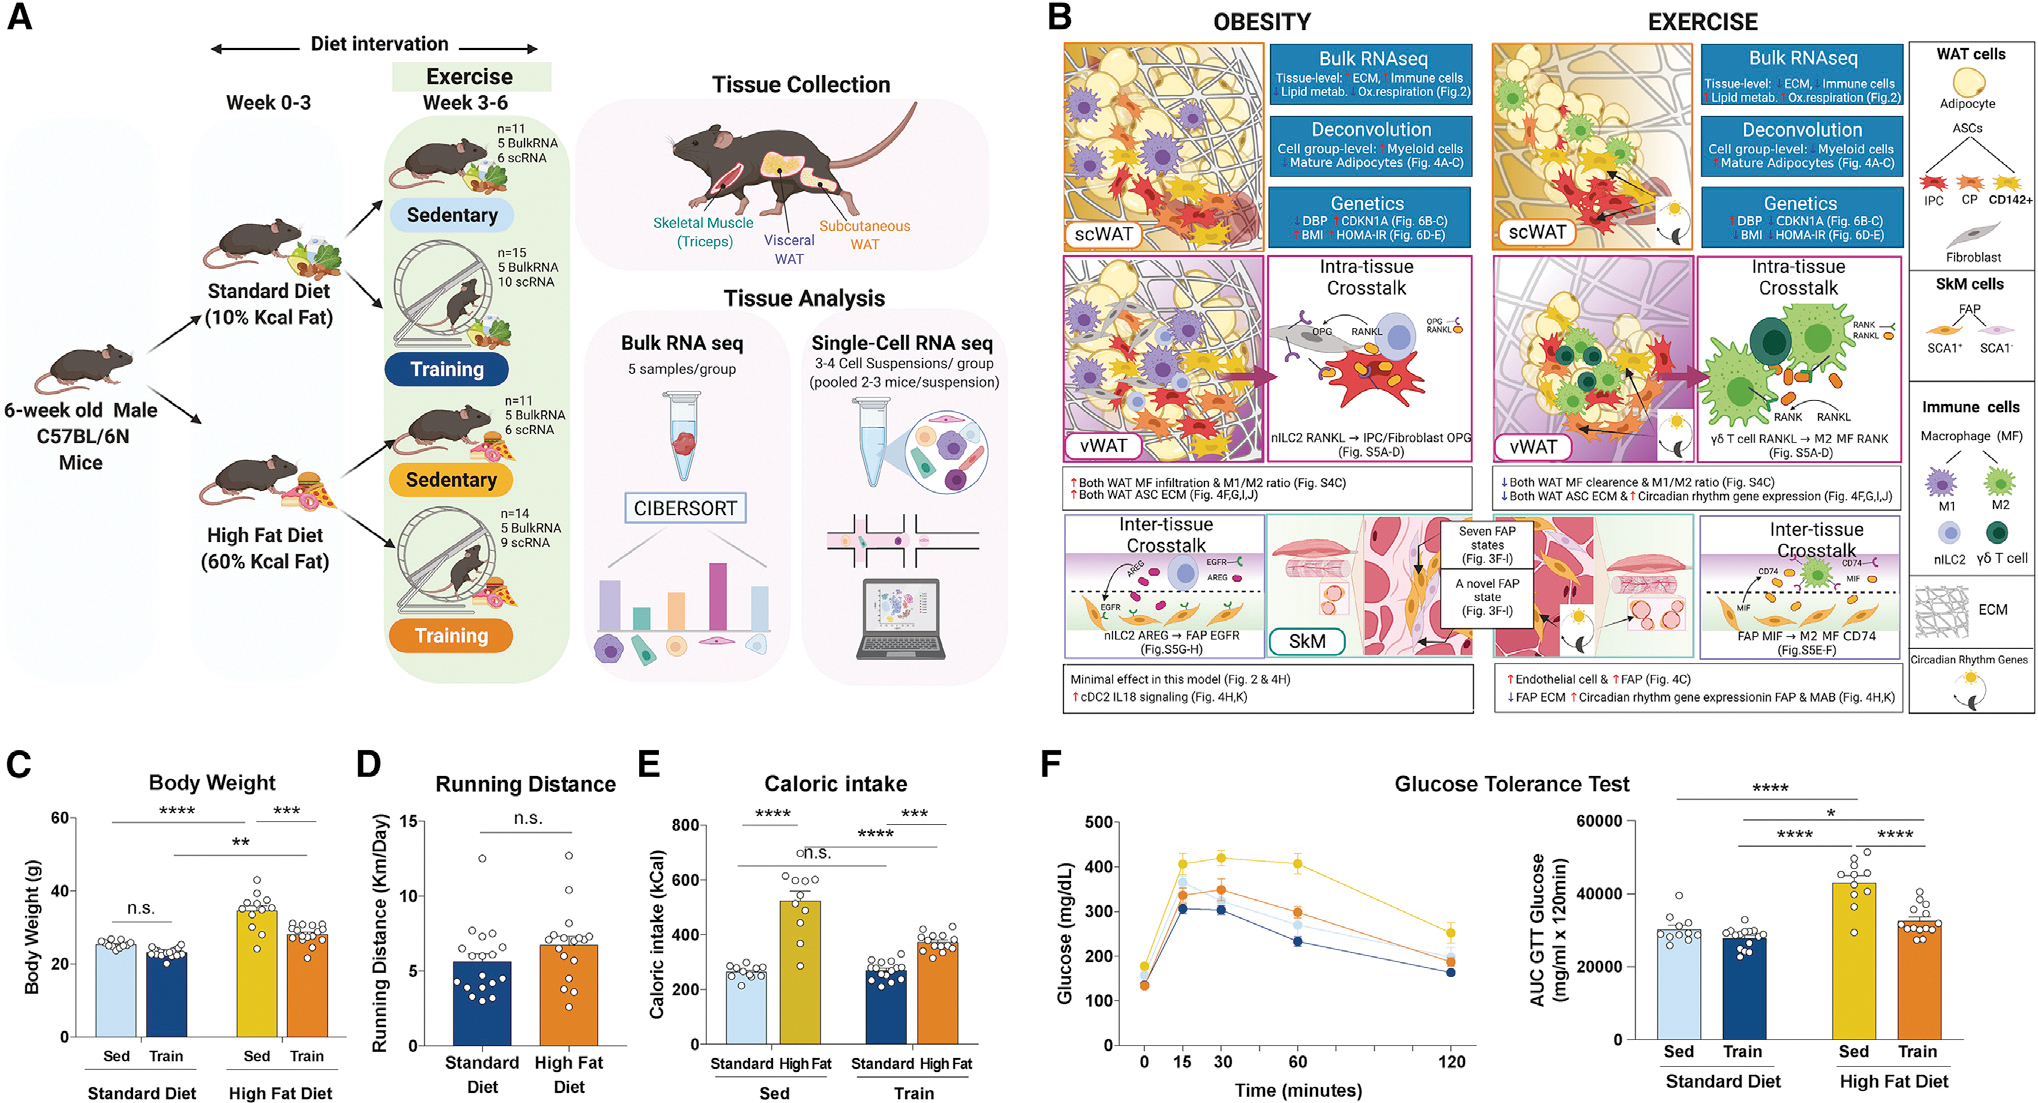
(A) Overview of the mouse study and tissue profiling.
(B) Summary of highlighted results. ECM, extracellular matrix.
(C–F) Body weight (C), running distance (D), caloric intake (E), and glucose tolerance test (GTT) result (F) in the four intervention groups.
*p < 0.05, **p < 0.01, ***p < 0.001, ****p < 0.0001 by two-way ANOVA followed by Tukey multiple comparison tests. Data are represented as mean ± SEM. AUC, area under curve; n.s., not significant. (A) and (B) were created with BioRender.com.
See also Figure S1.
RESULTS
Phenotypic response to diet-induced obesity and exercise and profiling of three metabolic tissues
We studied 6-week-old C57BL/6N male mice with diet-induced obesity and voluntary wheel running exercise training interventions (Figure 1A; n = 51 across 4 groups). Phenotypically, high-fat diet (HFD) induced, and exercise attenuated, weight gain and glucose intolerance (Figures 1C and 1F). Diet did not significantly impact running distance (Figure 1D) and HFD mice consumed more calories, especially when sedentary (Figure 1E). Each statement is true for separate mouse cohorts studied for tissue- and single-cell-level experiments (Figures S1A–S1E). scWAT, vWAT, and SkM were collected and processed for transcriptomic profiling. For both bulk and single-cell assays, the major drivers of variation were tissue, diet, and exercise, but not batch (Figure S1F).
Tissue-level gene and pathway alterations by obesity-exercise across the three tissues
We found 1,386 tissue-level differentially expressed genes (DEGs) across all three tissues (568 in scWAT, 562 in vWAT, 256 in SkM; DESeq2-Negative-Binomial corrected p < 0.05) and all three pairwise intervention comparisons for “obesity” (HFD versus standard diet for sedentary), “training” (exercise training versus sedentary for standard diet), and “rescue” (exercise training versus sedentary for HFD; Tables 1 and S1). Gene ontology (GO) pathway enrichment and protein-protein interaction (PPI) analyses revealed common and distinct biological processes across interventions and tissues (Figures 2A–2D).
Table 1.
Tissue-level DEGs with HFD and exercise training interventions
| Obesity (sed. HFD versus sed. std.) | Training (train std. versus sed. std.) | Rescue (train HFD versus sed. HFD) | Total | |
|---|---|---|---|---|
|
| ||||
| Common in WAT | up: 76 | up: 3 | up: 24 | 195 (176 unique genes) |
| down: 75 | down: 0 | down: 17 | ||
| scWAT | up: 269 | up: 3 | up: 70 | 627 (568 unique genes) |
| down: 223 | down: 0 | down: 62 | ||
| vWAT | up: 237 | up: 19 | up: 72 | 730 (562 unique genes) |
| down: 241 | down: 28 | down: 133 | ||
| SkM | up: 0 | up: 64 | up: 147 | 327 (256 unique genes) |
| down: 0 | down: 28 | down: 88 | ||
| Total | 970 | 142 | 572 | 1,684 (1,386 unique genes) |
Number of tissue-level DEGs with HFD and exercise training interventions. sed., sedentary; train, exercise training; std, standard diet.
Figure 2. Tissue-level transcriptomic responses.
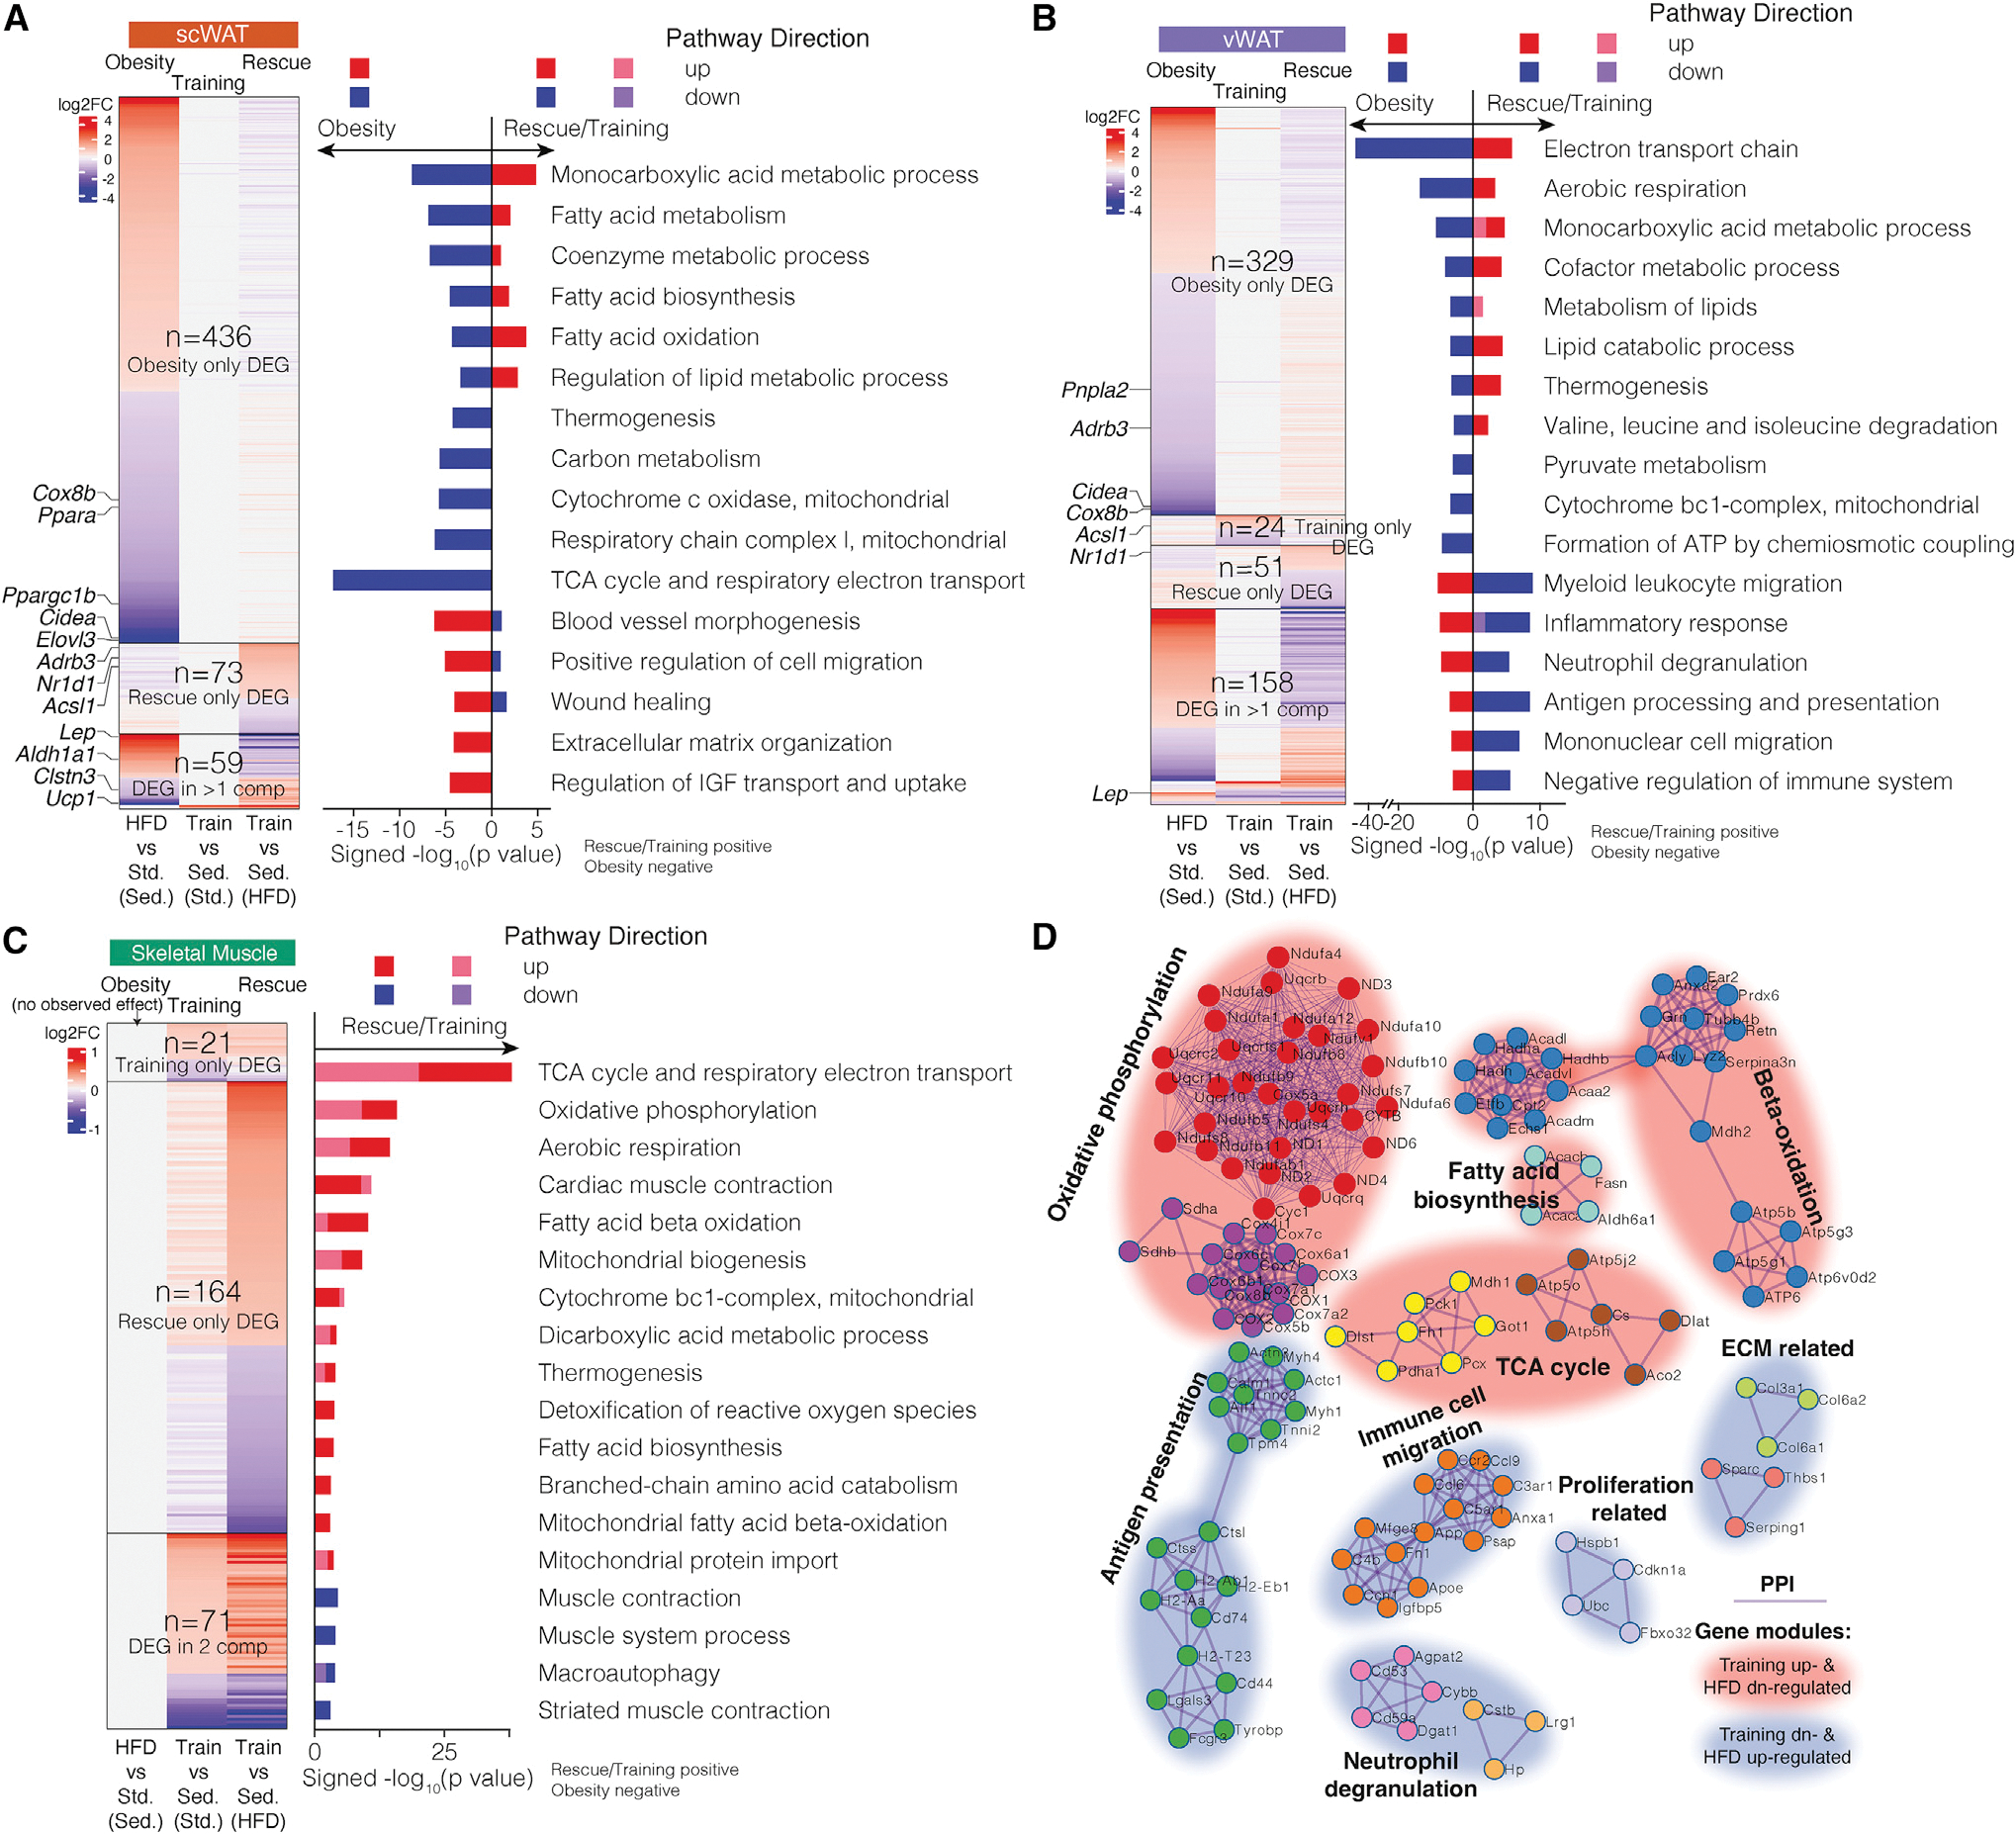
(A–C) Genes (heatmap) and pathways (bar plot) that are significantly differentially expressed and enriched across three comparisons: “obesity,” “training,” and “rescue” in scWAT (A), vWAT (B), and SkM (C). The gene heatmap is colored by log2 fold change. The pathway bar plot is colored by pathway direction in the three comparisons (red/pink, upregulated; blue/purple, downregulated). x axis of the bar plot shows −log10 p value with rescue/training pathways being positive and obesity being negative. DEG, differentially expressed gene.
(D) Gene networks across selected DEGs from the three tissues that encode interacting proteins, clustered by protein-protein interactions with each cluster named by the most significantly enriched pathway. The cluster is colored by DEG direction with exercise training.
sed., sedentary; train, exercise training; std, standard diet.
See also Figures S1 and S2 and Table S1.
For the subset of DEGs identified in at least two comparisons in adipose tissues, nearly all (94%–95%) stemmed from opposite changes in obesity versus training/rescue (Figures 2A and 2B). This anti-correlation held for all genes (not only DEGs), with obesity versus rescue showing negative correlation in both depots (Pearson scWAT, p < 10−10; vWAT, p < 10−16), and obesity versus training anti-correlated in vWAT (Pearson, p < 10−16; Figure S1G). Adipose-depot DEGs included both well-known and less-studied metabolism-associated genes. The latter included training/rescue increasing circadian rhythm regulators (Dbp, Tef, Nr1d2, and Per3), and training/rescue downregulating extracellular matrix (ECM) remodeling genes (Thbs1 and Sparc). For SkM (Figure 2C), rescue/training upregulated 51 genes and downregulated 20 genes, including the fat metabolism repressor Pdk4 (Kim et al., 2006) and the musclemass repressor Asb2 (Davey et al., 2016). Rescue showed more DEGs than training (n = 164 versus 21), suggesting a more robust response of SkM to training under HFD than standard diet. Similar to WAT, training and rescue showed similar effect directions for most genes in SkM (Figure S1G).
Across tissues and interventions, DEGs clustered into biologically meaningful modules of interacting proteins (Figures 2D and S2). Rescue/training led to upregulation of fatty acid biosynthesis/beta-oxidation module and cellular respiration module, including oxidative phosphorylation, tricarboxylic acid (TCA) cycle, and reactive oxygen species (ROS) response. Rescue/training downregulated an immune module, including antigen presentation, neutrophil degranulation, immune cell migration, phagosome-related genes, and modules related to ECM and cell proliferation. Figure S2 summarizes the effect of each intervention on the genes comprising each module. For example, Cdkn1a, encoding a protein involved in cellular senescence, was downregulated by rescue in scWAT and vWAT (Figure S2). Taken together, these tissue-level results reveal specific genes and pathways that may mediate many of the beneficial effects of exercise training.
Single-cell atlas of metabolic tissues in obesity and exercise conditions
In addition to our tissue-level datasets, we generated a single-cell atlas of 204,883 cells for obesity-exercise interactions across the three tissues and the four intervention groups (Figure 3A). To capture low-abundance cell types (e.g., ASCs in WAT and FAPs in SkM), we used a single-cell library preparation that enriched for stromal vascular fraction (SVF) instead of mature adipocytes in WAT and muscle fibers in SkM, parenchymal cells that are already well captured by tissue-level studies. We also included lymph nodes in scWAT to capture immune cells migrating between tissue and lymph nodes.
Figure 3. Single-cell atlas and mesenchymal stem cell state characterization.
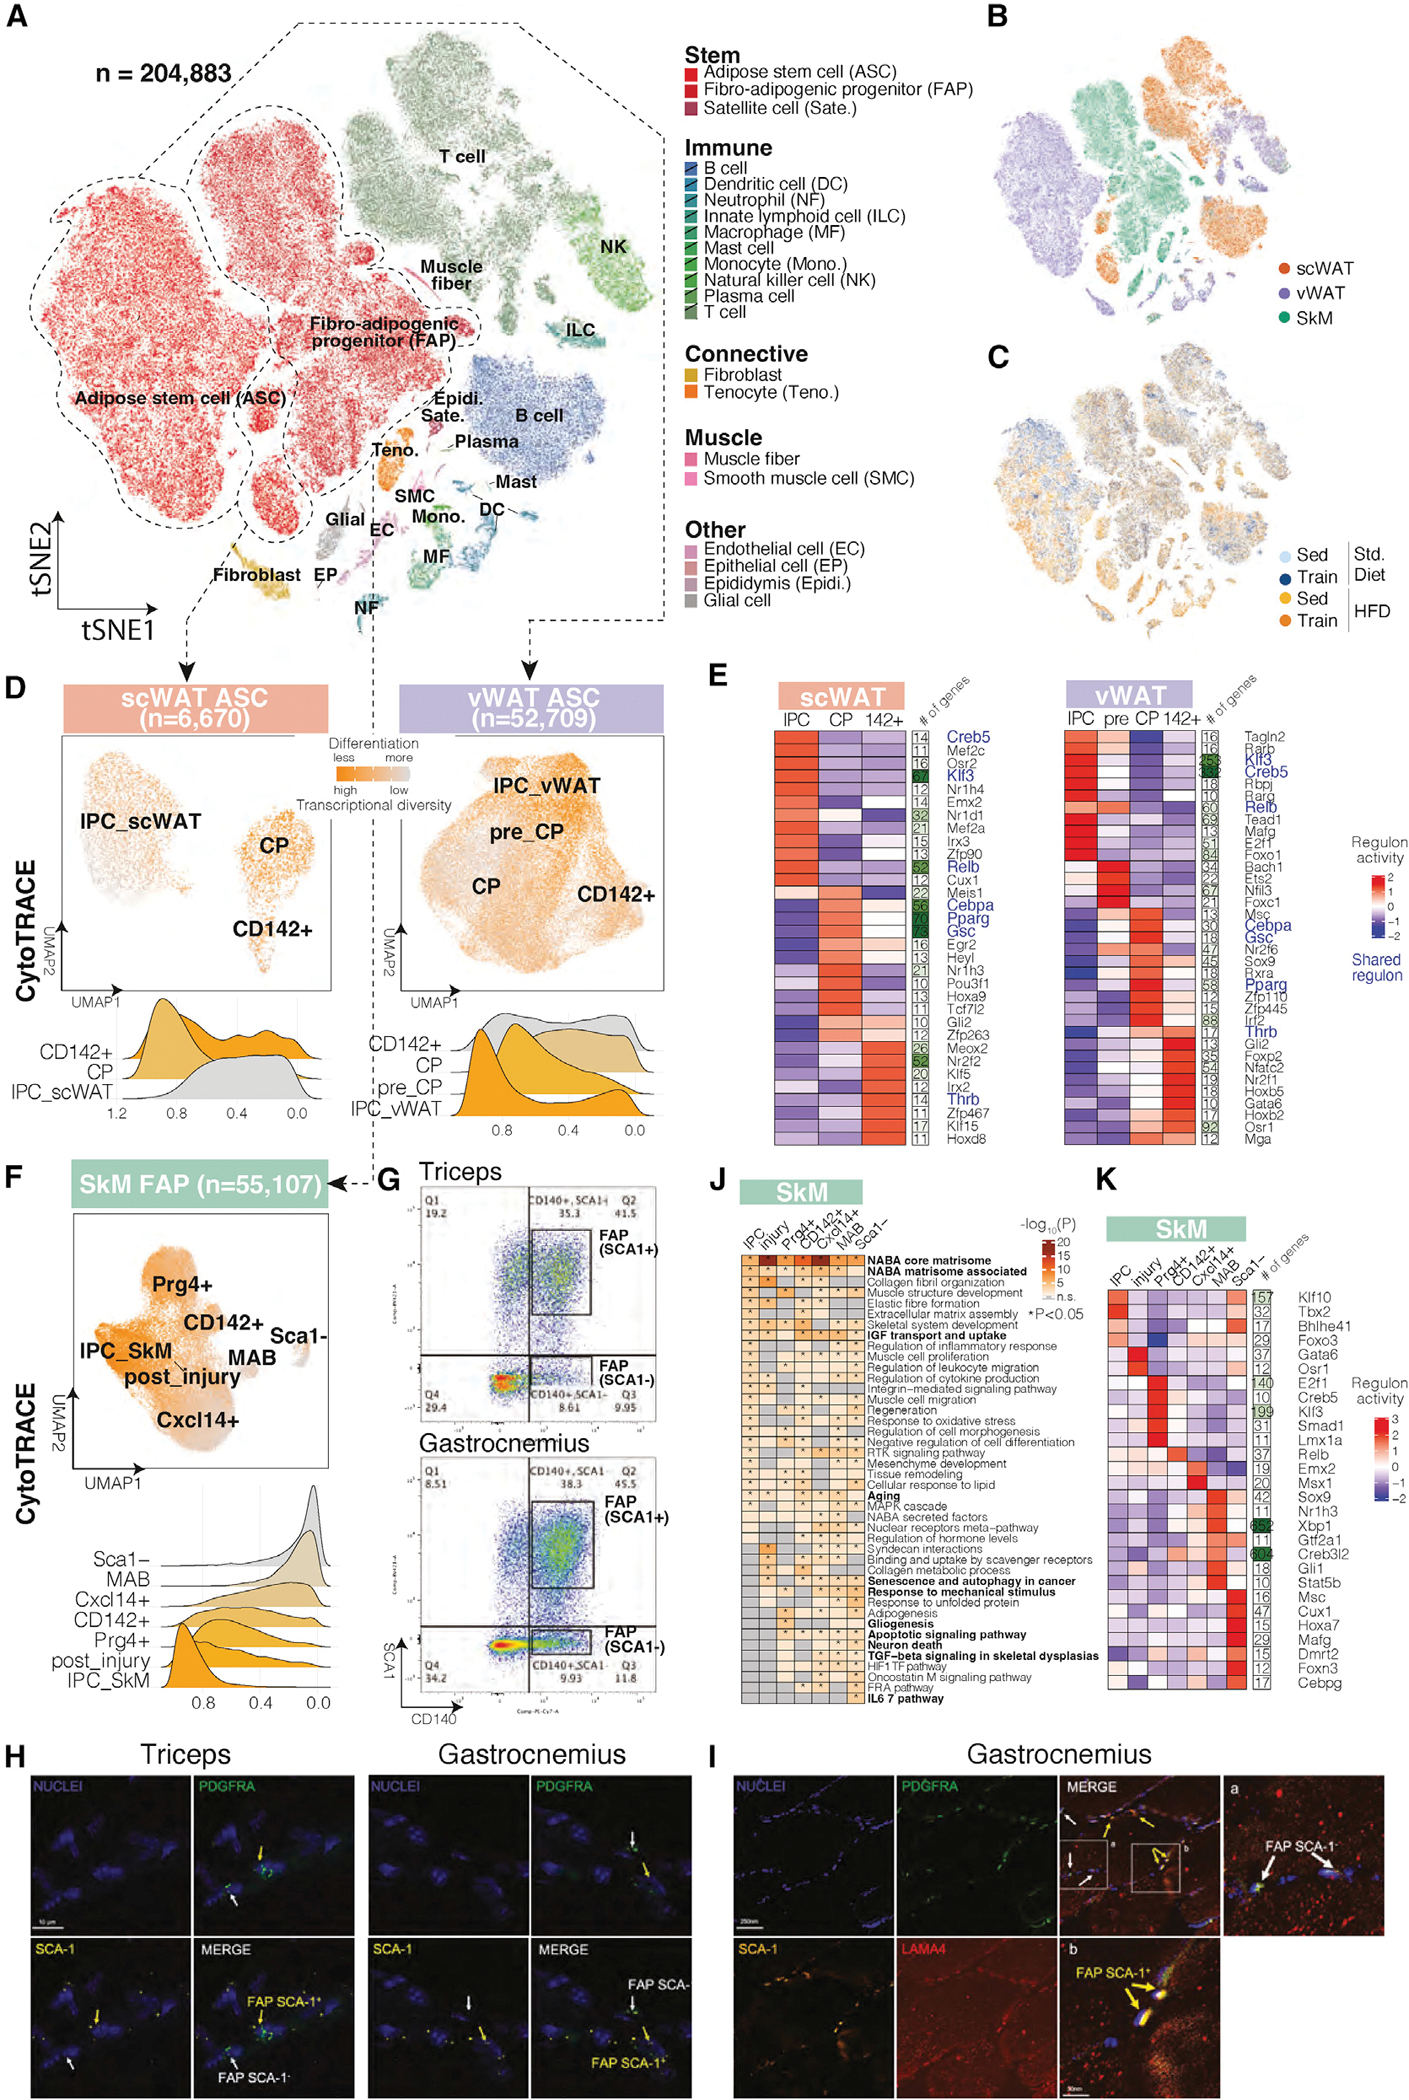
(A) Single-cell atlas of 204,883 cells across three tissues and four intervention groups. The tSNE plot is colored by cell type (warm colors, non-immune cell types; cold colors, immune cell types).
(B and C) Single-cell atlas colored by tissue (B) and intervention group (C).
(D) Re-clustering of ASCs in scWAT (left) and vWAT (right), colored by CytoTRACE-predicted differentiation stage (orange, less differentiated; gray, more differentiated). Ridge plots of individual ASC states are colored similarly.
(E) Clustering of top ASC state-specific regulons (transcription factor with the number of regulated genes as a separate heatmap column) in scWAT (left) and vWAT (right). Shared regulons across the two depots are colored in blue. The heatmap is scaled by column.
(F) Re-clustering of FAPs in SkM, colored by CytoTRACE-predicted differentiation stage (orange, less differentiated; gray, more differentiated). Ridge plots of individual FAP states are colored similarly.
(G) FACS dot blot showing the sorting gates for Sca1+ and Sca1− FAPs from mouse triceps and gastrocnemius, with the percentages of the two populations labeled.
(H) RNA staining of Pdgfra and Ly6a in triceps and gastrocnemius muscle.
(I) Immunohistochemistry staining for PDGFRA, SCA-1, and LAMA4 (a marker for muscle fibers) in gastrocnemius muscle.
(J and K) Top pathways (J) and regulons (K) enriched in Sca1+ and Sca1− FAPs. The pathway heatmap is colored by −log10 p value. The regulon heatmap is colored by activity score.
We annotated 22 cell types using marker gene expression in cell clusters (hierarchical and density-based) of non-linear embeddings (tSNE and UMAP) for dimensionality-reduced data (top 50 PCs; STAR Methods). These include (1) 3 types of stem cells, including ASCs, satellite cells, and FAPs; (2) 10 types of immune cells from both lymphoid and myeloid lineages; (3) 2 types of connective cells, including tenocytes in SkM and fibroblasts primarily in vWAT; (4) 2 types of muscle cells, including muscle fibers and smooth muscle cells; and (5) 4 additional cell types including endothelial, epithelial, epididymis, and glial cells (Figure 3A). Within each cell type, our analysis revealed subclusters driven by tissue provenance (Figure 3B; Table S2) and to a lower degree by intervention group (Figure 3C). Sub-clustering revealed 42 cell subtypes/states for 11 of the 22 cell types, including 3 ASC states, namely interstitial progenitor cell (IPC), committed preadipocyte (CP), and CD142+ ASC (Table S3). Two-dimensional embeddings of each tissue showed clear distinctions of these cell subtypes/states (Figure S3A).
Molecular signatures of depot-specific ASC states
We evaluated WAT ASC transcriptional diversity as a marker of differentiation potential (Figure 3D). The robustness of this concept was demonstrated in the CytoTRACE framework, which showed that transcriptional diversity decreases during differentiation (Gulati et al., 2020). For vWAT, we confirmed that IPCs show increased transcriptional diversity, consistent with their earlier differentiation state (Merrick et al., 2019). In scWAT, however, CPs and CD142+ cells showed increased transcriptional diversity, which may be related to their beiging trans-differentiation and de-differentiation potential (Ghaben and Scherer, 2019). We performed pseudotime trajectory analysis (Qiu et al., 2017) and selected the starting point of the trajectory (IPCs) based on previous experimental evidence (Merrick et al., 2019). The predicted pseudotime depicted a trajectory from IPCs to CPs and CD142+ cells in both WAT depots (Figure S3B).
We sought co-expressed regulator/target-gene combinations (regulons) for each ASC state to gain insights into their gene-regulatory circuitries. We identified depot-shared as well as depot- and state-specific regulons (Figure 3E). Depot-shared regulons (Figure 3E, blue) included established regulons Klf3 and Creb5 for IPCs, which are activated very early during adipogenesis (Farmer, 2006; Sue et al., 2008); regulons Cebpa, Pparg, and Gsc for CPs, among which Cebpa and Pparg are the two principal adipogenic factors overseeing the terminal differentiation process (Farmer, 2006); and for CD142+ cells, a regulon controlled by thyroid hormone receptor beta (Thrb). As for the depot- and state-specific regulons, IPC-highest Irx3 (lowest in CPs) in scWAT is consistent with its early-adipocyte-differentiation role (Claussnitzer et al., 2015). In vWAT pre-CPs, a state lying between IPCs and CPs, we identified two potential IPC-to-CP lineage commitment regulators. Foxc1 is implicated in progenitor cell identity maintenance (Omatsu et al., 2014), and Nfil3 is implicated in a circadian lipid metabolic program and regulating lipid absorption and export (Wang et al., 2017). Overall, our single-cell data highlight depot-shared and depot-specific gene regulatory circuitries for different populations of ASCs and enable regulator prediction for early ASC differentiation in vWAT.
Seven distinct FAP states and a novel FAP population in SkM
We classified the ~55,000 FAPs into seven distinct cellular states using mouse and human markers (Camps et al., 2020; Oprescu et al., 2020; Rubenstein et al., 2020): (1) multipotent IPC_SkM, sharing IPC markers with WAT; (2) FAP_Cxcl14+; (3) FAP_Prg4+; (4) adipogenesis-regulating FAP_CD142+ cell similar to adipose tissue CD142+ cell (Camps et al., 2020); (5) FAP_post_injury representing an inflammatory post-injury-like state; (6) mesoangioblasts (MABs), marked by Alpl+; and (7) a previously unreported Sca1 population of FAPs, discussed in more detail below (Figure S3C). The first six subtypes were all positive for Pdgfra, Cd34, and Ly6a (Figure S3D). All seven subtypes were detectable in previous single-cell data (Dos Santos et al., 2020; Oprescu et al., 2020) (Figure S3E).
Surprisingly, while FAPs are usually defined using interchangeable combinations of the canonical markers Pdgfra+, Cd34+, and Sca1+, we found an FAP population negative for Sca1 (Joe et al., 2010) (Figure S3D). Downregulation of SCA1 occurs as cells differentiate along a particular lineage (Soliman et al., 2020). According to CytoTRACE differentiation prediction, Sca1− FAPs showed a more differentiated state (less transcriptional diversity) than Sca1+ FAPs (Figure 3F). Trajectory analysis (Qiu et al., 2017) confirmed the differentiated state of Sca1− FAPs with later pseudotime (Figure S3C). Sca1− FAPs expressed higher levels of collagen genes, which are pan-fibroblast markers, and IL33, which is known for its role in recruiting Tregs and ILC2s in non-lymphoid tissues to combat inflammation (Spallanzani et al., 2019) (Figure S3F). Thus, we hypothesize Sca1− FAPs as a population of fibrogenic progenitors differentiated from MSCs. We validated Sca1− FAPs for both triceps and gastrocnemius muscle by stringent fluorescence-activated cell sorting (FACS) and gating. We used qPCR to verify expression patterns of Sca1+ (Pdgfra, Ly6a, and Dpt) versus Sca1-marker genes (Pdgfra and Apoe), and lack of expression of endothelial cell (Pecam1), tenocyte (Scx), or glial cell markers (Plp1; Figures 3G, S3G, and S3H; Table S3). We visualized Sca1− FAPs using RNA and immunofluorescence staining (Figures 3H and 3I). Based on marker gene expression, this FAP is similar to a population reported in heart (cardiac fibrogenic SCA-1− cell) (Soliman et al., 2020) (Figure S3I), which was differentiated from PDGFRα+ SCA-1+ cells. This SCA-1− population increased in post-myocardial infarction hearts with a pathogenic role in remodeling and arrhythmogenic cardiomyopathy. Interestingly, there was a trend for Sca1− FAP abundance to decrease in training leading to the hypothesis that exercise training downregulates SkM fibrosis through its effects on Sca1− FAPs.
Marker genes for the seven FAP states were enriched in shared and unique pathways (Figure 3J). Shared pathways across the seven states included core matrisome, matrisome associated, IGF transport and uptake, and aging, suggesting FAP as a key contributor to ECM (Chapman et al., 2017), IGF signaling (Giuliani et al., 2021), and aging (Ancel et al., 2019) in SkM. FAP state-specific signaling pathways and regulons supported their respective functions (Figures 3J and 3K). In Sca1− FAPs, we found IL6-mediated signaling pathways and the Mafg and Cebpg regulons, which are involved in the IL6-induced oxidative stress response (Forcina et al., 2019), highlighting a potential response of this population to IL6 that is known to be released with muscle contraction (Lauritzen et al., 2013).
Cell-type and cell-state proportion changes in obesity and exercise across the three tissues
We also deconvolved (Newman et al., 2015) our tissue-level data using independent single-cell maps refined by manual curation (Dos Santos et al., 2020; Rajbhandari et al., 2019). As expected, deconvolution captured primarily high-abundance cell types (Table S2). We used these tissue-deconvolution results to characterize cell-type proportion changes in our three intervention comparisons. In both adipose tissues, HFD-induced obesity significantly decreased mature adipocytes and increased ASCs and myeloid cells (Figures 4A and 4B), consistent with increased adipocyte necrosis and macrophage infiltration in obesity-associated metabolic decline (Ghaben and Scherer, 2019). Exercise training reversed these effects in HFD, even though training alone showed no effect under standard diet conditions. Histology staining in both WAT depots showed that obesity significantly enlarged mature adipocyte size (adipocyte hypertrophy) and increased tissue weight, which were both reversed by training (rescue; Figures 4D and 4E). In SkM, training and rescue decreased type II (fast) myonuclei and increased FAPs, myeloid cells, and endothelial cells (Figure 4C).
Figure 4. Single-cell-level proportion and transcriptomic responses across the three tissues.
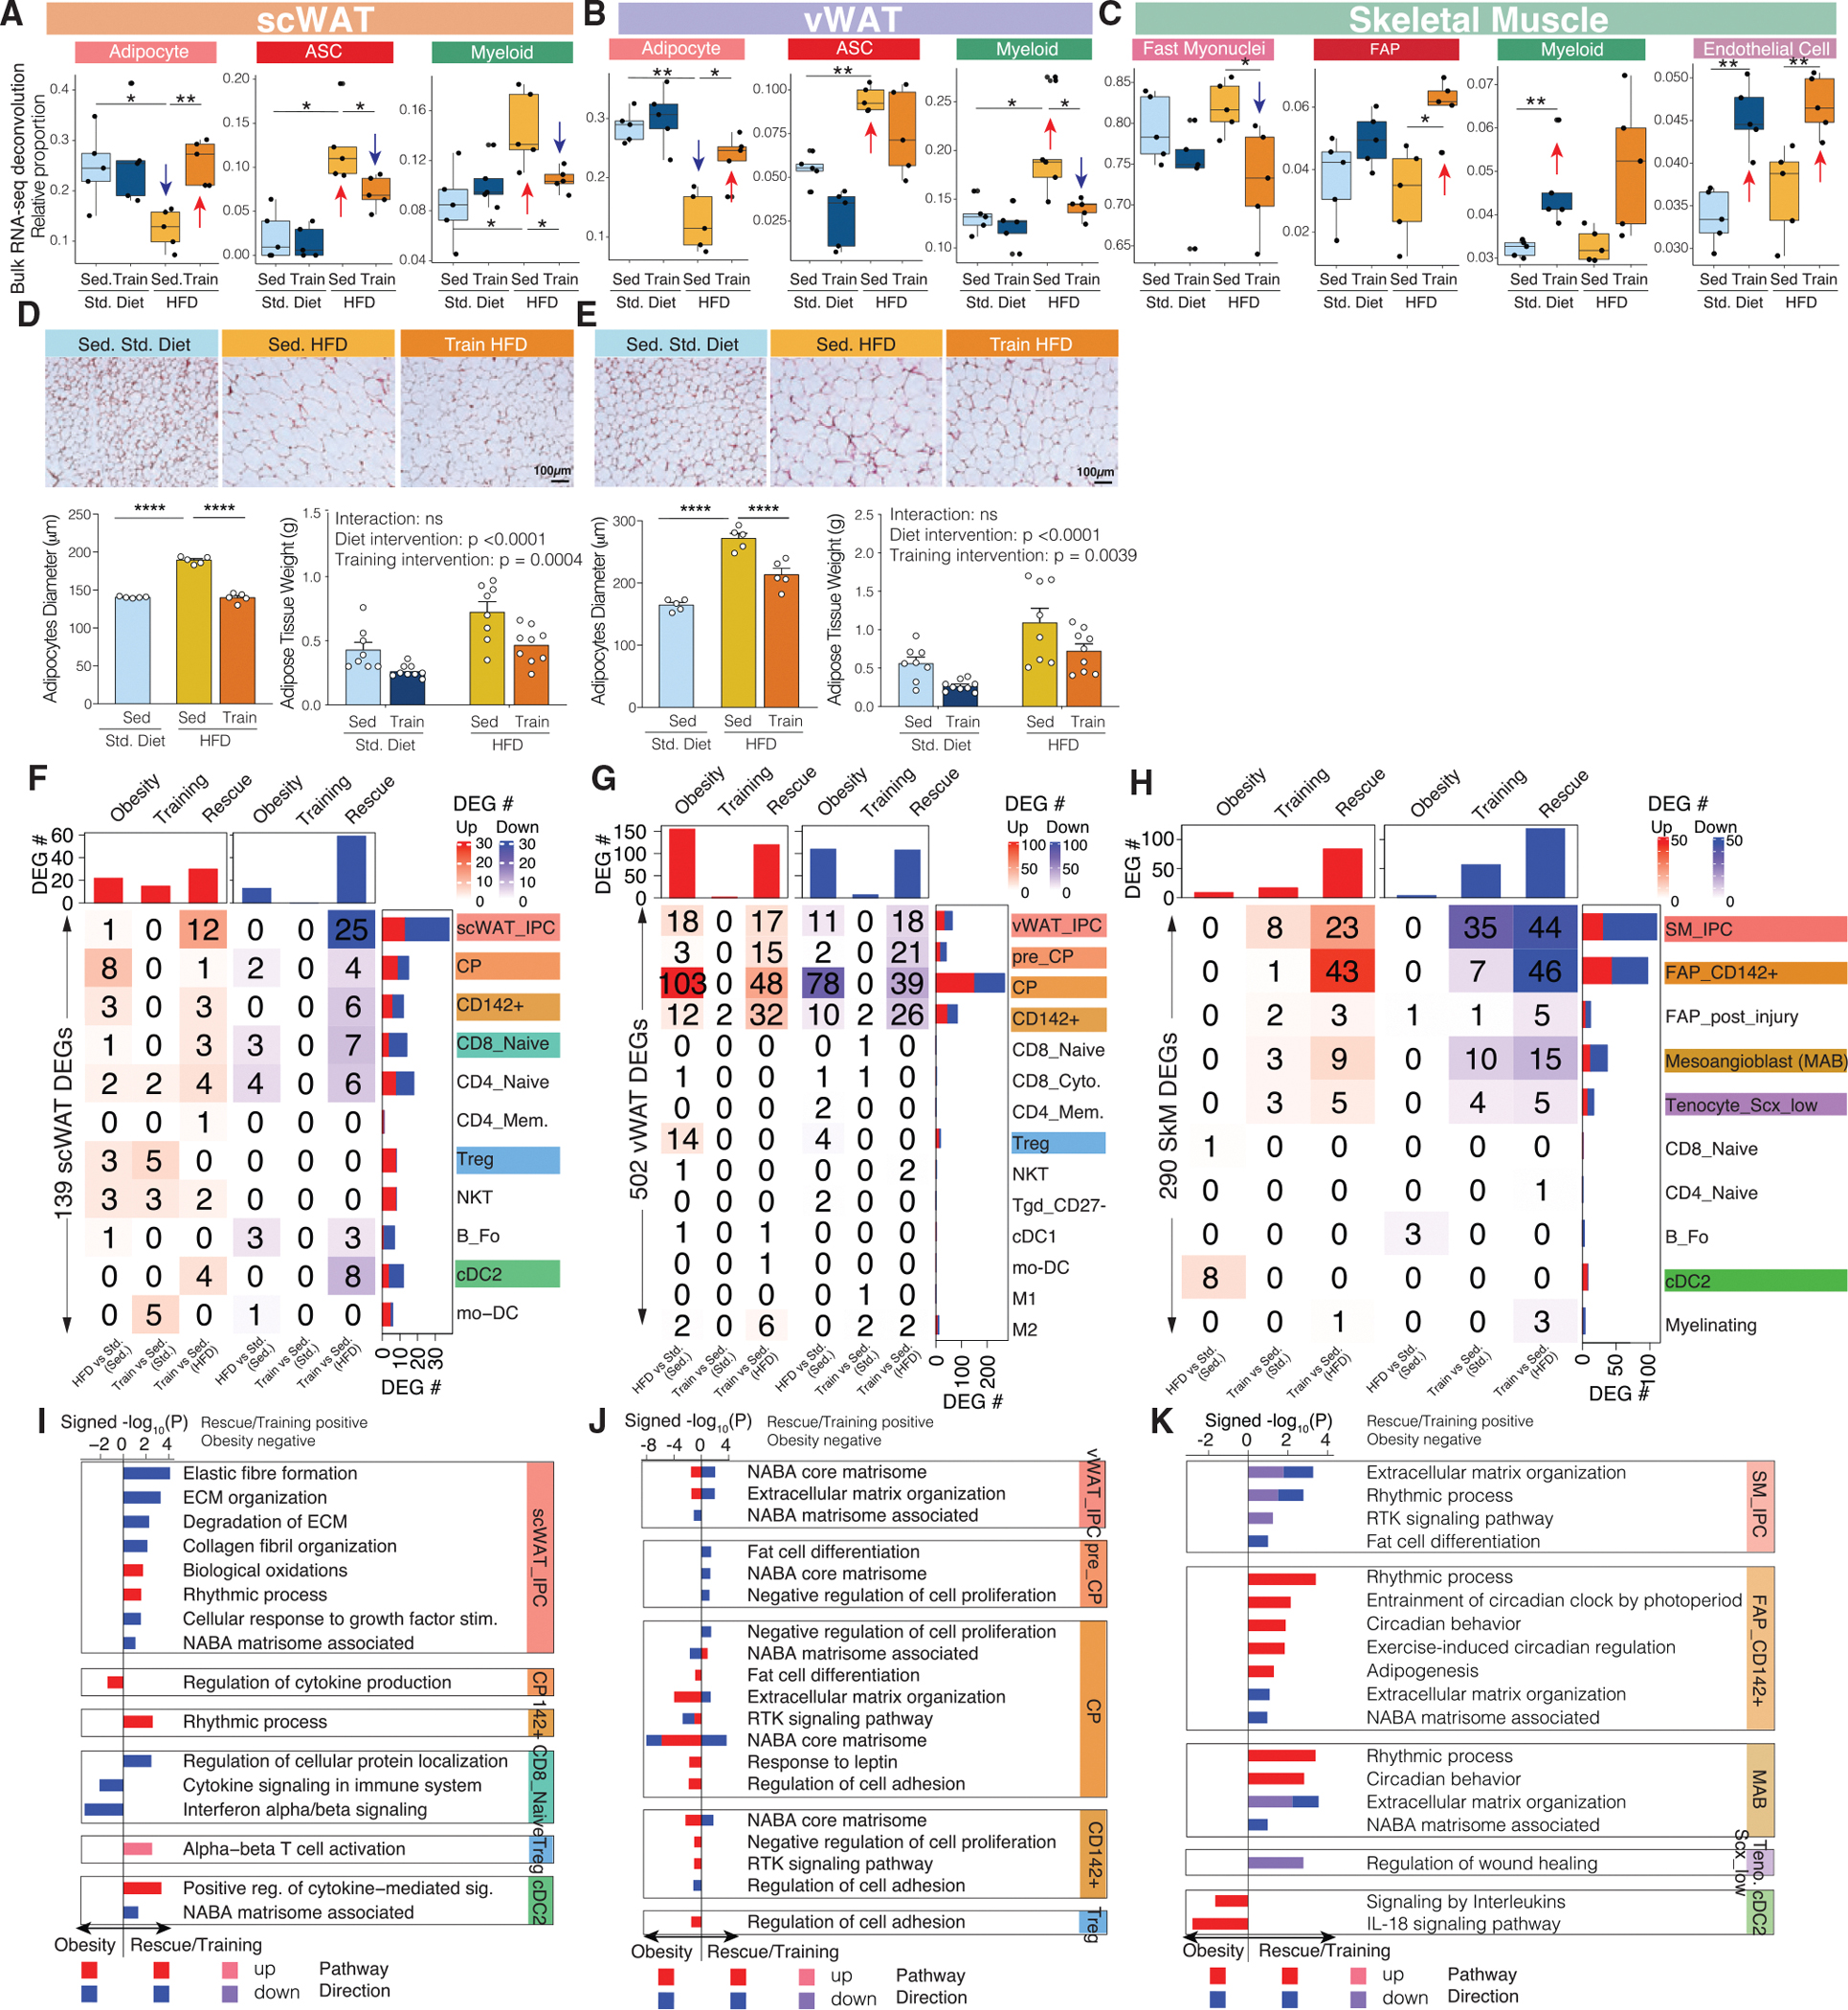
(A–C) Sample-specific proportions of cell types across the four intervention groups in scWAT (A), vWAT (B), and SkM (C) after bulk RNA-seq data deconvolution. The boxplots are defined as Q1 − 1.5*IQR, Q1, median, Q3, and Q3 + 1.5*IQR.
(D and E) Histology of scWAT (D) and vWAT (E) across three intervention groups, with bar plots below showing adipocyte diameter and adipose tissue weight changes across intervention groups.
(F–H) The number of cell-state-specific DEGs (heatmap) that are upregulated (red) or downregulated (blue) in our three comparisons in scWAT (F), vWAT (G), and SkM (H).
(I–K) Pathways (bar plot) that are significantly enriched in cell-state-specific DEGs across the three comparisons in scWAT (I), vWAT (J), and SkM (K). x axis of the bar plot shows −log10 p value with rescue/training pathways being positive and obesity being negative. The bars are colored by pathway direction in the three comparisons (red/pink, upregulated; blue/purple, downregulated).
*p < 0.05, **p < 0.01, ***p < 0.001, ****p < 0.0001 by Wilcoxon rank-sum test (A–C) or by two-way ANOVA followed by Tukey multiple comparison tests (D and E).
Data are represented as mean ± SEM (D and E).
We also used our single-cell results to annotate changes in cell subtype/state proportions (Figures S4A–S4D; Table S2). In WAT across interventions, ASCs, macrophages, and T cells were the cell types with the most subtype/state proportion changes. In obesity, we found changes in vWAT specifically, with ASCs showing increased CD142+ cells, consistent with previous results (Merrick et al., 2019; Schwalie et al., 2018). Rescue once more reversed the change, decreasing CD142+ cells in vWAT (Figure S4B). In addition to ASCs, obesity both increased macrophage proportion and M1 (pro-inflammatory) versus M2 (anti-inflammatory) ratio in vWAT (Figure S4C). Rescue restored the M1/M2 ratio toward baseline. In lymphoid lineage there was an increase of Tregs and a decrease of NKT cells in obesity, changes reversed in rescue. Furthermore, there were similar changes of Tregs and NKT cells in training, suggesting that the beneficial effects of exercise training on lymphocytes occur regardless of diet. In SkM, training showed a tendency to decrease the ratio of Sca1− and Sca1+ FAPs, which suggests that training improved SkM physiology and decreased inflammation and fibrotic potential (Figure S4D).
Cell-type-specific transcriptomic changes highlight ECM remodeling and circadian rhythm gene expression in MSCs across the three tissues
We next used our single-cell data to infer cell-state-specific and cell-type-specific gene expression changes modulated by obesity and exercise training interventions. In WAT (Figures 4F and 4G; Table S4), we found 139 scWAT DEGs and 502 vWAT DEGs at the cell-state level, affecting primarily ASCs followed by T cells in both WAT depots. In ASCs, DEGs in IPCs and CPs accounted for 57% in scWAT and 59% in vWAT, indicating that IPCs and CPs are the ASC states most responsive to the interventions. Between the two fat depots, vWAT was affected the most by obesity, showing a 7.6-fold enrichment for DEGs (265 versus 35). In vWAT, rescue reversed ~12% of the obesity-regulated genes in ASCs, but 0% in T cells, indicating that obesity-induced immune dysregulation is potentially longer-lasting. In SkM, we identified 290 DEGs (13 obesity + 74 training + 203 rescue; Figure 4H; Table S4). Rescue led to more single-cell DEGs than obesity and training, consistent with our tissue-level results. Sca1+ FAPs showed the most DEGs, with IPC_SkM and FAP_CD142+ cell accounting for 81% of the Sca1+ FAP DEGs. Cell-type-level DEGs showed similar gene expression change patterns for the three tissues and the three phenotypic comparisons (Figures S4E–S4G).
In the three tissues, ECM-related pathways were upregulated by obesity and downregulated by training and rescue in scWAT IPCs, all four states of vWAT ASCs, and three Sca1+ FAP states (IPC_SkM, FAP_CD142+, and MAB; Figures 4I–4K; Table S4). Excessive deposition of ECM has been observed with obesity in WAT to both provide structural support to the enlarged mature adipocytes and promote tissue fibrosis (Marcelin et al., 2017; Shao et al., 2021). In SkM, ECM is essential for muscle development, growth, repair, and mechanical support during exercise. These data support a significant role for ASCs in scWAT and vWAT and FAPs in SkM in regulating ECM remodeling in the context of obesity and exercise.
Circadian rhythm is another notable pathway regulated in all the three tissues, which was only observed in single-cell but not tissue-level data. The pathway was upregulated by training and rescue and enriched in FAPs in SkM and ASCs in WAT, suggesting a close link between exercise and circadian rhythmicity in these tissues (Figures 4I–4K; Table S4). Upstream regulator analysis revealed Dbp, Tef, and Hlf, three homologous PAR bZIP TFs sharing motif specificity (Yoshitane et al., 2019), as potential master regulators of these training-altered circadian pathways in specific MSC states (Figures S4H–S4J). These findings suggest that exercise training upregulates the circadian rhythm pathway through shared transcriptional regulators in MSCs of the three tissues.
Distinct cell-type-specific pathways regulated by exercise and obesity in each tissue
In scWAT, pathway analysis of the DEGs indicated that obesity downregulated type I interferon signaling and defense response in T cells, which suggests a shift from adaptive immune response to inflammation (Figure S4E; Table S4). Rescue was enriched in the prostaglandin synthesis and regulation pathway in ASCs, which included a downregulation of the expression of the prostaglandin degradation gene Hpgd by 1.5-fold (Figure S4E; Table S4). Downregulated Hpgd is associated with increased prostaglandin E2 levels, which has been shown to help to maintain ASC self-renewal capacity and enhance immunomodulatory potency (Lee et al., 2016).
In vWAT, obesity upregulated and rescue downregulated two pathways that may mediate de novo adipogenesis in ASCs (Figure S4F; Table S4). One is the TGFβ1 stimulus response, an antiadipogenic inflammatory molecule secreted from hypertrophic, dysfunctional adipocytes and known to inhibit adipocyte differentiation in mice and humans (Ghaben and Scherer, 2019). The second is ROS metabolic process, whose intracellular accumulation by mitochondrial respiration decreases preadipocyte differentiation and drives a pro-inflammatory and fibrotic phenotype (Joffin et al., 2021; Shao et al., 2021).
In SkM, obesity upregulated IL-18 and cytokine signaling pathways in DCs and rescue downregulated fat cell differentiation in FAPs (Figure S4G; Table S4). In myopathies and obesity, FAP adipogenesis has been reported to be involved in ectopic fat deposition (Jia and Sowers, 2019; Reggio et al., 2020). Rescue downregulated adipocyte differentiation, consistent with increased FAP CD142+ (Figure S4D), which inhibits adipogenesis in SkM (Camps et al., 2020). In the immune compartment of SkM, obesity upregulated the IL-18 signaling pathway in conventional type 2 DCs, consistent with the IL-18 increase in DCs in inflammatory myopathies (Tucci et al., 2007).
DEGs identified using deconvolved tissue-level data were mostly regulated in opposite directions in obesity versus training/rescue (Figures S4K–S4M). The enriched pathways in both fat depots include lipid metabolism in mature adipocytes, ECM-related pathways and IGF transport and uptake in ASCs and myeloid cells, immune cell activation, regulation of inflammatory response, and monocyte chemotaxis in lymphoid and myeloid cells. In SkM, 44 out of the 50 tissue-deconvolved DEGs were found within fast myonuclei (Figure S4M).
Exercise training reprograms within- and cross-tissue cellular communication
Taking advantage of our high-resolution single-cell annotations, we used co-expression of interacting structure-based ligand-receptor pairs (Efremova et al., 2020) to predict pairwise cellular communication within and across tissues and interventions at both cell-type and cell-state levels (Figures 5 and S5; Table S5).
Figure 5. Within- and cross-tissue communication at cell-state level.
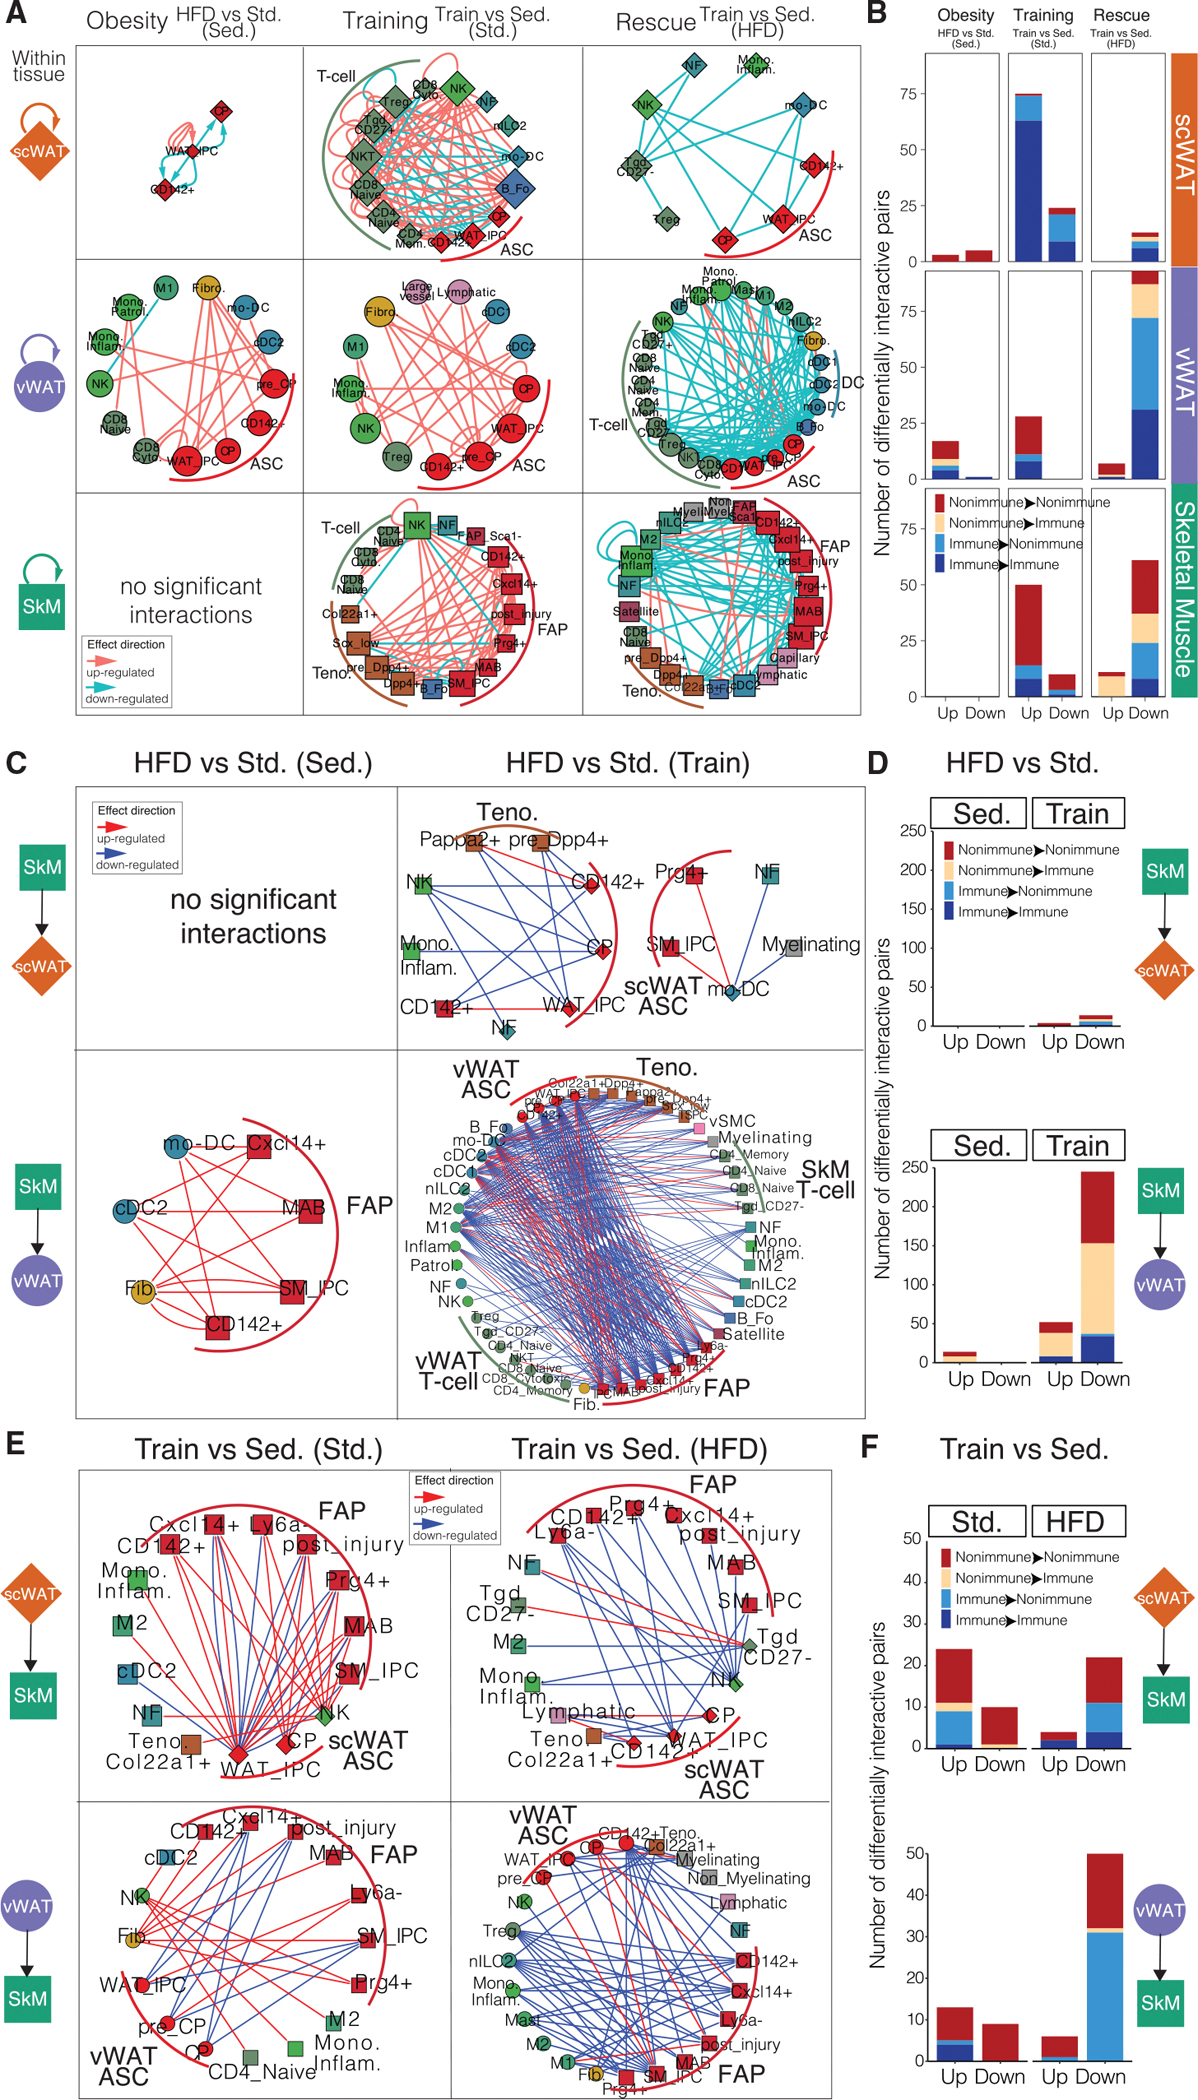
(A) Within-tissue ligand-receptor networks across the three tissues and three comparisons. Cell states (nodes) are shaped by tissue (diamond, scWAT; circle, vWAT; square, SkM) and sized by outdegree. Ligand-receptor interactions (edges) are directed, from ligand to receptor, and colored by effect direction (pink, upregulated; blue, downregulated).
(B) The number of differentially interactive ligand-receptor pairs that are up- and downregulated across the three tissues and three comparisons at the cell-state level. Each bar is colored by whether the ligand or the receptor is from an immune or non-immune cell state.
(C and E) Cross-tissue ligand-receptor networks between a pair of tissues and in diet (C) or training (E) comparisons. The nodes and edges are formatted as in (A).
(D and F) The number of differentially interactive ligand-receptor pairs that are up- and downregulated between a pair of tissues and in diet (D) or training
(F) comparisons at the cell-state level. The bars are colored as in (B).
Within tissues, we observed MSCs function as self- and cross-regulating hubs of immune and non-immune cell types in obesity, training, and rescue comparisons (Figures 5A, 5B, S5A, and S5B). By comparing ranks of significant interactions overlapping intervention groups, we observed networks of differential interactions, including obesity upregulated non-immune interactions (ASC autocrine regulation in scWAT and fibroblast-ASC interactions in vWAT). RANK-RANKL-OPG triad showed a particularly interesting co-expression pattern change in response to HFD and exercise training in vWAT (Figures S5A, S5C, and S5D). RANK is the receptor among the three and encoded by Tnfrsf11a, RANKL is the ligand and encoded by Tnfsf11, and OPG (osteoprotegerin) is the decoy receptor of RANKL and encoded by Tnfrsf11b. OPG was mostly expressed in ASC IPCs and fibroblasts, RANKL was highly expressed in nILC2s and CD27− Tgds, and RANK was expressed mainly in M2 macrophages (Figure S5C). Obesity increased OPG expression in fibroblasts and IPCs and RANKL expression in nILC2s while training and rescue decreased OPG expression (Figure S5D). Interestingly, RANKL expression in CD27− Tgd and RANK expression in M2 macrophages showed an opposite trend of changes in obesity versus training and rescue. This led us to hypothesize that HFD promoted interaction between RANKL in nILC2 and the decoy receptor OPG in fibroblast and IPCs, and on the contrary, exercise training induced a shift from this ligand-receptor interaction to interaction between RANKL from CD27− Tgd and RANK from M2 macrophage.
Across tissues, we performed slightly different comparisons to highlight physiologically meaningful directed communication changes between WAT and SkM with obesity and exercise training. Specifically, we compared ligand-receptor co-expression from SkM to WAT mediating the effect of obesity (HFD versus standard diet) in sedentary state or with exercise training. We performed a similar analysis from WAT to SkM comparing the training effect (training versus sedentary) under HFD or standard diet. We discovered that HFD effect with exercise training downregulated cross-tissue communication from non-immune cell states in SkM to immune cell subtypes in vWAT compared to HFD effect with the sedentary condition (Figures 5C and 5D). However, there is little such communication between SkM and scWAT. Conversely, training effect with HFD downregulated numerous crosstalk from immune cell subtypes in vWAT to non-immune cell states in SkM compared to training effect with standard diet (Figures 5E and 5F). The SkM non-immune cell states involved in the two-way interactions are primarily FAP states, while the immune cell subtypes differ for the ones receiving molecular signals from SkM with training versus the ones sending signals to SkM with HFD (Figures 5C–5F). Specifically training downregulated SkM FAP ligands with co-expressing receptors on DCs and macrophages in vWAT (Figures 5C and 5D). MIF-CD74 signaling is one such interaction, which was downregulated by exercise training from different SkM cell types including FAPs to M1 macrophages and cDC1s and cDC2s in vWAT, but slightly upregulated its interaction with M2 macrophages (Figures S5E and S5F). In turn, HFD downregulated interactions between ligands secreted from Tregs and nILC2s in vWAT and corresponding receptors on FAPs in SkM (Figures 5E and 5F). Expression of AREG secreted by Tregs and nILC2s in vWAT and its receptor EGFR on FAPs in SkM was co-downregulated by HFD (Figures S5G and S5H). AREG-EGFR signaling has been shown to play an important role in wound healing by regulating differentiation of fibroblasts to myofibroblasts and their proliferation in many diseases (Son et al., 2021). Based on our results, exercise training may dampen the HFD-induced profibrotic effect on SkM through regulation of the AREG-EGFR signaling axis between vWAT and SkM. More interestingly, although there are cell types expressing MIF within vWAT and cell types expressing AREG in SkM, we did not detect significant within-tissue interaction changes for these two ligand-receptor pairs with exercise, further indicating the importance of cross-tissue analysis in the context of obesity-exercise interaction.
Genetics of two exercise-training candidate genes in two independent large-scale human studies
To evaluate the human relevance of our results, we selected one gene that was upregulated and one that was downregulated across all three tissues and tested anthropometric trait genetic associations in UK biobank (Sudlow et al., 2015) and human metabolic tissue expression changes in the Metabolic Syndrome in Men (METSIM) study (Laakso et al., 2017) (Figure 6A). Among the 18 commonly upregulated genes, we selected Dbp (Figure 6B), as it is a key regulator in diet/exercise-regulated circadian rhythm pathways and its homologs Hlf and Tef were also upregulated in MSCs by exercise training. In humans, DBP showed a negative correlation with body mass index (BMI), homeostatic model assessment for insulin resistance (HOMA-IR), fasting serum insulin and glucose concentrations, C-reactive protein (CRP), and waist-hip ratio (WHR) adjusted for BMI, and a positive correlation with Matsuda insulin sensitivity index in METSIM (Figures 6D, 6E, and S6A–S6F), demonstrating DBP’s obesity and exercise relevance in human phenotypes.
Figure 6. Two exercise-regulated genes (DBP and CDKN1A) in mice and humans.
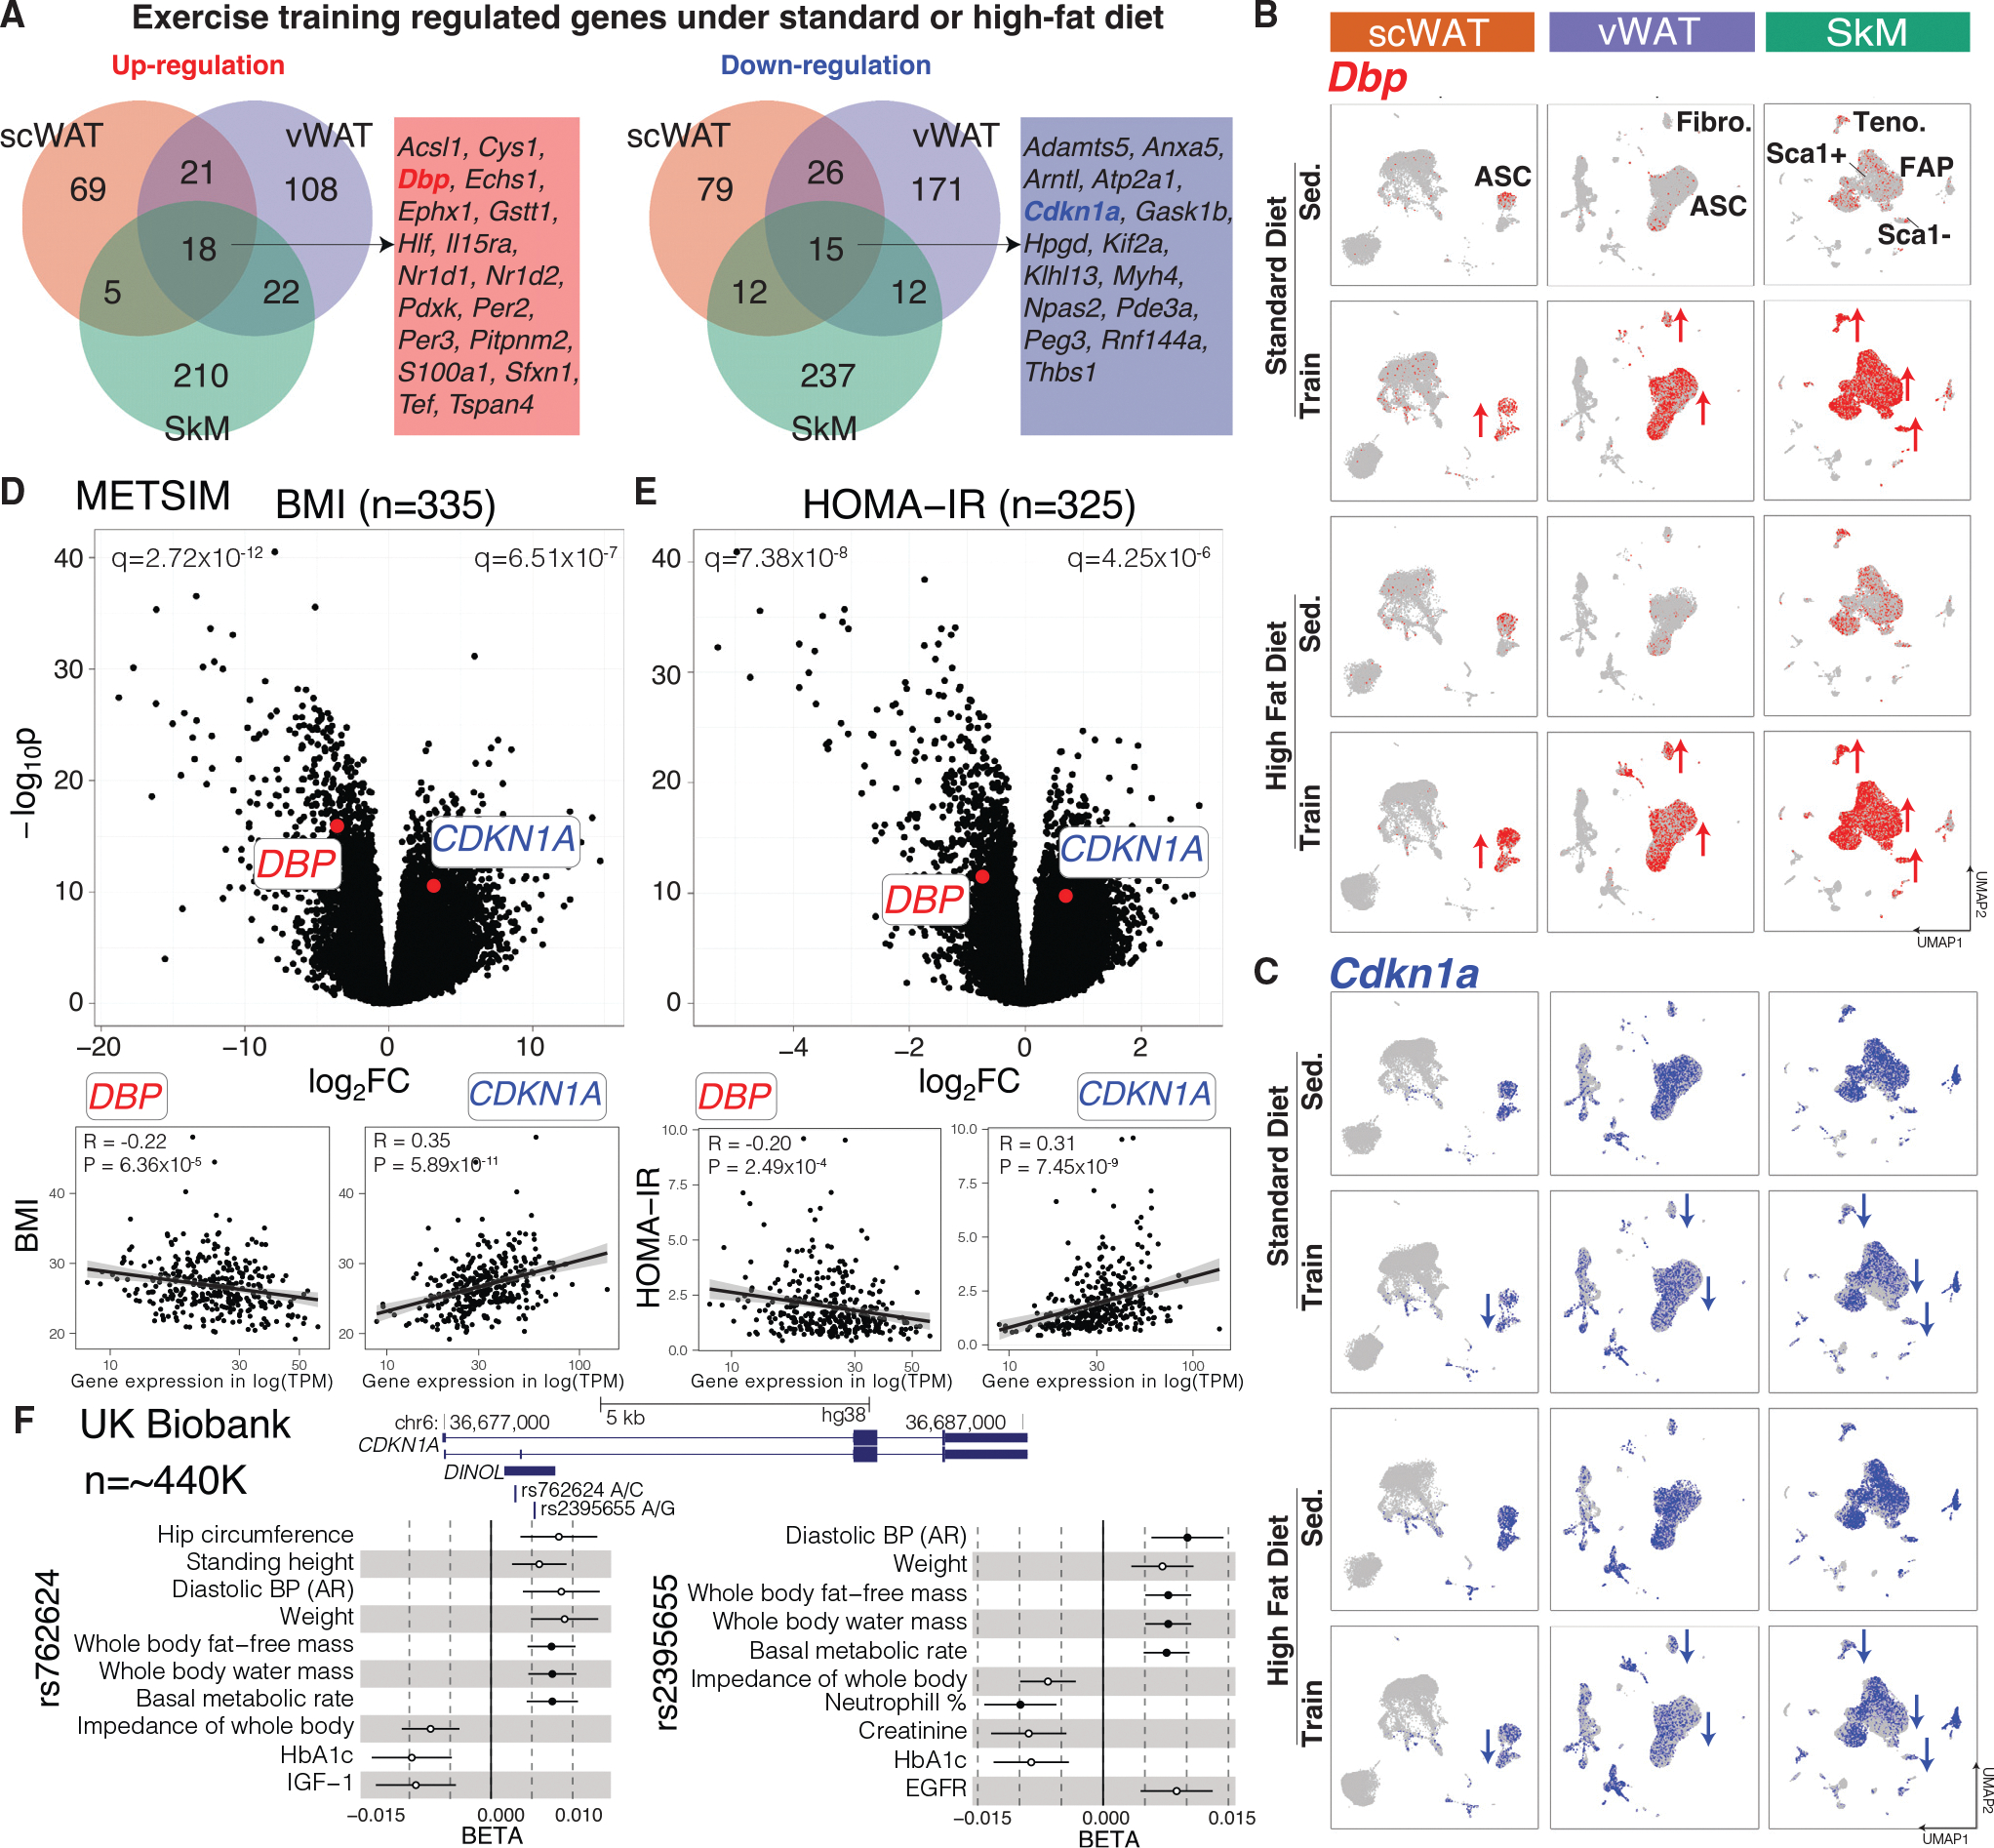
(A) Overlap of up- and downregulated genes by exercise training under standard or HFD across the three tissues in mice.
(B and C) Dbp (B) and CDKN1A (C) expression across the three tissues and four intervention groups. Cell types with the most changes are labeled in the top panel.
(D and E) DBP and CDKN1A association with BMI (D) and HOMA-IR (E) in scWAT of METSIM subjects. Genes (dots in upper plots) and subjects (dots in lower plots) are plotted.
(F) Association of two SNPs (rs762624 and rs2395655) in CDKN1A with anthropometric and metabolic traits in UK Biobank. The meta-analyzed PheWAS summary statistics (BETAs with standard errors, p < 1–3) are shown. The filled circles are significant after correction (p < 1–5). PheWAS, phenome-wide association study; BP, blood pressure; AR, automated reading.
See also Figure S6.
Of the 15 commonly downregulated genes, we selected cell proliferation and senescence regulator Cdkn1a. Cdkn1a is downregulated by training/rescue primarily in MSCs in the three tissues as assessed using both bulk and single-cell methods (Figure 6C). In humans, CDKN1A showed a positive correlation with BMI, HOMA-IR, fasting insulin levels, CRP, and WHR adjusted for BMI and a negative correlation with Matsuda insulin sensitivity index in METSIM (Figures 6D, 6E, and S6A–S6F). The CDKN1A genetic locus contained two SNPs, one intronic (rs762624) and one missense (rs2395655) in linkage disequilibrium (r2 = 0.49 in EUR), that were significantly associated with body weight, fat and fat-free mass, and basal metabolic rate in the UK Biobank (Figure 6F). The minor allele of both SNPs (C for rs762624 and G for rs2395655) showed protective associations with increased body fat-free mass, increased basal metabolic rate, and lower HbA1c. These SNPs are significant splicing quantitative trait loci (QTLs) for CDKN1A in METSIM, with the minor alleles increasing expression of a non-coding transcript isoform (long non-coding RNA, ENST00000462537.3; Figures S6G and S6H). These results suggest a potentially causal role for CDKN1A in human metabolic phenotypes, validating the human disease relevance of our results.
DISCUSSION
Our single-cell atlas with more than 200,000 cells and 53 annotated cell subtypes/states enabled identification of rare cell subtypes/states, notably MSC populations in three key metabolic tissues (scWAT, vWAT, and SkM). We computationally inferred the differentiation trajectory of ASCs and identified depot-shared and depot-specific regulons for the three ASC states in scWAT and vWAT (IPCs, CPs, and CD142+ cells). We identified seven distinct FAP states in SkM and validated one population of Sca1− FAPs as potential fibrogenic progenitors. By studying the three tissues using comprehensive and complementary single-cell, tissue-level, and tissue-deconvolution analyses, we determined two prominent gene programs, ECM and circadian rhythm, both of which were regulated in opposite directions by exercise and obesity in MSCs across the three tissues. We inferred intra-tissue communication changes between ASCs and immune cell subtypes in vWAT. We inferred inter-tissue crosstalk changes between FAPs in SkM and immune cell subtypes in vWAT (Figure 1B). With this study, we set the foundation for understanding the molecular changes and cell types mediating the systemic and heterogeneous effects of exercise on obesity in different tissues.
Our single-cell data indicate that at the pathway level, obesity and exercise training modulate gene expression related to ECM remodeling and circadian rhythm in specific MSC states in the three tissues. Obesity upregulated and exercise downregulated ECM-related pathways in MSCs. Notably, IPC is the only shared MSC state across the three tissues showing consistent ECM pathway regulation with obesity and exercise. Recently, others reported the presence of fibro-inflammatory progenitors in mouse WAT depots, which correspond to IPCs (Figure S3J), with a fibrogenic and inflammatory phenotype featuring ECM gene expression (Hepler et al., 2018; Shao et al., 2021). In humans the frequency of a similar population of cells has been shown to be correlated not only with omental WAT (oWAT) fibrosis level but also with the severity of insulin resistance and type 2 diabetes (Marcelin et al., 2017). Our results suggest that obesity and exercise training could modulate the fibro-inflammatory phenotype of IPCs through ECM-related gene expression.
Another notable MSC-specific exercise-regulated pathway detected in our study was the circadian rhythm pathway, which was upregulated by exercise training across the three tissues. We identified Dbp and its homologs Tef and Hlf as potential master regulators of the upregulated rhythmic pathway. Dbp is a transcription factor with expression under circadian control (Zvonic et al., 2006) and has been reported to improve insulin sensitivity and enhance adipogenesis in pre-adipocytes of vWAT in mice and humans (Suzuki et al., 2019; Ushijima et al., 2020). Taken together, we hypothesize that training-induced increases in circadian rhythm gene expression via Dbp may contribute to hyperplasia in WAT. Our hypothesis is further supported by our analysis of a large human cohort where DBP expression in scWAT is negatively associated with BMI and HOMA-IR. Thus, training-induced circadian rhythm genes in mice and humans may function as MSC differentiation regulators, affecting whole-body metabolic functions.
Single-cell data also empowered us to look into cell-cell communication within and across tissues. Our within-tissue analysis of vWAT highlighted an interesting protein triad, RANK-RANKL-OPG. High serum OPG levels have been associated with metabolic disease in humans, while low OPG levels and high RANKL in rodents were associated with scWAT browning, de novo adipogenesis, and improved metabolic function of WAT (Matsuo et al., 2020). RANK is mostly expressed on M2 macrophages in our single-cell data, macrophages known to confer anti-inflammatory and beiging functions in WAT (Li et al., 2020b). We propose that exercise changes RANKL-OPG to RANKL-RANK interaction, which could recruit M2 macrophages or re-polarize macrophages into an M2 state in vWAT, and in this way promote anti-inflammatory and beiging effects.
Our cross-tissue analysis suggested directed ligand-receptor interactions between distinct vWAT immune cell types and SkM FAPs in response to obesity and exercise training. MIF-CD74 signaling was downregulated by exercise training from SkM FAPs to M1 macrophages and DCs in vWAT, but slightly upregulated its interaction with M2 macrophages in the same tissue. Downregulation of MIF-CD74 signaling on macrophages and DCs has been shown to restore antitumor immune response in cancer (Figueiredo et al., 2018) and reduce adipose tissue inflammation (Kim et al., 2015), which aligns with the notion that exercise training reduces chronic inflammation in vWAT through secreted cytokines from SkM. At the same time, MIF-CD74 interaction is known to play important roles in cell proliferation and survival by activating PI3K-Akt, NF-kB, and AMPK pathways (Farr et al., 2020; Moon et al., 2013), suggesting a potential pro-survival role of the MIF-CD74 signaling axis for M2 macrophages in vWAT. As such, an intriguing hypothesis is that MIF secreted from SkM acts differently on distinct myeloid subtypes in vWAT and that M2 macrophages are regulated by both intra- (RANKL) and inter-tissue (MIF) signals.
In summary, we propose a previously underappreciated role of MSCs in response to obesity and exercise training in the three tissues, mediated through alterations in their fibrogenic, inflammatory, and differentiation potentials. Exercise, as one of the most effective strategies to maintain a healthy body and mind, is increasingly understood to induce tissue-specific and shared adaptations in the context of many other diseases beyond obesity. There may be similar exercise-induced alterations of MSCs in other tissues and in a diverse set of disease and physiological contexts such as cancer and aging.
Limitations of study
In this study, we did not investigate additional physiological conditions including sex, age, and different training modalities, and our experiments were done using a mouse model and not human subjects. Our single-cell protocol enriched for cell types in SVF and resulted in limited observations in parenchymal cell types. For the cross-tissue communication analysis, although we restricted one of the two interacting partners being secretable and the interaction being non-integrin, orthogonal data types such as proteomics in the blood and experimental efforts using in vitro co-culturing systems and in vivo tracer approaches will be useful to fully resolve tissue crosstalk.
STAR★METHODS
RESOURCE AVAILABILITY
Lead contact
Further information and requests for resources and reagents should be directed to and will be fulfilled by the lead contact, Manolis Kellis (manoli@mit.edu).
Materials availability
This study did not generate new unique materials.
Data and code availability
All raw and processed bulk mRNA-seq and scRNA-seq data have been uploaded in the GEO database (https://www.ncbi.nlm.nih.gov/gds) with the accession numbers GEO: GSE183239 and GSE183288 under SuperSeries GEO: GSE183290. We also provide an interactive data and analysis browser for all the data at http://scmetab.mit.edu/. Additional supplemental figures and tables were deposited in Zenodo: https://doi.org/10.5281/zenodo.7011615.
Original codes for data analysis were deposited on Github at https://github.com/KellisLab/scmetab.
All values used to generate the graphs of the paper can be found in the file Data S1 – Source Data. Any additional information required to reanalyze the data reported in this paper is available from the lead contact upon request.
EXPERIMENTAL MODEL AND SUBJECT DETAILS
All experiments were conducted following NIH guidelines and protocols were approved by the Institutional Animal Care and Use Committee at Joslin Diabetes Center in Boston, MA. C57BL/6 N mice were purchased from the Charles River Laboratories and were housed in singular cages at room temperature (23°c) on a 12 h/12 h light/dark cycle (6a [ON]/6p [OFF]) in an AAALAC-approved animal facility at Joslin Diabetes Center. The mice were given ad libitum access to food and water and fed either a standard chow-diet (10% kcal fat; 9F5020-LabDiet, PharmaServ) or an HFD (60% kcal fat; 9F5020-LabDiet, PharmaServ). Any mouse that ran less than 3 km/day was excluded from analyses. Mice were anesthetized 24 h after the last bout of exercise and following a 6-h fast, using Isoflurane and heart puncture. We used 5% v/v Isoflurane (NDC 60307–120, Piramal Healthcare) which was administered with an EZ-150C anesthesia machine (E-Z Systems). Tissues were then rapidly dissected and processed or stored for analysis. All participants of the METSIM cohort provided informed consent and the study was approved by the ethics committee of the University of Eastern Finland. The genetic analysis in UK Biobank has been conducted using the UK Biobank Resource under Application Number 21942, “Integrated models of complex traits in the UK Biobank” (https://www.ukbiobank.ac.uk/enable-your-research/approved-research/integrated-models-of-complex-traits-in-the-uk-biobank). All participants of the UK Biobank provided written informed consent (more information is available at https://www.ukbiobank.ac.uk/2018/02/gdpr/).
METHOD DETAILS
Animals, exercise, and sample collection
We used 6-week-old male mice for this experiment. For the first 3 weeks, all mice were sedentary, and half of the mice were fed a chow standard diet (10% kcal fat; 9F5020-LabDiet, PharmaServ) and the other half a HFD (60% kcal fat; 9F5020-LabDiet, PharmaServ) ad libitum. HFD feeding was used as a robust model for the development of impaired glucose tolerance. At the start of week 4, mice were further divided into sedentary and training groups, resulting in four groups: sedentary chow-fed; exercise training chow- fed; sedentary HFD fed; and exercise training HFD fed. The mouse cohort consisted of 60 mice: 12 in each sedentary group (12 chow; 12 HFD) and 18 in each training group (18 standard diet; 18 HFD). Exercise training was done by housing mice in individual cages containing a running wheel. Mice had free access to the wheel at all times, and running distance was recorded daily. Sedentary mice were individually housed in standard cages. All mice had body weights measured every two days. After 21 days, mice underwent a glucose tolerance test (GTT) after a 12-h fast. Seven days later (day 28), the wheels of the trained mice were locked. Twenty-four hours later, following a 6-h fast, mice were anesthetized with 5% v/v Isoflurane (NDC 60307–120, Piramal Healthcare) using EZ-150C anesthesia machine (E-Z Systems) and blood was drawn by heart puncture. Perigonadal visceral (vWAT) and inguinal subcutaneous white adipose tissue (scWAT) and triceps muscle were rapidly dissected and were either snap frozen or processed fresh to generate cell suspension.
Bulk mRNA sequencing
For the whole-tissue RNAseq, also known as bulkRNAseq, we euthanized 5 mice per group and harvested inguinal and perigonadal WAT as well as triceps. These tissues were snap frozen in liquid nitrogen immediately after collection. Total RNA was extracted at the Goodyear lab using an RNA extraction kit (Direct-zol RNA MiniPrep, Zymo Research). 10 ng of total RNA quantified and quality assessed by Advanced Analytical Fragment Analyzer was used for library preparation on Tecan Evo150. 3′ DGE-custom primers 3V6NEXT-bmc#1–12 were added to a final concentration of 1 uM. (5’-/5Biosg/ACACTCTTTCCCTACACGACGCTCTTCCGATCT [BC6]N10T30VN-3′ where 5Biosg = 5’ biotin, [BC6] = 6 bp barcode specific to each sample/well, N10 = Unique Molecular Identifiers, Integrated DNA technologies), to generate two subpools of 15 samples each. After addition of the oligonucleotides, Maxima H Minus RT was added per manufacturer’s recommendations with Template-Switching oligo 5V6NEXT (10uM, [5V6NEXT: 5′-iCiGiCA CACTCTTTCCCTACACGACGCrGrGrG-3′ where iC: iso-dC, iG: iso-dG, rG: RNA G]) followed by incubation at 42°C for 90′ and inactivation at 80°C for 10’. Following the template switching reaction, cDNA from 12 wells containing unique well identifiers were pooled together and cleaned using RNA Ampure beads at 1.0X. cDNA was eluted with 17 ul of water followed by digestion with Exonuclease I at 37°C for 30 min, and inactivated at 80°C for 20 min.
Second strand synthesis and PCR amplification was done by adding the Advantage 2 Polymerase Mix (Clontech) and the SINGV6 primer (10 pmol, Integrated DNA Technologies 5’-/5Biosg/ACACTCTTTCCCTACACGACGC-3′) directly to the exonuclease reaction. Eight cycles of PCR were performed followed by clean up using regular SPRI beads at 0.6X, and eluted with 20ul of elution buffer (Qiagen). Successful amplification of cDNA was confirmed using the Fragment Analyzer.
Illumina libraries were then produced using standard Nextera tagmentation substituting P5NEXTPT5-bmc primer (25 μM, Integrated DNA Technologies, 5′-AATGATACGGCGACCACCGAGATCTACACTCTTTCCCTACACGACGCTCTTCCG*A*T*C*T*−3′ where * = phosphorothioate bonds) in place of the normal N500 primer. Final libraries were cleaned using SPRI beads at 0.7X and quantified using the Fragment Analyzer and qPCR before being loaded for sequencing using the Hiseq 2000 (Illumina, Inc) in 50 bp single-end mode at the BioMicro Center at MIT.
Single-cell RNA sequencing
Tissues from 2–3 mice were pooled to achieve >1×10⁶ analyzable cells (final sample size per group = 3–4). Fresh tissues were enzymatically digested and dissociated according to tissue dissociation kit protocols (adipose tissue Cat No 130–105-808, skeletal muscle Cat No 130–098-305 by Miltenyi) using the gentleMACS Dissociator (Miltenyi). Dissociated tissues were filtered, centrifuged, and the isolated cells were resuspended in 0.1% BSA in PBS and immediately processed for the generation of single-cell RNA (scRNA) libraries using the droplet-based RNA sequencing technology. Briefly, 5000–6000 cells were profiled per sample using the Chromium Single Cell 3′ RNA reagent kit v3 according to the 10X Genomics protocol. The generated cDNA libraries were indexed, pooled, and sequenced in three batches using the NovaSeq 6000 S2 system and reagent kits (100 cycles; Illumina) at the BioMicro Center Core at MIT.
Histology
Representative samples of scWAT and vWAT were fixed with 3.7% formaldehyde for 24hrs and then stored in 70% ethanol at 4°C. Five-micrometer-thick tissue sections were stained with hematoxylin and eosin (Richard Allan Scientific) and relative adipocyte size was estimated at 20-fold magnification of 5 random fields using an inverted fluorescence microscope (IX51Olympus). CellProfiler 3.0 (http://cellprofiler.org) was used for the automatic measurement.
FACS-based cell isolation, RNA isolation and quantitative PCR
Single cell suspension passed through 40 um (FisherBrand) and dead cell removal MS column (Miltenyi Biotec) were stained with anti-CD45 BV650 antibody (1:100, Biolegend), anti-CD34 PE antibody (1:100, Biolegend), anti-CD140 PE-Cy7 (1; 100, Biolegend), anti-SCA1 BV421 (1:100, Biolegend) in PBS containing 0.1% BSA at 4°C for 30 min. After 3 times of washing, Cytox green (1:100, Invitrogen) was added as a dead cell marker. Live CD140+ SCA1+ and CD140+SCA− cells from CD45−CD34+ populations were sorted on Aria II (BD biosciences), and the RNA were isolated using Trizol in combination with miRNeasy kit (Qiagen). 15 ul of elution buffer was used to elute RNA, and we performed qRT-PCR using RNA to Ct kit on Quant Studio 7 (Thermo Scientific) to detect gene differentially expressed in CD140+SCA1+ and CD140+SCA1−.
RNAscope LS Multiplex Fluorescent ISH assay
RNA in situ hybridization experiments were performed using the RNAscope technology, which has been previously described (Wang et al., 2012). Paired double-Z oligonucleotide probes were designed against target RNA using custom software. The RNAscope LS Fluorescent Multiplex Kit and the probes targeting mouse pdgfr variant 1 and ly6a mRNA were from Advanced Cell Diagnostics (Newark CA). The RNAscope LS Fluorescent Multiplex Kit was used with standard pre-treatment conditions. FFPE mouse skeletal muscle tissue samples were incubated with Leica BOND Epitope Retrieval Solution 2 (ER2) at 95°C for 15 min. RNAscope 2.5 LS Protease III was used for 15 min at 40°C. Pre-treatment conditions were optimized for each sample and quality control for RNA integrity was completed using probes specific to the housekeeping genes Polr2a, Ppib, and Ubc. These probes are low, moderate, and high expressing genes, respectively. Negative control background staining was evaluated using a probe specific to the bacterial dapB gene. Fluorescent images were acquired using a 3D Histech Panoramic Scan Digital Slide Scanner microscope using a 40x objective.
Immunohistochemistry assay
The 5um gastrocnemius muscles sections were fixed with 3.7% formaldehyde for 24hrs, embedded in paraffin and submitted to antigen retrieval with a hot 1x sodium citrate buffer (10 mM sodium citrate, 0.05% Tween 20, pH6). Immunofluorescence was carried out using 15ug/mL anti-SCA1 (710952, ThermoFisher), 5ug/mL anti-PDGFRA (TA807645 S, Origene), and 15ug/mL anti-LAMA4 (AF3837-SP, R&D Systems). Primary antibodies were incubated overnight at 4°C. Secondary antibodies were anti-mouse Alexa 488, anti-rabbit Alexa 568, and anti-goat Alexa 647 at a 1:400 dilution. Secondary antibodies were incubated for 1 h at room temperature. The slides were mounted with Vectashield with DAPI to counterstain nuclei. Immunofluorescence images were obtained with a confocal laser scanning microscope (Zeiss LSM 710).
QUANTIFICATION AND STATISTICAL ANALYSIS
Analysis of bulk mRNA-seq data
Pre-processing and DE analysis
Six FASTQ files for each sample were concatenated for read de-duplication using unique molecular identifiers (UMIs). We then ran Salmon 0.14.2 (Patro et al., 2017) to quantify the number of unique reads for each transcript against Ensembl version 98 mouse transcripts. The transcript level information was summarized to the gene-level using R package tximport (Soneson et al., 2015). We then clustered all the samples across three tissues unbiasedly to observe potential batch effects and sample outliers. Next for each tissue, genes with a count greater than 10 in all the samples were retained, and differential gene expression analysis for our three comparisons was carried out using R package DESeq2 (Love et al., 2014). We used Independent Hypothesis Weighting (IHW; Ignatiadis et al., 2016) to adjust p values and adaptive shrinkage estimator (ashr; Stephens, 2017) to adjust fold changes from DESeq2 results. We called significant DEGs at an adjusted p value cutoff of 0.05 (Table S1).
Deconvolution
We performed deconvolution on bulk mRNA-seq data using CIBERSORTx (Newman et al., 2019) and in reference to two publicly available datasets (Dos Santos et al., 2020; Rajbhandari et al., 2019): one is a scRNA-seq data in scWAT and the other is a snRNA-seq data in skeletal muscle. We integrated and re-annotated the scWAT scRNA-seq dataset, and confirmed original cell type annotation for the skeletal muscle snRNA-seq dataset (figures on Zenodo). We ran CIBERSORTx using default parameters for all three analysis modules, including creating signature matrices using the two reference datasets, imputing cell fractions, and sample-level gene expression using our bulk data. We calculated expression changes for genes with imputed expression levels in the three comparisons using the Wilcoxon rank sum test.
scRNA-seq data analysis
Pre-processing, clustering and annotation
Gene count matrices for each single-cell sample were generated by aligning reads to the mm10 genome (refdata-gex-mm10–2020-A) using 10X Genomics Cell Ranger software v4.0.0. We profiled 317,754 cells across 42 libraries from 93 tissue samples (pooling tissues from 2–3 mice to obtain enough cells), capturing 6501 cells per library, 2025 genes per cell, and 45,421 reads per cell on average. We clustered pseudo-bulk profiles of individual single-cell samples to determine potential batch effects, and excluded one low-quality sample based on unbiased clustering results. Then for each sample, we removed ambient RNA contamination using SoupX (Young and Behjati, 2020) with a fixed contamination fraction of 20%. The 20% fixed threshold performed the best compared to no ambient RNA removal, automatic removal implemented in SoupX, 10 and 15% fixed thresholds, and threshold estimated using hemoglobin genes, to reach a desirable de-contaminated visualization and keep the greatest number of cells. We then excluded low-quality cells using four QC metrics: (i) number of genes with non-zero expression fewer than 500; (ii) number of UMIs fewer than 200 or more than 6000; (iii) percentage of reads mapping to mitochondrial genes more than 10; and (iv) number of reads mapped to Mki67 more than 0. We removed potential cell doublets using DoubletFinder (McGinnis et al., 2019) with default parameters and 3.1% homotypic doublet proportion estimation based on statistics published by 10X Genomics. After stringent QC, we report expression levels for a total of 17,341 genes across 204,883 cells. Next we integrated all the 41 samples across three tissues together for an atlas, and samples belonging to a single tissue together for tissue-specific maps. Integration was done without any batch correction using Seurat v3 (Hafemeister and Satija, 2019). We used “sctransform” in Seurat for data normalization, performed principal component analysis (PCA) to obtain the first 50 PCs, used the 50 PCs to build community, and clustered the cells using both a graph-based clustering approach as implemented in Seurat v3 and a density-based clustering approach in R package dbscan (Hahsler et al., 2019). Visualization of the tissue- and atlas-level datasets was through non-linear dimensional reduction techniques such as tSNE and UMAP. We adjusted processing steps for tSNE in reference to this paper (Kobak and Berens, 2019). We then annotated cell clusters using SciBet (Li et al., 2020a), SingleR (Aran et al., 2019), and cell type-specific markers from Tabula Muris (Tabula Muris Consortium et al., 2018) and tissue-focused studies in the field (Giordani et al., 2019; Merrick et al., 2019; Oprescu et al., 2020; Ramirez et al., 2020). For unknown cell type subclusters like Sca1− FAP, we identified cell type-specific markers using the “FindMarkers” function in Seurat with an expression cutoff of 25% in either of the two tested populations. We further subsetted each cell type and performed sub-clustering within the cell type to identify cell subtypes/states. We annotated identified cell subtypes/states referencing markers from the literature. We distinguished: (a) follicular vs. memory B-cells; (b) M1 vs. M2 macrophages; (c) T-cell subtypes including CD8 naive, CD8 cytotoxic, CD4 naive, CD4 memory, T regulatory (Treg), NKT, and naive (Cd27−) vs. memory (Cd27+) gamma-delta (Tgd); (d) dendritic cell (DC) subtypes conventional type 1, type 2, and monocyte-derived; (e) inflammatory vs. patrolling monocytes; (f) six tenocyte subtypes, including Pdgfra + tendon stem/progenitor cells (TSPCs), pre_Dpp4+, Dpp4+, Col22a1+, Pappa2+, and Scx−; (g) vascular smooth muscle cells (SMCs) vs. SMC precursors vs. pericytes; (h) endothelial subtypes (Kalucka et al., 2020) associated with large vessel vs. large artery vs. capillary vs. lymphatic vessel; (i) myelinating vs. non-myelinating glial (Schwann) cells; (j) three states of ASCs in WAT, including interstitial progenitor cells (IPCs, marked by Dpp4+/Pi16+), committed pre-adipocytes (CPs, marked by Icam1+/Fabp4+), and CD142+ cells (defined as CD142+/Fmo2+ Dong et al., 2022; Merrick et al., 2019; Schwalie et al., 2018), and a fourth state specific to vWAT (pre_CP), lying between IPCs and CPs and expressing both Dpp4 and Icam1; and (k) seven states of FAPs.
DE analysis
We performed cell-type- and cell-state-specific differential expression (DE) analysis on “pseudo-bulk” profiles, generated by summing counts together for all cells with the same combination of cell type/state and sample. This approach leverages the resolution offered by single-cell technologies to define cell types/states, and combines it with the statistical rigor of existing methods for DE analysis involving a small number of samples (Amezquita et al., 2020). The DE analysis was performed using quasi-likelihood (QL) methods from the edgeR package (Robinson et al., 2010). We removed cell type/state and sample combinations containing fewer than 10 cells. Cell-type/state-specific DE-Gs were determined using an FDR cutoff of 0.05 (Table S4).
Cellular communication
For within- and cross-tissue communication prediction, we exported gene-by-cell count matrices and cell type/state assignment for each cell as two input files for CellPhoneDB “statistical analysis” (Efremova et al., 2020). CellPhoneDB is a publicly available repository of curated receptors, ligands and their interactions with the advantage of taking subunit architecture into consideration. We then imported CellPhoneDB results into R, merged interactions identified in each sample, and compared rank and mean values for all the interacting partners of an interaction in our three defined comparisons (“obesity”, “training”, and “rescue”). Specifically for cross-tissue interactions, we forced ligands to be secretable and interactions to be non-integrin. We then derived log2 fold changes using mean value, and calculated statistical significance on ranks using the Wilcoxon rank sum test implemented in base R. Interactions with a nominal p value of 0.1 were plotted using RCy3 package (Gustavsen et al., 2019) and Cytoscape (Table S5).
Gene regulatory network and CytoTRACE
We inferred per-sample GRNs using SCENIC with GRNBoost implementation in Python (Aibar et al., 2017), and detected regulons with differential activities between intervention groups using the Wilcoxon rank sum test. We estimated differentiation stages of ASCs and FAPs using the script provided with the CytoTRACE framework (Gulati et al., 2020). CytoTRACE leverages a simple, yet robust, determinant of developmental potential-the number of detectably expressed genes per cell, or gene counts to predict the differentiation state of cells from single-cell RNA-seq data. All the QC steps and analysis performed on single-cell data were illustrated and summarized in a figure deposited to Zenodo.
METSIM and UK biobank analysis
METSIM RNA-seq
The METSIM cohort consists of 10,197 Finnish men with detailed metabolic phenotyping (Laakso et al., 2017). Among these, we analyzed 335 participants with RNA-seq data from subcutaneous adipose tissue biopsies. Reads were mapped using STAR v2.5.2b (Dobin et al., 2013) to the GRCh38 genome with Gencode (Frankish et al., 2019) v26 as a transcriptome annotation. Gene read counts were calculated using FeatureCounts. We performed transcriptome-wide differential expression for insulin, glucose, Homa-IR, C-reactive protein (CRP), free fatty acids (FFA), Matsuda index, BMI, and waist-hip ratio adjusted for BMI (WHRadjBMI). All phenotypes except WHRadjBMI were log-transformed to induce an approximate normal distribution. To improve power, we included RIN, the first PC, and sequencing batch as covariates. Normalization factors for library size were calculated using Trimmed Mean of M-values (TMM). To perform DE, we used edgeR v3.22.5 (Robinson et al., 2010) with the quasi-likelihoods to fit the models and obtain p values. P-values were adjusted for multiple testing using FDR.
METSIM isoform QTL
To estimate isoform transcript abundance, we ran Kallisto (Bray et al., 2016) using Gencode v26 as a transcriptome reference. Isoform QTLs were detected with FastQTL (Ongen et al., 2016). Isoform transcripts per million (TPM) estimates from Kallisto were rank transformed to a standard normal distribution. FastQTL was run using RIN, batch, and the first 35 PCs as covariates. To determine the number of PCs, a QTL analysis was run on chromosome 21 with successively larger numbers of PCs as covariates. We selected 35 as this roughly maximized the number of isoform QTLs. We extracted nominal p values and corrected for multiple testing as follows. For each isoform, we corrected SNP-isoform p values using Benjamini-Hochberg. Then, we corrected the q-values for the number of isoforms tested using Bonferroni.
UK biobank
To assess the phenome-wide associations of the genetic variants in DBP and CDKN1A across anthropometric and metabolic traits in human, we investigated GWAS summary statistics across 8 variants in the two candidate genes and 108 traits in UK Biobank. Briefly, we focused on meta-analyzed GWAS summary statistics on directly genotyped arrays (Bycroft et al., 2018) across a total of 451,354 individuals consisting of white British (n = 337,129), non-British white (n = 44,632), African (n = 6,497), South Asian (n = 7,831), East Asian (n = 1,704), semi-related (n = 44,632), and admixed (n = 28,656) individuals, defined from a combination of genotype PCs and self-reported ancestry as described elsewhere (Sinnott-Armstrong et al., 2021; Venkataraman et al., 2021). The association summary statistics was visualized with R ‘ggforestplot’ package (https://nightingalehealth.github.io/ggforestplot/index.html) and is available as a part of Global Biobank Engine (McInnes et al., 2019).
Other computational analyses and data processing remarks
Enrichment analysis was performed using the web server Metascape with default parameters (Zhou et al., 2019). All the heatmaps were generated using R package ComplexHeatmap (Gu et al., 2016). All computational analyses were performed using R version 3.4.0. All Wilcoxon rank sum tests were unpaired and two-sided. All two-way ANOVA followed by Tukey multiple comparison tests were generated in GraphPad Prism v9. All boxplots were generated and displayed in R, using the geom_boxplot() function with default parameters. The median value is indicated with a black line, and a colored box (hinges) is drawn between the 1st and 3rd quartiles (interquartile range, IQR). The whiskers correspond to no further than 1.5 × IQR from the hinge and outliers are omitted. All bar plots for phenotype analysis were generated and displayed in Prism, which display mean values as centers and the standard deviation as error bars. All included microscopy images are representative.
Supplementary Material
KEY RESOURCES TABLE.
| REAGENT or RESOURCE | SOURCE | IDENTIFIER |
|---|---|---|
|
| ||
| Antibodies | ||
|
| ||
| anti-CD45 | Biolegend | 103133; RRID: AB_10899570 |
| anti-CD34 | Biolegend | 128609; RRID: AB_10899570 |
| anti-CD140a | Biolegend | 135911; RRID: AB_10899570 |
| anti-SCA1 | Biolegend | 122511; RRID: AB_10899570 |
| anti-SCA1 | Thermo Fisher Scientific | 710952; RRID: AB_2609699 |
| anti-PDGFRA | Origene | TA807645 |
| anti-LAMA4 | R&D Systems | AF3837; RRID: AB_2249744 |
|
| ||
| Chemicals, peptides, and recombinant proteins | ||
|
| ||
| Isoflurane | Piramal Healthcare | 60307-120 |
| Gill 3 Hematoxylin | Richard Allan Scientific | 72604 |
| Eosin Y | Richard Allan Scientific | 71311 |
| Cytox green | Invitrogen | S34860 |
|
| ||
| Critical commercial assays | ||
|
| ||
| Direct-zol RNA MiniPrep | Zymo Research | R2050 |
| Advantage 2 Polymerase Mix | TaKaRa Bio | 639201 |
| Adipose tissue dissociation kit | Miltenyi Biotec | 130-105-808 |
| Skeletal muscle tissue dissociation kit | Miltenyi Biotec | 130-098-305 |
| Chromium Single Cell 3’ RNA reagent kit v3 | 10X Genomics | 1000075 |
| Dead cell removal MS column | Miltenyi Biotec | 130-042-201 |
| Dead cell removal kit | Miltenyi Biotec | 130-090-101 |
| miRNeasy micro kit | Qiagen | 217084 |
| RNAscope LS Multiplex Reagent Kit | Advanced Cell Diagnostics | 322800 |
|
| ||
| Deposited data | ||
|
| ||
| Mouse scWAT, vWAT and SkM exercise-obesity bulk RNA-seq data | This paper | GEO: GSE183239 |
| Mouse scWAT, vWAT and SkM exercise-obesity single-cell RNA-seq data | This paper | GEO: GSE183288 |
| Raw data | This paper | Data S1 |
|
| ||
| Experimental models: Organisms/strains | ||
|
| ||
| C57BL/6 N mice | Charles River Laboratories | N/A |
|
| ||
| Oligonucleotides | ||
|
| ||
| See bulk mRNA sequencing section for oligos and primers | N/A | N/A |
| Pdgfra-F: AGAGTTACACGTTTGAGCTGTC; Pdgfra-R: GTCCCTCCACGGTACTCCT | Integrated DNA Technologies | N/A |
| Ly6a-F: AGGAGGCAGCAGTTATTGTGG; Ly6a-R: CGTTGACCTTAGTACCCAGGA | Integrated DNA Technologies | N/A |
| Dpt-F: TGGATGGGTGAATCTTAACCGC; Dpt-R: TCAGAGCCTTCCTTCTTGCTA | Integrated DNA Technologies | N/A |
| Apoe-F: CTGACAGGATGCCTAGCCG; Apoe-R: CGCAGGTAATCCCAGAAGC | Integrated DNA Technologies | N/A |
| Mm-Ly6a-C3 | Advanced Cell Diagnostics | 427578-C3 |
| Mm-Pdgfra-C4 | Advanced Cell Diagnostics | 480668-C4 |
|
| ||
| Software and algorithms | ||
|
| ||
| CellProfiler 3.0 | (McQuin et al., 2018) | http://cellprofiler.org |
| Salmon 0.14.2 | (Patro et al., 2017) | https://salmon.readthedocs.io/en/latest/salmon.html |
| CIBERSORTx | (Newman et al., 2019) | https://cibersortx.stanford.edu/ |
| Cell Ranger software v4.0.0 | 10X Genomics | https://support.10xgenomics.com/single-cell-gene-expression/software/pipelines/latest/what-is-cell-ranger |
| CellPhoneDB | (Efremova et al., 2020) | https://github.com/ventolab/CellphoneDB |
| Cytoscape | (Shannon et al., 2003) | https://cytoscape.org/ |
| R 4.0.4 | See quantification and statistical analysis section for R packages used | https://www.r-project.org/about.html |
| STAR v2.5.2b | (Dobin et al., 2013) | https://github.com/alexdobin/STAR |
| Kallisto | (Bray et al., 2016) | https://pachterlab.github.io/kallisto/about |
| FastQTL | (Ongen et al., 2016) | https://github.com/francois-a/fastqtl |
| Metascape | (Zhou et al., 2019) | https://metascape.org/gp/index.html#/main/step1 |
| Prism v9 | GraphPad Software | http://www.graphpad.com |
|
| ||
| Other | ||
|
| ||
| 10% kcal fat LabDiet | PharmaServ | 9F5020 |
| 60% kcal fat LabDiet | PharmaServ | 9F5020 |
| 24 cm running wheel | NalGene | N/A |
Highlights.
Exercise-obesity single-cell atlas in two white adipose depots and skeletal muscle
Exercise and obesity have opposite effects on ECM and circadian rhythmicity genes in MSCs
Within- and multi-tissue crosstalk in exercise and obesity centered around MSCs
Genes with large exercise effects in MSCs correlate with human metabolic traits
ACKNOWLEDGMENTS
We thank Minna Kaikkonen-Määttä for advice and feedback on the work, Stuart Levine for generating high-quality data and technical support, Carlos Castorena and Angie Bookout for discussions and feedback on the HFD and exercise training-regulated genes, Karen Mohlke for analysis advice on the METSIM cohort, Charlie Whittaker for help with bulk 3′ DGE data processing, and Julio Mantero for experimental support. This work was supported by Novo Nordisk Research Center (M.K. and L.Z.A.), R01DK099511 (L.J.G.), 5P30-DK-36836 (Joslin Diabetes Center), U24HG009446 (M.K.), and UG3NS115064 (M.K.). J.Y. was supported by T32-DK110919; M.V. by T32-DK007260, F32-DK126432, and Joslin Diabetes Center P&F; R.J.W.M. by K23-DK114550; Y.T. by R01HG008155 and R01AG067151; and P.P. and M.A. by R01HG010505 and R01DK132775.
Footnotes
DECLARATION OF INTERESTS
K. Grove is an employee of Novo Nordisk.
SUPPLEMENTAL INFORMATION
Supplemental information can be found online at https://doi.org/10.1016/j.cmet.2022.09.004.
REFERENCES
- Aibar S, González-Blas CB, Moerman T, Huynh-Thu VA, Imrichova H, Hulselmans G, Rambow F, Marine J-C, Geurts P, Aerts J, et al. (2017). SCENIC: single-cell regulatory network inference and clustering. Nat. Methods 14, 1083–1086. [DOI] [PMC free article] [PubMed] [Google Scholar]
- Amezquita RA, Lun ATL, Becht E, Carey VJ, Carpp LN, Geistlinger L, Marini F, Rue-Albrecht K, Risso D, Soneson C, et al. (2020). Orchestrating single-cell analysis with Bioconductor. Nat. Methods 17, 137–145. [DOI] [PMC free article] [PubMed] [Google Scholar]
- Ancel S, Mashinchian O, and Feige JN (2019). Adipogenic progenitors keep muscle stem cells young. Aging 11, 7331–7333. [DOI] [PMC free article] [PubMed] [Google Scholar]
- Aran D, Looney AP, Liu L, Wu E, Fong V, Hsu A, Chak S, Naikawadi RP, Wolters PJ, Abate AR, et al. (2019). Reference-based analysis of lung single-cell sequencing reveals a transitional profibrotic macrophage. Nat. Immunol. 20, 163–172. [DOI] [PMC free article] [PubMed] [Google Scholar]
- Bray NL, Pimentel H, Melsted P, and Pachter L (2016). Erratum: Near-optimal probabilistic RNA-seq quantification. Nat. Biotechnol. 34, 888. [DOI] [PubMed] [Google Scholar]
- Bycroft C, Freeman C, Petkova D, Band G, Elliott LT, Sharp K, Motyer A, Vukcevic D, Delaneau O, O’Connell J, et al. (2018). The UK Biobank resource with deep phenotyping and genomic data. Nature 562, 203–209. [DOI] [PMC free article] [PubMed] [Google Scholar]
- Camps J, Breuls N, Sifrim A, Giarratana N, Corvelyn M, Danti L, Grosemans H, Vanuytven S, Thiry I, Belicchi M, et al. (2020). Interstitial cell remodeling promotes aberrant adipogenesis in dystrophic muscles. Cell Rep. 31, 107597. [DOI] [PubMed] [Google Scholar]
- Chapman MA, Mukund K, Subramaniam S, Brenner D, and Lieber RL (2017). Three distinct cell populations express extracellular matrix proteins and increase in number during skeletal muscle fibrosis. Am. J. Physiol. Cell Physiol. 312, C131–C143. [DOI] [PMC free article] [PubMed] [Google Scholar]
- Claussnitzer M, Dankel SN, Kim K-H, Quon G, Meuleman W, Haugen C, Glunk V, Sousa IS, Beaudry JL, Puviindran V, et al. (2015). FTO obesity variant circuitry and adipocyte browning in humans. N. Engl. J. Med. 373, 895–907. [DOI] [PMC free article] [PubMed] [Google Scholar]
- Davey JR, Watt KI, Parker BL, Chaudhuri R, Ryall JG, Cunningham L, Qian H, Sartorelli V, Sandri M, Chamberlain J, et al. (2016). Integrated expression analysis of muscle hypertrophy identifies Asb2 as a negative regulator of muscle mass. JCI Insight 1, e85477. 10.1172/jci.insight.85477. [DOI] [PMC free article] [PubMed] [Google Scholar]
- Dobin A, Davis CA, Schlesinger F, Drenkow J, Zaleski C, Jha S, Batut P, Chaisson M, and Gingeras TR (2013). STAR: ultrafast universal RNA-seq aligner. Bioinformatics 29, 15–21. [DOI] [PMC free article] [PubMed] [Google Scholar]
- Dong H, Sun W, Shen Y, Baláz M, Balázová L, Ding L, Löffler M, Hamilton B, Klöting N, Blüher M, et al. (2022). Identification of a regulatory pathway inhibiting adipogenesis via RSPO2. Nat. Metab. 4, 90–105. [DOI] [PMC free article] [PubMed] [Google Scholar]
- Dos Santos M, Backer S, Saintpierre B, Izac B, Andrieu M, Letourneur F, Relaix F, Sotiropoulos A, and Maire P (2020). Single-nucleus RNA-seq and FISH identify coordinated transcriptional activity in mammalian myofibers. Nat. Commun. 11, 5102. [DOI] [PMC free article] [PubMed] [Google Scholar]
- Efremova M, Vento-Tormo M, Teichmann SA, and Vento-Tormo R (2020). CellPhoneDB: inferring cell–cell communication from combined expression of multi-subunit ligand–receptor complexes. Nat. Protoc. 15, 1484–1506. [DOI] [PubMed] [Google Scholar]
- Farmer SR (2006). Transcriptional control of adipocyte formation. Cell Metab. 4, 263–273. [DOI] [PMC free article] [PubMed] [Google Scholar]
- Farr L, Ghosh S, and Moonah S (2020). Role of MIF cytokine/CD74 receptor pathway in protecting against injury and promoting repair. Front. Immunol. 11, 1273. [DOI] [PMC free article] [PubMed] [Google Scholar]
- Figueiredo CR, Azevedo RA, Mousdell S, Resende-Lara PT, Ireland L, Santos A, Girola N, Cunha RLOR, Schmid MC, Polonelli L, et al. (2018). Blockade of MIF-CD74 signalling on macrophages and dendritic cells restores the antitumour immune response against metastatic melanoma. Front. Immunol. 9, 1132. [DOI] [PMC free article] [PubMed] [Google Scholar]
- Forcina L, Miano C, Scicchitano BM, Rizzuto E, Berardinelli MG, De Benedetti F, Pelosi L, and Musarò A (2019). Increased circulating levels of interleukin-6 affect the redox balance in skeletal muscle. Oxid. Med. Cell. Longev. 2019, 3018584. [DOI] [PMC free article] [PubMed] [Google Scholar]
- Frankish A, Diekhans M, Ferreira A-M, Johnson R, Jungreis I, Loveland J, Mudge JM, Sisu C, Wright J, Armstrong J, et al. (2019). GENCODE reference annotation for the human and mouse genomes. Nucleic Acids Res. 47, D766–D773. [DOI] [PMC free article] [PubMed] [Google Scholar]
- Ghaben AL, and Scherer PE (2019). Adipogenesis and metabolic health. Nat. Rev. Mol. Cell Biol. 20, 242–258. [DOI] [PubMed] [Google Scholar]
- Giordani L, He GJ, Negroni E, Sakai H, Law JYC, Siu MM, Wan R, Corneau A, Tajbakhsh S, Cheung TH, and Le Grand F (2019). High-dimensional single-cell cartography reveals novel skeletal muscle-resident cell populations. Mol. Cell 74, 609–621.e6. [DOI] [PubMed] [Google Scholar]
- Giuliani G, Rosina M, and Reggio A (2021). Signaling pathways regulating the fate of fibro/adipogenic progenitors (FAPs) in skeletal muscle regeneration and disease. FEBS J. 10.1111/febs.16080. [DOI] [PubMed] [Google Scholar]
- Gonzalez-Gil AM, and Elizondo-Montemayor L (2020). The role of exercise in the interplay between myokines, hepatokines, osteokines, adipokines, and modulation of inflammation for energy substrate redistribution and fat mass loss: a review. Nutrients 12, 1899. 10.3390/nu12061899. [DOI] [PMC free article] [PubMed] [Google Scholar]
- Gu Z, Eils R, and Schlesner M (2016). Complex heatmaps reveal patterns and correlations in multidimensional genomic data. Bioinformatics 32, 2847–2849. [DOI] [PubMed] [Google Scholar]
- Gulati GS, Sikandar SS, Wesche DJ, Manjunath A, Bharadwaj A, Berger MJ, Ilagan F, Kuo AH, Hsieh RW, Cai S, et al. (2020). Single-cell transcriptional diversity is a hallmark of developmental potential. Science 367, 405–411. [DOI] [PMC free article] [PubMed] [Google Scholar]
- Gustavsen JA, Pai S, Isserlin R, Demchak B, and Pico AR (2019). RCy3: network biology using Cytoscape from within R. F1000Res. 8, 1774. [DOI] [PMC free article] [PubMed] [Google Scholar]
- Hafemeister C, and Satija R (2019). Normalization and variance stabilization of single-cell RNA-seq data using regularized negative binomial regression. Genome Biol. 20, 296. [DOI] [PMC free article] [PubMed] [Google Scholar]
- Hahsler M, Piekenbrock M, and Doran D (2019). dbscan: fast density-based clustering with R. J. Stat. Softw. 91, 1–30. [Google Scholar]
- Henriques F, Bedard AH, Guilherme A, Kelly M, Chi J, Zhang P, Lifshitz LM, Bellvé K, Rowland LA, Yenilmez B, et al. (2020). Single-Cell RNA profiling reveals adipocyte to macrophage signaling sufficient to enhance thermogenesis. Cell Rep. 32, 107998. 10.1016/j.celrep.2020.107998. [DOI] [PMC free article] [PubMed] [Google Scholar]
- Hepler C, Shan B, Zhang Q, Henry GH, Shao M, Vishvanath L, Ghaben AL, Mobley AB, Strand D, Hon GC, and Gupta RK (2018). Identification of functionally distinct fibro-inflammatory and adipogenic stromal subpopulations in visceral adipose tissue of adult mice. eLife 7, e39636. [DOI] [PMC free article] [PubMed] [Google Scholar]
- Ignatiadis N, Klaus B, Zaugg JB, and Huber W (2016). Data-driven hypothesis weighting increases detection power in genome-scale multiple testing. Nat. Methods 13, 577–580. [DOI] [PMC free article] [PubMed] [Google Scholar]
- Jia G, and Sowers JR (2019). Increased fibro-adipogenic progenitors and intramyocellular lipid accumulation in obesity-related skeletal muscle dysfunction. Diabetes 68, 18–20. [DOI] [PMC free article] [PubMed] [Google Scholar]
- Joe AWB, Yi L, Natarajan A, Le Grand F, So L, Wang J, Rudnicki MA, and Rossi FMV (2010). Muscle injury activates resident fibro/adipogenic progenitors that facilitate myogenesis. Nat. Cell Biol. 12, 153–163. [DOI] [PMC free article] [PubMed] [Google Scholar]
- Joffin N, Paschoal VA, Gliniak CM, Crewe C, Elnwasany A, Szweda LI, Zhang Q, Hepler C, Kusminski CM, Gordillo R, et al. (2021). Mitochondrial metabolism is a key regulator of the fibro-inflammatory and adipogenic stromal subpopulations in white adipose tissue. Cell Stem Cell 28, 702–717.e8. [DOI] [PMC free article] [PubMed] [Google Scholar]
- Kalucka J, de Rooij LPMH, Goveia J, Rohlenova K, Dumas SJ, Meta E, Conchinha NV, Taverna F, Teuwen L-A, Veys K, et al. (2020). Single-cell transcriptome atlas of murine endothelial cells. Cell 180, 764–779.e20. [DOI] [PubMed] [Google Scholar]
- Kim YI, Lee FN, Choi WS, Lee S, and Youn JH (2006). Insulin regulation of skeletal muscle PDK4 mRNA expression is impaired in acute insulin-resistant states. Diabetes 55, 2311–2317. [DOI] [PubMed] [Google Scholar]
- Kim B-S, Pallua N, Bernhagen J, and Bucala R (2015). The macrophage migration inhibitory factor protein superfamily in obesity and wound repair. Exp. Mol. Med. 47, e161. [DOI] [PMC free article] [PubMed] [Google Scholar]
- Kirwan JP, Sacks J, and Nieuwoudt S (2017). The essential role of exercise in the management of type 2 diabetes. Cleve. Clin. J. Med. 84, S15–S21. [DOI] [PMC free article] [PubMed] [Google Scholar]
- Kobak D, and Berens P (2019). The art of using t-SNE for single-cell transcriptomics. Nat. Commun. 10, 5416. [DOI] [PMC free article] [PubMed] [Google Scholar]
- Laakso M, Kuusisto J, Stančáková A, Kuulasmaa T, Pajukanta P, Lusis AJ, Collins FS, Mohlke KL, and Boehnke M (2017). The Metabolic Syndrome in Men study: a resource for studies of metabolic and cardiovascular diseases. J. Lipid Res. 58, 481–493. [DOI] [PMC free article] [PubMed] [Google Scholar]
- Lauritzen HPMM, Brandauer J, Schjerling P, Koh H-J, Treebak JT, Hirshman MF, Galbo H, and Goodyear LJ (2013). Contraction and AICAR stimulate IL-6 vesicle depletion from skeletal muscle fibers in vivo. Diabetes 62, 3081–3092. [DOI] [PMC free article] [PubMed] [Google Scholar]
- Leal LG, Lopes MA, and Batista ML Jr. (2018). Physical exercise-induced myokines and muscle-adipose tissue crosstalk: a review of current knowledge and the implications for health and metabolic diseases. Front. Physiol. 9, 1307. [DOI] [PMC free article] [PubMed] [Google Scholar]
- Lee B-C, Kim H-S, Shin T-H, Kang I, Lee JY, Kim J-J, Kang HK, Seo Y, Lee S, Yu K-R, et al. (2016). PGE2 maintains self-renewal of human adult stem cells via EP2-mediated autocrine signaling and its production is regulated by cell-to-cell contact. Sci. Rep. 6, 26298. 10.1038/srep26298. [DOI] [PMC free article] [PubMed] [Google Scholar]
- Li C, Liu B, Kang B, Liu Z, Liu Y, Chen C, Ren X, and Zhang Z (2020a). SciBet as a portable and fast single cell type identifier. Nat. Commun. 11, 1818. [DOI] [PMC free article] [PubMed] [Google Scholar]
- Li Y, Yun K, and Mu R (2020b). A review on the biology and properties of adipose tissue macrophages involved in adipose tissue physiological and pathophysiological processes. Lipids Health Dis. 19, 164. [DOI] [PMC free article] [PubMed] [Google Scholar]
- Love MI, Huber W, and Anders S (2014). Moderated estimation of fold change and dispersion for RNA-seq data with DESeq2. Genome Biol. 15, 550. [DOI] [PMC free article] [PubMed] [Google Scholar]
- Marcelin G, Ferreira A, Liu Y, Atlan M, Aron-Wisnewsky J, Pelloux V, Botbol Y, Ambrosini M, Fradet M, Rouault C, et al. (2017). A PDGFRα-mediated switch toward CD9high adipocyte progenitors controls obesity-induced adipose tissue fibrosis. Cell Metab. 25, 673–685. [DOI] [PubMed] [Google Scholar]
- Matsuo FS, Cavalcanti de Araújo PH, Mota RF, Carvalho AJR, Santos de Queiroz M, Baldo de Almeida B, Ferreira K.C.d.O.S., Metzner RJM, Ferrari GD, Alberici LC, and Osako MK (2020). RANKL induces beige adipocyte differentiation in preadipocytes. Am. J. Physiol. Endocrinol. Metab 318, E866–E877. [DOI] [PubMed] [Google Scholar]
- McGinnis CS, Murrow LM, and Gartner ZJ (2019). DoubletFinder: doublet detection in single-cell RNA sequencing data using artificial nearest neighbors. Cell Syst. 8, 329–337.e4. [DOI] [PMC free article] [PubMed] [Google Scholar]
- McInnes G, Tanigawa Y, DeBoever C, Lavertu A, Olivieri JE, Aguirre M, and Rivas MA (2019). Global Biobank Engine: enabling genotype-phenotype browsing for biobank summary statistics. Bioinformatics 35, 2495–2497. [DOI] [PMC free article] [PubMed] [Google Scholar]
- McQuin C, Goodman A, Chernyshev V, Kamentsky L, Cimini BA, Karhohs KW, Doan M, Ding L, Rafelski SM, Thirstrup D, et al. (2018). CellProfiler 3.0: next-generation image processing for biology. PLoS Biol. 16, e2005970. [DOI] [PMC free article] [PubMed] [Google Scholar]
- Merrick D, Sakers A, Irgebay Z, Okada C, Calvert C, Morley MP, Percec I, and Seale P (2019). Identification of a mesenchymal progenitor cell hierarchy in adipose tissue. Science 364, eaav2501. 10.1126/science.aav2501. [DOI] [PMC free article] [PubMed] [Google Scholar]
- Moon HY, Song P, Choi CS, Ryu SH, and Suh P-G (2013). Involvement of exercise-induced macrophage migration inhibitory factor in the prevention of fatty liver disease. J. Endocrinol. 218, 339–348. [DOI] [PMC free article] [PubMed] [Google Scholar]
- Newman AM, Liu CL, Green MR, Gentles AJ, Feng W, Xu Y, Hoang CD, Diehn M, and Alizadeh AA (2015). Robust enumeration of cell subsets from tissue expression profiles. Nat. Methods 12, 453–457. [DOI] [PMC free article] [PubMed] [Google Scholar]
- Newman AM, Steen CB, Liu CL, Gentles AJ, Chaudhuri AA, Scherer F, Khodadoust MS, Esfahani MS, Luca BA, Steiner D, et al. (2019). Determining cell type abundance and expression from bulk tissues with digital cytometry. Nat. Biotechnol. 37, 773–782. [DOI] [PMC free article] [PubMed] [Google Scholar]
- Nigro P, Middelbeek RJW, Alves CRR, Rovira-Llopis S, Ramachandran K, Rowland LA, Møller AB, Takahashi H, AlvesWagner AB, Vamvini M, et al. (2021). Exercise training promotes sex-specific adaptations in mouse inguinal white adipose tissue. Diabetes 70, 1250–1264. 10.2337/db20-0790. [DOI] [PMC free article] [PubMed] [Google Scholar]
- Omatsu Y, Seike M, Sugiyama T, Kume T, and Nagasawa T (2014). Foxc1 is a critical regulator of haematopoietic stem/progenitor cell niche formation. Nature 508, 536–540. [DOI] [PubMed] [Google Scholar]
- Ongen H, Buil A, Brown AA, Dermitzakis ET, and Delaneau O (2016). Fast and efficient QTL mapper for thousands of molecular phenotypes. Bioinformatics 32, 1479–1485. [DOI] [PMC free article] [PubMed] [Google Scholar]
- Oprescu SN, Yue F, Qiu J, Brito LF, and Kuang S (2020). Temporal dynamics and heterogeneity of cell populations during skeletal muscle regeneration. iScience 23, 100993. [DOI] [PMC free article] [PubMed] [Google Scholar]
- Patro R, Duggal G, Love MI, Irizarry RA, and Kingsford C (2017). Salmon provides fast and bias-aware quantification of transcript expression. Nat. Methods 14, 417–419. [DOI] [PMC free article] [PubMed] [Google Scholar]
- Qiu X, Mao Q, Tang Y, Wang L, Chawla R, Pliner HA, and Trapnell C (2017). Reversed graph embedding resolves complex single-cell trajectories. Nat. Methods 14, 979–982. [DOI] [PMC free article] [PubMed] [Google Scholar]
- Rajbhandari P, Arneson D, Hart SK, Ahn IS, Diamante G, Santos LC, Zaghari N, Feng A-C, Thomas BJ, Vergnes L, et al. (2019). Single cell analysis reveals immune cell–adipocyte crosstalk regulating the transcription of thermogenic adipocytes. eLife 8, e49501. [DOI] [PMC free article] [PubMed] [Google Scholar]
- Ramirez AK, Dankel SN, Rastegarpanah B, Cai W, Xue R, Crovella M, Tseng Y-H, Kahn CR, and Kasif S (2020). Single-cell transcriptional networks in differentiating preadipocytes suggest drivers associated with tissue heterogeneity. Nat. Commun. 11, 2117. [DOI] [PMC free article] [PubMed] [Google Scholar]
- Reggio A, Rosina M, Palma A, Cerquone Perpetuini A, Petrilli LL, Gargioli C, Fuoco C, Micarelli E, Giuliani G, Cerretani M, et al. (2020). Adipogenesis of skeletal muscle fibro/adipogenic progenitors is affected by the WNT5a/GSK3/β-catenin axis. Cell Death Differ. 27, 2921–2941. [DOI] [PMC free article] [PubMed] [Google Scholar]
- Robinson MD, McCarthy DJ, and Smyth GK (2010). edgeR: a Bioconductor package for differential expression analysis of digital gene expression data. Bioinformatics 26, 139–140. [DOI] [PMC free article] [PubMed] [Google Scholar]
- Rubenstein AB, Smith GR, Raue U, Begue G, Minchev K, RufZamojski F, Nair VD, Wang X, Zhou L, Zaslavsky E, et al. (2020). Single-cell transcriptional profiles in human skeletal muscle. Sci. Rep. 10, 229. [DOI] [PMC free article] [PubMed] [Google Scholar]
- Sakurai T, Ogasawara J, Kizaki T, Sato S, Ishibashi Y, Takahashi M, Kobayashi O, Oh-Ishi S, Nagasawa J, Takahashi K, et al. (2013). The effects of exercise training on obesity-induced dysregulated expression of adipokines in white adipose tissue. Int. J. Endocrinol. 2013, 801743. [DOI] [PMC free article] [PubMed] [Google Scholar]
- Sanford JA, Nogiec CD, Lindholm ME, Adkins JN, Amar D, Dasari S, Drugan JK, Fernández FM, Radom-Aizik S, Schenk S, et al. (2020). Molecular Transducers of Physical Activity Consortium (MoTrPAC): mapping the dynamic responses to exercise. Cell 181, 1464–1474. [DOI] [PMC free article] [PubMed] [Google Scholar]
- Sárvári AK, Van Hauwaert EL, Markussen LK, Gammelmark E, Marcher A-B, Ebbesen MF, Nielsen R, Brewer JR, Madsen JGS, and Mandrup S (2021). Plasticity of epididymal adipose tissue in response to diet-induced obesity at single-nucleus resolution. Cell Metab. 33, 437–453.e5. [DOI] [PubMed] [Google Scholar]
- Schwalie PC, Dong H, Zachara M, Russeil J, Alpern D, Akchiche N, Caprara C, Sun W, Schlaudraff K-U, Soldati G, et al. (2018). A stromal cell population that inhibits adipogenesis in mammalian fat depots. Nature 559, 103–108. [DOI] [PubMed] [Google Scholar]
- Shannon P, Markiel A, Ozier O, Baliga NS, Wang JT, Ramage D, Amin N, Schwikowski B, and Ideker T (2003). Cytoscape: a software environment for integrated models of biomolecular interaction networks. Genome Res. 13, 2498–2504. [DOI] [PMC free article] [PubMed] [Google Scholar]
- Shao M, Hepler C, Zhang Q, Shan B, Vishvanath L, Henry GH, Zhao S, An YA, Wu Y, Strand DW, and Gupta RK (2021). Pathologic HIF1α signaling drives adipose progenitor dysfunction in obesity. Cell Stem Cell 28, 685–701.e7. [DOI] [PMC free article] [PubMed] [Google Scholar]
- Sinnott-Armstrong N, Tanigawa Y, Amar D, Mars N, Benner C, Aguirre M, Venkataraman GR, Wainberg M, Ollila HM, Kiiskinen T, et al. (2021). Genetics of 35 blood and urine biomarkers in the UK Biobank. Nat. Genet. 53, 185–194. [DOI] [PMC free article] [PubMed] [Google Scholar]
- Soliman H, Paylor B, Scott RW, Lemos DR, Chang C, Arostegui M, Low M, Lee C, Fiore D, Braghetta P, et al. (2020). Pathogenic potential of Hic1-expressing cardiac stromal progenitors. Cell Stem Cell 26, 459–461. [DOI] [PubMed] [Google Scholar]
- Son SS, Hwang S, Park JH, Ko Y, Yun S-I, Lee J-H, Son B, Kim TR, Park H-O, and Lee EY (2021). In vivo silencing of amphiregulin by a novel effective self-assembled-micelle inhibitory RNA ameliorates renal fibrosis via inhibition of EGFR signals. Sci. Rep. 11, 2191. [DOI] [PMC free article] [PubMed] [Google Scholar]
- Soneson C, Love MI, and Robinson MD (2015). Differential analyses for RNA-seq: transcript-level estimates improve gene-level inferences. F1000Res. 4, 1521. [DOI] [PMC free article] [PubMed] [Google Scholar]
- Spallanzani RG, Zemmour D, Xiao T, Jayewickreme T, Li C, Bryce PJ, Benoist C, and Mathis D (2019). Distinct immunocyte-promoting and adipocyte-generating stromal components coordinate adipose tissue immune and metabolic tenors. Sci. Immunol. 4, eaaw3658. 10.1126/sciimmunol.aaw3658. [DOI] [PMC free article] [PubMed] [Google Scholar]
- Stanford KI, Middelbeek RJW, and Goodyear LJ (2015). Exercise effects on white adipose tissue: beiging and metabolic adaptations. Diabetes 64, 2361–2368. 10.2337/db15-0227. [DOI] [PMC free article] [PubMed] [Google Scholar]
- Stenkula KG, and Erlanson-Albertsson C (2018). Adipose cell size: importance in health and disease. Am. J. Physiol. Regul. Integr. Comp. Physiol. 315, R284–R295. [DOI] [PubMed] [Google Scholar]
- Stephens M (2017). False discovery rates: a new deal. Biostatistics 18, 275–294. [DOI] [PMC free article] [PubMed] [Google Scholar]
- Sudlow C, Gallacher J, Allen N, Beral V, Burton P, Danesh J, Downey P, Elliott P, Green J, Landray M, et al. (2015). UK biobank: an open access resource for identifying the causes of a wide range of complex diseases of middle and old age. PLoS Med. 12, e1001779. [DOI] [PMC free article] [PubMed] [Google Scholar]
- Sue N, Jack BHA, Eaton SA, Pearson RCM, Funnell APW, Turner J, Czolij R, Denyer G, Bao S, Molero-Navajas JC, et al. (2008). Targeted disruption of the basic Krüppel-like factor gene (Klf3) reveals a role in adipogenesis. Mol. Cell Biol. 28, 3967–3978. [DOI] [PMC free article] [PubMed] [Google Scholar]
- Suzuki C, Ushijima K, Ando H, Kitamura H, Horiguchi M, Akita T, Yamashita C, and Fujimura A (2019). Induction of Dbp by a histone deacetylase inhibitor is involved in amelioration of insulin sensitivity via adipocyte differentiation in ob/ob mice. Chronobiol. Int. 36, 955–968. [DOI] [PubMed] [Google Scholar]
- Tabula Muris Consortium; Overall coordination; Logistical coordination; Organ collection and processing; Library preparation and sequencing; Computational data analysis; Cell type annotation; Writing group; Supplemental text writing group, and Principal investigators (2018). Single-cell transcriptomics of 20 mouse organs creates a Tabula Muris. Nature 562, 367–372. [DOI] [PMC free article] [PubMed] [Google Scholar]
- Takahashi H, Alves CRR, Stanford KI, Middelbeek RJW, Nigro P, Ryan RE, Xue R, Sakaguchi M, Lynes MD, So K, et al. (2019). TGF-β2 is an exercise-induced adipokine that regulates glucose and fatty acid metabolism. Nat. Metab. 1, 291–303. 10.1038/s42255-018-0030-7. [DOI] [PMC free article] [PubMed] [Google Scholar]
- Tucci M, Quatraro C, Dammacco F, and Silvestris F (2007). Increased IL-18 production by dendritic cells in active inflammatory myopathies. Ann. N. Y. Acad. Sci. 1107, 184–192. 10.1196/annals.1381.020. [DOI] [PubMed] [Google Scholar]
- Ushijima K, Suzuki C, Kitamura H, Shimada K, Kawata H, Tanaka A, Horie H, Hosoya Y, Imai Y, Yamashita C, and Fujimura A (2020). Expression of clock gene Dbp in omental and mesenteric adipose tissue in patients with type 2 diabetes. BMJ Open Diabetes Res. Care 8, e001465. 10.1136/bmjdrc-2020-001465. [DOI] [PMC free article] [PubMed] [Google Scholar]
- Venkataraman GR, DeBoever C, Tanigawa Y, Aguirre M, Ioannidis AG, Mostafavi H, Spencer CCA, Poterba T, Bustamante CD, Daly MJ, et al. (2021). Bayesian model comparison for rare variant association studies. Am. J. Hum. Genet. 108, 2354–2367. [DOI] [PMC free article] [PubMed] [Google Scholar]
- Vijay J, Gauthier M-F, Biswell RL, Louiselle DA, Johnston JJ, Cheung WA, Belden B, Pramatarova A, Biertho L, Gibson M, et al. (2020). Single-cell analysis of human adipose tissue identifies depot- and disease-specific cell types. Nat. Metab. 2, 97–109. 10.1038/s42255-019-0152-6. [DOI] [PMC free article] [PubMed] [Google Scholar]
- Wang F, Flanagan J, Su N, Wang LC, Bui S, Nielson A, Wu X, Vo HT, Ma XJ, and Luo Y (2012). RNAscope: a novel in situ RNA analysis platform for formalin-fixed, paraffin-embedded tissues. J. Mol. Diagn. 14, 22–29. [DOI] [PMC free article] [PubMed] [Google Scholar]
- Wang Y, Kuang Z, Yu X, Ruhn KA, Kubo M, and Hooper LV (2017). The intestinal microbiota regulates body composition through NFIL3 and the circadian clock. Science 357, 912–916. [DOI] [PMC free article] [PubMed] [Google Scholar]
- Yoshitane H, Asano Y, Sagami A, Sakai S, Suzuki Y, Okamura H, Iwasaki W, Ozaki H, and Fukada Y (2019). Functional D-box sequences reset the circadian clock and drive mRNA rhythms. Commun. Biol. 2, 300. [DOI] [PMC free article] [PubMed] [Google Scholar]
- Young MD, and Behjati S (2020). SoupX removes ambient RNA contamination from droplet-based single-cell RNA sequencing data. GigaScience 9, giaa151. 10.1093/gigascience/giaa151. [DOI] [PMC free article] [PubMed] [Google Scholar]
- Zhou Y, Zhou B, Pache L, Chang M, Khodabakhshi AH, Tanaseichuk O, Benner C, and Chanda SK (2019). Metascape provides a biologist-oriented resource for the analysis of systems-level datasets. Nat. Commun. 10, 1523. [DOI] [PMC free article] [PubMed] [Google Scholar]
- Zvonic S, Ptitsyn AA, Conrad SA, Scott LK, Floyd ZE, Kilroy G, Wu X, Goh BC, Mynatt RL, and Gimble JM (2006). Characterization of peripheral circadian clocks in adipose tissues. Diabetes 55, 962–970. [DOI] [PubMed] [Google Scholar]
Associated Data
This section collects any data citations, data availability statements, or supplementary materials included in this article.
Supplementary Materials
Data Availability Statement
All raw and processed bulk mRNA-seq and scRNA-seq data have been uploaded in the GEO database (https://www.ncbi.nlm.nih.gov/gds) with the accession numbers GEO: GSE183239 and GSE183288 under SuperSeries GEO: GSE183290. We also provide an interactive data and analysis browser for all the data at http://scmetab.mit.edu/. Additional supplemental figures and tables were deposited in Zenodo: https://doi.org/10.5281/zenodo.7011615.
Original codes for data analysis were deposited on Github at https://github.com/KellisLab/scmetab.
All values used to generate the graphs of the paper can be found in the file Data S1 – Source Data. Any additional information required to reanalyze the data reported in this paper is available from the lead contact upon request.