

Abstract
Extracellular vesicles (EVs) are nanoscale lipid bilayer vesicles released by almost all cell types and can be found in biological fluids, such as blood and urine. EVs play an important role in various physiological and pathological processes via cell–cell communication, highlighting their potential applications as diagnostic markers for diseases and therapeutic drug delivery carriers. Although various methods have been developed for the isolation of EVs from biological fluids, most of them exhibit major limitations, including low purity, long processing times, and high cost. In this study, we developed a size-exclusion chromatography (SEC) column device using hydrophilic porous silica gel (PSG). Owing to the resistance to pressure of the device, a rapid system for EV isolation was developed by connecting it to a flash liquid chromatography system furnished with a UV detector and a fraction collector. This system can be used for the real-time monitoring of eluted EVs by UV absorption without further analysis and separation of high-purity EVs from urine samples with high durability, reusability, and reproducibility. In addition, there were no significant differences between the PSG column- and conventional SEC column-isolated EVs in the proteome profiles and cellular uptake activities, suggesting the good quality of the EVs isolated by the PSG column. These findings suggest that the PSG column device offers an effective and rapid method for the isolation of intact EVs from biological fluids.
Extracellular vesicles (EVs) are nanoscale lipid bilayer-enclosed structures released by almost all types of cells and tissues; they can be found in various biological fluids, such as blood, urine, milk, cerebrospinal fluid, and saliva, under both physiological and pathological conditions.1,2 EVs carry various biological molecules, such as proteins, mRNA, miRNA, and lipids, which reflect the conditions of the host cells and participate in a variety of biological processes through cell–cell communication.2−5 Recently, EVs in body fluids have emerged as promising sources of biomarkers for specific diseases and treatment outcomes.1,2,6,7 In addition, EVs can be potentially used as specific and stable drug delivery systems.7−10
As the clinical exploitation of EVs has increased, various strategies have been established to isolate EVs from biological fluids.2,11,12 Currently, the gold standard for the isolation of EVs is ultracentrifugation (UC),13 which is carried out in multiple steps at different centrifugation speeds.14,15 However, the UC-based isolation method is time-consuming, labor-intensive, and requires expensive equipment. In addition, UC occasionally produces EVs in lower yield and purity owing to contamination with co-precipitated protein aggregates.16
In addition to UC, several other methods, such as isolation through membrane affinity spin columns and precipitation using polymeric compounds, have been developed. Although these isolation methods are easy to use, processing multiple samples using these methods is expensive and results in low purity.12 Recently, using size-exclusion chromatography (SEC) for the isolation of EVs has attracted increasing interest.12,17,18 SEC has been used to separate EVs from various biological fluids, such as urine, plasma, seminal plasma, saliva, and milk.19−23 Several studies have demonstrated that SEC-based purification methods have more advantages than conventional methods such as UC and precipitation with chemicals. SEC exhibits a lower risk of EV aggregation and the formation of protein complexes than UC and precipitation methods.12 Because of this and the fact that phosphate-buffered saline (PBS) is commonly used as a mobile phase, SEC can yield EVs with better functionality and integrity.24,25 However, after fractionation by SEC, western blot analysis or enzyme-linked immunosorbent assay (ELISA) with antibodies against EV markers is needed to confirm the EV elution position, thereby consuming more processing time. Moreover, almost all commercially available SEC devices for EV isolation are fabricated using acrylamide or agarose gels, which are unsuitable for fast flow rate and repeated usage because of their low pressure-resistance and low rigidity. Therefore, it is difficult to adopt the conventional SEC devices to a liquid chromatography system for repeated continuous isolation.
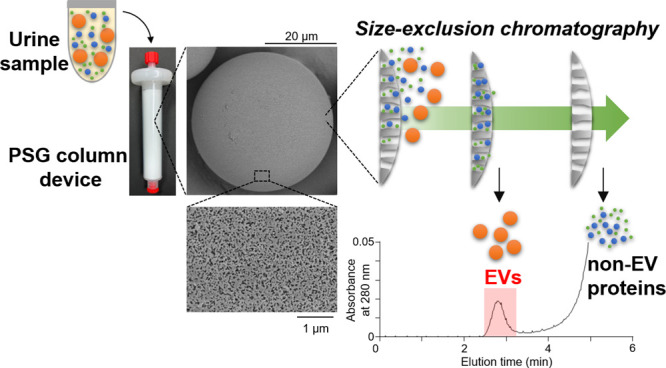
In this study, we prepared hydrophilic porous silica gel (PSG) and developed a PSG-based SEC column device for EV purification. Because PSG can withstand high pressures and flow rates, the PSG column can be connected to a flash liquid chromatography (FLC) system with a UV detector and a fraction collector for rapid purification of EVs from biological fluids. The yields and purities of the EVs isolated by the PSG column were compared with those of EVs purified using other methods. Moreover, the effectiveness of the PSG column was evaluated using proteomic and cellular uptake analyses.
Experimental Section
Synthesis of the Hydrophilic PSG Particles
Industrially produced porous silica particles were used as inorganic porous particles. The porous silica particles had an average particle diameter of 35.5 μm, average pore diameter of 72.7 nm, pore volume of 1.73 mL/g, and specific surface area of 94 m2/g. The average particle diameter of the particles was measured by laser light scattering using an LA-950 V2 instrument (HORIBA, Ltd., Kyoto, Japan). The average pore diameter, pore volume, and specific surface area were measured using the mercury intrusion technique with an Autopore IV9510 (Shimadzu Corporation, Kyoto, Japan). To 50 g of the porous silica particles, 400 mL of toluene, 35.2 mL of diisopropylethylamine, and 45.7 mL of coupling agent γ-glycidoxypropyltrimethoxysilane were added, and the mixture was refluxed at 100 °C for 4.5 h. After cooling, the mixture was filtered, washed with 1000 mL of toluene, 500 mL of tetrahydrofuran (THF), and 660 mL of methanol and dried at 70 °C overnight to obtain porous silica particles with an epoxy group-containing adhesive layer. Twenty-one grams of the coupling agent-treated porous silica particles were immersed in 84 mL of a hydrochloric acid solution for 1 day at room temperature. The particles were then filtered, washed with 630 mL of distilled water and 630 mL of methanol, and dried at 70 °C for 1 day to obtain porous silica particles with a diolated adhesive layer. To increase hydrophilicity, 10 g of the obtained diolated porous silica particles was mixed with 0.86 g of Denacol EX-521 (polyglycerol polyglycidyl ether; Nagase ChemteX Corporation, Osaka, Japan) in 17.4 mL of methanol for 30 min at room temperature; then, the mixture was dried at 70 °C for 1 day. This mixture was mixed with 40 mL of decane and 28.3 mg of tris(pentafluorophenyl) borane and stirred at 100 °C for 4 h. After cooling, the mixture was filtered, washed with 200 mL of toluene, 200 mL of methanol, 200 mL of the aqueous hydrochloric acid solution, and 200 mL of methanol, and dried at 70 °C for 1 day to obtain porous silica particles with a hydrophilic organic layer and an adherent layer on the surface. The obtained PSG was dry-packed into a column (inner diameter: 16 mm, length: 60 mm).
Scanning Electron Microscopy
PSG particles were immobilized on the sample holder by a carbon double-sided tape and coated with platinum using plasma chemical vapor deposition to prevent charging effects during imaging. Scanning electron microscopy (SEM) images of PSG were obtained using an S-4800 apparatus (Hitachi High-Tech Co., Ltd., Tokyo, Japan) operating at 2 kV.
Preparation of Rat Urine for EV Isolation
All urine samples were directly collected into 50 mL tubes over 24 h from Wistar rats and pooled after the addition of a protease inhibitor mixture (Nacalai Tesque, Kyoto, Japan). The pooled urine was centrifuged at 200 × g for 20 min at room temperature to remove debris and then stored at −80 °C. After thawing, pooled urine was centrifuged at 3000 × g for 20 min at 4 °C. The supernatant was further centrifuged at 17,000 × g for 20 min at 4 °C. The supernatant was saved, and the pellets were resuspended in PBS supplemented with 200 mg/mL dithiothreitol, followed by incubation at 37 °C for 10 min. During incubation, samples were mixed every 2 min and then centrifuged at 17,000 × g for 20 min at 4 °C. The two resulting supernatants were combined and concentrated by ultrafiltration (Amicon Ultra-15 filter, 100 kDa MWCO, Merck Millipore). The concentrated pooled urine sample was filtered through a 0.22 μm syringe filter (Merck Millipore) to remove debris before the isolation of EVs. All animal protocols were approved by the Animal Experiment Committee of the Graduate School of Bioagricultural Sciences, Nagoya University.
Isolation of Urinary EVs Using the PSG Column
To isolate EVs using the PSG column, a flash liquid chromatography (FLC) system (SYS16078; TOKYO RIKAKIKAI CO., LTD, Tokyo, Japan) was used. The concentrated pooled urine was separated into 40 fractions using FLC on the PSG column. The separation was performed in the isocratic mode with PBS as the mobile phase at a flow rate of 2 mL/min, with UV monitoring at 280 nm using the attached UV detector.
Tunable Resistive Pulse Sensing Analysis
The size and concentration of particles were measured using a qNano (IZON Science Ltd.) with nanopore NP150 (70–420 nm range). The stretch applied to the nanopores was 47 mm. The concentration of particles was standardized with 230 nm carboxylated polystyrene beads at a concentration of 9.2 × 10¹¹ particles/mL.
Immunoblot Analysis
The EV fractions (30 μL) or proteins (1 μg) were subjected to reducing sodium dodecyl sulfate-polyacrylamide gel electrophoresis (SDS-PAGE) (11% gel). Immunoblot analysis of EVs was performed as previously reported.26 Rabbit anti-CD9 monoclonal antibody (ab92726) and rabbit anti-Flotillin 1 polyclonal antibody (F1180) were purchased from Abcam (Cambridge, MA, USA) and Sigma (St Louis, MO, USA), respectively. Mouse anti-Alix (1A12) monoclonal antibody (sc-53540) and mouse anti-THP (B-2) monoclonal antibody (sc-271022) were purchased from Santa Cruz Biotechnology (Santa Cruz, CA, USA).
Statistical Analysis
All quantification experiments were repeated for at least three different preparations in one experiment. All data are expressed as mean ± S.D. Statistical significance was evaluated using unpaired Student’s t-test or, when appropriate, Tukey’s test.
Results and Discussion
Fabrication and Characterization of the PSG Device
To establish a rapid and automated strategy for EV isolation, we prepared a silica gel-based SEC resin. We first obtained industrially produced porous silica gels (PSG) with different particle diameters and pore sizes. Because EVs were not eluted from the silica gel column (Figure S1A), these PSG were coated with hydrophilic layers to reduce nonspecific binding to their surfaces and packed into columns. We evaluated the isolation performance of these columns. Among the gels we tested, the hydrophilic PSG with a particle size of ∼36 μm and pore size of ∼73 nm exhibited the best separation performance (Figure S1B, C) and was used for further study. The morphology of the prepared hydrophilic PSG was studied using SEM. Figure 1A, B shows the SEM images of PSG and its high-magnification micrograph, respectively. The images clearly indicate that the particles exhibit very high sphericity and porous surfaces, retaining the morphological features of the industrially produced porous silica particles (average sphere diameter: 35.5 ± 13.3 μm (CV = 0.38); average pore entrance diameter: 72.7 ± 46.2 nm (CV = 0.64); intruded volume: 1.73 ± 0.02 mL/g (CV = 0.01); specific surface area: 94 ± 3.5 m2/g (CV = 0.04)). Elemental analysis showed that the carbon content of the particle surface was 8.77 ± 0.32% (CV = 0.04). The column used in this study consisted of a hydrophilic PSG resin bed of approximately 10 mL volume within a plastic column with a diameter of 16 mm and a height of 60 mm. The column coupled with FLC with a UV detector and a fraction collector is shown in Figure 1C.
Figure 1.

Fabrication of the PSG column device. (A) SEM image of PSG. (B) SEM image at high magnification. (C) Images of the PSG column device (left) and FLC system for EV isolation (right).
Fractionation of Urine Using the PSG-Based Column
Pooled rat urine samples were used to investigate the separation efficacy of the PSG column. The urine sample was precleared by centrifugation and concentrated by ultrafiltration with a 100 kDa molecular weight cutoff. After the column was prewashed with methanol and equilibrated with PBS, the concentrated urine sample (0.5 mL) was eluted using the PSG column. The eluate was collected into tubes in 40 fractions (0.5 mL and 15 s each); the collection took 10 min to complete. The concentration of proteins and the number of EVs in each fraction were analyzed. Although almost all proteins were eluted in fractions 16–40, a major peak in the particle number was detected in fractions 11–12 (Figure 2A, upper panel). In addition, the EV marker CD9 was detected in fractions 11–12 by immunoblot analysis (Figure 2B). However, the Tamm-Horsfall protein (THP), which is the most abundant non-EV protein in urine, was detected in fractions 15–21 (Figure 2B). These findings suggest that the PSG column can efficiently separate EVs from urine samples. Notably, we demonstrated that the EV-containing fractions were consistent with the peak detected at 280 nm by UV absorption (Figure 2A, lower panel). This device could be used for the real-time monitoring of eluted EVs by UV absorption without further analysis, such as immunoblotting and ELISA, as opposed to other SEC-based columns (Figure 2C). Thus, the PSG device can be applied to the rapid isolation of EVs from biological fluids. We also confirmed that the EVs isolated by the PSG column were round or oval membranous vesicles, using transmission electron microscopy (TEM) with negative staining (Figure 2D).
Figure 2.

Characterization of the PSG-based SEC isolation of urinary EVs. (A) SEC isolation of urinary EVs using the PSG column device. In the upper panel, the protein concentration and particle number of each fraction are represented by the closed circle (left axis) and yellow bar graph (right axis), respectively. The lower panel shows the absorption at 280 nm. (B) Immunoblot analysis of the fractions using anti-CD9 and THP antibodies. (C) Automated isolation of EVs using UV absorption at 280 nm. Immunoblot analysis of the isolated EV fraction using the antibodies against CD9, Alix, Flotillin 1, and THP. An equal volume of eluent was subjected to immunoblotting. (D) Representative TEM image of EVs isolated by the PSG column. Scale bar in the image represents 100 nm.
Durability and Reusability of the PSG Column and the Reproducibility of Fractionation
To investigate the durability and reusability of the PSG column and the reproducibility of EV separation, concentrated rat urine was repeatedly (up to 30 times) eluted using the same column coupled with the FLC system. As shown in Figure 3A, similar UV chromatographic profiles were obtained for all EV fractions isolated using the PSG column. In addition, immunoblot analysis showed that CD9 was detected in the EV fraction across all trials (Figure 3B). These results indicate that the PSG column exhibits high durability, reusability, and reproducibility for isolating EVs from urine samples.
Figure 3.

Evaluation of the reproducibility of the PSG column during EV isolation. (A) Chromatographic peak at 280 nm. (B) Immunoblot analysis of each EV fraction obtained using the PSG device coupled with FLC.
Comparative Evaluation of Urine EVs Isolated Using Different Methods
Next, we evaluated the PSG column by comparing it with other isolation methods (Figure 4). EVs were isolated from pooled concentrated rat urine using four different methods, namely, ultracentrifugation (UC), polyethylene glycol (PEG)-based precipitation, polyacrylamide gel (PAG)-based SEC column (EVSecond), and the PSG column. The particle sizes and purities of the EVs isolated by each method were measured using tunable resistive pulse sensing analysis. The size distributions of all EV samples, regardless of the isolation method, were within the expected size range of 90–150 nm without significant differences (Figure 5A, B). The ratio of the number of particles and the protein content (particles/μg protein) is the purity index of EVs.27 The purity index of the EVs isolated by the PSG and PAG columns was significantly high; however, the EVs precipitated with PEG exhibited the lowest purity index (Figure 5C). Similar results were also observed in the immunoblot analysis of EV markers and THP (Figures 5D, E, and S2). These results suggest that the PSG- and PAG-based columns can isolate high-purity EVs. A possible reason for the low purity of the PEG method could be the precipitation of EVs with the contamination of aggregated proteins. However, the high purity of the SEC-based methods could be caused by the good separation between EVs and urinary proteins. In addition, we found that the EV recovery rate of the PSG column was 73.5 ± 14.3%, which was similar to that of the PAG column (77.5 ± 11.5%) (Figure S3).
Figure 4.

Schematic representation of the EV isolation methods and characterization of the EVs isolated in this study. EVs were isolated from concentrated pooled rat urine samples using four different methods: ultracentrifugation (UC), precipitation with PEG, PAG-based SEC column (EVSecond), and PSG column. EVs isolated using each method were characterized by immunoblot analysis and tunable resistive pulse sensing analysis. EVs isolated by PAG-based and PSG-based SECs were characterized by proteomic analysis and cellular uptake analysis.
Figure 5.

Comparative study of the EVs isolated by ultracentrifugation, PEG precipitation, the PAG column, and the PSG column. The EVs were isolated from the same volume of the concentrated pooled rat urine sample by UC, PEG precipitation, the PAG column, and the PSG column, and then subjected to tunable resistive pulse sensing analysis. The particle size distribution (A), modal size (B), and particle/protein ratio (C) of the isolated EV samples. (D, E) Immunoblot analysis of CD9, Alix, Flotillin 1, and THP in EVs isolated using each method. Densitometric analysis of three independent experiments (panel D) is shown in panel E. The data are presented as the mean ± SD; n = 3 in each group. Differences were analyzed using Tukey’s test. Different letters on the bars indicate significant differences (P < 0.05).
Proteomic Comparison of EVs Isolated by the SEC Columns
To evaluate the functionality and integrity of the PSG device-isolated urinary EVs, we characterized their proteomic profiles using a MS-based analysis. Proteomic analysis of each EV sample was triplicated. Combining the triplicates, 1113 proteins and 1118 proteins were identified from the EVs isolated by the PSG and PAG columns, respectively (Figure 6A, Table S1). Almost all proteins (993) were common to the EVs isolated from both the PSG and PAG columns. In addition, we performed a gene ontology (GO)-based enrichment analysis and found that the bulk of the proteins identified in the samples isolated by the PSG and PAG columns corresponded to extracellular vesicles (Figure 6B).
Figure 6.

Comparative study of the proteomic profiles of the samples isolated by the PSG and PAG columns. (A) Comparison of the number of identified proteins in rat urinary EVs isolated by the PSG and PAG columns. (B) Characterization of the proteome of rat urinary EVs using LC–MS/MS. GO term enrichment analysis of EV proteome at the cellular component level was performed using DAVID.
Functional Comparison of EVs Isolated by the SEC Columns
Finally, we investigated whether the PSG-based isolation method affects the biological properties of the EVs. Because uptake by recipient cells is essential for exhibiting the activity, we examined the cellular uptake of isolated EVs using the rat renal tubular epithelial cell line NRK-52E, which was labeled with CellTracker green CMFDA and incubated with 5 × 10⁸ particles/mL of PKH26-labeled EVs isolated using the PSG or PAG columns for 18 h. Confocal fluorescence microscopy revealed comparable uptake by the cells treated with the EV samples isolated using the PSG and the PAG columns (Figure 7A). Similar results were observed in the fluorescence intensity measurements (Figure 7B). These uptake experiments and the proteomic analysis (Figure 6) indicated that the EVs isolated using the PSG column are similar in purity and quality to those isolated using a commercial PAG-based SEC column. The PSG-based device might be more useful than the PAG column because of its shorter processing time and the possibility of automation. To further determine the efficacy of the PSG-based system as a tool for EV isolation, additional studies will have to be performed to determine whether the isolated EVs can be subjected to miRNA analysis, which is frequently performed in EV research.
Figure 7.

Cellular uptake of PKH26-labeled EVs isolated by the PSG and PAG columns. (A) Cellular uptake of EVs was visualized by confocal microscopy. Scale bars, 20 μm. (B) Relative fluorescence intensity. Data are presented as the mean ± SD; n = 3 in each group. Differences were analyzed using Tukey’s test. Different letters on the bars indicate significant differences (P < 0.05).
Conclusions
We demonstrated the ability of a novel hydrophilic PSG-based column device for the rapid isolation of EVs. Characterization and quantification of EVs showed that EVs were successfully separated from urine samples with optimal yields, functionality, and integrity. Thus, this device can be potentially used as a powerful tool for the rapid isolation of EVs from various biological fluids. The PSG device could be extended to other biological fluids to facilitate future research on the discovery of diagnostic biomarkers and to elucidate the physiological/pathological significance of EVs.
Acknowledgments
We thank Dr. Keiko Kuwata (Institute of Transformative Bio-Molecules (ITbM), Nagoya University), Ms. Mei Ito (Nagoya University), and Mr. Hikaru Morishita (AGC Inc.) for their kind experimental supports. This research was supported in part by the Center of Innovation Program at Nagoya University (Nagoya University-COI) from the Japan Science and Technology Agency (JST) and JSPS KAKENHI Grant Number 22H03531. This work is partially supported by Nagoya University Research Fund.
Supporting Information Available
The Supporting Information is available free of charge at https://pubs.acs.org/doi/10.1021/acs.analchem.2c01053.
Author Contributions
The manuscript was written with the contributions of all authors. All authors have given approval to the final version of the manuscript. Conceptualization: D.O., Y.B., and T.S.; original draft preparation: J.Y., and T.S.; device development: J.Y., D.O., K.T., A.H., Y.B., and T.S.; administrative, technical, and material support: M.A., and H.S.; and study supervision: D.O., K.U., Y.B., and T.S.
The authors declare no competing financial interest.
Supplementary Material
References
- Kalluri R.; LeBleu V. S. The biology, function, and biomedical applications of exosomes. Science 2020, 367, eaau6977 10.1126/science.aau6977. [DOI] [PMC free article] [PubMed] [Google Scholar]
- Boriachek K.; Islam M. N.; Möller A.; Salomon C.; Nguyen N.-T.; Hossain M. S. A.; Yamauchi Y.; Shiddiky M. J. A. Biological Functions and Current Advances in Isolation and Detection Strategies for Exosome Nanovesicles. Small 2018, 14, 201702153 10.1002/smll.201702153. [DOI] [PubMed] [Google Scholar]
- Théry C.; Zitvogel L.; Amigorena S. Exosomes: composition, biogenesis and function. Nat. Rev. Immunol. 2002, 2, 569–579. 10.1038/nri855. [DOI] [PubMed] [Google Scholar]
- Valadi H.; Ekström K.; Bossios A.; Sjöstrand M.; Lee J. J.; Lötvall J. O. Exosome-mediated transfer of mRNAs and microRNAs in a novel mechanism of genetic exchange between cells. Nat. Cell Biol. 2007, 9, 654–659. 10.1038/ncb1596. [DOI] [PubMed] [Google Scholar]
- Luga V.; Zhang L.; Viloria-Petit A. M.; Ogunjimi A. A.; Inanlou M. R.; Chiu E.; Buchanan M.; Hosein A. N.; Basik M.; Wrana J. L. Exosomes Mediate Stromal Mobilization of Autocrine Wnt-PCP Signaling in Breast Cancer Cell Migration. Cell 2012, 151, 1542–1556. 10.1016/j.cell.2012.11.024. [DOI] [PubMed] [Google Scholar]
- Musante L.; Tataruch D. E.; Holthofer H. Use and isolation of urinary exosomes as biomarker for diabetic nephropathy. Front. Endocrinol. 2014, 5, 149 10.3389/fendo.2014.00149. [DOI] [PMC free article] [PubMed] [Google Scholar]
- He C.; Zheng S.; Luo Y.; Wang B. Exosome Theranostics: Biology and Translational Medicine. Theranostics 2018, 8, 237–255. 10.7150/thno.21945. [DOI] [PMC free article] [PubMed] [Google Scholar]
- Sharma S.; Masud M. K.; Kaneti Y. V.; Rewatkar P.; Koradia A.; Hossain M. S. A.; Yamauchi Y.; Popat A.; Salomon C. Extracellular Vesicle Nanoarchitectonics for Novel Drug Delivery Applications. Small 2021, 17, e2102220 10.1002/smll.202102220. [DOI] [PubMed] [Google Scholar]
- Alvarez-Erviti L.; Seow Y.; Yin H.; Betts C.; Lakhal S.; Wood M. J. A. Delivery of siRNA to the mouse brain by systemic injection of targeted exosomes. Nat. Biotechnol. 2011, 29, 341–345. 10.1038/nbt.1807. [DOI] [PubMed] [Google Scholar]
- Andaloussi S. E. L.; Lakhal S.; Mäger I.; Wood M. J. A. Exosomes for targeted siRNA delivery across biological barriers. Adv. Drug Delivery Rev. 2013, 65, 391–397. 10.1016/j.addr.2012.08.008. [DOI] [PubMed] [Google Scholar]
- Gurunathan S.; Kang M.-H.; Jeyaraj M.; Qasim M.; Kim J.-H. Review of the Isolation, Characterization, Biological Function, and Multifarious Therapeutic Approaches of Exosomes. Cells 2019, 8, 307 10.3390/cells8040307. [DOI] [PMC free article] [PubMed] [Google Scholar]
- Monguió-Tortajada M.; Galvez-Montón C.; Bayes-Genis A.; Roura S.; Borràs F. E. Extracellular vesicles isolation methods: rising impact of size-exclusion chromatography. Cell. Mol. Life Sci. 2019, 76, 2369–2382. 10.1007/s00018-019-03071-y. [DOI] [PMC free article] [PubMed] [Google Scholar]
- Gardiner C.; Di Vizio D.; Sahoo S.; Théry C.; Witwer K. W.; Wauben M.; Hill A. F. Techniques used for the isolation and characterization of extracellular vesicles: results of a worldwide survey. J. Extracell. Vesicles 2016, 5, 32945 10.3402/jev.v5.32945. [DOI] [PMC free article] [PubMed] [Google Scholar]
- Théry C.; Amigorena S.; Raposo G.; Clayton A. Isolation and Characterization of Exosomes from Cell Culture Supernatants and Biological Fluids. Curr. Protoc. Cell Biol. 2006, 3.22. 10.1002/0471143030.cb0322s30. [DOI] [PubMed] [Google Scholar]
- Momen-Heravi F.; Balaj L.; Alian S.; Mantel P.-Y.; Halleck A. E.; Trachtenberg A. J.; Soria C. E.; Oquin S.; Bonebreak C. M.; Saracoglu E.; Skog J.; Kuo W. P. Current methods for the isolation of extracellular vesicles. Biol. Chem. 2013, 394, 1253–1262. 10.1515/hsz-2013-0141. [DOI] [PMC free article] [PubMed] [Google Scholar]
- Contreras-Naranjo J. C.; Wu H.-J.; Ugaz V. M. Microfluidics for exosome isolation and analysis: enabling liquid biopsy for personalized medicine. Lab Chip 2017, 17, 3558–3577. 10.1039/C7LC00592J. [DOI] [PMC free article] [PubMed] [Google Scholar]
- Böing A. N.; van der Pol E.; Grootemaat A. E.; Coumans F. A. W.; Sturk A.; Nieuwland R. Single-step isolation of extracellular vesicles by size-exclusion chromatography. J. Extracell. Vesicles 2014, 3, 23430 10.3402/jev.v3.23430. [DOI] [PMC free article] [PubMed] [Google Scholar]
- Welton J. L.; Webber J. P.; Botos L.-A.; Jones M.; Clayton A. Ready-made chromatography columns for extracellular vesicles isolation from plasma. J. Extracell. Vesicles 2015, 4, 27269 10.3402/jev.v4.27269. [DOI] [PMC free article] [PubMed] [Google Scholar]
- Lozano-Ramos S. I.; Bancu I.; Carreras-Planella L.; Monguió-Tortajada M.; Cañas L.; Juega J.; Bonet J.; Armengol M. P.; Lauzurica R.; Borràs F. E. Molecular profile of urine extracellular vesicles from normo-functional kidneys reveal minimal differences between living and deceased donors. BMC Nephrol. 2018, 19, 189 10.1186/s12882-018-0985-3. [DOI] [PMC free article] [PubMed] [Google Scholar]
- Karttunen J.; Heiskanen M.; Navarro-Ferrandis V.; Gupta S. D.; Lipponen A.; Puhakka N.; Rilla K.; Koistinen A.; Pitkänen A. Precipitation-based extracellular vesicles isolation from rat plasma co-precipitate vesicle-free microRNAs. J. Extracell. Vesicles 2018, 8, 1555410 10.1080/20013078.2018.1555410. [DOI] [PMC free article] [PubMed] [Google Scholar]
- Wu D.; Yan J.; Shen X.; Sun Y.; Thulin M.; Cai Y.; Wik L.; Shen Q.; Oelrich J.; Qian X.; Dubois K. L.; Ronquist K. G.; Nilsson M.; Landegren U.; Kamali-Moghaddam M. Profiling surface proteins on individual exosomes using a proximity barcoding assay. Nat. Commun. 2019, 10, 3854 10.1038/s41467-019-11486-1. [DOI] [PMC free article] [PubMed] [Google Scholar]
- Aqrawi L. A.; Galtung H. K.; Guerreiro E. M.; Øvstebø R.; Thiede B.; Utheim T. P.; Chen X.; Utheim Ø. A.; Palm Ø.; Skarstein K.; Jensen J. L. Proteomic and histopathological characterisation of sicca subjects and primary Sjögren’s syndrome patients reveals promising tear, saliva and extracellular vesicle disease biomarkers. Arthritis Res. Ther. 2019, 21, 181 10.1186/s13075-019-1961-4. [DOI] [PMC free article] [PubMed] [Google Scholar]
- Blans K.; Hansen M. S.; Sørensen L. V.; Hvam M. L.; Howard K. A.; Möller A.; Wiking L.; Larsen L. B.; Rasmussen J. T. Pellet-free isolation of human and bovine milk extracellular vesicles by size-exclusion chromatography. J. Extracell. Vesicles 2017, 6, 1294340 10.1080/20013078.2017.1294340. [DOI] [PMC free article] [PubMed] [Google Scholar]
- Mol E. A.; Goumans M.-J.; Doevendans P. A.; Sluijter J. P. G.; Vader P. Higher functionality of extracellular vesicles isolated using size-exclusion chromatography compared to ultracentrifugation. Nanomedicine 2017, 13, 2061–2065. 10.1016/j.nano.2017.03.011. [DOI] [PubMed] [Google Scholar]
- Shu S. L.; Yang Y.; Allen C. L.; Hurley E.; Tung K. H.; Minderman H.; Wu Y.; Ernstoff M. S. Purity and yield of melanoma exosomes are dependent on isolation method. J. Extracell. Vesicles 2019, 9, 1692401 10.1080/20013078.2019.1692401. [DOI] [PMC free article] [PubMed] [Google Scholar]
- Hasegawa K.; Kuwata K.; Yoshitake J.; Shimomura S.; Uchida K.; Shibata T. Extracellular vesicles derived from inflamed murine colorectal tissue induce fibroblast proliferation via epidermal growth factor receptor. FEBS J. 2021, 288, 1906–1917. 10.1111/febs.15557. [DOI] [PubMed] [Google Scholar]
- Webber J.; Clayton A. How pure are your vesicles?. J. Extracell. Vesicles 2013, 2, 19861 10.3402/jev.v2i0.19861. [DOI] [PMC free article] [PubMed] [Google Scholar]
Associated Data
This section collects any data citations, data availability statements, or supplementary materials included in this article.