

Abstract

The heterogeneous reaction between thin films of catechol exposed to O3(g) creates hydroxyl radicals (HO•) in situ, which in turn generate semiquinone radical intermediates in the path to form heavier polyhydroxylated biphenyl, terphenyl, and triphenylene products. Herein, the alteration of catechol aromatic surfaces and their chemical composition are studied during the heterogeneous oxidation of catechol films by O3(g) molar ratios ≥ 230 ppbv at variable relative humidity levels (0% ≤ RH ≤ 90%). Fourier transform infrared micro-spectroscopy, atomic force microscopy, electrospray ionization mass spectrometry, and reverse-phase liquid chromatography with UV–visible and mass spectrometry detection provide new physical insights into understanding the surface reaction. A Langmuir–Hinshelwood mechanism is accounted to report reaction rates, half-lives, and reactive uptake coefficients for the system under variable relative humidity levels. The reactions reported explain how the oligomerization of polyphenols proceeds at interfaces to contribute to the formation of brown organic carbon in atmospheric aerosols.
Introduction
From Industrial Applications to Environmental Significance of Catechol
Polyphenols possessing the 1,2-dihydroxy functional groups of catechol are important in both natural processes and industrial applications. The catechol functional group acts as a siderophore that facilitates iron(III) uptake by microorganisms,1 is attractive for biosensor2 and composite coating development,3 and serves as a monomer for aromatic polymerization4 (e.g., for the synthesis of biomimetic adhesives inspired in marine mussels).5 Catechol for synthetic purposes can be obtained from renewable lignocellulosic resources.6 From the environmental viewpoint, aromatics with the catechol functionality are widely found in wastewater from industrial applications7 and are emitted during pyrolysis and combustion8 and biomass burning9 to the atmosphere, where they can contribute reactive species for secondary organic aerosol (SOA) formation.10
SOA plays a crucial role in the earth’s climate by absorbing and scattering sunlight and acting as cloud condensation nuclei.11−13 However, the species in SOA are difficult to quantify because of the continuous oxidative processing occurring through unknown pathways during atmospheric transport, which yields the so-called humic-like substances (HULIS).14 Quantifying the products from catechol oxidation by ozone (O3), both in gas and particle phases, is an important matter.15 Moreover, the oxidation of catechol and substituted catechols at the air–water interface has been recently explored under microsecond contact times.10,16 Online electrospray ionization mass spectrometry (OESI-MS) is a surface-sensitive technique10,16−20 that has revealed a hydroxylation channel, resulting in the production of semiquinone radical intermediates in the path to the interfacial formation of polyhydroxylated aromatic rings and chromophoric quinones of tropospheric importance.10,16,19 The produced semiquinone radicals should also result in the formation of coupling aromatic products such as biphenyls during oxidation.21,22
In this study, atomic force microscopy (AFM) and Fourier transform infrared (FTIR) imaging micro-spectroscopy are used to characterize the drastic changes occurring on the surface of thin films of catechol upon heterogeneous ozonolysis at variable relative humidity (RH) levels. The work identifies the coupling products from the heterogeneous oxidation of catechol by electrospray ionization (ESI) mass spectrometry (MS) and separates them by reverse-phase ultrahigh-pressure liquid chromatography (UHPLC). Langmuir–Hinshelwood dependence on gas phase [O3(g)] and variable RH levels is presented for the first time. The work demonstrates the importance of heterogeneous chemistry during the processing of biomass burning and combustion emissions and provides a new fundamental understanding of how semiquinone radicals react at the gas–solid interface.
Results and Discussion
AFM Analysis
The changes in thin film thickness, morphology, and composition reported in Figure 1 during ozonolysis were studied by AFM and FTIR imaging. Thin films of catechol deposited on optical windows were analyzed by AFM and FTIR imaging after 72 h exposure at 70% RH to 1 atm N2(g) (Figure 1A for the control) or 230 ppbv O3(g) (Figure 1B for the experiment). The AFM amplitude micrographs displayed in panels A and B of Figure 1, obtained in the tapping mode, show the morphology changes between the control and oxidation experiment. The unreacted film in Figure 1A is characterized by the presence of well-defined ca. 0.5–3 nm long fiberlike lines in the vertical direction of a smooth crystalline surface, which also contains a few irregular bulge sites (diameter < 250 nm) whose general surface roughness remains around ∼150 nm.
Figure 1.

AFM micrographs of 150 μg catechol thin films at 70% RH exposed to (A) N2(g) and (B) 230 ppbv O3(g) for 72 h. (C) Micrograph of the film in panel (B) overlaid with its FTIR spectral map and (D) corresponding spectra of ozonolysis products labeled in panel C. The individual spectra labeled a–e in panel D correspond to the points marked in panel C.
After oxidation, remarkable changes are observed in the morphology of Figure 1B compared to the original surface. The new surface displays a decreased average surface roughness of ∼100 nm with many irregular mounds that are considerably shorter than the now-absent vertical lines described previously. During this modification of the film, chemical reactions have caused the incorporation of oxygen atoms into the decomposing catechol surface. The larger mounds on the top of the micrograph in Figure 1B with an upper limit to the surface roughness of 277 nm are thought to be the last part of the original film remaining on the surface, while the smaller ones at the bottom half of the image reflect that deep oxidation of the film surface has taken place. The more oxidized surface has lost the continuity of a regular catechol structure, with the generation of lighter carboxylic acids. The largely water-soluble carboxylic acids increase the fluidity of the material to a situation that causes mound aggregation during simultaneous oxidative oligomerization of catechol.
FTIR Microscopy Analysis
Figure 1C shows the image recorded with an FTIR microscope and the points labeled a–e, whose individual spectra are displayed in Figure 1D. Similar information to that reported by AFM was also registered in the IR spectral maps, with a loss of crystallinity upon increasing the RH compared to a dry film of catechol. Once humid O3(g) reacts with catechol, the described changes in the composition of the film are reflected by the development of an irregular and amorphous surface. The baseline drift of IR spectra registered in Figure 1D is due to the scattering of IR light on the sample surface and interior, which causes the absorbance baseline of points c–e to decrease to the left of the spectra due to the different roughness of the oxidized surface. The loss of catechol vibrations including O–H stretching (3450 cm–1), C–C stretching (1365 cm–1), and C–H bending (1095 cm–1) occurs during oxidation. The oxidized film in Figure 1C shows new prominent signals for C=O stretching at 1680 cm–1, C=C asymmetric stretching at 1585 cm–1, O–H stretching for carboxylic acid at 2500–3100 cm–1, and hydrogen-bonded O–H stretching at ∼3400 cm–1. This image contains the spectrum of a linear combination of polyhydroxylated aromatics and carboxylic acid products, among which cis,cis-muconic, maleic, oxalic, and glyoxylic acids signals are prominent and have been observed at the air–water10 and air–solid21 interfaces.
The composition of the film oxidized under 70% RH changes simultaneously as the surface of the crystalline reactant becomes amorphous, which should correspond to the formation of new organic products that include carboxylic acids. This crystalline to amorphous transition is also associated with the presence of more hydrophilic products present on the surface, which favors the uptake of water, an important catalyst for the production of carboxylic acids in the system under study. Therefore, the new and more polar surface could exhibit a larger diffusion of O3(g). The enhanced hydrophilicity of the surface is also related to the production of polyhydroxylated aromatic products, which have been observed at the air–water interface,10 as well as to the oligomerization reactions discussed below. After confirming that the same distribution of species was produced at 70% RH for higher [O3(g)] during shorter exposures, further experiments were performed to extract the pseudo-first-order rate constant of catechol loss.21 Overall, the accumulation of oxidized products during the progress of the reaction increases the hydrophilic character of the interface.
Identification of Coupling Products by ESI-MS and UHPLC
Figure 2 shows the ESI-MS analysis of isopropanol-extracted films of catechol before (blue trace) and after 3 h exposure to 24.0 ppmv O3(g) (red trace), both at 70% RH. Clustering of parent anions with isopropanol during infusion of all samples was discarded because the same ions were identified when extracting and reconstituting the samples in methanol. Before ozonolysis (peak labeled in blue font in Figure 2), only catechol is observed at m/z 109, while many new peaks of products are registered during the oxidation experiment (peaks labeled in red font).
Figure 2.

Electrospray ionization (ESI) mass spectrometry (MS) of catechol thin films before (peak labeled in blue font) and after (peaks labeled in red font) 3 h exposure to 24.0 ppmv O3(g) at 70% RH extracted in isopropanol.
The aliphatic products detected in Figure 2 have been explained10,21 to arise from pathways that result in crotonic acid (m/z 85) or an isomer (e.g., 4-hydroxycrotonaldehyde), 5-oxo-3-pentenoic acid (m/z 113), glutaconic acid (m/z 129), cis,cis-muconic acid (m/z 141), 2-hydroxyhexa-2,4-dienedioic acid and/or 3-hydroxyhexa-2,4-dienedioic acid (both m/z 157), and 2,4- or 3,4-dihydroxyhex-2-enedioic acid (m/z 175). These species originated by (1) electrophilic attack of O3(g) to catechol, (2) in situ Baeyer–Villiger (BV) oxidation by generated H2O2, (3) hydroxylation by HO• radicals from a thermodynamically favorable electron transfer mechanism, and (4) acid-catalyzed hydration of a conjugated diene to −COOH.10,21 It must be noted that the same peaks for products observed in Figure 2 at 70% RH were registered for films oxidized under 30 and 90% RH.
The following discussion focuses on the production of heavier hydroxylated biphenyl, terphenyl, and triphenylene molecules. Fast production of primary hydroxylation products 1,2,3- and 1,2,4-trihydroxybenzene has been shown to occur during ∼1 μs contact time at the air–water interface, followed by the generation of tetra- and pentahydroxybenzenes.10 This mechanism of indirect oxidation by in situ produced HO• proceeds through the generation of o-semiquinone radicals (reaction R1, Scheme 1).10 Therefore, radical coupling of semiquinone functionalities can explain here the production of polyphenols such as tetrahydroxy-biphenyl isomeric species with m/z 217 (Figure 2). This coupling product can be represented by [1,1′-biphenyl]-2,3,3′,4′-tetraol shown in reaction R2 of Scheme 1 or by the isomers with hydroxyls in position 2,2′,3,3′ or 3,3,4′,4′. The low intensity of this peak at m/z 217 suggests that biphenyls continue reacting to form heavier coupling products. The cross-links among two catechol rings should preferentially form C–C bonds over the alternative aryloxy products with C–O–C groups, as observed during the catalytic oxidation with biomimetic iron–porphyrin.23 Similarly, the peak at m/z 325 in the MS spectrum in Figure 2 corresponds to a terphenyl arising from the combination of the semiquinone radicals of biphenyls and catechol (Scheme 1). One isomer product included as an example in Scheme 1 is [1,1′:4′,1″-terphenyl]-2′,3,3′,3″,4,4″-hexaol, while other isomers such as those with hydroxyls in position 2,2′,2″,3,3′,3″ are not shown. In other words, catechol (FM = 110 Da) monomer couples to form dimers (FM = 218 Da) and trimers (FM = 326 Da), displaying a pattern with a consecutive loss of 2 Da per C–C bond formed between rings.24
Scheme 1. Generation of o-Semiquinone Radicals of Catechol and Its Coupling Products Identified at m/z 217 and 325.

Tracking of the contribution from o-semiquinone radicals to the formed products is color-coded in green font.
Reaction R4 in Scheme 2 displays the known generation 1,2,4-trihydroxybenzene during the oxidation of catechol in this system,21 while the isomer in position 1,2,3 is not displayed for keeping the scheme concise, both of which are precursors for the production of the species at m/z 249 in Figure 2. Such trihydroxybenzene also serves as the precursor for o-semiquinone radicals exemplified in reaction R5 in Scheme 2. Reaction R6 displays the formation of the species at m/z 249 (Figure 2) assigned to [1,1′-biphenyl]-2,2′,3,4′,5,5′-hexaol in Scheme 2, cogenerated with other hexahydroxy-biphenyl isomers from both trihydroxybenzenes (e.g., with hydroxyls in position 2,2′,3,3′,4,4′). Their production implies that the coupling of trihydroxybenzene o-semiquinone radicals takes place at the air–solid interface.
Scheme 2. Generation of Tri-, Tetra-, and Pentahydroxybenzenes, and Their o-Semiquinone Radicals to Form Coupling Products Identified at m/z 249, 297, 311, and 313.
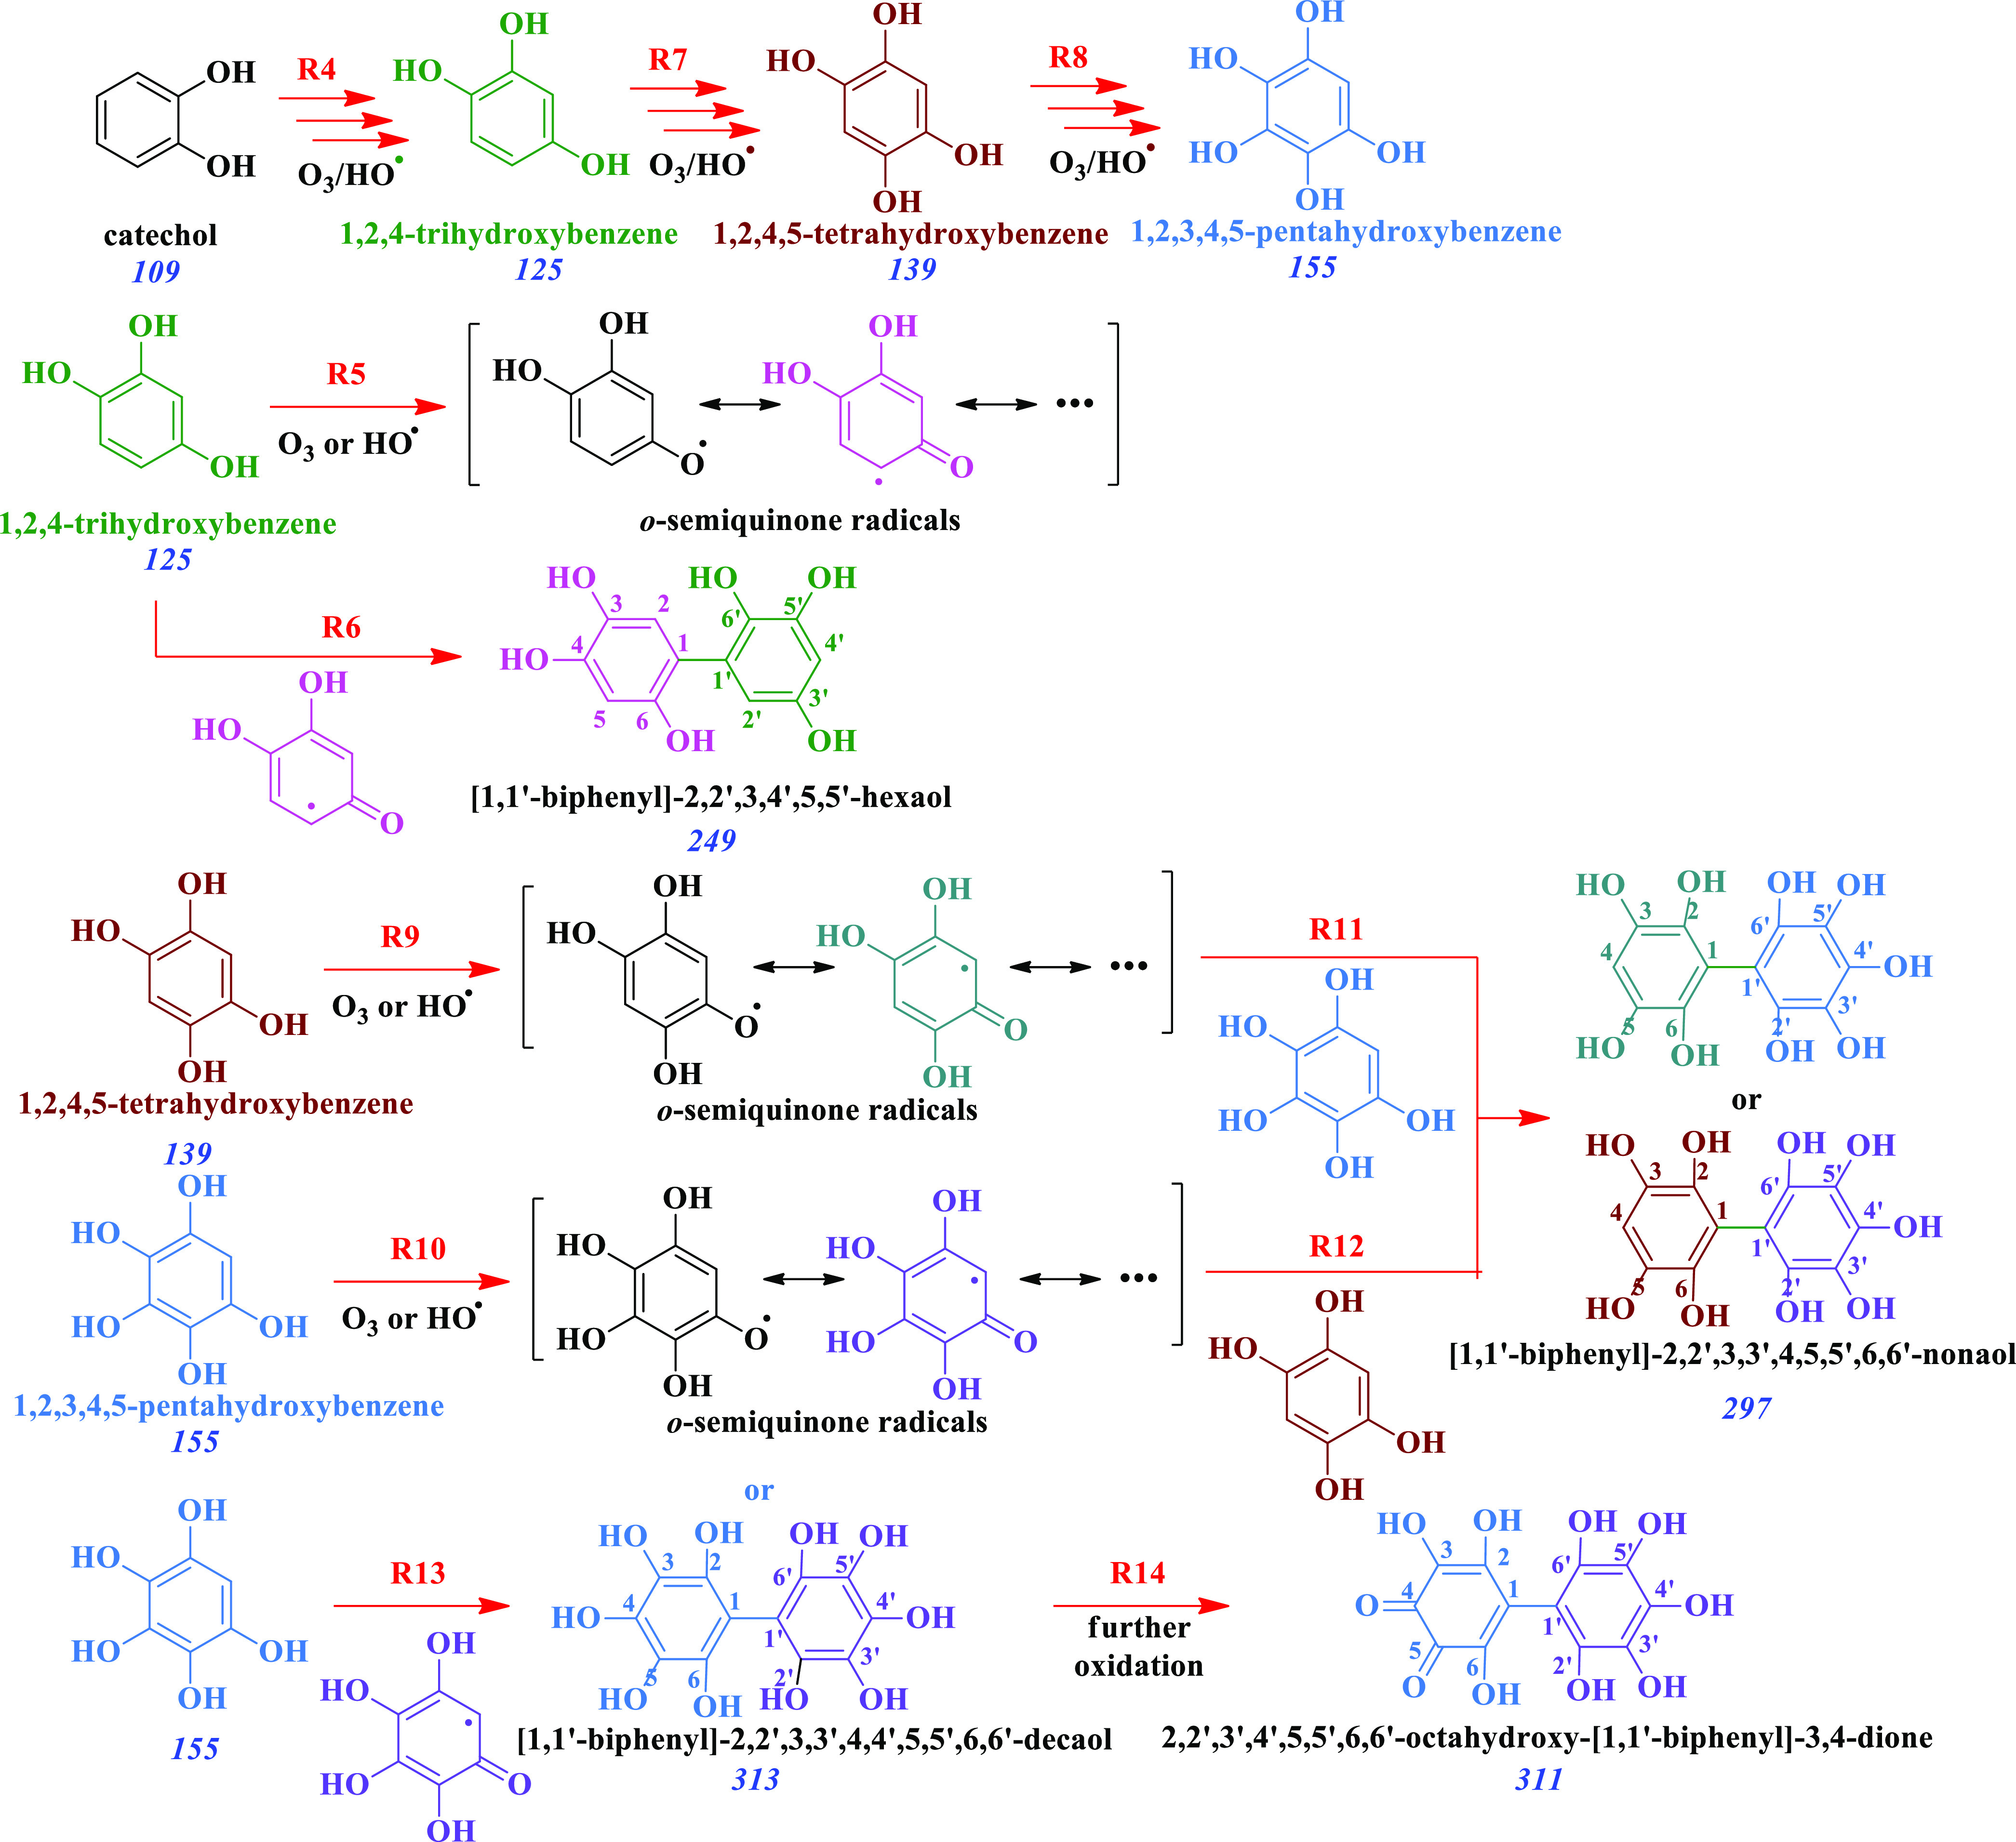
Tracking of the contribution from o-semiquinone radicals to the formed products is color-coded in green, brown, blue, pink, teal, and purple fonts, respectively.
Likewise to the production of trihydroxybenzene explained above, reactions R7 and R8 in Scheme 2 show the formation of tetra- and pentahydroxybenzenes, which are precursors of their respective o-semiquinone radicals in reactions R9 and R10, respectively. Reactions R11 and 12 in Scheme 2 represent the promiscuity of the produced poly(hydroxyphenols) and their o-semiquinone radicals to generate [1,1′-biphenyl]-2,2′,3,3′,4,5,5′,6,6′-nonaol as one example from the many possible nonahydroxylated biphenyl rings at m/z 297. The production of [1,1′-biphenyl]-2,2′,3,3′,4,4′,5,5′,6,6′-decaol is depicted in reaction R13 of Scheme 2 to represent one of the products at m/z 313, which is further oxidized in step R14 to produce 2,2′,3′,4′,5,5′,6,6′-octahydroxy-[1,1′-biphenyl]-3,4-dione at m/z 311. Finally, the production of triphenylenes, e.g., triphenylene-1,2,4,7,8,10,11-heptaol, at m/z 339 in Figure 2 implies the double linking of each catechol molecule to the other two (Scheme 3) to proceed through its o-semiquinone radical, as represented in reaction R15. For example, the previously formed tetrahydroxy-biphenyl dimer of reaction R3 (Scheme 1) undergoes double coupling with the o-semiquinone radical of a trihydroxybenzene from reaction R5 in Scheme 2.
Scheme 3. Generation of a Triphenylene Identified at m/z 339 from the o-Semiquinone Radical of a Trihydroxybenzene Double Coupling with a Catechol Dimer.

Tracking of the contribution from o-semiquinone radicals from Schemes 1 and 2 to the formed products is color-coded in green and pink fonts, respectively.
Additional evidence of the produced polyhydroxylated biphenyls, terphenyls, and triphenylenes is provided by UHPLC separation of the reconstituted extracted films followed by single-ion monitoring (SIM) analysis by ESI-MS of the species at m/z 249, 297, 311, 325, and 339 (Figure 3). The chromatogram in Figure 3A (Supporting Information) corresponds to the isopropanol extract of an unreacted catechol film (control) and only shows the presence of the reactant as its anion at m/z 109 with a retention time tr = 1.01 min. Instead, the chromatogram in Figure 3B for an extracted oxidized catechol film clearly separated the described polyhydroxylated biphenyls, terphenyls, and triphenylene products in Schemes 1–3 detected at m/z 249, 297, 311, 325, and 339. Single ion monitoring (SIM) at m/z 109 shows the peak for catechol elutes at tr = 1.01 min for the oxidized film, but its peak size has decreased considerably. Other SIM peaks for the oxidized film are displayed at m/z 249 for a biphenyl-hexaol at tr = 4.05 min, m/z 297 for two biphenyl-nonaols at tr = 10.37 and 11.01 min, m/z 311 for the octahydroxy-biphenyl-dione at tr = 11.49 min, m/z 325 for the terphenyl-hexaol at tr = 11.88 min, and m/z 339 for the triphenylene-heptaol at tr = 12.34 min. The presence of biphenyls, terphenyls, and triphenylenes in the oxidized film confirms that several o-semiquinone radicals are first produced to participate in their production.
Figure 3.

Ultrahigh-pressure liquid chromatogram (UHPLC) of the catechol film exposed during 3 h at 70% RH to (A) 1 atm N2(g) and (B) 21.1 ppmv O3(g). (Bottom of each panel) UV detection chromatogram at λ = 254 nm. (Top of each panel) Single ion monitoring (SIM) mass spectrometry (MS) for mass-to-charge ratios (m/z) of (red) 109, (blue) 249, (pink) 297, (green) 311, (dark yellow) 325, and (purple) 339.
Langmuir–Hinshelwood Mechanism
Examples of the representative FTIR spectra for the time series of catechol decay in the reaction with O3(g) at a 70% RH are presented in Figure S1 (Supporting Information). These spectra were used to monitor the pseudo-first-order rate constant from the catechol decay with O3(g) (kcat+O3) at 1365 cm–1 (Figure S2, Supporting Information). For the previous purpose, fitting the decay of catechol with time t using the equation [catechol] = [catechol]0 + a exp(−kcat+O3 × t) with pre-exponential factor a was completed as described before.21 Furthermore, experiments were performed under variable O3(g) molar ratios, from 230 ppbv to 840 ppmv O3(g), and not only at 70% RH (near the global average of 77% RH)25 but also at 0, 30, and 90% RH to obtain the kcat+O3 values with a Langmuir–Hinshelwood dependence on [O3(g)] presented in Figure 4. The molar ratios of O3(g) are included on the top x-axis for direct reference to [O3(g)] in the bottom. The nonlinear least-squares fittings displayed with dashed lines in Figure 4 agree well with a Langmuir–Hinshelwood surface reaction mechanism at each RH studied. This heterogeneous mechanism considers two processes: the equilibrium partitioning of O3(g) between the surface and the gas phase and the reaction of adsorbed O3 with catechol.
Figure 4.

Pseudo-first-order reaction rate constant (kcat+O3) for catechol films as a function of [O3(g)] for (blue square) 0%, (pink triangle) 30%, (black circle) 70%, and (teal star) 90% RH. The dashed lines show nonlinear least-squares fittings using eq 1 for the Langmuir–Hinshelwood mechanism with parameters reported in Table 1.
The Langmuir–Hinshelwood mechanism26 follows the quadratic hyperbola equation (eq 1)
| 1 |
where the constant KO3–1 represents the [O3(g)] needed to cover 50% of the surface sites with adsorbed ozone molecules at a given RH, meaning that KO3 is the equilibrium constant for O3(g) partitioning into the surface. The constant kcat+O3,max in eq 1 is the maximum pseudo-first-order rate constant observed as [O3(g)] → ∞ for that RH, which is the product of a second-order rate constant and the number of surface sites. Table 1 provides the values of kcat+O3,maxRH and KO3 for the nonlinear fittings with eq 1 of the data in Figure 4. For low [O3(g)], kcat+O3 is proportional to the product of surface concentrations of O3(g) and catechol. For high [O3(g)], only a limited number of surface sites remain available for O3(g) adsorption because the surface coverage of O3(g) approaches saturation. Thus, kcat+O3 in the plateau region of the curves in Figure 4 becomes independent of concentration for [O3(g)] ≥ 1.5 × 10¹⁶ molecules cm–3.
Table 1. Parameters of the Langmuir–Hinshelwood Mechanism in Figure 4 Fitted with Equation 1 and Half-Life (τ1/2) for 300 ppbv O3(g) and Reactive Uptake Coefficient (γO3RH) from Equation 3.
| RH (%) | kcat+O3,maxRH (s–1) | KO3(cm3 molecules–1) | r2 | τ1/2 (h) | γO3RH |
|---|---|---|---|---|---|
| 90 | 1.242 (±0.105) × 10–2 | 2.106 (±0.477) × 10–16 | 0.975 | 10.3 | 1.58 × 10⁻⁵ |
| 70 | 7.210 (±0.534) × 10–3 | 2.507 (±0.536) × 10–16 | 0.976 | 14.9 | 1.10 × 10⁻⁵ |
| 30 | 5.751 (±1.334) × 10–3 | 1.136 (±0.606) × 10–16 | 0.938 | 41.1 | 3.96 × 10⁻⁶ |
| 0 | 2.334 (±0.254) × 10–3 | 1.792 (±0.549) × 10–16 | 0.976 | 64.3 | 2.53 × 10⁻⁶ |
Averaging across all RH levels studied, the value of KO3 = 1.89 (±0.54) × 10–16 cm3 molecule–1 obtained for catechol is similar to that measured for sodium oleate, KO3 = 1.8 (±0.5) × 10–16 cm3 molecule–1, or fumaric acid, KO3 = 1.6 (±0.5) × 10–16 cm3 molecule–1, and only ∼1/2 of that for maleic acid, KO3 = 3.3 × 10⁻¹⁶ cm3 molecule–1.26 However, present measurements are up to ∼30 times lower than the values of KO3 ≈ (1–3) × 10–13 cm3 molecule–1 from anthracene over phenylsiloxane oil and benzo[a]pyrene on soot surfaces.27,28
Conclusions and Atmospheric Implications
Overall, the results in Figure 4 and Table 1 agree with a Langmuir–Hinshelwood mechanism, implying that interfacial reactions participate in the processing of combustion and biomass burning emissions at environmentally relevant RH values. Considering polluted plumes with 300 ppbv O3(g) in the troposphere, the half-life of catechol incorporating the Langmuir–Hinshelwood mechanism (τ1/2 = ln(2) × kcat+O3–1) under variable RH levels is included in Table 1 based on the calculation with eq 1. For example, for 70% RH, the pseudo-first-order rate constant is kcat+O3 = 1.294 × 10⁻⁵ s–1, from which τ1/2 = 14.9 h. Other factors that affect the heterogeneous oxidation rates such as the consumption of the oxidizer by the reactive products been formed, which modify the surface activity and the uptake and diffusion of gas-phase oxidants, could be considered in future studies.
Present results can be applied to calculate a reactive uptake coefficient of atmospheric particles at each RH, γO3RH, which accounts for a fraction of reactive collisions relative to the total rate of collisions obtained from the kinetic theory of gases. In our previous work, γO3 was calculated on the basis of eq 2(21)
| 2 |
based on kinetics measurements at a single 24.5 ppmv O3(g) level, which did not consider the quadratic hyperbolic curvature for the dependence of kcat+O3 on [O3(g)] displayed in Figure 4. In eq 2, R = 8.314 J K–1 mol–1 is the gas constant, νO3 = 394 m s–1 is the mean thermal velocity of O3(g) at 298 K, and PO3 (Pa) is the partial pressure of ozone. Thus, by substituting kcat+O3 from eq 1 into eq 2, the Langmuir–Hinshelwood mechanism can be incorporated into eq 3
| 3 |
In eq 3, kcat+O3,maxRH (s–1) and KO3 are the determined values in Table 1, NAv is the Avogadro number, and [O3(g)] is a variable quantity. The effective film thickness δeff = 8.4 × 10⁻⁸ m is estimated for a uniform surface coverage of catechol (8.20 × 10¹⁷ molecules) deposited over the IR-transparent crystal of area SA = 1.32 × 10⁻⁴ m2, and [catechol] = 1.217 × 10⁻² molecules cm–3 based on the catechol density of 1340 kg m–3 and formula mass of 110.1 × 10⁻³ kg mol–1. While γO3RH would vary largely within the range of [O3(g)] studied, by definition, these values should be constant for each RH. Therefore, γO3 values reported in Table 1 are verified to remain constant for the low molar ratio range from 1 to 1000 ppbv O3(g).
In summary, this work presents the kinetics and coupling products for the surface reaction of catechol for variable [O3(g)] at 0, 30, 70, and 90% RH. The interfacial production of semiquinone radicals facilitates the coupling of aromatic rings, forming polyhydroxylated biphenyls, terphenyls, and triphenylenes. Polyphenols are the intermediates that provide a bridge to convert aromatic species into water-soluble organic compounds capable of forming SOA in atmospheric waters. The provided reactive uptake coefficient for the surface reaction of gaseous ozone reacting with catechol can be used to model biomass burning and combustion emissions under variable humid conditions.
Experimental Methods
Experiment Preparation
In a typical experiment, 50 μL of freshly prepared 3.0 mg mL–1 catechol (Sigma-Aldrich, 99.9%) solution in isopropanol (Fisher Optima) was deposited by dropwise addition onto ZnSe windows with a diameter of 13.0 mm (PIKE). Stable thin films were formed after 3 h of solvent evaporation. For the ozonolysis of thin films, a customized ozone generation and monitoring system was used.10,18 Humid nitrogen was produced by flowing N2(g) through a Drechsel bottle filled with ultrapure water (18.2 MΩ cm). The mixing ratio of dry O3(g) and humid N2(g) was set with flowmeters. The RH of the mixed gas (1.0 L min–1) was registered with a remote hygrometer (Traceable) before flowing into a borosilicate glass flow-through reactor (3.785 L capacity) provided with a Teflon-coated lid. After equilibration of the system for 1 h, samples were introduced into the reactor. UV–visible absorption measurements (with less than 2.50% standard deviation) in a 10 cm pathlength fused silica cuvette (Starna Cell) provided [O3(g)] (σ250nm = 1.1 × 10⁻¹⁷ cm2 molecule–1 and σ300nm = 3.9 × 10⁻¹⁹ cm2 molecule–1).29
Atomic Force Microscopy (AFM) and FTIR Imaging
AFM amplitude micrographs were obtained in tapping mode using a Pico Plus AFM instrument (Molecular Imaging) with aluminum-coated silicon tips (BudgetSensors) and a spring constant of 40 N m–1. A sample area of 3 μm by 3 μm was scanned at a rate of 1 Hz while collecting data in topographic, phase, and amplitude modes. Morphological changes are captured in micrographs using PicoView software (Agilent) and postprocessed using Gwyddion.30
FTIR imaging was performed with a Nicolet iN10 infrared microscope (Thermo Scientific) after mounting the optical windows on a motorized stage for scanning the infrared map in an XY pattern. OMNIC Picta software (Thermo Scientific) was utilized for FTIR microscopy and spectral mapping. Individual spectra corresponding to an average of 64 scans were collected over the range of 800–4000 cm–1 with 4 cm–1 resolution. All samples were background-subtracted using an empty optical window. Control experiments ensured that films exposed to humid air in the absence of O3(g) correspond to the spectral features of catechol despite any loss by sublimation, which was carefully monitored to remain below 5%. Data processing to obtain the CD line (or corrected peak heights after local baseline correction) was performed10 to collect kinetic data from the average of duplicate experiments with error bars corresponding to one standard deviation.
ESI-MS and Chromatographic Analyses
For offline analysis of the control and oxidized films, each optical window was placed in a 10 mL glass beaker for extraction with 2.0 mL of isopropanol (Fisher Optima) under sonication for 15 min. After sonication and quantitative transfer of the samples to 7.5 mL amber vials, samples were gently sparged with N2(g) to dryness and reconstituted with 1.0 mL of isopropanol for analysis by electrospray ionization (ESI) mass spectrometry (MS). Control experiments were also performed on dry and moistened films in the absence of O3(g). Reconstituted film extracts diluted two times in water were analyzed by MS in the negative ion mode using an MSQ Plus instrument (Thermo Scientific) at a flow rate of 100 μL min–1. Conditions for analysis were a drying gas temperature of 250 °C, nebulizer voltage of −1.9 kV, cone voltage of −50 V, and nebulizer pressure of 70 psi. Reported ion counts were background-subtracted from the solvent and acquired over fixed intervals (≥30 s).
The isopropanol-extracted samples were analyzed with an Accela (Thermo Fisher Scientific) ultrahigh-pressure liquid chromatograph (UHPLC) equipped with a 1250 quaternary delivery pump, a photodiode array detector (PDA) with a 5 cm LightPipe flow cell, and a mass spectrometry (MS) detector (Thermo MSQ Plus). A 25 μL injection was separated on a reversed-phase chromatographic column (Hypersil gold C18, 50 × 2.1 mm2, 1.9 μm particle size, Thermo Scientific). Xcalibur software was used to control the UHPLC-PDA-MS system. Chromatographic separation at a constant flow rate of 800 μL min–1 from 0 to 2 min was isocratic with 98% (A) 0.10 mM formic acid (Fisher Optima, LC–MS grade) in ultrapure water (18.2 MΩ cm Purelab Flex, Veolia) and 2% (B) 0.10 mM formic acid in acetonitrile. Gradient elution started at 2 min and reached an 85:15 ratio of solvents A/B at 7 min. From 7 to 12 min, the A/B ratio reached a 50:50 composition and remained isocratic from 12 to 15 min. After the PDA registered the absorbance at λ = 254 nm, the flow was interfaced with an electrospray ionization (ESI) probe (1.9 kV needle voltage, 350 °C probe temperature, and 70 psi N2 nebulizing gas) to the MS detector set to detect negative ions in the range of m/z 50–800 amu.
Acknowledgments
Support from the U.S. National Science Foundation under Award 1903744 to M.I.G. is gratefully acknowledged.
Supporting Information Available
The Supporting Information is available free of charge at https://pubs.acs.org/doi/10.1021/acsomega.2c05290.
Infrared spectra time series of catechol thin films exposed to O3(g) and first-order decay of catechol in Figure S1 (PDF)
The authors declare no competing financial interest.
Supplementary Material
References
- Avdeef A.; Sofen S. R.; Bregante T. L.; Raymond K. N. Coordination chemistry of microbial iron transport compounds. 9. Stability constants for catechol models of enterobactin. J. Am. Chem. Soc. 1978, 100, 5362. 10.1021/ja00485a018. [DOI] [Google Scholar]
- Song W.; Li D.-W.; Li Y.-T.; Li Y.; Long Y.-T. Disposable biosensor based on graphene oxide conjugated with tyrosinase assembled gold nanoparticles. Biosens. Bioelectron. 2011, 26, 3181. 10.1016/j.bios.2010.12.022. [DOI] [PubMed] [Google Scholar]
- Wang C. X.; Braendle A.; Menyo M. S.; Pester C. W.; Perl E. E.; Arias I.; Hawker C. J.; Klinger D. Catechol-based layer-by-layer assembly of composite coatings: a versatile platform to hierarchical nano-materials. Soft Matter 2015, 11, 6173. 10.1039/C5SM01374G. [DOI] [PubMed] [Google Scholar]
- Sever M. J.; Weisser J. T.; Monahan J.; Srinivasan S.; Wilker J. J. Metal-mediated cross-linking in the generation of a marine-mussel adhesive. Angew. Chem., Int. Ed. 2004, 43, 448. 10.1002/anie.200352759. [DOI] [PubMed] [Google Scholar]
- Ye Q.; Zhou F.; Liu W. Bioinspired catecholic chemistry for surface modification. Chem. Soc. Rev. 2011, 40, 4244. 10.1039/C1CS15026J. [DOI] [PubMed] [Google Scholar]
- Kim K. H.; Jeong K.; Zhuang J.; Jeong H. J.; Kim C. S.; Koo B.; Yoo C. G. Tandem conversion of lignin to catechols via demethylation and catalytic hydrogenolysis. Ind. Crop Prod. 2021, 159, 113095 10.1016/j.indcrop.2020.113095. [DOI] [Google Scholar]
- Manahan S. E.Environmental Chemistry; CRC Press, 2009. [Google Scholar]
- Adounkpe J.; Aina M.; Mama D.; Sinsin B.. Gas Chromatography Mass Spectrometry Identification of Labile Radicals Formed during Pyrolysis of Catechool, Hydroquinone, and Phenol through Neutral Pyrolysis Product Mass Analysis; ISRN Environmental Chemistry, 2013; p 8.
- Veres P.; Roberts J. M.; Burling I. R.; Warneke C.; de Gouw J.; Yokelson R. J. Measurements of gas-phase inorganic and organic acids from biomass fires by negative-ion proton-transfer chemical-ionization mass spectrometry. J. Geophys. Res.: Atmos. 2010, 115, D23302. 10.1029/2010JD014033. [DOI] [Google Scholar]
- Pillar-Little E. A.; Camm R. C.; Guzman M. I. Catechol oxidation by ozone and hydroxyl radicals at the air–water interface. Environ. Sci. Technol. 2014, 48, 14352. 10.1021/es504094x. [DOI] [PubMed] [Google Scholar]
- Boucher O.; Randall D.; Artaxo P.; Bretherton C.; Feingold G.; Forster P.; Kerminen V.-M.; Kondo Y.; Liao H.; Lohmann U.. et al. In Clouds and Aerosols, Climate Change 2013: The Physical Science Basis. Contribution of Working Group I to the Fifth Assessment Report of the Intergovernmental Panel on Climate Change; Stocker T. F.; Qin D.; Plattner G.-K.; Tignor M.; Allen S. K.; Boschung J.; Nauels A.; Xia Y.; Bex V.; Midgley P. M., Eds.; Cambridge University Press, 2013.
- Hallquist M.; Wenger J. C.; Baltensperger U.; Rudich Y.; Simpson D.; Claeys M.; Dommen J.; Donahue N. M.; George C.; Goldstein A. H.; et al. The formation, properties and impact of secondary organic aerosol: current and emerging issues. Atmos. Chem. Phys. 2009, 9, 5155. 10.5194/acp-9-5155-2009. [DOI] [Google Scholar]
- Finlayson-Pitts B. J. Reactions at surfaces in the atmosphere: integration of experiments and theory as necessary (but not necessarily sufficient) for predicting the physical chemistry of aerosols. Phys. Chem. Chem. Phys. 2009, 11, 7760. 10.1039/B906540G. [DOI] [PubMed] [Google Scholar]
- Rudich Y.; Donahue N. M.; Mentel T. F. Aging of Organic Aerosol: Bridging the Gap Between Laboratory and Field Studies. Annu. Rev. Phys. Chem. 2007, 58, 321. 10.1146/annurev.physchem.58.032806.104432. [DOI] [PubMed] [Google Scholar]
- Zein A. E.; Coeur C.; Obeid E.; Lauraguais A.; Fagniez T. Reaction Kinetics of Catechol (1,2-Benzenediol) and Guaiacol (2-Methoxyphenol) with Ozone. J. Phys. Chem. A 2015, 119, 6759. 10.1021/acs.jpca.5b00174. [DOI] [PubMed] [Google Scholar]
- Pillar-Little E. A.; Guzman M. I. Oxidation of substituted catechols at the air–water interface: Production of carboxylic acids, quinones, and polyphenols. Environ. Sci. Technol. 2017, 51, 4951–4959. 10.1021/acs.est.7b00232. [DOI] [PubMed] [Google Scholar]
- Guzman M. I.; Athalye R. R.; Rodriguez J. M. Concentration effects and ion properties controlling the fractionation of halides during aerosol formation. J. Phys. Chem. A 2012, 116, 5428. 10.1021/jp3011316. [DOI] [PubMed] [Google Scholar]
- Pillar-Little E. A.; Guzman M. I.; Rodriguez J. M. Conversion of iodide to hypoiodous acid and iodine in aqueous microdroplets exposed to ozone. Environ. Sci. Technol. 2013, 47, 10971. 10.1021/es401700h. [DOI] [PubMed] [Google Scholar]
- Pillar-Little E. A.; Guzman M. I. An overview of dynamic heterogeneous oxidations in the troposphere. Environments 2018, 5, 104. 10.3390/environments5090104. [DOI] [Google Scholar]
- Rana M. S.; Guzman M. I. Oxidation of phenolic aldehydes by ozone and hydroxyl radicals at the air–water interface. J. Phys. Chem. A 2020, 124, 8822–8833. 10.1021/acs.jpca.0c05944. [DOI] [PubMed] [Google Scholar]
- Pillar-Little E. A.; Zhou R.; Guzman M. I. Heterogeneous oxidation of catechol. J. Phys. Chem. A 2015, 119, 10349–10359. 10.1021/acs.jpca.5b07914. [DOI] [PubMed] [Google Scholar]
- Rana M. S.; Guzman M. I. Surface Oxidation of Phenolic Aldehydes: Fragmentation, Functionalization, and Coupling Reactions. J. Phys. Chem. A 2022, 126, 6502–6516. 10.1021/acs.jpca.2c04963. [DOI] [PMC free article] [PubMed] [Google Scholar]
- Šmejkalová D.; Conte P.; Piccolo A. Structural characterization of isomeric dimers from the oxidative oligomerization of catechol with a biomimetic catalyst. Biomacromolecules 2007, 8, 737. 10.1021/bm060598o. [DOI] [PubMed] [Google Scholar]
- Yang J.; Cohen Stuart M. A.; Kamperman M. Jack of all trades: versatile catechol crosslinking mechanisms. Chem. Soc. Rev. 2014, 43, 8271. 10.1039/C4CS00185K. [DOI] [PubMed] [Google Scholar]
- Hartmann D. L.Global Physical Climatology; Academic Press, 1994. [Google Scholar]
- Nájera J. J.; Percival C. J.; Horn A. B. Infrared spectroscopic studies of the heterogeneous reaction of ozone with dry maleic and fumaric acid aerosol particles. Phys. Chem. Chem. Phys. 2009, 11, 9093. 10.1039/B909623J. [DOI] [PubMed] [Google Scholar]
- Kwamena N. O. A.; Staikova M. G.; Donaldson D. J.; George I. J.; Abbatt J. P. D. Role of the aerosol substrate in the heterogeneous ozonation reactions of surface-bound PAHs. J. Phys. Chem. A 2007, 111, 11050. 10.1021/jp075300i. [DOI] [PubMed] [Google Scholar]
- Pöschl U.; Letzel T.; Schauer C.; Niessner R. Interaction of ozone and water vapor with spark discharge soot aerosol particles coated with benzo[a]pyrene: O3 and H2O adsorption, benzo[a]pyrene degradation, and atmospheric implications. J. Phys. Chem. A 2001, 105, 4029. 10.1021/jp004137n. [DOI] [Google Scholar]
- Sander S. P.; Abbatt J.; Barker J. R.; Burkholder J. B.; Friedl R. R.; Golden D. M.; Huie R. E.; Kolb C. E.; Kurylo M. J.; Moortgat G. K.. et al. Chemical Kinetics and Photochemical Data for Use in Atmospheric Studies: Evaluation Number 17; Jet Propulsion Laboratory, California Institute of Technology: Pasadena, CA, 2011.
- Nečas D.; Klapetek P. Gwyddion: an open-source software for SPM data analysis. Open Phys. 2012, 10, 181. 10.2478/s11534-011-0096-2. [DOI] [Google Scholar]
Associated Data
This section collects any data citations, data availability statements, or supplementary materials included in this article.