

Abstract
Heterozygous variants in bromodomain and plant homeodomain containing transcription factor (BPTF) cause the neurodevelopmental disorder with dysmorphic facies and distal limb anomalies (NEDDFL) syndrome (MIM#617755) characterized by intellectual disability, speech delay and postnatal microcephaly. BPTF functions within nucleosome and remodeling factor (NURF), a complex comprising sucrose non-fermenting like (SNF2L), an Imitation SWItching (ISWI) chromatin remodeling protein encoded by the SWI/SNF related, matrix associated, actin dependent regulator of chromatin, subfamily a, member 1 (SMARCA1) gene. Surprisingly, ablation of Smarca1 resulted in mice with enlarged brains, a direct contrast to the phenotype of NEDDFL patients. To model the NEDDFL syndrome, we generated forebrain-specific Bptf knockout (Bptf conditional Knockout (cKO)) mice. The Bptf cKO mice were born in normal Mendelian ratios, survived to adulthood but were smaller in size with severe cortical hypoplasia. Prolonged progenitor cell cycle length and a high incidence of cell death reduced the neuronal output. Cortical lamination was also disrupted with reduced proportions of deep layer neurons, and neuronal maturation defects that impaired the acquisition of distinct cell fates (e.g. COUP-TF-interacting protein 2 (Ctip2)+ neurons). RNAseq and pathway analysis identified altered expression of fate-determining transcription factors and the biological pathways involved in neural development, apoptotic signaling and amino acid biosynthesis. Dysregulated genes were enriched for MYC Proto-Oncogene, BHLH Transcription Factor (Myc)-binding sites, a known BPTF transcriptional cofactor. We propose the Bptf cKO mouse as a valuable model for further study of the NEDDFL syndrome.
Introduction
An increasing number of neurodevelopmental disorders (NDDs) are caused by pathogenic variants in genes that regulate chromatin structure and function. These include a large gene family encoding the components of adenosine triphosphate (ATP)-dependent chromatin remodeling complexes that mediate nucleosome positioning (1). There are four main classes of ATP-dependent chromatin remodeling proteins: the SWItching/Sucrose Non-Fermenting (SWI/SNF), Imitation SWItching (ISWI), chromodomain helicase DNA binding (CHD) and inositol requiring 80-like (INO80) families. Each remodeler functions as the catalytic subunit within a multiprotein complex utilizing ATP hydrolysis to remodel the nucleosomes whereas specificity is determined by additional chromatin-binding modules, additional complex subunits and their interaction partners (2). The best characterized remodeling complex is the BRG1/BRM-associated factor (BAF) complex that comprises 12–15 different subunits, including the SWI/SNF protein BRG1 SWI/SNF related, matrix associated, actin dependent regulator of chromatin, subfamily a, member 4 (SMARCA4) or brahma (BRM) SWI/SNF related, matrix associated, actin dependent regulator of chromatin, subfamily a, member 2 (SMARCA2) as the catalytic subunit (3). Pathogenic variants in SMARCA4 and SMARCA2 are the cause of Coffin–Siris and Nicolaides–Baraitser syndromes respectively, although most other BAF subunits have been implicated in NDDs yielding a spectrum of phenotypes related to these two syndromes (4–6).
The ISWI family comprises the closely related SWI/SNF related, matrix associated, actin dependent regulator of chromatin, subfamily a, member 1 (SMARCA1) and SWI/SNF related, matrix associated, actin dependent regulator of chromatin, subfamily a, member 5 (SMARCA5) genes that encode sucrose non-fermenting like (SNF2L) and sucrose non-fermenting homolog (SNF2H), respectively (7). ISWI proteins typically form heterodimers with either a BAZ-family transcription factor (TF) or a larger protein (bromodomain and plant homeodomain containing transcription factor (BPTF), CECR2 or RSF1) capable of interacting with acetylated histones (8). There are eight known mammalian ISWI complexes: six containing SNF2H (ACF, CHRAC, WICH, NORC, RSF and BAZ2B) and two with SNF2L (nucleosome and remodeling factor (NURF), CERF) although it has been suggested that SNF2H and SNF2L are interchangeable, thus doubling the number of ISWI complexes (9). Mutations in SMARCA1, SMARCA5 and several of the ISWI interacting partners (bromodomain Adjacent to Zinc finger domain 1B (BAZ1B), bromodomain Adjacent to Zinc finger domain 2B (BAZ2B), BPTF) are also the cause of NDDs (8,10). The NDD with dysmorphic facies and distal limb anomalies (NEDDFL) syndrome (MIM#617755) was first described in 2017 and is caused by heterozygous mutations in the BPTF gene (11). The mutations have been identified throughout the gene with the vast majority (90%) representing truncating mutations (frameshift, nonsense, splicing or partial gene deletions) and a loss-of-function allele, with very few missense changes. An additional 25 cases have expanded the phenotype to include intellectual disability, speech delay, mild brain abnormalities, seizures, scoliosis, visual defects and postnatal microcephaly (11,12).
BPTF functions within NURF, a highly conserved complex first identified in Drosophila that also comprises SNF2L and the auxiliary proteins RbAp46 and RbAp48 (13,14). The NURF complex has multiple functions. At enhancers and chromatin insulators, it maintains nucleosome-free regions to facilitate either enhancer/promoter interactions or CCCTC-bindinf factor (CTCF) binding (15–17). NURF promotes TF recruitment and target gene expression with several studies showing it is required for cellular differentiation (18–21). Other studies have highlighted a requirement for NURF in the self-renewal and maintenance of progenitor cell pools (18,22,23). In cancer stem cells, NURF has been shown to be important for self-renewal acting as a cofactor for c-Myc or OCT4 transcriptional activity (24,25). How these functions translate to the role of BPTF in the developing brain and the pathogenesis of the NEDDFL syndrome remains largely unknown.
Genome editing of bptf in zebrafish demonstrated a reduction in head size that was attributed to increased apoptosis although the underlying mechanisms were not defined (11). In mice, Bptf is essential for embryonic development, as Bptf−/− mouse embryos die post implantation between embryonic day 7.5 (E7.5) and day 8.5 (E8.5) (26). Tissue-specific conditional knockout mutants have defined roles for NURF in thymocyte and mammary gland development (19,23). Surprisingly, Smarca1-deficient mice present with larger brains due to delayed progenitor cell differentiation which contrasts the phenotype of NEDDFL patients who have microcephaly (21). Although this may reflect NURF-independent functions of Smarca1 and Bptf, it does identify the need for a better disease model. In this study, we describe the generation and characterization of mice with a conditional knockout of the Bptf gene in the developing forebrain as a model to study the pathogenesis of the NEDDFL syndrome.
Results
Generation of a mouse model of NEDDFL syndrome by forebrain-specific deletion of the Bptf gene
Previous studies using Bptffl/fl mice have indicated that germline deletion is lethal whereas tissue-specific ablation impairs proliferation of resident stem cell populations (22,23,26,27). We reasoned that the use of early-onset neural Cre drivers (e.g. nestin-Cre and forkhead box G1 (FoxG1)-Cre) would also result in premature lethality similar to studies of other chromatin remodeling proteins (28,29). To study the pathogenesis of the NEDDFL syndrome, we utilized the empty spiracles homeobox 1 (Emx1)-Cre driver line that initiates Cre expression at embryonic day 10.5 (E10.5) and restricts the expression to neural progenitors in the dorsal pallium of the developing forebrain (30). The Bptffl/fl mice contain loxP sites flanking exon 2 (823 nts; Fig. 1A), and its removal causes a reading frameshift and generates a non-functional polypeptide (26). Commercial antibodies for Bptf proved to be non-specific, so we utilized RT-PCR and in situ hybridization to confirm that exon 2 was excised specifically in the developing forebrain (Supplementary Material, Fig. S1A and B). Subsequently, RNAseq analysis also confirmed a significant reduction in exon 2-containing transcripts (Supplementary Material, Fig. S1C).
Figure 1.

Generation of the Bptf cKO mice. (A) Schematic diagram of the murine Bptf gene showing the location of the loxP sites (black triangles) flanking exon 2 and the resulting allele after excision by Cre recombinase. (B) Expected and observed Mendelian ratios of 305 pups from 38 litters of the Bptffl/fl×Bptffl/+::Emx1-Cre+/− breeding pair (cKO—Bptffl/fl::Emx1-Cre+/−; Het—Bptffl/+::Emx1-Cre+/−; Wild-Type—Bptffl/fl::Emx1-Cre−/− or Bptffl/+::Emx1-Cre−/−). (C) Brain mass of Control (Ctrl) and Bptf cKO (cKO) mice isolated at birth (P0.5). n = 10 Ctrl, 9 cKO; **, P < 0.05. (D) Brain weight to body weight ratio of Ctrl and cKO mice at P0.5. n = 10 Ctrl, 9 cKO; **, P < 0.05. (E) Body mass measurements of Ctrl and cKO animals at P2. n = 7 Ctrl, 7 cKO; ****, P < 0.0001. (F) Representative images of P10 Ctrl and cKO mice. (G) Representative images of Ctrl, Het and cKO brains dissected from P12 animals. (H) Representative images of brains isolated from young adult mice (P26) corresponding to Ctrl, Het and cKO genotypes. (I) Adult Ctrl and cKO mice at 9 months. Arrow depicts altered head morphology observed in cKO mice.
The Bptffl/fl:Emx1-Cre+/− conditional knockout mice (hereafter referred to as Bptf conditional Knockout (cKO) mice) were born in normal Mendelian ratios (Fig. 1B) showed no body weight differences from control littermates at birth (Supplementary Material, Fig. S1D), but they did have a smaller brain mass (Ctrl = 0.09 g ± 0.0015; cKO = 0.079 g ± 0.0037; n = 10; P-value = 0.0051; unpaired t-test; Fig. 1C) that resulted in a reduced brain weight-to-body weight ratio (Fig. 1D). The Bptf cKO mice developed a significant reduction in body weight (Ctrl = 1.66 g ± 0.037; cKO = 1.39 g ± 0.026; n = 7; P-value < 0.0001; unpaired t-test) by postnatal day 2 (P2) (Fig. 1E). These growth differences were maintained as the mice grew older and were easily visible by P10 (Fig. 1F). Strikingly, brains dissected from Bptf cKO mice showed a massive reduction in the size of the forebrain compared to both control and heterozygous littermates (Fig. 1G). Older Bptf cKO mice remained viable and showed no differences in home cage behavior compared with control littermates. The gross morphology of the hypoplastic forebrain remained identical to the P12 mice as the mice aged (Fig. 1H; Supplementary Material, Fig. S1E), resulting in older mice with an oddly shaped head (Fig. 1I, arrow), and suggesting that the phenotype is developmental and does not worsen with age.
Bptf ablation is associated with increased neuronal cell death
Cortical projection neurons of the cerebral cortex are generated from a pool of radial glia progenitor cells (RGCs) and intermediate progenitor cells (IPCs) that are located along the lateral ventricle. Alterations in progenitor pool size and expansion can have dramatic effects on the size of the neocortex. To assess the differences in the proliferating progenitor pools of the Bptf cKO mice, we first performed 5-ethynyl-2'-deoxyuridine (EdU) pulse-labeling to identify cells in the S-phase then quantified the proportion of cells colabeled with markers specific to RGCs (paired box 6 (Pax6)+) and IPCs (T-box brain transcription factor 2 (Tbr2)+). We observed that the proportion of RGCs (Pax6+ cells/total nuclei) was similar for all genotypes [Ctrl: 31.59% ± 0.76; Het: 33.51% ± 0.94; cKO: 32.41% ± 0.99; n = 3; P-value = 0.394; one-way analysis of variance (ANOVA)] and the proportion of RGCs in the S-phase was also equivalent (Pax6+, EdU+/Pax6+; Ctrl: 30.48% ± 1.25; Het: 24.79% ± 2.18; cKO: 28.15% ± 0.70; n = 3; P-value = 0.575; one-way ANOVA; Fig. 2A and B). Similarly, the proportion of cycling IPCs (Tbr2+, EdU+/Tbr2+ cells) showed no differences (Ctrl: 12.54% ± 1.41; Het: 9.23% ± 1.58; cKO: 13.44% ± 1.43; n = 3; P-value = 0.190, one-way ANOVA; Fig. 2C and D) although there was a slight decrease in overall IPC number (Ctrl = 25.9% ± 0.69; Het = 28.7% ± 2.07; cKO = 21.5% ± 0.67; P-value = 0.0059; n = 3; one-way ANOVA) in the Bptf cKO mice (Fig. 2C and E). Immunoblots at E15.5 also showed no difference in Pax6 levels and a slight but non-significant decrease in Tbr2 (Supplementary Material, Fig. S2A). To further address progenitor proliferation kinetics, we stained E15.5 sections for the mitotic marker phospho-histone H3 (pH3). We observed no differences in the number of pH3+ cells at the apical surface where RGCs divide nor more basally where the IPCs divide (Supplementary Material, Fig. S2B–D). Finally, we examined the rate at which progenitors exit the cell cycle by labeling cells in the S-phase with EdU at E14.5 then harvesting the tissue at E15.5 and costaining for Ki67+, a marker of cycling cells. In this way, we observed a 10% decrease in the fraction of cells leaving the cell cycle (EdU+, Ki67−/EdU+ cells) in the Bptf cKO mice compared to the control or heterozygous animals (Ctrl: 79.8% ± 2.98; Het: 79.3% ± 0.56; cKO: 69.8% ± 1.94; P-value = 0.0151; n = 3; one-way ANOVA; Fig. 2F; Supplementary Material, Fig. S2E). Taken together, the cortical progenitor cells of the Bptf cKO mice show no blocks in the cell cycle with similar cell proportions in the S- and M-phase to the control samples. However, fewer cells exited the cell cycle in a 24-h period suggesting that cell cycle length was prolonged, which could account for the slight reduction in IPC number.
Figure 2.
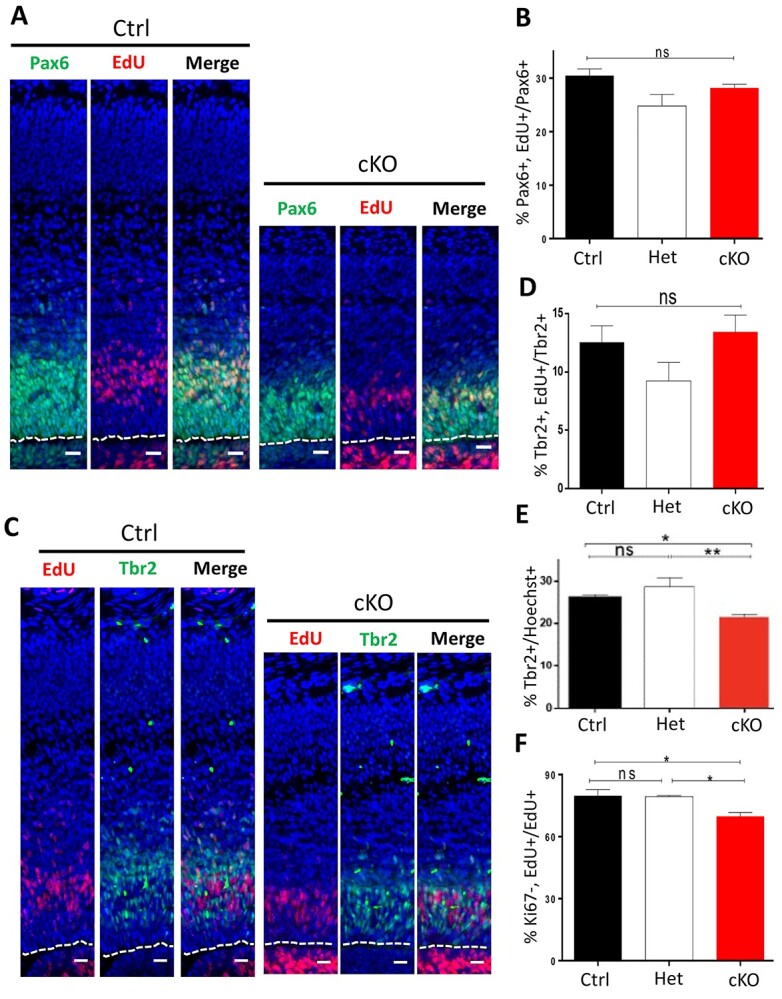
Analysis of progenitor proliferation. (A) Representative images of E15.5 Ctrl and Bptf cKO cortical sections immunostained for Pax6 (green) to identify RGCs after a 1-h pulse of EdU (red) to mark cells in S-phase. Nuclei were counterstained with Hoechst (blue). Scale bar = 50 μm. Dotted line indicates the apical surface. (B) Graph indicating percentage of Pax6+ RGCs within S-phase (Pax6+, EdU+ cells/Pax6+ cells) quantified within 110 μm wide cortical sections for Ctrl, Het and cKO samples. (C) Representative images of E15.5 Ctrl and cKO cortical sections immunostained for Tbr2 (green) to identify IPCs following a 1-h injection of EdU (red) to label cells in S-phase. Nuclei were counterstained with Hoechst (blue). Scale bar = 50 μm. Dotted line indicates the apical surface. (D) Graph indicating percentage of Tbr2+ IPCs within S-phase (Tbr2+, EdU+ cells/Tbr2+ cells) quantified within 110 μm wide cortical sections for Ctrl, Het and cKO samples. (E) Percentage of IPCs (Tbr2+/Hoechst+) within E15.5 forebrain sections of Ctrl, Het and cKO animals. (F) Fraction of cells that exited the cell cycle (Ki67−, EdU+) within 24 h after a 1 h EdU pulse to label cells in S-phase (EdU+). For all experiments, n = 3; ** = P-value < 0.01; * = P-value < 0.05; ns = not significant.
A slight reduction in IPC number is unlikely to account for the massive decrease in the cortical size observed. The reduced number of postmitotic neurons could be further exacerbated by an increase in the proportion of dying cells. In this regard, studies that ablated the Bptf gene from murine mammary epithelial cells (MECs) or inactivated BPTF in human lung cancer cell lines have both demonstrated the subsequent activation of caspase cascades and enhanced apoptosis (23,31). In a separate study that examined the basis for severe cerebellar hypoplasia in Smarca5-null mice, a high incidence of dying cells was accompanied by enhanced levels of activated microglial that were important for the clearance of the cellular debris (32). As such, we coimmunostained E13.5, E15.5, P2 and P7 cortical sections with cleaved caspase 3 (CC3) antibodies to detect dying cells and with ionized calcium-binding adapter molecule 1 (Iba1) antibodies to identify activated microglial cells within the cortex. At E13.5, we observed no significant changes in the proportion of Iba1+ microglia or the proportion of CC3+ cells in the Bptf cKO mice (Supplementary Material, Fig. S3A and B). However, by E15.5 there was a 10-fold increase in the percentage of apoptotic cells within the intermediate zone (IZ) and cortical plate (CP) of the Bptf cKO mice compared with that in the Ctrl and Het animals (Ctrl: 0.07% ± 0.07, Het: 0.13% ± 0.13; cKO: 1.94% ± 0.42; n = 3; P-value < 0.002; one-way ANOVA; Fig. 3A and B) whereas the levels within the ventricular zone (VZ) were largely unchanged (Fig. 3C). The levels of Iba + microglia also remained unchanged in the CP and IZ across all genotypes but within the VZ there were more microglia in the mutants compared with that in the Ctrl sample but not the Het mice (Fig. 3C). The increased percentage of CC3+ cells in the Bptf cKO mice remained elevated as late as P2 (cKO: 1.69% ± 0.39), but the increase at P2 was accompanied by a similar 10-fold increase in Iba1+ cells (Ctrl: 0.46% ± 0.03; Het: 0.29% ± 0.05; cKO: 3.4% ± 0.34; n = 3; P-value < 0.0001; one-way ANOVA; Fig. 3E) including a high incidence of colabeled cells (cKO: 19.7% ± 7.4; Fig. 3F). Increased Iba1+ cells were not observed in Ctrl or Het sections and correspond to phagocytic microglia that engulf cellular debris from dead or dying cells (Fig. 3D–F). At P7, there were more CC3+ cells in Het and Bptf cKO mice compared with those in Ctrl samples (Ctrl: 0.32% ± 0.07; Het: 0.71% ± 0.18; cKO: 0.86% ± 0.09; n = 3; P-value = 0.0358; one-way ANOVA), suggesting that the cell death was waning in the Bptf cKO mice (Supplementary Material, Fig. S3C and D). However, the frequency of Iba1+ cells was still significantly increased in the Bptf cKO mice compared with that in both other genotypes (Ctrl: 2.02% ± 0.14; Het: 3.25% ± 0.55; cKO: 5.53% ± 0.66; n = 3; P-value = 0.0025; one-way ANOVA; Supplementary Material, Fig. S3C and D). We conclude from this data that a high incidence of cell death is a major contributor to the reduction in cortical size and that this occurs as the neurons become postmitotic, initiate their terminal differentiation program, and migrate toward their final laminar position.
Figure 3.

The Bptf cKO cortex is enriched in microglia and apoptotic cells. (A) Representative E15.5 cortical sections from Ctrl, Het and cKO mice immunostained for (CC3, green) and Iba1 (red) to identify apoptotic cells (white arrows) and activated microglia, respectively. Sections were counterstained with Hoechst (blue). CP, cortical plate; IZ, intermediate zone; VZ, ventricular zone; Scale bar = 50 μm. (B, C) Percentage of Iba1+ and CC3+ cells to total cell number (Hoechst+) within the CP/IZ (B) and the VZ (C) of 110 μm wide cortical sections. (D) Representative P2 cortical sections from Ctrl, Het and cKO mice immunostained as in (A). Scale bar = 50 μm. Boxed magnified image depicts Iba1 and CC3 co-labeled cells which were only identified in the cKO sections. (E) Percentage of Iba1+ and CC3+ cells to total cell (Hoechst+) number within a 110 μm wide cortical section of the P2 cortex. (F) Quantification of Iba1, CC3 co-labeled cells within a 110 μm wide cortical section of the P2 cortex. n = 3; **** = P-value < 0.0001; *** = P-value < 0.001; ** = P-value < 0.01; * = P-value < 0.05; ns = not significant.
Bptf regulates cell fate decisions of postmitotic cortical projection neurons
The murine neocortex develops in an inside-out manner such that the neurons that reside in the deep cortical layers are generated earlier than neurons in the upper superficial layers (33–35). Mouse mutants with altered progenitor kinetics often generate normal numbers of early-born neurons but produce fewer neurons in the upper layers (36,37). To examine the Bptf cKO mice for lamination defects we cryosectioned and immunolabeled P2 coronal brain sections with the deep-layer neuronal markers anti-T-box brain transcription factor 1 (Tbr1) (layer VI) and anti-Ctip2 (layer V), or the upper-layer marker anti-Special AT-rich sequence binding protein 2 (Satb2) (layers II–V) (Fig. 4A). As there is a significant decrease in the total number of cells (Hoechst + cells; Ctrl: 873.5 ± 38.35 cells; Het: 953 ± 9.35 cells; cKO: 653 ± 26.46 cells; n = 3; P-value < 0.0001; one-way ANOVA; Fig. 4D) in the Bptf cKO cortex, we quantified the proportion of marker-positive cells to total cell number. Satb2 immunostaining was present in the upper layers (layers II–III), but we observed fewer positive cells present in layer V and some positive cells located below layer VI (Tbr1+) that were not present in the control or Het sections (green bracket, Fig. 4A–C; Supplementary Material, Fig. S4A). Overall, the proportion of Satb2-positive cells was reduced by 45% in the cortex of the Bptf cKO mice (Fig. 4E), which was confirmed by immunoblotting (Fig. 4F). The proportion of early-born Tbr1-positive neurons was also significantly reduced as determined by immunostaining and immunoblotting compared with that in control or Het samples (Fig. 4A, B, E and F; Supplementary Material, Fig. S4A), despite maintaining a normal laminar position. Ctip2 immunostaining highlighted both lamination and cell fate defects. High-expressing Ctip2-positive cells typically reside in layer V whereas low-expressing (Ctip2low) cells colocalize with Tbr1 in layer VI, with very few found in layers II–III (38–42). In the Bptf cKO mice, we observed a > 90% decrease in the proportion of Ctip2high neurons in layer V (Ctrl: 4.17% ± 0.49; cKO: 0.34% ± 0.05; n = 4; P-value < 0.0001; unpaired two-tailed t-test; Fig. 4A–C and E; Supplementary Material, Fig. S4A). A 60% reduction of Ctip2low cells was observed in layer VI, which was accompanied by a 2.7-fold increase in the proportion of Ctip2low cells in layers II–III (white bracket, Fig. 4B, C and E). Immunoblots suggested the overall levels of Ctip2 were not markedly different than in the control extracts (Fig. 4F). We next immunostained for forkhead box P1 (Foxp1), a gene expressed in layers IV and V of the cortex. We observed an overall decrease in the proportion of Foxp1+ cells (Ctrl: 24% ± 2.69; Het: 25.83% ± 0.09; cKO: 16.66% ± 0.98; n = 3; P-value = 0.0173; one-way ANOVA) with most located within layer IV suggesting that Bptf is required for specification of layer V pyramidal neurons that express Ctip2high or Foxp1 (Supplementary Material, Fig. S4B and C).
Figure 4.

Bptf cKO mice have cortical lamination and cell fate defects. (A) Low magnification (5x) images of P2 coronal sections immunostained for cortical layer markers Satb2 (layers II-V; green), Ctip2 (layer V; grey) and Tbr1 (layer VI; red). The first panel is a merged image that includes Hoechst (blue) to label cell nuclei. The white dotted boxes indicate the location of the high magnification images shown in (B). Green brackets denote the decreased Satb2 staining pattern observed in the mutant (cKO) compared to control (Ctrl) samples. Scale bar = 200 μm. (B) Higher magnification (20x) images of the cortical layers from Ctrl and cKO mice at P2. Antibodies used to identify the layers by immunostaining are the same as in (A). Green, white and red brackets indicate specific staining differences observed in the cKO samples as described in the text. Scale bar = 50 μm. (C) Images of the cKO sections from (B) further magnified to highlight differences in layer marker expression within layers II-VI. Scale bar = 50 μm.
Figure 4.

(D) Average cell density counts following Hoechst staining per 110 μm section width. (E) Layer marker labeled neurons were quantified as a percentage of total nuclei within the P2 coronal sections similar to images shown in (B). Ctip2 cells were further delineated as high and low expressing cells within layer V and layers II-IV or layer VI, respectively. (F) Immunoblots of P2 cortical extracts were probed with antibodies to Satb2 (left), Ctip2 (right) or Tbr1 (bottom). The relative expression levels of each layer marker were quantified as the band intensity relative to actin loading control and normalized to Ctrl levels. n = 3; values represent the mean ± SEM; **** = P-value < 0.0001; *** = P-value < 0.001; * = P-value < 0.05.
To determine if the decreased presence of Ctip2high layer V cells was caused by a reduction at birth of these cells, we performed an EdU birth-dating experiment. Time-mated dams (E13.5, approximate time of layer V neuronal production) were injected with EdU at E13.5, and the peak of layer V neuron production and the pups were collected at P2 for immunostaining with EdU and Ctip2. Similar to the results from the previous experiment, we observed a ~50% reduction in the proportion of Ctip2high-positive cells in layer V. However, when colabeled cells (EdU+, Ctip2+) were quantified, there was no difference between the Ctrl and Bptf cKO samples (Supplementary Material, Fig. S4D and E) suggesting that these cells are specified but have impaired Ctip2 regulation that alters lamination and terminal expression levels.
Transcriptome profiling highlights altered derepression circuit and immune response
To explore the underlying mechanisms that contribute to the cell fate changes and death observed in the newborn Bptf cKO mice, we performed an RNAseq experiment of dissected cortices at birth. Differential expression analysis by log2 fold change (L2FC ± 0. 5; q-value < 0.05) identified 224 downregulated and 200 upregulated genes compared to cortices dissected from Ctrl littermates (Fig. 5A; Supplementary Material, Table S1). The top Gene Ontology (GO) term associated with the downregulated genes was cell adhesion whereas other top GO terms included nervous system development, regulation of transcription, and regulation of cell proliferation. We observed a significant number of dysregulated genes that encoded TFs important for cortical neuron fate specification (neuronal differentiation 6 (Neurod6), L2FC = −0.95; Emx1, L2FC = −0.97; forebrain embryonic zinc finger (FEZ) family 2 (Fezf2), L2FC = −0.90; Satb2, L2FC = −0.84; and nuclear receptor subfamily 4 group A member 2 (Nr4a2), L2FC = −0.94). In addition, we observed altered expression of MYC Proto-Oncogene, BHLH Transcription Factor (Myc) (L2FC = −0.71), a known Bptf interacting protein shown to mediate proliferation in some cancers (24,43). We confirmed that the expression of each of these TFs was decreased in the Bptf cKO cortex by RT-qPCR (Fig. 5D) except for Emx1 (Supplementary Material, Fig. S5A). Previous work has suggested that Foxg1 is critical for initiating neurogenesis and commitment to early-born layer I neurons whereas genetic interactions between the TFs Satb2, Fezf2, Tbr1 and Ctip2 mediate fate decisions between different deep and upper-layer neurons (40). As such, we also examined Foxg1, Tbr1 and Ctip2 gene expression by RT-qPCR but did not observe any differences between Ctrl and Bptf cKO cortical RNA samples (Supplementary Material, Fig. S5A and B).
Figure 5.

Transcriptome profiling at P0 cortex identify dysregulation of TFs critical for cortical development. (A) Volcano plot of differentially expressed genes (DEGs) between Ctrl and cKO RNA isolated from dissected cortices at P0. Depicted are 224 downregulated (blue, L2FC < −0.5; q-value < 0.05) and 200 upregulated (yellow, L2FC > 0.5; q-value < 0.05) genes. (B, C) Column plots of DAVID Gene Ontology (GO) results for upregulated (B) and downregulated (C) gene sets. Transcript count depicts the number of DEGs per GO term. (D) Validation of select DEGs by RT-qPCR comparing Ctrl, Het and cKO samples. Dysregulation was only observed in cKO samples and included the Fezf2 (L2FC = −2.26, P-value = 0.0002), NeuroD6 (L2FC = −1.76, P-value = 0.0047), Satb2 (L2FC = −1.54, P-value = 0.0046), Nr4a2 (L2FC = −1.82, P-value = 0.005) and Myc (L2FC = −1.239, P-value = 0.067) transcripts. n = 6; one-way ANOVA; **** = P-value < 0.0001; *** = P-value < 0.001; ** = P-value < 0.01; * = P-value < 0.05.
The top GO terms associated with upregulated genes indicated an increased immune response and apoptotic processes (Fig. 5C). These GO terms were consistent with the increased number of Iba1+ microglia and CC3 staining that we observed in the postnatal cortex (Fig. 3).
Dysregulated genes in the Bptf cKO cortex are enriched for Myc-binding sites
Given that the transcriptome analysis at P0 highlighted cell population differences, we repeated the experiment at E13.5. At this time, there was no increase in microglia cell number or cell death suggesting that expression changes may be more representative of Bptf target genes. At E13.5, there were 74 upregulated (L2FC > 0.25) and 85 downregulated (L2FC < −0.25) genes identified using a threshold q-value < 0.05 (Fig. 6A; Supplementary Material, Table S1). The downregulated genes showed an enrichment for GO terms that were similar to the analyses at P0.5 with tissue development, nervous system development and TF activity among the top terms identified (Fig. 6B). However, the GO terms enriched for the upregulated genes differed significantly from the P0 analysis showing an increase in amino acid biosynthesis, response to estrogen receptor (ER) stress and intrinsic apoptotic signaling in response to ER stress (Fig. 6C).
Figure 6.

ER-stress pathways are dysregulated at E13.5 and P0. (A) Volcano plot of differentially expressed genes (DEGs) between Ctrl and cKO RNA isolated from dissected cortices at E13.5. Depicted are 85 downregulated (blue, L2FC < −0.25; q-value < 0.05) and 74 upregulated (yellow, L2FC > 0.25; q-value < 0.05) genes. (B, C) Column plots of DAVID Gene Ontology (GO) results for upregulated (B) and downregulated (C) gene sets. Transcript count depicts the number of DEGs per GO term. (D) Venn Diagram depicting 28 DEGs in both E13.5 and P0 cortex. (E) List of DEGs identified at E13.5 and P0. (F) Column plot of the most frequently observed transcription Factor binding site (TFBS) within the promoter region of the 28 common DEGs.
To identify genes dysregulated at both time points we compared the E13.5 and P0 gene lists and identified 28 overlapping genes, 21 upregulated and 7 downregulated genes (Fig. 6D and E). The overlapping gene list showed enrichment for GO terms related to amino acid biosynthesis, oxidation–reduction process and metabolic process (Supplementary Material, Fig. S6A). Further analysis suggested that fifteen of the upregulated genes (asparagine synthetase (Asns), activating transcription factor 5 (Atf5), ChaC glutathione specific gamma-glutamylcyclotransferase 1 (Chac1), DNA damage inducible transcript 3 (Ddit3), eukaryotic translation initiation factor 4E binding protein 1 (Eif4ebp1), harakiri (Hrk), methylenetetrahydrofolate dehydrogenase (NADP+ Dependent) 2 (Mthfd2), phosphoglycerate dehydrogenase (Phgdh), phosphoserine aminotransferase 1 (Psat1), phosphoserine phosphatase (Psph), pyrroline-5-Carboxylate Reductase 1 (Pycr1), sestrin 2 (Sesn2), serine hydroxymethyltransferase 2 (Shmt2), stanniocalcin 2 (Stc2) and tribbles pseudokinase 3 (Trib3)) are ER-stress related genes that become activated as part of the unfolded protein response (UPR) to either provide protection against apoptosis or induce a neuronal apoptotic pathway. Alignment of the promoters of the 28 dysregulated genes with known TF-binding motifs demonstrated that many shared TF-binding sites (44). Specifically, we observed that 17/28 genes contained Myc binding sites while nuclear transcription factor Y subunit alpha (Nfya) and SRY-related homeobox 2 (Sox2)-binding sites were enriched in 10 genes (Fig. 6F).
Discussion
The goal of this study was to generate a model of the NEDDFL syndrome by inactivating Bptf in the developing mouse forebrain. Human NEDDFL patients with heterozygous BPTF nonsense or frameshift variants have microcephaly, with magnetic resonance imaging findings indicating mild cortical atrophy or enlarged ventricles in some patients (11,12). We observed microcephaly in the Bptf cKO mice from severe cortical hypoplasia present from birth. While the anatomical defect did not worsen in older animals, it will be important to assess the effect on cognitive functions, particularly given that some patients have a history of seizures and electroencephalogram (EEG) abnormalities (12). The added observation that Bptf cKO mice have cortical lamination defects also supports the need for future functional studies and encourages the utility of the mice for defining the pathogenesis of the NEDDFL syndrome.
Microcephaly in other NDD models was caused by aberrant proliferation of RGCs and/or IPCs progenitors leading to reduced neuronal output (36,37,45,46). For Bptf, stem cell inactivation studies highlight altered self-renewal maintenance, transition to transit-amplifying cells and blocked differentiation programs (18,22,23). The neural stem cells (RGCs) of the Bptf cKO mice showed no reduction in cell number or any blocks in cell cycle progression that altered proliferation. However, fewer IPCs were observed suggesting that RGCs undergo fewer asymmetrical divisions, a finding supported in other progenitor populations lacking Bptf expression (18,22,23). Transcriptomic profiling identified a set of genes related to ER- and mitochondrial-stress (Fig. 6E) that indicated activation of the UPR. Moreover, previous work showed that activation of the UPR in cortical progenitors favored direct neurogenesis of RGCs at the expense of IPC production leading to microcephaly (47). Seventeen of the 28 upregulated stress response genes contained c-Myc-binding sites within their promoters (Fig. 6F; Supplementary Material, Table S1). Other studies have shown that Bptf interacts with c-Myc to drive proliferation (24) and that c-Myc promotes RGC proliferation and transformation into IPCs (48). Given that c-Myc expression was decreased in the Bptf cKO mice, we propose that the UPR-activated genes represent a repressive target of Bptf/c-Myc chromatin remodeling that facilitates asymmetric division and generation of IPCs.
The fraction of the IPC pool exiting the cell cycle was also reduced suggesting they were challenged in initiating the neurogenic program. Studies of hematopoietic, thymocyte and melanocyte differentiation have also demonstrated a requirement for Bptf for proper stem cell differentiation (18,19,22). In the developing mammary gland, mammary stem cells (MaSCs) transition into MECs that then give rise to luminal and myoepithelial cell types. The loss of Bptf not only reduced the self-renewal potential of MaSCs but led to arrested differentiation, the emergence of a novel MEC cell type (5% of population) and fewer MEC-derived cell types from enhanced apoptosis (23). Defects in IPC differentiation could also account for the significant increase in cell death observed within the IZ, presumably in the postmitotic neurons after cell cycle exit or during their laminar migration. Transcriptomic profiling identified lower expression of Neurog1, Fezf2 and Neurod6, three key TFs that drive differentiation and cell fate specification at early stages (35,38,49,50). These TFs are critical for cortical neurogenesis and support the idea that cells within the IZ of the Bptf cKO mice are arrested in their differentiation. Neurod6 is particularly intriguing as it is required during the early stages of differentiation for stimulating mitochondria biogenesis and conferring cellular tolerance to mitochondrial stressors and oxidative stress (51,52). The decreased production of Neurod6 coupled with the enhanced activation of stress response genes observed in the Bptf cKO mice suggest that apoptotic pathways may be more readily triggered in the newly generated neurons.
Many neurons were able to cope with the increased stress, initiate differentiation and migrate to a final laminar position. Nonetheless, these neurons may be compromised too since many displayed misexpression of layer-specific markers that could alter axon targeting and/or function. These cell fate specification defects included layer VI and layer II–IV neurons that maintained Ctip2 protein expression inappropriately, a massive decrease in Ctip2+ and Foxp1+ layer V neurons, and misplaced Satb2+ neurons residing below layer VI that likely never completed their migration to the upper layers. The neurons within each layer of the murine cortex are generated in an orderly fashion such that the deep layers (V and VI) are born before the upper layers (II–IV). After birth, the neurons within each layer have specific projection identities that are regulated by a genetic repression/derepression circuit comprising the TFs Fezf2, Ctip2, Tbr1 and Satb2 (35,40). We observed reduced levels of Tbr1, Fezf2 and Satb2 but not Ctip2 (Figs 4F and5D), suggesting that this genetic circuit regulating projection neuron identity was perturbed. Consistent with this idea, conditional inactivation of Fezf2 resulted in significant reduction of Ctip2 expression in layer V neurons and increased levels in layer VI neurons (53); and finding similar to that observed in the Bptf cKO mice. Finally, lower levels of Satb2 protein observed in the Bptf cKO cortex may explain the aberrant Ctip2 expression in layers II–IV since Satb2 interacts with Ski to repress Ctip2 expression in upper-layer neurons (40,54). Further work is required to determine how Bptf complexes regulate and/or interact with these key fate-determining TFs to mediate cortical neuron subtype specification.
The initial characterization of the Bptf cKO mice demonstrate phenotypic similarities to the NEDDFL syndrome and have elucidated roles for this chromatin remodeling protein in regulating progenitor differentiation and the activation of key cortical neuron subtype determinants. As such, the Bptf cKO mice represent a good model to further dissect the molecular mechanisms that underlie the cognitive and developmental phenotype of NEDDFL patients.
Materials and Methods
Mouse breeding
All experiments were performed according to the guidelines set by the University of Ottawa’s Animal Care ethics committee, maintaining the standards set by the Canadian Council on Animal Care in the Animal Care and Veterinary Services facility of the University of Ottawa. The Bptf homozygous flox (Bptff/f) animals were provided by Dr Camila dos Santos from the Cold Spring Harbor Laboratory (23), and correspond to those originally described by Landry et al. (26). These animals contain loxp sites surrounding exon 2 of the Bptf gene. The Bptff/f mice were bred with the previously described Emx1 Cre mouse driver line (30) to generate Bptff/+::Emx1 Cre+/− males. These mice were subsequently crossed to Bptff/f females to generate the Bptff/f::Emx1 Cre+/− animals (denoted Bptf cKO or cKO). All mice were maintained on a C57B/6 background.
Immunofluorescence staining
Murine brains were quickly dissected, fixed with 4% paraformaldehyde and embedded in OCT (VWR) for cryosectioning as previously described (55). Cryostat sections (12 μm) were mounted onto SuperFrost slides (Fisher Scientific), washed three times with phosphate buffered saline solution with 1% Tween-20 (PBST) (0.1 M phosphate buffered saline (PBS) with 0.1% Triton X-100), and then heated in 10 mM sodium citrate buffer (pH 6.0) for antigen retrieval prior to blocking in 10% horse serum/PBST for 30 min at room temperature. Following blocking, all slides were incubated with a target primary antibody overnight at 4°C (primary antibodies and dilutions used are listed in Supplementary Material, Table S2). The next day, slides were incubated for 1 h with secondary antibody and followed by incubation with Hoechst 33342 dye (ThermoFisher Scientific) for 15 min. Finally, the slides were mounted on coverslips with DAKO Fluorescent mounting medium (Agilent Technologies). Tissue sections were examined and images acquired with a Zeiss Axiovert Observer Z1 epifluorescent/light microscope equipped with an AxioCam cooled-color camera (Zeiss). Images were exported to Adobe Photoshop CS5 (Adobe Systems Inc., CA, USA) and further processed for contrast when necessary.
Immunoblotting
Cortices were quickly dissected from individual embryos or pups and snap frozen in dry ice. Cortices were then homogenized in ice-cold adioimmunoprecipitation assay buffer (RIPA) buffer (150 mM NaCl, 1% NP-40, 0.1% SDS, 50 mM Tris pH 8.0, 5 mM ethylenediaminetetraacetic acid (EDTA), 0.5% Na-deoxycholate) supplemented with Halt Protease Inhibitor (Thermo Fisher Scientific) and incubated for 20 min on ice with gentle mixing. Lysed samples were pre-cleared by centrifugation (12 000×g for 15 min) and proteins quantified using the Bio-Rad Protein Assay Dye Reagent Concentrate (Bio-Rad Laboratories). Protein samples were resolved on Bis-Tris 4–12% gradient gels (NuPage, Invitrogen, USA) by electrophoresis (90–150 V) using the Bio-Rad Mini-PROTEAN Tetra Cell and then blotted onto polyvinylidene fluoride (PVDF) membranes (Immobilon-P; Millipore) by wet transfer at 0.35 A for 90 min using the Bio-Rad Mini Trans-Blot cell. Membranes were blocked (45 min, room temperature) with 5% skim milk in (Tris-buffered saline (TBST) containing 0.05% Triton X-100), and incubated (4°C, overnight) with the following antibodies: mouse anti-β-Actin (1:30 000; Sigma, A-1978-200ul); rabbit anti-Pax6 (1:2000; Cedarlane, PRB-278P-100); rabbit anti-Tbr2 (1:500; Abcam, ab23345); rabbit anti-Tbr1 (1:1000; Abcam, ab31940); rat anti-Ctip2 (1:500; Abcam, ab18465); mouse anti-Satb2 (1:1000; Abcam, ab51502). Membranes were incubated (1 h, room temperature) with HRP-conjugated goat anti-rabbit (1:5000, Jackson Immunoresearch, 111-035-003), goat anti-rat (15 000; Sigma, AP136P), or goat anti-mouse (15 000 for Satb2 primary, or 1:30 000 for β-actin primary; Sigma, A5906) IgG (H + L) secondary antibodies. Membranes were washed 5 × 5 min in TBST after antibody incubations, and signals were detected using the Pierce Supersignal West Fempto chemiluminescence substrate (Cat # 34095). Western blots were quantitated using ImageJ software. For quantification, at least 2 separate gels were immunoblotted with cortical extracts from independent litters.
EdU Pulse-labeling
To label cells with EdU, pregnant mothers were injected subcutaneously near the bottom of the abdomen, avoiding the embryonic sacs with 10 mg/ml EdU (Santa Cruz). The amount of EdU injected was unique to each pregnant dam, 10 μL per g of the female’s total weight. EdU injections were performed for three separate types of experimental analysis: (1) to quantify cells in S-phase tissue was harvested 1-h after injection; (2) to assess cell cycle exit tissue was harvested 24-h after injection; and (3) for neuronal birthdating experiments EdU injection at E13.5 was followed by tissue harvest at P2. Tissues were harvested as described above. After the brain tissue was fixed and sectioned, the EdU click chemistry step was performed alongside the immunofluorescent (IF) labeling. The click-chemistry solution contained 2 mM CuSO4, 10 μM fluorescent azide (Cy-5-Azide, Sigma catalog # 777323-1MG) and 50 mM ascorbic acid.
Cell counts
The IF-stained sections were used to acquire images at 20X magnification to visualize and to count the proportion of marker positive (+ve) stained cells. Software used for image processing was AxioVision SE64 Rel. 4.9.1 and the quantification of cells was performed using the Adobe Photoshop CC 2015 software. From the coronal cortical images acquired, a representative region was demarcated with a rectangle that was 133 μm (250 pixels) wide and comprised the full height of the cortex. Within each rectangle, the mean cell number (any marker positive cell) and total cell count (Hoechst+ nuclei) was quantified from a minimum of three sections from at least three biological replicates. In order to statistically quantify the proportional means of the marker positive cells, comparing the three groups (wild type (WT), Het and Emx1-Cre conditional Knockout (EcKO)), a one-way parametric ANOVA was used comparing the means of each treatment group. The bar graphical representations then demonstrate the mean +/− the SEM and the significance thresholds demonstrated with ‘*’, as specified within each quantification.
In-situ hybridization
We used fresh coronal brain sections of murine brain tissue at E15.5 to perform this experiment. The In-situ hybridization procedure was performed as described by Jensen and Wallace (100). Briefly, a pBluescript KS vector (Addgene) was ligated with a PCR product containing Bptf exon 2 originating from forebrain specific WT cDNA, using newly designed primers (Supplementary Material, Table S3). Following transformation and digestions [EcoRI (Thermo Fisher Scientific, catalog# FD0275) to make sense probe and BamHI (New England Biolabs, catalog# R0136S) to make antisense probe], a 671 bp digoxigenin (DIG)-11-UTP labeled antisense RNA probe complementary to exon 2 of the Bptf transcript was synthesized from the transformed vector using the DIG RNA labeling kit (Roche #11175025910). The final product was hybridized onto E15.5 EcKO, WT and Het 12 μm brain coronal sections and left to incubate overnight at 65°C. The next day, sections were washed (1X PBS), blocked (20% horse/sheep serum in 1X PBST) and left overnight with anti-DIG antibody (Roche #11093274910). The colour chemical reaction was performed in a staining buffer containing nitro-blue tetrazolium (NBT) and 5-bromo-4-chloro-3-indoxyl-phosphate (BCIP) (Alkaline Phosphatase chromogen, Roche #11681451001) in a 37°C, void of light, water bath and left overnight. Reaction was stopped the following day and sections were cleaned in 1X PBS and mounted in PBS/glycerol at a 1:1 ratio. Positive signal was imaged under a M2 brightfield microscope. All slides were stained together to limit any differences that can be incurred from the staining procedure so that alterations in expression could be compared.
Reverse transcription and quantitative real-time PCR
RNA was isolated using TRIzol solution, according to manufacturer’s instructions (Thermo Fisher Scientific). Prior to cDNA preparation, RNA was treated with DNase I (2 Units/μL) to remove contaminating genomic DNA using the RNA-free DNA Removal Kit (Invitrogen) according to the manufacturer’s instructions. 1 μg of RNA was reverse transcribed into cDNA using the RevertAid Reverse Transcriptase (Thermo Fisher Scientific) and random hexamers (Thermo Fisher Scientific #SO142) under standard conditions. The final product was stored at −20°C for further use.
For RT-PCR the following conditions were used: 94°C for 2 min, 39 PCR cycles (94°C for 30 s, 60°C for 30 s, 72°C for 45 s) and a final cycle at 72°C for 10 min. We used 8 ng of the synthesized cDNA total in reaction mixture. Primers specific to exons 1 and 3 of the Bptf cDNA or the β-actin transcript are listed in Supplementary Material, Table S3. Products were analyzed on a 1.5% agarose gel containing ethidium bromide at 85 V for 40 min and imaged with a ChemiDoc-It Imager (UVP).
For qRT-PCR the cDNA was diluted 1:10 with HPLC water. The qPCR reaction mixtures were performed with SYBR (Bioline LoROX kit) with target primers of interest (see Supplementary Material, Table S3). The samples were loaded into a 96-well qPCR plate (Brooks life sciences) and run on the Agilent Stratagene Mx3000P System. The qPCR amplification cycles were: 1 cycle at 95°C for 2°min, 40 cycles (95°C for 5 s, 55°C for 20 s, 72°C for 20 s) and 1 cycle 72°C for 5 min. All primers were analyzed by dissociation curve analysis after qPCR amplification. The relative transcript abundance of each target gene was normalized to the mouse 18S RNA transcript, and the L2FC was acquired using the ΔΔCt method. A minimum of three technical replicate samples were performed per reaction and a minimum of three mice analyzed per genotype. Statistical significance was determined with a one-way ANOVA comparing the means of each treatment group (Ctrl, Het and cKO). When only comparing the mean fold change and SEM of two samples (e.g. Ctrl and cKO) a parametric, unpaired t-test was performed to test for significant change, α < 0.05.
RNA-seq and data analysis
RNA was isolated from dissected forebrains from 4 Ctrl and 4 cKO samples at E13.5 and P0.5 as described above. RNA was further purified using the PureLink RNA Mini Kit (Thermo Fisher Scientific) and then sent to GenomeQuébec (Montréal) for sequencing. mRNA libraries were prepared using NEBNext dual adapters [NEBNext multiplex oligos for Illumina (Dual index primers set 1)]. Samples were sequenced on an Illumina NovaSeq 6000 to generate pair-end sequences, and an average of 78°045°781 sequenced reads per sample were obtained. FastQC (56) and trimmomatic (57) were used on all fastq files to ensure the highest quality reads were used for downstream analysis. Reads were mapped to the GRCm38 mouse genome using Hisat2 (58), followed by exon specific quantification using ExCluster (59). For differential expression analysis, Kallisto (60) and Salmon (61) were used to pseudoalign the reads to the GRCm38 mouse transcriptome and simultaneously quantify the reads mapped to each gene. Differential expression analysis was also performed in R using the DESeq2 package (62), identifying differentially expressed genes (DEGs) at two time points (Supplementary Material, Table S1). GO analysis was performed using g: profiler (63), DAVID (64) and DOSE (65). Data manipulation and plotting were performed in R using ggplot2 (66) and dplyr, which is part of tidyverse. Lastly, oPOSSUM (44) was used to identify the transcription Factor binding site (TFBS) located in the promoter regions of the DEGs.
Supplementary Material
Acknowledgements
The authors wish to thank Dr Joseph W. Landry who didn’t have any Bptffl/fl breeders available to share but kindly put us in touch with Dr Camila dos Santos, who we generously thank for sending us a breeding pair.
Conflict of Interest statement. The authors declare no competing financial interests.
Contributor Information
Gerardo Zapata, Regenerative Medicine Program, Ottawa Hospital Research Institute, Ottawa, Ontario K1H 8L6, Canada; Departments of Biochemistry, Microbiology and Immunology, University of Ottawa, Ottawa, Ontario K1H8M5, Canada.
Keqin Yan, Regenerative Medicine Program, Ottawa Hospital Research Institute, Ottawa, Ontario K1H 8L6, Canada.
David J Picketts, Regenerative Medicine Program, Ottawa Hospital Research Institute, Ottawa, Ontario K1H 8L6, Canada; Departments of Biochemistry, Microbiology and Immunology, University of Ottawa, Ottawa, Ontario K1H8M5, Canada; Departments of Biochemistry, Microbiology and Immunology, Cellular and Molecular Medicine, University of Ottawa, Ottawa, Ontario K1H8M5, Canada; Department of Medicine, University of Ottawa, Ottawa, Ontario K1H8M5, Canada.
Funding
The work in this manuscript was funded by operating grants from the Canadian Institutes of Health Research (MOP142398) to DJP. The RNA-sequencing was deposited to the Gene Expression Omnibus (GEO) Database with the accession number GSE154700.
Authors’ Contributions
G.Z. maintained the mouse colonies and performed all experiments unless otherwise specified. K.Y. generated the ISH probes and performed the ISH. K.Y. repeated some IHC for the cortical layer markers and performed the layer-marker specific immunoblots. D.J.P. designed and supervised the project. D.J.P. and G.Z. wrote the manuscript with input from all authors.
References
- 1. D'Souza, L., Channakkar, A.S. and Muralidharan, B. (2021) Chromatin remodelling complexes in cerebral cortex development and neurodevelopmental disorders. Neurochem. Int., 147, 105055. [DOI] [PMC free article] [PubMed] [Google Scholar]
- 2. Clapier, C.R., Iwasa, J., Cairns, B.R. and Peterson, C.L. (2017) Mechanisms of action and regulation of ATP-dependent chromatin-remodelling complexes. Nat. Rev. Mol. Cell Biol., 18, 407–422. [DOI] [PMC free article] [PubMed] [Google Scholar]
- 3. Sokpor, G., Xie, Y., Rosenbusch, J. and Tuoc, T. (2017) Chromatin Remodeling BAF (SWI/SNF) Complexes in Neural Development and Disorders. Front. Mol. Neurosci., 10, 243. [DOI] [PMC free article] [PubMed] [Google Scholar]
- 4. Bogershausen, N. and Wollnik, B. (2018) Mutational landscapes and phenotypic spectrum of SWI/SNF-related intellectual disability disorders. Front. Mol. Neurosci., 11, 252. [DOI] [PMC free article] [PubMed] [Google Scholar]
- 5. Van Houdt, J.K., Nowakowska, B.A., Sousa, S.B., van Schaik, B.D., Seuntjens, E., Avonce, N., Sifrim, A., Abdul-Rahman, O.A., van den Boogaard, M.J., Bottani, A. et al. (2012) Heterozygous missense mutations in SMARCA2 cause Nicolaides-Baraitser syndrome. Nat. Genet., 44, 445, S441–449. [DOI] [PubMed] [Google Scholar]
- 6. Tsurusaki, Y., Okamoto, N., Ohashi, H., Kosho, T., Imai, Y., Hibi-Ko, Y., Kaname, T., Naritomi, K., Kawame, H., Wakui, K. et al. (2012) Mutations affecting components of the SWI/SNF complex cause Coffin-Siris syndrome. Nat. Genet., 44, 376–378. [DOI] [PubMed] [Google Scholar]
- 7. Lazzaro, M.A. and Picketts, D.J. (2001) Cloning and characterization of the murine Imitation Switch (ISWI) genes: differential expression patterns suggest distinct developmental roles for Snf2h and Snf2l. J. Neurochem., 77, 1145–1156. [DOI] [PubMed] [Google Scholar]
- 8. Goodwin, L.R. and Picketts, D.J. (2018) The role of ISWI chromatin remodeling complexes in brain development and neurodevelopmental disorders. Mol. Cell. Neurosci., 87, 55–64. [DOI] [PubMed] [Google Scholar]
- 9. Oppikofer, M., Bai, T., Gan, Y., Haley, B., Liu, P., Sandoval, W., Ciferri, C. and Cochran, A.G. (2017) Expansion of the ISWI chromatin remodeler family with new active complexes. EMBO Rep., 18, 1697–1706. [DOI] [PMC free article] [PubMed] [Google Scholar]
- 10. Li, D., Wang, Q., Gong, N.N., Kurolap, A., Feldman, H.B., Boy, N., Brugger, M., Grand, K., McWalter, K., Guillen Sacoto, M.J. et al. (2021) Pathogenic variants in SMARCA5, a chromatin remodeler, cause a range of syndromic neurodevelopmental features. Sci. Adv., 7, eabf2066. [DOI] [PMC free article] [PubMed] [Google Scholar]
- 11. Stankiewicz, P., Khan, T.N., Szafranski, P., Slattery, L., Streff, H., Vetrini, F., Bernstein, J.A., Brown, C.W., Rosenfeld, J.A., Rednam, S. et al. (2017) Haploinsufficiency of the chromatin remodeler BPTF causes syndromic developmental and speech delay, postnatal microcephaly, and dysmorphic features. Am. J. Hum. Genet., 101, 503–515. [DOI] [PMC free article] [PubMed] [Google Scholar]
- 12. Glinton, K.E., Hurst, A.C.E., Bowling, K.M., Cristian, I., Haynes, D., Adstamongkonkul, D., Schnappauf, O., Beck, D.B., Brewer, C., Parikh, A.S. et al. (2021) Phenotypic expansion of the BPTF-related neurodevelopmental disorder with dysmorphic facies and distal limb anomalies. Am. J. Med. Genet. A, 185, 1366–1378. [DOI] [PMC free article] [PubMed] [Google Scholar]
- 13. Barak, O., Lazzaro, M.A., Lane, W.S., Speicher, D.W., Picketts, D.J. and Shiekhattar, R. (2003) Isolation of human NURF: a regulator of Engrailed gene expression. EMBO J., 22, 6089–6100. [DOI] [PMC free article] [PubMed] [Google Scholar]
- 14. Tsukiyama, T. and Wu, C. (1995) Purification and properties of an ATP-dependent nucleosome remodeling factor. Cell, 83, 1011–1020. [DOI] [PubMed] [Google Scholar]
- 15. Kwon, S.Y., Grisan, V., Jang, B., Herbert, J. and Badenhorst, P. (2016) Genome-wide mapping targets of the metazoan chromatin remodeling factor NURF reveals nucleosome remodeling at enhancers, core promoters and gene insulators. PLoS Genet., 12, e1005969. [DOI] [PMC free article] [PubMed] [Google Scholar]
- 16. Qiu, Z., Song, C., Malakouti, N., Murray, D., Hariz, A., Zimmerman, M., Gygax, D., Alhazmi, A. and Landry, J.W. (2015) Functional interactions between NURF and Ctcf regulate gene expression. Mol. Cell. Biol., 35, 224–237. [DOI] [PMC free article] [PubMed] [Google Scholar]
- 17. Li, X., Wang, S., Li, Y., Deng, C., Steiner, L.A., Xiao, H., Wu, C., Bungert, J., Gallagher, P.G., Felsenfeld, G. et al. (2011) Chromatin boundaries require functional collaboration between the hSET1 and NURF complexes. Blood, 118, 1386–1394. [DOI] [PMC free article] [PubMed] [Google Scholar]
- 18. Koludrovic, D., Laurette, P., Strub, T., Keime, C., Le Coz, M., Coassolo, S., Mengus, G., Larue, L. and Davidson, I. (2015) Chromatin-remodelling complex NURF is essential for differentiation of adult melanocyte stem cells. PLoS Genet., 11, e1005555. [DOI] [PMC free article] [PubMed] [Google Scholar]
- 19. Landry, J.W., Banerjee, S., Taylor, B., Aplan, P.D., Singer, A. and Wu, C. (2011) Chromatin remodeling complex NURF regulates thymocyte maturation. Genes Dev., 25, 275–286. [DOI] [PMC free article] [PubMed] [Google Scholar]
- 20. Lazzaro, M.A., Pepin, D., Pescador, N., Murphy, B.D., Vanderhyden, B.C. and Picketts, D.J. (2006) The imitation switch protein SNF2L regulates steroidogenic acute regulatory protein expression during terminal differentiation of ovarian granulosa cells. Mol. Endocrinol., 20, 2406–2417. [DOI] [PubMed] [Google Scholar]
- 21. Yip, D.J., Corcoran, C.P., Alvarez-Saavedra, M., DeMaria, A., Rennick, S., Mears, A.J., Rudnicki, M.A., Messier, C. and Picketts, D.J. (2012) Snf2l regulates Foxg1-dependent progenitor cell expansion in the developing brain. Dev. Cell, 22, 871–878. [DOI] [PMC free article] [PubMed] [Google Scholar]
- 22. Xu, B., Cai, L., Butler, J.M., Chen, D., Lu, X., Allison, D.F., Lu, R., Rafii, S., Parker, J.S., Zheng, D. et al. (2018) The Chromatin remodeler BPTF activates a stemness gene-expression program essential for the maintenance of adult hematopoietic stem cells. Stem Cell Rep., 10, 675–683. [DOI] [PMC free article] [PubMed] [Google Scholar]
- 23. Frey, W.D., Chaudhry, A., Slepicka, P.F., Ouellette, A.M., Kirberger, S.E., Pomerantz, W.C.K., Hannon, G.J. and Dos Santos, C.O. (2017) BPTF maintains chromatin accessibility and the self-renewal capacity of mammary gland stem cells. Stem Cell Rep., 9, 23–31. [DOI] [PMC free article] [PubMed] [Google Scholar]
- 24. Richart, L., Pau E., C.-d.S., Rio-Machin, A., de Andres, M.P., Cigudosa, J.C., Lobo, V.J. and Real, F.X. (2016) BPTF is required for c-MYC transcriptional activity and in vivo tumorigenesis. Nat. Commun., 7, 10153. [DOI] [PMC free article] [PubMed] [Google Scholar]
- 25. Zhu, P., Wang, Y., He, L., Huang, G., Du, Y., Zhang, G., Yan, X., Xia, P., Ye, B., Wang, S. et al. (2015) ZIC2-dependent OCT4 activation drives self-renewal of human liver cancer stem cells. J. Clin. Invest., 125, 3795–3808. [DOI] [PMC free article] [PubMed] [Google Scholar]
- 26. Landry, J., Sharov, A.A., Piao, Y., Sharova, L.V., Xiao, H., Southon, E., Matta, J., Tessarollo, L., Zhang, Y.E., Ko, M.S. et al. (2008) Essential role of chromatin remodeling protein Bptf in early mouse embryos and embryonic stem cells. PLoS Genet., 4, e1000241. [DOI] [PMC free article] [PubMed] [Google Scholar]
- 27. Goller, T., Vauti, F., Ramasamy, S. and Arnold, H.H. (2008) Transcriptional regulator BPTF/FAC1 is essential for trophoblast differentiation during early mouse development. Mol. Cell. Biol., 28, 6819–6827. [DOI] [PMC free article] [PubMed] [Google Scholar]
- 28. Alvarez-Saavedra, M., De Repentigny, Y., Lagali, P.S., Raghu Ram, E.V., Yan, K., Hashem, E., Ivanochko, D., Huh, M.S., Yang, D., Mears, A.J. et al. (2014) Snf2h-mediated chromatin organization and histone H1 dynamics govern cerebellar morphogenesis and neural maturation. Nat. Commun., 5, 4181. [DOI] [PMC free article] [PubMed] [Google Scholar]
- 29. Berube, N.G., Mangelsdorf, M., Jagla, M., Vanderluit, J., Garrick, D., Gibbons, R.J., Higgs, D.R., Slack, R.S. and Picketts, D.J. (2005) The chromatin-remodeling protein ATRX is critical for neuronal survival during corticogenesis. J. Clin. Invest., 115, 258–267. [DOI] [PMC free article] [PubMed] [Google Scholar]
- 30. Gorski, J.A., Talley, T., Qiu, M., Puelles, L., Rubenstein, J.L. and Jones, K.R. (2002) Cortical excitatory neurons and glia, but not GABAergic neurons, are produced in the Emx1-expressing lineage. J. Neurosci., 22, 6309–6314. [DOI] [PMC free article] [PubMed] [Google Scholar]
- 31. Dai, M., Lu, J.J., Guo, W., Yu, W., Wang, Q., Tang, R., Tang, Z., Xiao, Y., Li, Z., Sun, W. et al. (2015) BPTF promotes tumor growth and predicts poor prognosis in lung adenocarcinomas. Oncotarget, 6, 33878–33892. [DOI] [PMC free article] [PubMed] [Google Scholar]
- 32. Young, K.G., Yan, K. and Picketts, D.J. (2019) C3aR signaling and gliosis in response to neurodevelopmental damage in the cerebellum. J. Neuroinflammation, 16, 135. [DOI] [PMC free article] [PubMed] [Google Scholar]
- 33. Leone, D.P., Srinivasan, K., Chen, B., Alcamo, E. and McConnell, S.K. (2008) The determination of projection neuron identity in the developing cerebral cortex. Curr. Opin. Neurobiol., 18, 28–35. [DOI] [PMC free article] [PubMed] [Google Scholar]
- 34. Toma, K. and Hanashima, C. (2015) Switching modes in corticogenesis: mechanisms of neuronal subtype transitions and integration in the cerebral cortex. Front. Neurosci., 9, 274. [DOI] [PMC free article] [PubMed] [Google Scholar]
- 35. Dennis, D.J., Wilkinson, G., Li, S., Dixit, R., Adnani, L., Balakrishnan, A., Han, S., Kovach, C., Gruenig, N., Kurrasch, D.M. et al. (2017) Neurog2 and Ascl1 together regulate a postmitotic derepression circuit to govern laminar fate specification in the murine neocortex. Proc. Natl. Acad. Sci. U. S. A., 114, e4934–e4943. [DOI] [PMC free article] [PubMed] [Google Scholar]
- 36. Alvarez-Saavedra, M., Yan, K., De Repentigny, Y., Hashem, L.E., Chaudary, N., Sarwar, S., Yang, D., Ioshikhes, I., Kothary, R., Hirayama, T. et al. (2019) Snf2h drives chromatin remodeling to prime upper layer cortical neuron development. Front. Mol. Neurosci., 12, 243. [DOI] [PMC free article] [PubMed] [Google Scholar]
- 37. Huh, M.S., Ivanochko, D., Hashem, L.E., Curtin, M., Delorme, M., Goodall, E., Yan, K. and Picketts, D.J. (2016) Stalled replication forks within heterochromatin require ATRX for protection. Cell Death Dis., 7, e2220. [DOI] [PMC free article] [PubMed] [Google Scholar]
- 38. Chen, B., Wang, S.S., Hattox, A.M., Rayburn, H., Nelson, S.B. and McConnell, S.K. (2008) The Fezf2-Ctip2 genetic pathway regulates the fate choice of subcortical projection neurons in the developing cerebral cortex. Proc. Natl. Acad. Sci. U. S. A., 105, 11382–11387. [DOI] [PMC free article] [PubMed] [Google Scholar]
- 39. Kwan, K.Y., Lam, M.M., Krsnik, Z., Kawasawa, Y.I., Lefebvre, V. and Sestan, N. (2008) SOX5 postmitotically regulates migration, postmigratory differentiation, and projections of subplate and deep-layer neocortical neurons. Proc. Natl. Acad. Sci. U. S. A., 105, 16021–16026. [DOI] [PMC free article] [PubMed] [Google Scholar]
- 40. Srinivasan, K., Leone, D.P., Bateson, R.K., Dobreva, G., Kohwi, Y., Kohwi-Shigematsu, T., Grosschedl, R. and McConnell, S.K. (2012) A network of genetic repression and derepression specifies projection fates in the developing neocortex. Proc. Natl. Acad. Sci. U. S. A., 109, 19071–19078. [DOI] [PMC free article] [PubMed] [Google Scholar]
- 41. McKenna, W.L., Betancourt, J., Larkin, K.A., Abrams, B., Guo, C., Rubenstein, J.L. and Chen, B. (2011) Tbr1 and Fezf2 regulate alternate corticofugal neuronal identities during neocortical development. J. Neurosci., 31, 549–564. [DOI] [PMC free article] [PubMed] [Google Scholar]
- 42. Alcamo, E.A., Chirivella, L., Dautzenberg, M., Dobreva, G., Farinas, I., Grosschedl, R. and McConnell, S.K. (2008) Satb2 regulates callosal projection neuron identity in the developing cerebral cortex. Neuron, 57, 364–377. [DOI] [PubMed] [Google Scholar]
- 43. Richart, L., Real, F.X. and Sanchez-Arevalo Lobo, V.J. (2016) c-MYC partners with BPTF in human cancer. Mol. Cell. Oncol., 3, e1152346. [DOI] [PMC free article] [PubMed] [Google Scholar]
- 44. Kwon, A.T., Arenillas, D.J., Worsley Hunt, R. and Wasserman, W.W. (2012) oPOSSUM-3: advanced analysis of regulatory motif over-representation across genes or ChIP-Seq datasets, G3 (Bethesda), 2, 987–1002. [DOI] [PMC free article] [PubMed] [Google Scholar]
- 45. Sokpor, G., Castro-Hernandez, R., Rosenbusch, J., Staiger, J.F. and Tuoc, T. (2018) ATP-dependent chromatin remodeling during cortical neurogenesis. Front. Neurosci., 12, 226. [DOI] [PMC free article] [PubMed] [Google Scholar]
- 46. Tuoc, T.C., Boretius, S., Sansom, S.N., Pitulescu, M.E., Frahm, J., Livesey, F.J. and Stoykova, A. (2013) Chromatin regulation by BAF170 controls cerebral cortical size and thickness. Dev. Cell, 25, 256–269. [DOI] [PubMed] [Google Scholar]
- 47. Laguesse, S., Creppe, C., Nedialkova, D.D., Prevot, P.P., Borgs, L., Huysseune, S., Franco, B., Duysens, G., Krusy, N., Lee, G. et al. (2015) A dynamic unfolded protein response contributes to the control of cortical neurogenesis. Dev. Cell, 35, 553–567. [DOI] [PubMed] [Google Scholar]
- 48. Wang, X.L., Ma, Y.X., Xu, R.J., Ma, J.J., Zhang, H.C., Qi, S.B., Xu, J.H., Qin, X.Z., Zhang, H.N., Liu, C.M. et al. (2020) c-Myc controls the fate of neural progenitor cells during cerebral cortex development. J. Cell. Physiol., 235, 4011–4021. [DOI] [PubMed] [Google Scholar]
- 49. Bormuth, I., Yan, K., Yonemasu, T., Gummert, M., Zhang, M., Wichert, S., Grishina, O., Pieper, A., Zhang, W., Goebbels, S. et al. (2013) Neuronal basic helix-loop-helix proteins Neurod2/6 regulate cortical commissure formation before midline interactions. J. Neurosci., 33, 641–651. [DOI] [PMC free article] [PubMed] [Google Scholar]
- 50. Han, S., Dennis, D.J., Balakrishnan, A., Dixit, R., Britz, O., Zinyk, D., Touahri, Y., Olender, T., Brand, M., Guillemot, F. et al. (2018) A non-canonical role for the proneural gene Neurog1 as a negative regulator of neocortical neurogenesis. Development, 145, dev157719. [DOI] [PMC free article] [PubMed] [Google Scholar]
- 51. Tutukova, S., Tarabykin, V. and Hernandez-Miranda, L.R. (2021) The role of neurod genes in brain development, function, and disease. Front. Mol. Neurosci., 14, 662774. [DOI] [PMC free article] [PubMed] [Google Scholar]
- 52. Uittenbogaard, M., Baxter, K.K. and Chiaramello, A. (2010) NeuroD6 genomic signature bridging neuronal differentiation to survival via the molecular chaperone network. J. Neurosci. Res., 88, 33–54. [DOI] [PMC free article] [PubMed] [Google Scholar]
- 53. Tsyporin, J., Tastad, D., Ma, X., Nehme, A., Finn, T., Huebner, L., Liu, G., Gallardo, D., Makhamreh, A., Roberts, J.M. et al. (2021) Transcriptional repression by FEZF2 restricts alternative identities of cortical projection neurons. Cell Rep., 35, 109269. [DOI] [PMC free article] [PubMed] [Google Scholar]
- 54. Baranek, C., Dittrich, M., Parthasarathy, S., Bonnon, C.G., Britanova, O., Lanshakov, D., Boukhtouche, F., Sommer, J.E., Colmenares, C., Tarabykin, V. et al. (2012) Protooncogene Ski cooperates with the chromatin-remodeling factor Satb2 in specifying callosal neurons. Proc. Natl. Acad. Sci. U. S. A., 109, 3546–3551. [DOI] [PMC free article] [PubMed] [Google Scholar]
- 55. Ahmed, R., Sarwar, S., Hu, J., Cardin, V., Qiu, L.R., Zapata, G., Vandeleur, L., Yan, K., Lerch, J.P., Corbett, M.A. et al. (2021) Transgenic mice with an R342X mutation in Phf6 display clinical features of Borjeson-Forssman-Lehmann Syndrome. Hum. Mol. Genet., 30, 575–594. [DOI] [PMC free article] [PubMed] [Google Scholar]
- 56. Wingett, S.W. and Andrews, S. (2018) FastQ screen: a tool for multi-genome mapping and quality control. F1000Res, 7, 1338. [DOI] [PMC free article] [PubMed] [Google Scholar]
- 57. Bolger, A.M., Lohse, M. and Usadel, B. (2014) Trimmomatic: a flexible trimmer for Illumina sequence data. Bioinformatics, 30, 2114–2120. [DOI] [PMC free article] [PubMed] [Google Scholar]
- 58. Kim, D., Langmead, B. and Salzberg, S.L. (2015) HISAT: a fast spliced aligner with low memory requirements. Nat. Methods, 12, 357–360. [DOI] [PMC free article] [PubMed] [Google Scholar]
- 59. Tanner, R.M., Stanford, W.L. and Perkins, T.J. (2020) ExCluster: ExCluster robustly detects differentially expressed exons between two conditions of RNA-seq data, requiring at least two independent biological replicates per condition. R Package Version, 1(8). [Google Scholar]
- 60. Bray, N.L., Pimentel, H., Melsted, P. and Pachter, L. (2016) Near-optimal probabilistic RNA-seq quantification. Nat. Biotechnol., 34, 525–527. [DOI] [PubMed] [Google Scholar]
- 61. Patro, R., Duggal, G., Love, M.I., Irizarry, R.A. and Kingsford, C. (2017) Salmon provides fast and bias-aware quantification of transcript expression. Nat. Methods, 14, 417–419. [DOI] [PMC free article] [PubMed] [Google Scholar]
- 62. Love, M.I., Huber, W. and Anders, S. (2014) Moderated estimation of fold change and dispersion for RNA-seq data with DESeq2. Genome Biol., 15, 550. [DOI] [PMC free article] [PubMed] [Google Scholar]
- 63. Raudvere, U., Kolberg, L., Kuzmin, I., Arak, T., Adler, P., Peterson, H. and Vilo, J. (2019) g:Profiler: a web server for functional enrichment analysis and conversions of gene lists (2019 update). Nucleic Acids Res., 47, W191–W198. [DOI] [PMC free article] [PubMed] [Google Scholar]
- 64. Huang da, W., Sherman, B.T. and Lempicki, R.A. (2009) Systematic and integrative analysis of large gene lists using DAVID bioinformatics resources. Nat. Protoc., 4, 44–57. [DOI] [PubMed] [Google Scholar]
- 65. Yu, G., Wang, L.G., Yan, G.R. and He, Q.Y. (2015) DOSE: an R/Bioconductor package for disease ontology semantic and enrichment analysis. Bioinformatics, 31, 608–609. [DOI] [PubMed] [Google Scholar]
- 66. Wickham, H. (2009) ggplot2: Elegant Graphics for Data Analysis. Springer, New York. [Google Scholar]
Associated Data
This section collects any data citations, data availability statements, or supplementary materials included in this article.