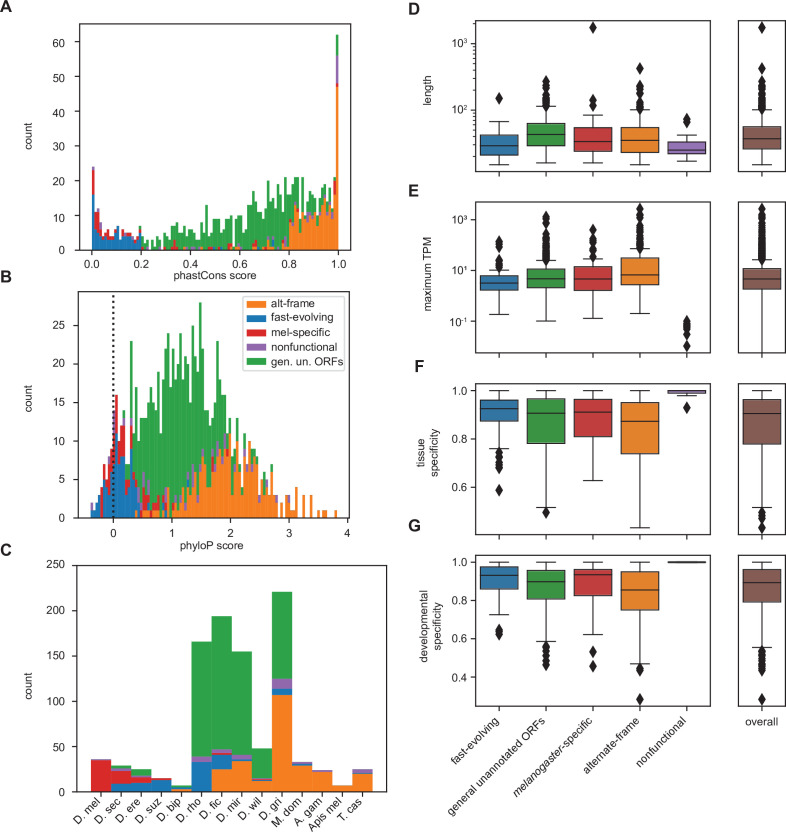
Figure 5. Differences between inferred classes recapitulate expected trends in age and conservation and reveal surprising trends in lengths and expression.
(A) As expected, phastCons conservation scores vary by class. Scores near 0 indicate low conservation, while scores near 1 indicate high conservation. Note that fast-evolving and melanogaster-specific loci have dramatically lower conservation, whereas alternate-frame loci are very well conserved. (B) Despite not being included as a variable in latent class analysis (LCA), phyloP conservation scores also vary by class. Scores below 0 indicate potential fast evolution (acceleration), while scores above 0 indicate conservation. Note that the lowest scores predominantly occur in fast-evolving and melanogaster-specific loci and that alternate-frame loci remain the best conserved. (C) Distribution of phylostratigraphically inferred gene ages by inferred latent class. (D) Class variations in length are generally minimal, with the exception of general unannotated open reading frames (ORFs) being slightly longer than average, and fast-evolving and nonfunctional loci being shorter than average. (E) Maximum observed transcription across all FlyAtlas2 and modENCODE samples varies by class. (F) Tissue specificity (tau) calculated from FlyAtlas2 data shows that nonfunctional and fast-evolving loci are the most specific, with alternate-frame loci the least. (G) Developmental specificity (tau) calculated from modENCODE data similarly shows that nonfunctional and fast-evolving loci are the most specific, with alternate-frame loci the least.


