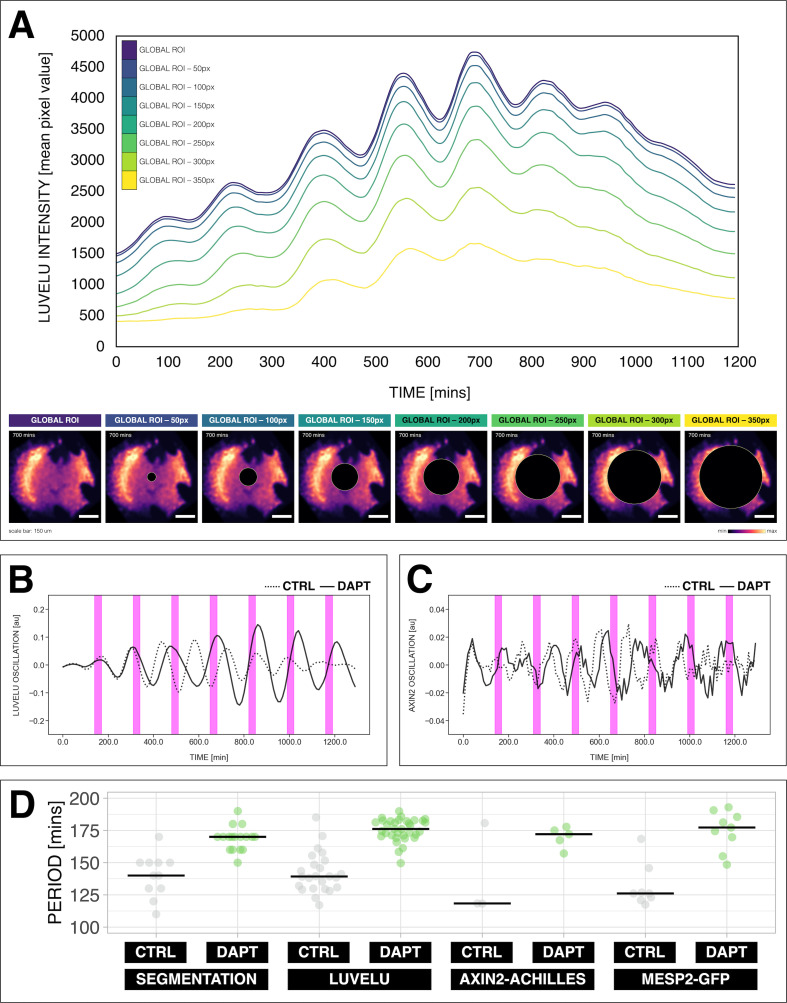
Figure 2. Quantifying the segmentation clock rhythm.
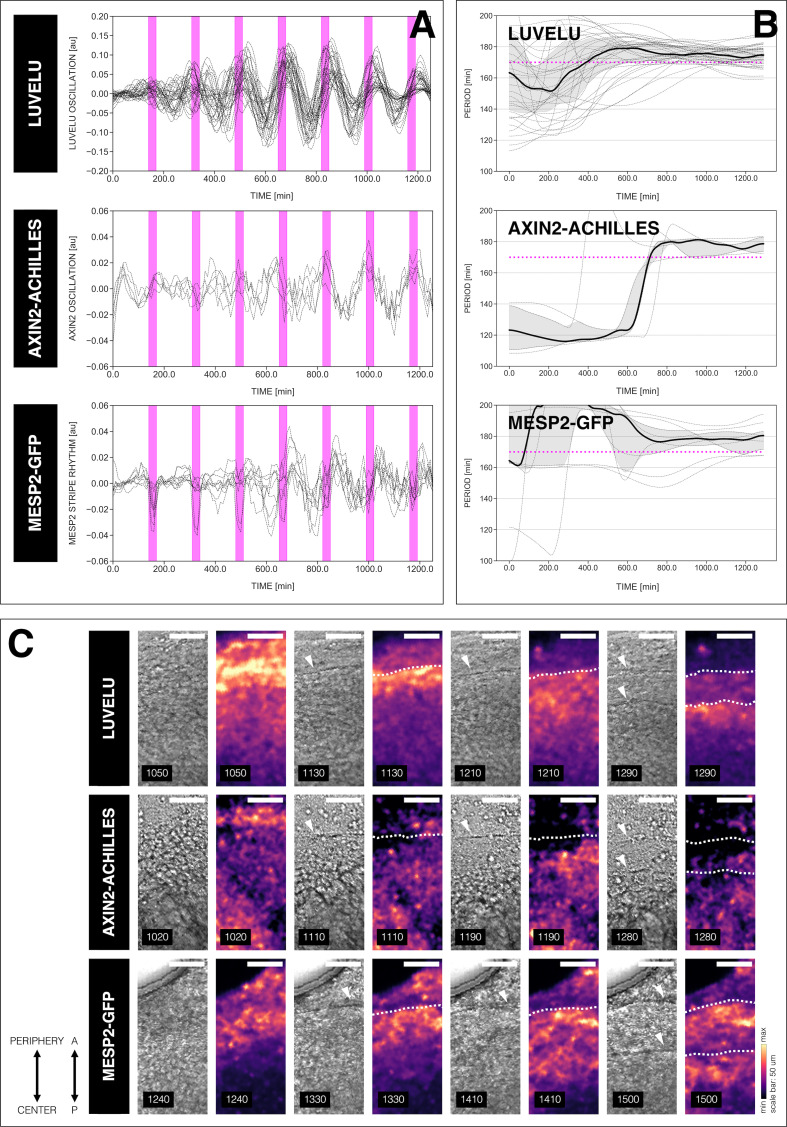
(A) Comparison of measurements obtained from a region of interest (ROI) spanning the entire field (‘global ROI’) with those obtained from ROIs in which central regions of increasing size were excluded. The excluded area is represented in terms of the diameter (in pixels, px) of a circular region at the center. The corresponding timeseries are shown in the top panel and marked with different colors. Bottom panel shows the global ROI and excluded region in a snapshot of signal of LuVeLu, a dynamic reporter of Notch signaling driven from the Lfng promoter (Aulehla et al., 2008), in a 2D-assay at 700 min from the start of the experiment. Henceforth, timeseries is obtained using ‘global ROI’, unless otherwise specified. (B) Detrended timeseries of the segmentation clock (obtained using global ROI) in 2D-assays, which express the LuVeLu reporter, subjected to 170 min periodic pulses (magenta bars) of either 2 µM DAPT (in solid line) or DMSO (for control, in dashed line). Timelapse movie and corresponding timeseries from global ROI are available at https://youtu.be/fRHsHYU_H2Q. (C) Detrended timeseries of Axin2-linker-Achilles reporter in 2D-assays, subjected to 170 min periodic pulses (magenta bars) of either 2 µM DAPT (in solid line) or DMSO (for control, in dashed line). (D) Period of morphological segment boundary formation, LuVeLu oscillation, Axin2-linker-Achilles oscillation, and rhythm of Mesp2-GFP in 2D-assays subjected to 170 min periodic pulses of either 2 µM DAPT (or DMSO for control). Each sample is represented as a dot, the median is denoted as a solid horizontal line. For morphological segment boundary formation, period was determined by taking the time difference between two consecutive segmentation events (for CTRL: 17 segmentation events in six samples from four independent experiments, and for DAPT: 24 segmentation events in seven samples from five independent experiments, with p-value < 0.001) in the brightfield channel. For period quantifications based the reporters, the mean period per sample from 650 to 850 min after start of the experiment was plotted. LuVeLu: (CTRL: n=24 and N=7) and (DAPT: n=34 and N=8) with p-value < 0.001, Axin2-linker-Achilles: (CTRL: n=3 and N=1) and (DAPT: n=5 and N=1) with p-value = 0.107, Mesp2-GFP: (CTRL: n=8 and N=3) and (DAPT: n=9 and N=3) with p-value = 0.01. Data were visualized using PlotsOfData (Postma and Goedhart, 2019). To calculate the p-value, two-tailed test for absolute difference between medians was done via a randomization method using PlotsOfDifferences (Goedhart, 2019). The timeseries and corresponding period evolution during entrainment, obtained from wavelet analysis, are in Figure 2—figure supplement 1A and Figure 2—figure supplement 1B, respectively. Timelapse movies are available at https://youtu.be/edFczx_-9hM and https://youtu.be/tQeBk0_U_Qo, respectively.


