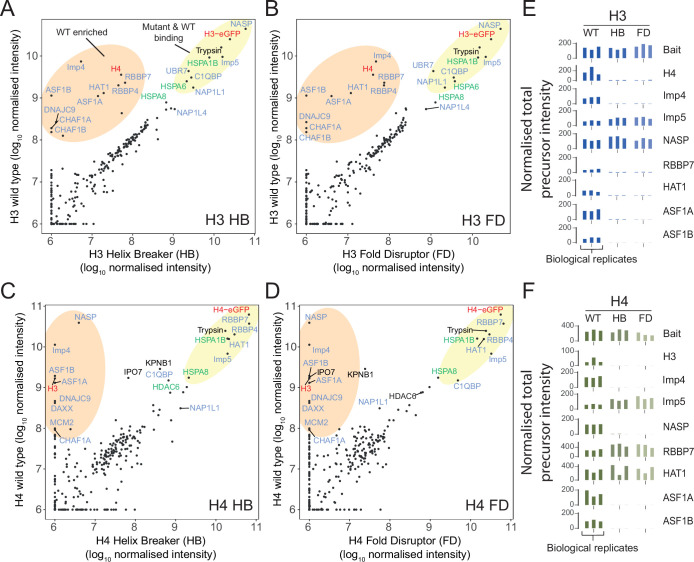
Figure 2. Proteomic analysis of wild-type (WT) and monomeric histone mutants.
(A–D) Mutant versus WT scatter plots of normalised total precursor intensity from H3 vs. HB (A), H3 vs. FD (B), H4 vs. HB (C), and H4 vs. FD (D). Average of three experiments. By plotting mutants versus WT, factors that interact at similar levels will lie on the diagonal, with those that have preference for the dimer or monomer to fall above or below the diagonal, respectively. Circled regions show factors that are enriched for the WT (orange) or that are equally enriched on the WT and mutant (yellow). Previously reported histone-binding proteins are coloured in blue, with HSC70 family members coloured in green. Histones are coloured in red. (E, F) Alternative representation of proteomics data showing quantitative values (normalised total precursor intensity) on a linear scale (1 × 10⁶) for each biological replicate of key factors identified in (A–D). HB, helix-breaker mutation; FD, fold-disruptor mutation.

