Abstract
Purpose
The aim of this study was to characterize a new generation stationary digital breast tomosynthesis system with higher tube flux and increased angular span over a first generation system.
Methods
The linear CNT x‐ray source was designed, built, and evaluated to determine its performance parameters. The second generation system was then constructed using the CNT x‐ray source and a Hologic gantry. Upon construction, test objects and phantoms were used to characterize system resolution as measured by the modulation transfer function (MTF), and artifact spread function (ASF).
Results
The results indicated that the linear CNT x‐ray source was capable of stable operation at a tube potential of 49 kVp, and measured focal spot sizes showed source‐to‐source consistency with a nominal focal spot size of 1.1 mm. After construction, the second generation (Gen 2) system exhibited entrance surface air kerma rates two times greater the previous s‐DBT system. System in‐plane resolution as measured by the MTF is 7.7 cycles/mm, compared to 6.7 cycles/mm for the Gen 1 system. As expected, an increase in the z‐axis depth resolution was observed, with a decrease in the ASF from 4.30 mm to 2.35 mm moving from the Gen 1 system to the Gen 2 system as result of an increased angular span.
Conclusions
The results indicate that the Gen 2 stationary digital breast tomosynthesis system, which has a larger angular span, increased entrance surface air kerma, and faster image acquisition time over the Gen 1 s‐DBT system, results in higher resolution images. With the detector operating at full resolution, the Gen 2 s‐DBT system can achieve an in‐plane resolution of 7.7 cycles per mm, which is better than the current commercial DBT systems today, and may potentially result in better patient diagnosis.
Keywords: breast cancer imaging, CNT x‐ray source, digital tomosynthesis, s‐DBT
1. Introduction
Mammography screening is the current gold standard for the early detection of breast cancer, and through randomized trials, has shown to reduce mortality.1 However, since mammography is a 2D imaging modality, it is inherently limited due to the superimposition of both normal and pathological tissue. The overlapping of tissue consequently makes it difficult to differentiate between malignant lesions and normal tissue, lowering the sensitivity and specificity of this imaging modality.2 As a means to overcome the limitations of 2D mammography, tomographic imaging methods were introduced. Digital breast tomosynthesis (DBT), a relatively new imaging modality, is an imaging technique that produces pseudo 3D images of the breast from multiple low dose x‐ray projections over a limited angle.3 This reduces tissue overlap, making lesions more conspicuous with the additional depth information. Recent studies have shown that DBT may be viable as a stand‐alone imaging modality,4 and also a significant increase in cancer detection when DBT is added to 2D mammography.5, 6 However, DBT has not shown an improvement in the imaging of microcalcifications (MCs).7
Currently, three DBT systems are FDA approved for use in the United States (Hologic, GE, and Siemens).8 These DBT systems utilize an x‐ray tube with a single source that moves around the breast in a fixed angular span in either continuous motion (CM) or a step‐and‐shoot motion (SSM). For continuous motion (e.g., Hologic Selenia Dimensions DBT system), the x‐ray tube is moved continuously along the arc and projection images are taken simultaneously at set positions. The main advantage of this type of acquisition is the imaging speed. However, there is the disadvantage of focal spot burring due to tube motion during imaging. Contrary to CM, the SSM (e.g., GE SenoClaire DBT system) stops at each designated position before acquisition of a projection image, which avoids focal spot blur due to motion. Although there is no motion due to tube travel, the abrupt stop may introduce residual vibrations which may introduce focal spot blur, affecting the visibility of microcalcifications.9 Another disadvantage of SSM is the long imaging times, which increases the probability for patient motion and overall degradation in image quality.2 Therefore, in all DBT systems that require mechanical motion of the x‐ray source during the scan, the image quality may be limited either due to the tube motion or the long scan time. This may lead to the unfavorable decrease in MC visibility comparing the DBT to 2D mammography. MC visibility is instrumental in determination of malignancy of lesions in breast cancer diagnosis. Characteristics such as distribution, morphology, and size are important for determining malignancy. As a result, FDA approved systems are required to be used in conjunction with 2D mammography.10 Recently, the FDA has approved synthetic 2D images together with DBT as an alternative solution to patients concerned with radiation exposure.
To overcome the limitations of moving gantry DBT systems, we developed and demonstrated a first generation stationary digital breast tomosynthesis (s‐DBT) system that uses a linear carbon nanotube (CNT) x‐ray source array.11 The Gen 1 s‐DBT (Gen 1 s‐DBT) system consist of 31 CNT x‐ray sources linearly distributed over a 30° angular span that are electronically controlled, and can be independently triggered.11, 12 Since the stationary sources are not subject to focal spot blur, and images can be acquired rapidly, the in‐plane system resolution is improved. In addition, image acquisition time is independent of angular span since there is no motion, allowing for large angular spans, thus higher in‐depth resolution, without increasing the scan times. The improved resolution of the first generation s‐DBT system over CM DBT has been demonstrated with image evaluation phantoms and a human specimen study.11, 13, 14, 15, 16 The first generation s‐DBT is current undergoing clinical trials at the University of North Carolina Cancer Hospital.
There are some limitations of the Gen 1 s‐DBT system. Those include limited tube flux, limiting x‐ray energy, and the maximum angular span of 30°. Limited tube flux results in patient compression thickness limitations, as sufficient dose to patients with breast thicknesses over 6.5 cm cannot be delivered in suitable scan times (4 s). Patients with compressions larger than 6.5 cm can be imaged at longer scan times, however, this is unfavorable as it introduces greater probability for patient motion which degrades image quality. Moreover, it does not allow the investigation of dual energy imaging as higher tube flux is required with the use of high and low energy filters. Acquisition geometry parameters such as total angular coverage, and number of projections are of particular importance in DBT as reconstruction image quality is dependent on these parameters.17, 18 Previous studies have indicated that an increase in angular span coupled with an optimal amount of projection views increases depth resolution.15, 17, 18, 19
Hypothetically, construction of a new s‐DBT system with higher tube flux, and a wider angular span would result in a system capable of decreased image acquisition time, inclusion of patients with thick and dense breast, and increased depth resolution. Here, we report the characterization results of the Gen 2 system s‐DBT system with higher tube flux, higher x‐ray energy, and larger angular span.
2. Methods and materials
2.A. Digital breast tomosynthesis systems
2.A.1. Second generation s‐DBT system
The Gen 2 s‐DBT system (Gen 2 s‐DBT) was designed to be comparable to the Gen 1 system except for having 21 sources, and a larger angular span of 35°. The x‐ray output and beam quality were measured. In‐plane spatial resolution was quantified by determining the system modulation transfer function (MTF), and the system in‐depth resolution was evaluated by means of measuring the artifact spread function (ASF). The reconstructed plane MTF and ASF were compared to measurements taken on the Gen 1 s‐DBT system (Gen 1 s‐DBT), and the commercial GE SenoClaire DBT system.
Distributed CNT x‐ray source array
The carbon nanotube x‐ray source array in Gen 2 s‐DBT comprises of 21 linearly distributed x‐ray focal spots along 473 mm. At the linear source array to object distance of 745 mm, it provides 35° coverage, see Fig. 1. The linear distribution of the sources varies to provide an equiangular spacing of 1.6° between neighboring focal spots. Each x‐ray source consists of a CNT cathode, a gate, an individual tungsten anode with a 16° tilt, and focusing electrodes. The x‐ray tube window is made of 0.5 mm Al, which provides a vacuum seal, and also serves as the inherent spectrum filter. Two ion pumps attached to the CNT x‐ray source array maintain and allow for the monitoring of pressure.
Figure 1.
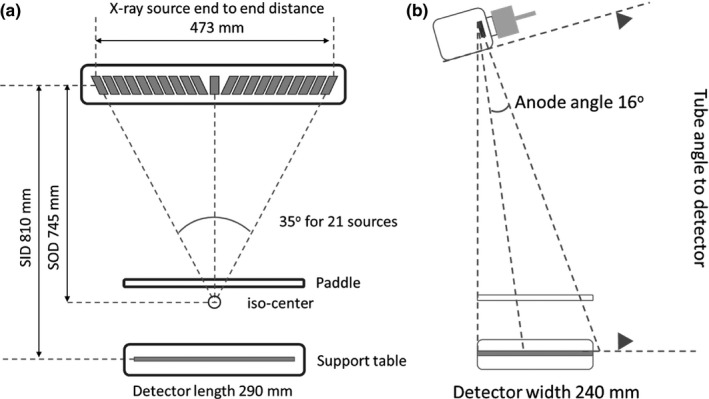
Geometry of the Gen 2 s‐DBT system (a) front view (b) side view.
Second generation s‐DBT system construction
The Gen 2 s‐DBT system, as shown in Fig. 2, was assembled by substituting the original single thermionic x‐ray source on the Hologic Selenia Dimensions DBT (Hologic Bedford, MA, USA) system with the CNT x‐ray source array (XinRay Systems LLC, Research Triangle Park, NC, USA) described in the previous section. The CNT x‐ray tube is mounted at an 810 mm source to image (detector) distance (SID). The entire tube is rotated to 6° away from the chest wall as illustrated in Fig. 1(b). The CNT x‐ray linear source array was electronically incorporated with the Hologic Selenia Dimensions gantry allowing each source to be controlled individually.
Figure 2.
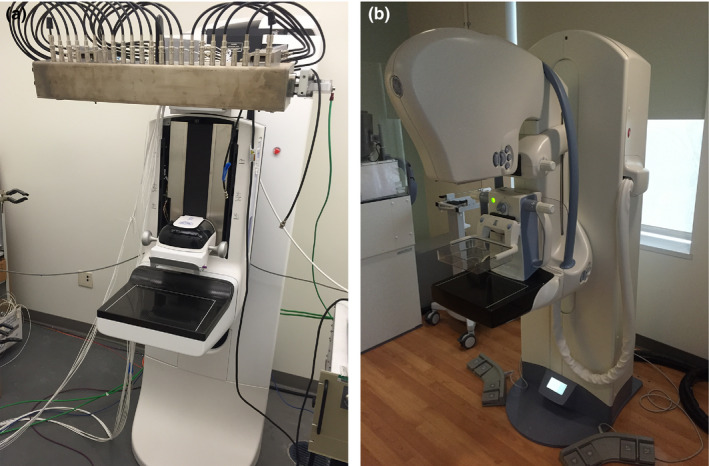
(a) s‐DBT system with integrated CNT x‐ray source array (XinRay Systems LLC, Research Triangle Park, NC) with 21 x‐ray sources. (b) GE SenoClaire system that utilizes nine projection images over a 25° angular span. [Color figure can be viewed at wileyonlinelibrary.com]
The electronic interface comprises of a specially designed and constructed electronic control system (ECS) with an embedded cathode power supply, and an anode power supply (Spellman STR50P6, Hauppauge, NY, USA). The ECS allows for manipulation in the number of sources used and its sequence, cathode current, and source exposure time.11 An in house graphics user interface (GUI) coupled with a LabVIEW program were used to communicate with the detector of the Selenia Dimensions gantry, permitting images to be acquired using the Selenia Dimensions workstation. The detector for the Selenia Dimensions work station operates in two modes: 2 × 2 binning mode (140 μm pixel size), and full resolution mode (70 μm pixel size).
System collimation
The x‐ray beams are collimated using an external collimator. The collimator is designed to ensure the x‐ray field fully covers the flat panel detector, not extending beyond 2% of the source‐imaging‐plane distance (SID), along the length and width of the detector, keeping within the Mammography Quality Standards Act and Program (MQSA) regulations. The external collimator was designed specifically for the Gen 2 s‐DBT system. It is constructed of 2.5 mm thick stainless steel, spanning the length of the x‐ray tube window (500 mm) with 21 individual apertures.
2.A.2. GE Senographe SenoClaire DBT system
The GE SenoClaire DBT system was used for comparing system resolution of the Gen 2 s‐DBT system with a rotating gantry DBT system. The SenoClaire DBT system uses an Rh target/filter combination with a 100 um detector pixel size. For the tomosynthesis acquisition, the system takes 9 projection images over a 25° angular span. The GE system uses a hybrid reconstruction method, adaptive statistical iterative reconstruction (ASIR).
2.B. X‐ray output and beam quality
The output and beam quality of the x‐ray source array were measured for the Gen 2 s‐DBT system. The entrance surface air kerma was measured using a dosimeter (Radcal Accu ‐Pro 9096) and ion chamber (Radcal 10 × 6‐6 M Mammography Ion Chamber Sensor). The ion chamber was fastened to the underside of the compression paddle, centered in the scanning direction and 4 cm away from the chest wall. The paddled was fixed at a height of 4.2 cm. To investigate the x‐ray tube potential on the entrance surface air kerma, the total accumulated dose was measured for x‐ray tube voltages ranging from 20 to 40 kVp in increments of 5 kVp. A constant total exposure of 29.5 mAs was used for the acquisition of all total dose measurements. The entrance surface air kerma measurements were repeated three times for each setting. The average of the total accumulated dose for each tube voltage setting was divided by the total exposure to determine the dose rate.
The beam quality x‐ray source array was determined by measuring the half value layer (HVL) of aluminum and comparing to the standards set by the Mammography Quality Standards Act Regulations (MQSA). Aluminum alloy sheets of different thicknesses were used as additional filtration, and placed over the mammography probe. Dose measurements were collected three times for each aluminum thickness and the average dose was used in the calculation of the dose rate. At a constant total tube potential of 30 kVp and 1.55 mAs per source, the measured dose rate was plotted against thickness of Al alloy sheets.
2.C. X‐ray focal spot size measurement
The pinhole method was used for the measurement of the focal spot size for each source in the array following the European standards (EN 12543‐2). A 1.5 mm thick gold sheet, with a 100 μm diameter pinhole was used for the measurement. The pinhole phantom and CsI based flat panel detector (C7940DK‐02 Hamamatsu Photonics, Japan) were mounted to apparatus that allowed for rotation about the iso‐center. The pinhole phantom was placed between the source and detector, and carefully aligned with each focal spot before imaging (see Fig. 3). Images were blank and gain offset corrected, and magnification factors were calculated based on the magnification in size of the pinhole assembly.
Figure 3.
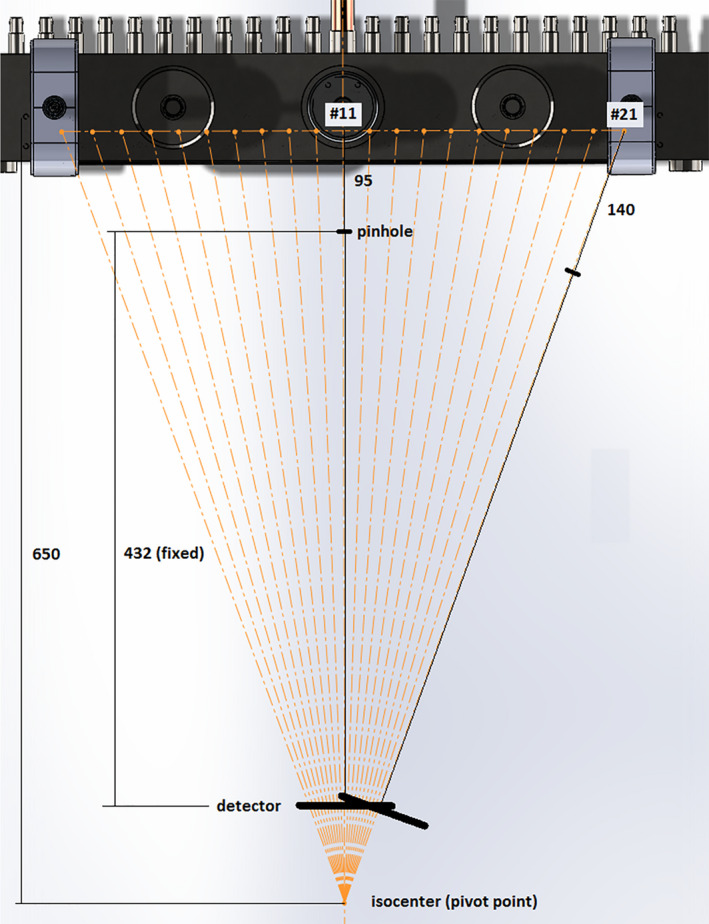
Schematic diagram of the apparatus for pinhole imaging used for the calculation of the focal spot size of the second generation linear source array. [Color figure can be viewed at wileyonlinelibrary.com]
2.D. Geometry calibration
The limited amount of data available for the reconstruction of DBT datasets requires an accurate geometry calibration procedure for accurate reconstruction.20 The geometry calibration procedure involves determining the precise position of focal spots relative to the detector.21 Geometric relationships between each source and its relative position to the detector were determined by imaging a calibration phantom that contains metal balls with known geometry. Projection images of the geometry phantom were taken at different heights and processed to determine their points of intersection using a statistical model based optimization method to determine the coordinates of each source relative to the center of the detector in 3D space.22, 23
For the z coordinates of the focal spot, magnification factors for the known distance between the steel balls in top and the bottom plane of the phantom were used to determine the SID distance for each focal spot.23
2.E. Image reconstruction
Image reconstructions were conducted using a commercial reconstruction system from Real Time Tomosynthesis (RTT version 3.4.4.38793; Villanova, PA, USA) and an in‐house iterative reconstruction package utilizing adapted fan‐beam volume reconstruction (AFVR), specifically developed for stationary tomosynthesis systems with the linear source array. The RTT software package utilizes a filtered back projection method (FBP) method, which is fast and allows for real time reconstruction.24 The AFVR reconstruction method uses a simultaneous algebraic reconstruction technique (SART) with 20 iterations, the reconstruction takes approximately 10 minutes on a desktop equipped with a six‐cores Intel i7 CPU.25
2.F. System modulation transfer function
In this study, the MTF was measured using a slightly slanted (approximately 2° in the direction perpendicular to the chest wall) MTF test object parallel to the plane of the detector. The MTF test object consists of two 50 μm tungsten wires orthogonal to each other. The wires in the test object images were used to sample multiple line spread functions (LSFs), which were transformed into a single oversampled LSF using the calculated angle of slant of the wire perpendicular to the measured direction.26 The oversampled LSF was then fitted to a Gaussian function for removal of noise, and the MTF calculated by taking the discreet Fourier transform of the fitted Gaussian. As the figure of merit, the corresponding frequency at 10% of the MTF was taken as the in‐plane resolution.
2.F.1. Projection images MTF
The central projection images (source 16 and 11 for first and second s‐DBT, and 0° for commercial DBT systems) were analyzed for each DBT system. In each case, the section of the wire in the central region, 4 cm away from the chest wall was used to generate the LSF. For comparison between the s‐DBT systems and the commercial DBT systems, only the scanning direction was analyzed. For the Gen 2 s‐DBT system, the MTF at different compression heights in both scanning and chest wall directions were analyzed.
2.F.2. Reconstructed in‐focus plane MTF
No post processing filters were applied upon reconstruction. The reconstructed in‐focus slice for the 40 mm compression thickness was analyzed for system spatial resolution in the scanning direction. The LSF was generated for the wire perpendicular to the scanning direction, in the central region of the breast paddle, and 4 cm away from the chest wall. For the GE system, the reconstructed data of the test object was not available; therefore it was left out of the reconstructed plane MTF analysis.
2.G. Phantom imaging
For image quality evaluation, an American College of radiology (ACR) mammography accreditation phantom (CIRS Model 015) was imaged and reconstructed into tomosynthesis slices. The ACR phantom contains of aluminum oxide (AL2O3) specks ranging from 0.54 to 0.16 mm in diameter, masses ranging from 2 to 0.25 mm in thickness, and nylon fibers that range from 1.56 to 0.4 mm in diameter. The projection images were acquired at 30 kVp and a total entrance surface air kerma of approximately 5.80 mGy for both s‐DBT systems. The automatic exposure control (AEC) was used when imaging with the GE SenoClaire DBT, and Hologic Selenia Dimensions system.
2.H. Artifact spread function
The depth resolution of the DBT system is quantified by measuring the artifact spread function (ASF) which is defined as the ratio between the contrast of the object out of the focus plane, to that of the respective object in the focal plane.27, 28 For the ASF measurement of the Gen 2 system, the ACR phantom was imaged using 21 projections over a 35° angular span and reconstructed. The current system configuration (15 sources) for the Gen 1 system was used for this measurement. The ASF was then calculated using the set of six largest aluminum oxide specks (0.54 mm diameter) in the ACR phantom used to simulate MCs. It was calculated by measuring the contrast between the object and background for the region of interest for every reconstructed slice.29, 30 Calculation of the ASF is given by the equation:
Where the “max[x mc (z)]” is the maximum pixel value of the region of interest (ROI) for the slice located at z, and μbkg (z) is the average value of the background pixels of the ROI for the slice. The data were then fitted to a Gaussian and the full width half maximum (FWHM) was used as the measure of z‐axis resolution.15
3. Results
3.A. CNT x‐ray source array characterization
The tube current and focal spot size measurements were made for all x‐ray sources. An anode‐cathode tube potential of 30 kVp was used for the characterization of the CNT sources. The measured cathode and anode electrical current waveform from each source was captured with an oscilloscope, and a summary is plotted in Fig. 4. The results indicate that with the cathode electronic control system (ECS) all CNT sources can output 43 mA of cathode current consistently from source to source. The calculated transmission rates ranged from 63% to 70% with an average value of 68 ± 4%. All acquired projection images in this study used an output of 29 ± 2 mA tube current, varying the pulse width of the sources to achieve the desired x‐ray exposure (mAs).
Figure 4.
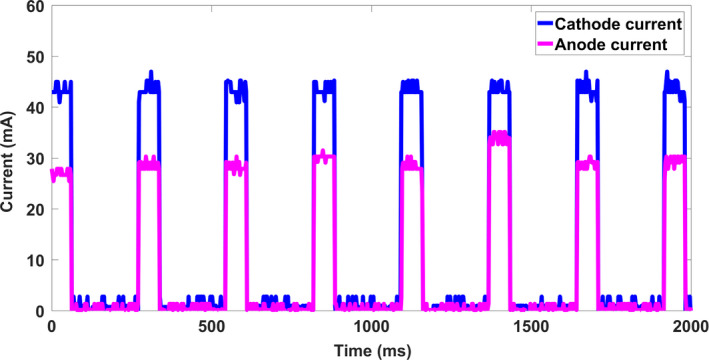
The cathode current waveform and anode current waveform for a 60 ms pulse width from eight different CNT sources. The results indicate that with ECS all CNT sources can consistently produce 43 mA cathode current across all sources. [Color figure can be viewed at wileyonlinelibrary.com]
The focal spot size was determined by analysis of the pinhole images generated from the respective sources. Figure 5(a) shows a pinhole image from a source. Normalized intensity profiles were generated and fitted to a 2D Gaussian distribution across the length and width of the ROI as shown in Fig. 5(b). The 20% cut of the Gaussian distribution was used as the focal spot size. Figure 6 shows the experimentally measured focal spot sizes for the 21 sources. Based on the measurement, the focal spot sizes are consistent from source to source, having an average length of 1.29 ± 0.1 mm and an average width of 1.54 ± 0.15 mm, which corresponds to a nominal focal spot size of 1.1 mm.
Figure 5.
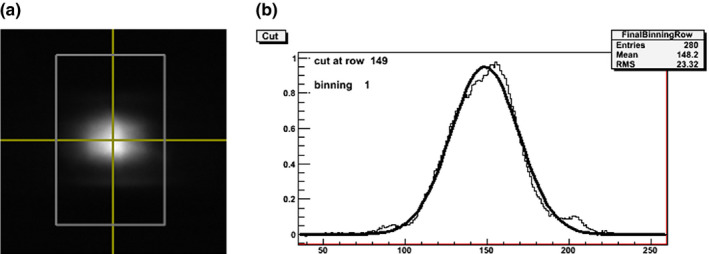
Focal spot measurement using a pinhole phantom. (a) A pinhole image acquired at 40 kVp. (b) The normalized intensity profile of the length of the pinhole image. [Color figure can be viewed at wileyonlinelibrary.com]
Figure 6.
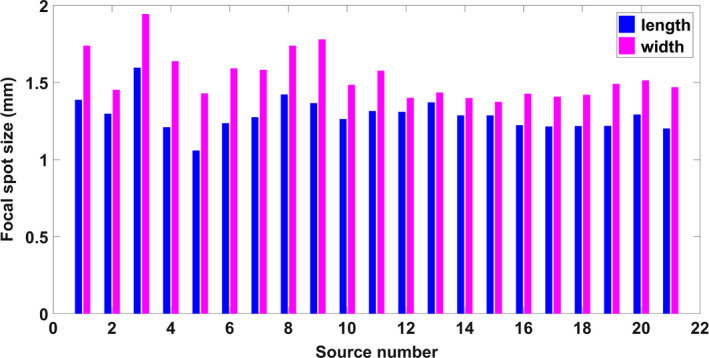
Focal spot size measurement of 21 sources in the source array. The results show a good source‐to‐source consistency, with an average of 7% difference between the sources. [Color figure can be viewed at wileyonlinelibrary.com]
3.B. Beam quality
The spectrum of the x‐ray source was measured at the highest operational tube voltage of 49 kVp using a CdTe detector (AMPTEK, Inc., Bedford, Mass.). The measured normalized spectrum at 49 kVp is shown in Fig. 7 and compared to a simulated spectrum generated with SpekCalc v1.1 for a tungsten anode, 49 kVp tube potential and an Al x‐ray window of thickness 0.5 mm.31 The measured spectrum agrees with the simulated spectrum, with respective mean energies at 24.96 keV and 26 keV.
Figure 7.
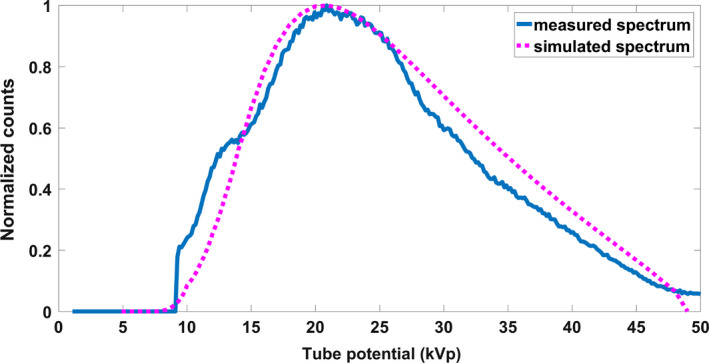
Experimentally measured, and simulated spectra for 49 kV tube potential and tungsten target with 0.5 mm Al filtration. [Color figure can be viewed at wileyonlinelibrary.com]
The beam quality of medical x‐ray imaging devices is quantified using the first HVL. The first HVL was interpolated from the data and calculated to be 0.45 mm, which is in accordance MQSA's quality standard of 0.33 mm Al for 30 kVp.
3.C. System geometry calibration
The measured calibration data for both x, and y source position directions were fitted to a line to determine how well the focal spots fit its linear design. Figure 8(a) shows the raw data and fitted line of the calibration utilizing the optimization method for the x‐direction. The fitted linear regression line had a relatively small slope of 0.093 and an R‐squared value of 0.77. The small slope is indicative of the misalignment of the linear x‐ray source array with the scanning direction, which is < 6 degrees. For further investigation, residual analyses comparing the observed and predicted values were conducted and are shown in Figure 8(b). The pattern of the residual plot displays the variation in each source from its predicted value. For the y‐direction, the source position varies linearly with the source number as expected [Fig. 9(a)]. The measured y‐coordinate calibration data were then used to calculate the inter‐angular spacing, and total angular coverage for comparison with its design parameters. Source position angles relative to the iso‐center were determined using the calculated average S0D of 744.44 ± 3.33 mm. Figure 9(a) displays the raw data and fitted line of the calibration for the y‐direction. Based on the focal spots y‐coordinates, the angular position of each source from the center of the detector were determined. The linear source array was designed to be equiangular spaced with respect to the detector center. An average equiangular spacing of 1.76 ± 0.03 degrees was found. Residual angles established from the design parameters are plotted in Fig. 9(b). The largest angular difference measured based on the design criteria was 0.14 degrees, demonstrating that the sources were constructed within 1% error of its angular design specifications.
Figure 8.
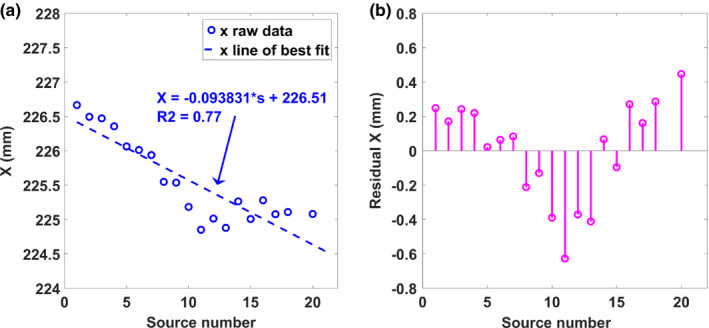
The geometry calibration results for (a) the X coordinates of the focal spots in the Gen 2 s‐DBT source array using the optimization method and (b) the error of the coordinates from a straight line. [Color figure can be viewed at wileyonlinelibrary.com]
Figure 9.
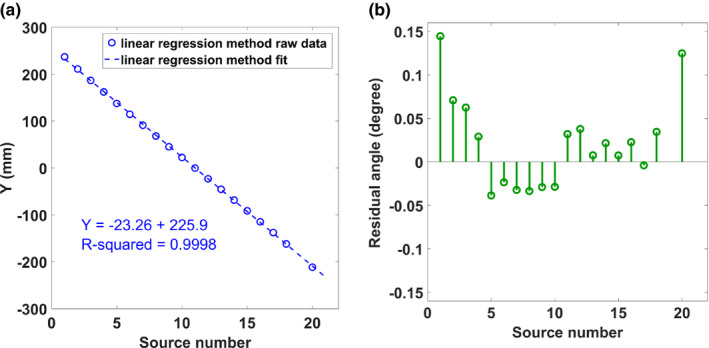
The geometry calibration results for the (a) Y coordinates of the focal spots and (b) the errors in the angular distribution of sources calculated from the y‐coordinates. [Color figure can be viewed at wileyonlinelibrary.com]
3.D. Radiation dose and system scan time
3.D.1. Dose measurements
Total accumulative entrance surface air kerma was measured using the dosimeter at different tube potentials and 1.55 mAs current‐exposure time per source. A plot of the entrance surface air kerma rate as a function of x‐ray tube potential for the Gen 1 system, Gen 2 system, and the Selenia Dimensions DBT is displayed in Fig. 10. As observed in the figure, the dose rate of the Gen 2 s‐DBT is more than double the dose rate of than Gen 1 s‐DBT. As a comparison, the measured dose rate of the Selenia Dimensions DBT system was shown in the same figure.
Figure 10.
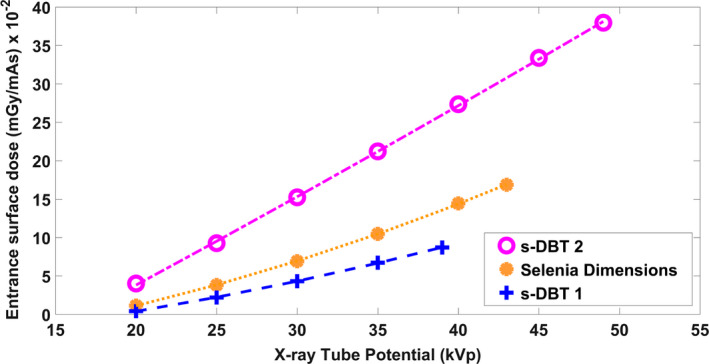
Measured entrance surface air kerma rates for the s‐DBT systems and Selenia Dimensions. The dose was measured 4.2 cm above the breast support table for each system. [Color figure can be viewed at wileyonlinelibrary.com]
3.D.2. Scan time
Scan time for the Gen 2 s‐DBT system was calculated and compared to the Gen 1 system. For s‐DBT the scan time is dependent on a number of factors,
Where “Tacq” is the total acquisition time, “Nprojection” is the number of projection images, “Δtexp” is the exposure time per projection, and “Δtreadout” is the detector readout time per projection. The exposure time per view is a function of the required entrance surface air kerma, and the x‐ray tube current. Keeping the number of projections, total image dose and tube current constant, the dose rate of the Gen 2 system results in shorter image acquisition times as a result of its higher entrance surface air kerma rate.
Table 1 lists a comparison of image acquisition times between the two s‐DBT systems for different compression thicknesses, using the current configuration of the Gen 1 system that is currently in clinical trials. The current source configuration of the Gen 1 system utilizes a maximum of 15 sources (every other source in the linear array), with less sources used for smaller breast as a means to reduce image acquisition times. For the Gen 2 system, 15 sources were used for each breast compression. Total dose, maximum number of sources and detector read out time was kept constant for the comparison. The total entrance surface air kerma for each compression thickness of the s‐DBT systems were matched to the total entrance surface air kerma from the Selenia Dimensions system automatic exposure control (AEC) for normal breast (50/50 adipose glandular).
Table 1.
Comparison of imaging times between the first and Gen 2 s‐DBT systems. The Gen 2 system is capable of measuring all compression thicknesses shown in about 4 s
| Thickness (mm) | First s‐DBT no. of sources | Scan time 1st s‐DBT (s) | Second s‐DBT no. of sources | Scan time second s‐DBT (s) |
|---|---|---|---|---|
| 10 | 9 | 2.40 | 15 | 2.20 |
| 15 | 9 | 2.63 | 15 | 2.32 |
| 20 | 13 | 3.23 | 15 | 2.46 |
| 25 | 13 | 3.61 | 15 | 2.53 |
| 30 | 13 | 3.90 | 15 | 2.56 |
| 35 | 15 | 4.60 | 15 | 2.66 |
| 40 | 15 | 3.78 | 15 | 3.00 |
| 45 | 15 | 4.15 | 15 | 3.11 |
| 50 | 15 | 4.63 | 15 | 3.27 |
| 55 | 15 | 4.42 | 15 | 3.53 |
| 60 | 15 | 4.88 | 15 | 3.70 |
| 65 | 15 | 4.85 | 15 | 3.95 |
| 70 | 15 | 4.84 | 15 | 4.20 |
| 75 | 15 | 5.19 | 15 | 4.32 |
| 80 | 15 | 5.48 | 15 | 4.22 |
| 85 | 15 | 5.86 | 15 | 4.20 |
| 90 | 15 | 6.18 | 15 | 4.14 |
Comparing the Gen 2 system, scan times for all compression thicknesses are around or under 4 s. Assuming the same amount of projections, the scan time for Gen 2 s‐DBT is ~ 30% shorter than Gen 1 s‐DBT. The reduction in scan time would lead to a lower probability in patient motion, yielding better image quality.
It is important to point out a major advantage of the s‐DBT system; its scan time depends only on the total dose and the number of projection views, and is independent of the angular span of the source array. Thus, the scan time of Gen 2 s‐DBT system can be shortened if less than 15 projection views are used, without compromising the depth resolution. In contrast to a rotating gantry DBT system, where the larger the angular span the longer the scan time. With faster high frame rate detectors, which may become available in the future, the scan time of the s‐DBT system can be further reduced while for DBT systems further reduction will be unlikely due to the mechanical motion constrain.
3.E. System resolution
3.E.1. MTF of DBT projection images
The MTF of the central source was analyzed from the respective projection image of the 50 μm tungsten wire test object for each DBT system. The oversampled LSFs needed for MTF calculation were generated three times for the region of interest (ROI) across the wires to measure MTF. Figure 11 shows the calculated MTF in the scanning direction for the central source for the DBT systems. Using 10% of the normalized MTF (MTF10) intensity as the figure of merit, the Gen 2 s‐DBT system has the highest spatial resolution of 7.8 cycles/mm, compared to 7.2 cycles/mm for the Gen 1 s‐DBT, at full resolution (70 μm × 70 μm pixel). These resolutions are significantly higher than both Hologic (MTFs10 at 4.7 cycles/mm) and the GE DBT systems (5.7 cycles/mm).
Figure 11.
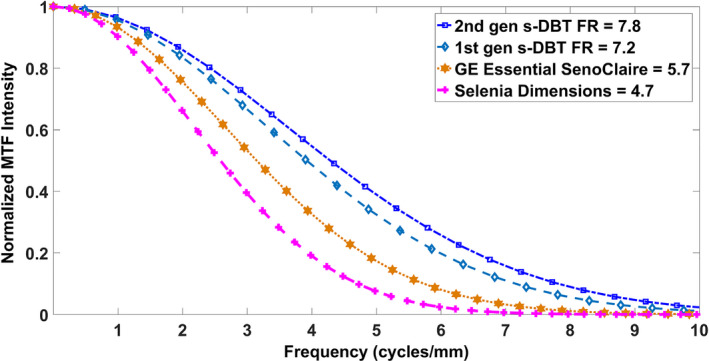
MTFs of central projection images of the two FDA approved devices and both s‐DBT systems. Where FR stand for full resolution at 70 μm pixel size. [Color figure can be viewed at wileyonlinelibrary.com]
The effect of geometric unsharpness on the height above the detector was determined by comparing MTF10 values for the Gen 2 s‐DBT projections at different heights in both scanning and chest wall directions (Fig. 12). The detector was used in full resolution mode for all measurements. In this study, the wired test object resting on the detector was used as the reference (wire height 10 mm) MTF10. At 5 cm above the detector, the MTFs of the central projection images in both the chest wall, and scanning direction had an approximate 23% reduction in spatial resolution, showing no noticeable reduction in resolution of one direction over the other.
Figure 12.
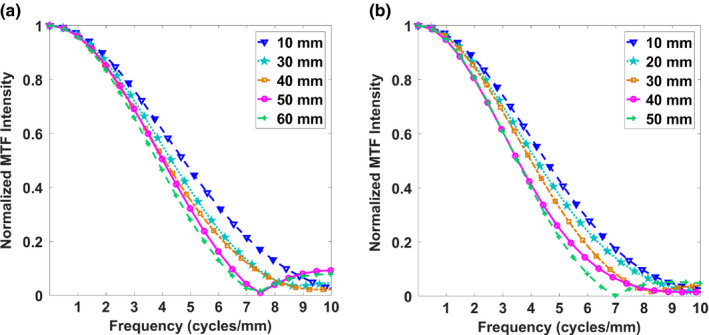
The MTF measured from the central source projection for different heights above the detector for the Gen 2 s‐DBT system in the (a) scanning direction and (b) chest wall direction. [Color figure can be viewed at wileyonlinelibrary.com]
3.E.2. In‐plane system resolution
The reconstructed plane MTF was measured from the in‐focus reconstructed slice of the wired test object. For both s‐DBT systems image acquisition sets, commercial RTT software and our in‐house developed AFVR reconstruction method were employed for reconstruction. The Hologic system reconstruction was done via RTT only, as the AFVR method is unique to s‐DBT systems. The slice thickness of 0.1 mm was chosen for RTT reconstructions software, and 0.2 mm for AFVR reconstructions to minimize z‐offset and attains the highest measurable MTF. Figure 13 shows the oversampled LSF and its respective Gaussian‐fitted LSF.
Figure 13.
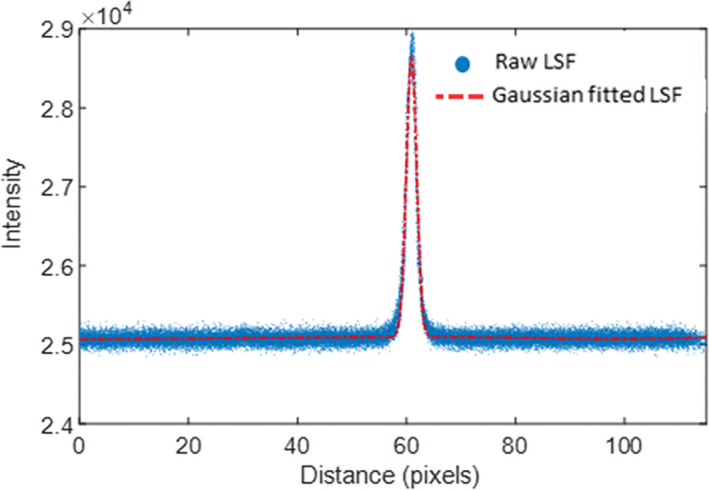
The LSF of the horizontal tungsten wire and the Gaussian‐fitted LSF. [Color figure can be viewed at wileyonlinelibrary.com]
Figure 14 displays a plot of the full resolution Gen 2 s‐DBT systems for both the RTT and AFVR reconstruction methods, and the Selenia Dimensions system using RTT. Comparing MTF10 in the scanning direction, both reconstruction methods resulted in significantly higher reconstructed planes MTFs for the Gen 2 s‐DBT system than the Selenia Dimensions system. Using the same RTT reconstruction software, the Gen 2 s‐DBT system has a reconstructed plane MTF of 6.7 cycle/mm vs. 4.7 cycles/mm for Selenia Dimension, an improvement of over 50% for the in‐plane spatial resolution. Furthermore, when AFVR reconstruction method is used for Gen 2 s‐DBT, the MTF increased an additional 1 cycles/mm to 7.7 cycle/mm. This is primarily attributed to the use of iterative SART reconstruction in AFVR vs. the FBP in RTT.
Figure 14.
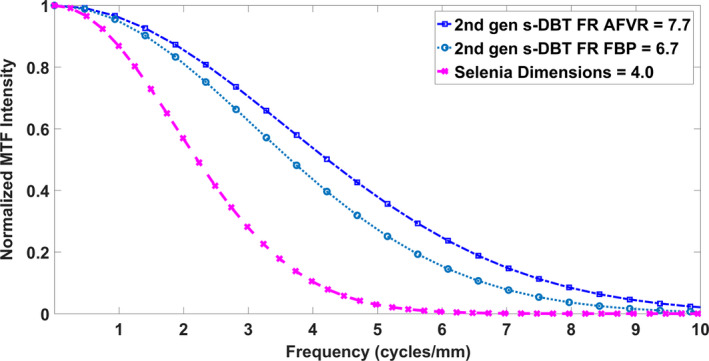
The reconstructed plane MTFs of the Selenia dimensions system compared to the Gen 2 system utilizing the AFVR and RTT reconstruction methods. Where FR stand for full resolution at 70 μm pixel size. [Color figure can be viewed at wileyonlinelibrary.com]
Table 2 list the experimentally measured MTFs of the DBT systems in comparison with s‐DBT systems. The full resolution Gen 2 s‐DBT has the best reconstructed plane MTF than all systems in the relative categories. In the 2 × 2 binning mode (140 μm pixel size), Gen 2 s‐DBT had higher projection and reconstructed plane MTFs than the commercial DBT system in the non‐binning mode (100 μm pixel size).
Table 2.
Experimentally measured MTF at 10% of the normalized intensity for the first and Gen 2 s‐DBT systems in the scanning direction. The Gen 1 system is currently configured to operate only in full resolution mode, therefore, measurements at pixel size 140 μm were unavailable. Both reconstruction methods (RTT & AFVR) were evaluated where applicable
| Detector pixel size | Selenia dimensions 140 μm | GE SenoClaire 100 μm | First gen s‐DBT | Second gen s‐DBT | |
|---|---|---|---|---|---|
| 70 μm | 140 μm | 70 μm | |||
| Projection MTF10 (cycles/mm) | 4.7 | 5.7 ± 0.1 | 7.2 | 6.4 | 7.8 |
| Recon. plane MTF10 RTT (cycles/mm) | 4.0 | 5.6 ± 0.2 | 4.5 ± 0.2 | 6.6 ± 0.1 | |
| Recon. plane MTF10 AFVR (cycles/mm) | 6.7 ± 0.2 | 5.4 ± 0.6 | 7.7 ± 0.1 | ||
3.E.3. In‐depth resolution as measured by artifact spread function
The artifact spread function was measured using the largest aluminum oxide specs group (0.54 mm) for both the Gen 2 s‐DBT and the GE DBT system. For the Gen 2 system, both reconstruction methods were investigated, and the Gaussian‐fitted ASF as a function of slice depth is displayed in Fig. 15(a) for both reconstruction methods. The FWHM of the fitted Gaussian ASF was used to quantitate the in‐depth resolution for the system, resulting in an average in‐depth resolution of 2.35 ± 0.25 mm for AFVR and 2.84 ± 0.3 mm for RTT reconstruction. Previous measurements comparing the angular span to the ASF for the first generation system yielded a FWHM ASF of 4.3 mm.15 The decrease in FWHM of the ASF is expected, as depth resolution is dependent on total angular coverage. The difference in the ASF between the reconstruction methods for the Gen 2 system shows that the ASF is also dependent on the reconstruction method. The AFVR reconstruction method produced the narrowest FWHM ASF, with a 17% decrease from the RTT method. Figure 16 is a visual comparison of a 0.54 mm Al2O3 speck in focus and at different slice depths for both reconstruction methods. Based on the images, it can be discerned that the slices at 1 mm and 2 mm for the AFVR method are sharper than those from reconstructed using RTT.
Figure 15.
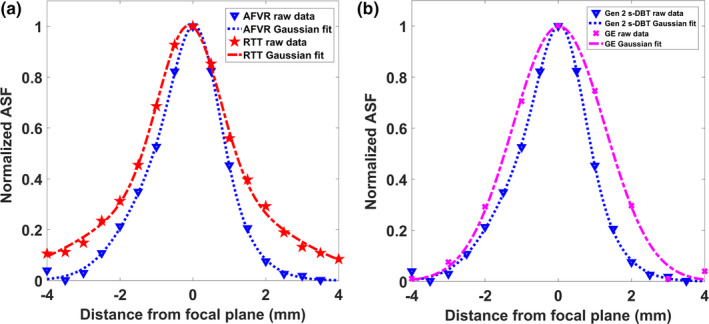
(a) Plot of the ASF for a 35° angular span for AFVR and RTT reconstruction methods. Both the raw data and the fitted data are shown. The AFVR reconstruction method resulted in a marginal decrease in the ASF. (b) Plot of the ASF for the Gen 2 system utilizing AFVR reconstruction, compared against the measured ASF from the GE system. [Color figure can be viewed at wileyonlinelibrary.com]
Figure 16.
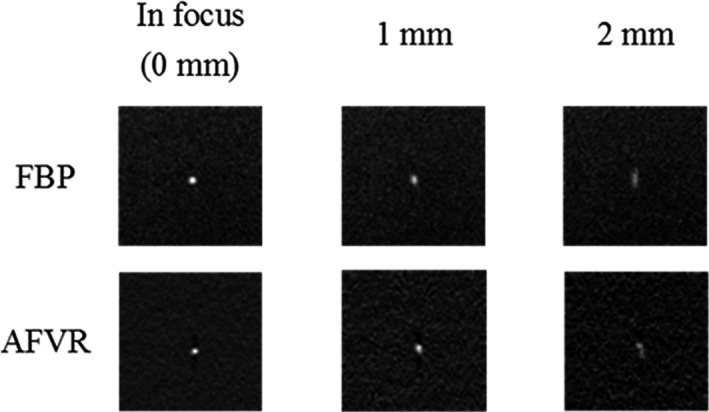
Shows a three slice comparison of one of the 0.54 mm specks in the ACR phantom for both AFVR and RTT reconstruction methods. At each slice depth, the RTT slices look a bit blurrier than the slices from AFVR method.
The GE system ASF was calculated and compared to the ASF for the AFVR reconstructed image from the Gen 2 system [Figure 15(b)]. As expected, a slightly narrower ASF is obtained for the Gen 2 s‐DBT system as it has a wider angular span. The FWHM of the ASF for the GE system was 2.89 ± 0.1 mm.
4. Discussion
The objective of this study was to construct and characterize a second generation s‐DBT system, with an increased tube flux and a wider angular span. This allows the scanning of patients with thick and dense breast, at the same time, it decreases the imaging time and increases the depth resolution. The system was constructed and characterized to investigate whether the system performance matched its design criteria. The design of this system was based on previous studies that showed improved resolution of an s‐DBT system over a CM DBT system.15 The results reported in this paper show that the Gen 2 s‐DBT system demonstrates drastic improvement in both the in‐plane and out‐of‐plane resolution compare to both the Gen 1 s‐DBT system and currently available commercial DBT systems.
4.A. X‐ray tube characterization
The increased cathode current and the reduction in the Al window from 1 to 0.5 mm from the Gen 1 system to the second was responsible for the increase in the entrance surface air kerma rate. Compared to the first system, the Gen 2 system is capable of delivering more than adequate x‐ray dosage as used in FDA approved DBT systems. The more than twofold increase in the entrance surface air kerma rate significantly reduced the scan time for the Gen 2 s‐DBT system, offering faster or equivalent scanning times for some patient compression thicknesses compared with FDA approved systems. For example, at the average compression thickness of 45 mm, the Selenia Dimension and GE SenoClaire systems take approximately 4 and 7 s, respectively, whereas for the Gen 2 s‐DBT system, the scan time is about 3 s. This reduction in image acquisition time is favorable as it minimizes the probability for patient motion, which may improve image quality.32, 33 A further reduction in the detector readout out time or higher tube output power could further reduce scan times. Both Gen 1 and Gen 2 s‐DBT systems use the stationary anode x‐ray source array. Further increase in tube power is possible if a rotation anode is utilized in the x‐ray source array. We are currently actively exploring this possibility.
4.B. DBT projection MTF and reconstructed plane MTF
The in‐plane resolution quantified by the reconstructed plane MTF depends primarily on the effective focal spot size of the x‐ray source, the detector pixel size, and reconstruction method.33, 34 In conventional DBT systems, there is a reduction in the reconstructed plane MTF in the scanning direction due to tube movement. This was apparent in measuring the MTFs of projection images in the scanning directions for both commercial DBT systems. The stationary x‐ray focal spots for the s‐DBT systems resulted in higher MTFs, as there is no degradation due to motion. The step and shoot modality employed by the GE systems resulted in a higher MTF of a projection image than Hologic's system as there is no translation of the tube during image acquisition. Although this reduces the blurring in the scan direction, it significantly increases the scanning time (> 7 s), resulting in a larger probability for patient motion, which also reduces the image quality.
The MTFs of projection images against different heights above the detector were investigated as a means to demonstrate that neither direction suffers significantly more resolution degradation as observed in conventional systems. Rodriguez‐Ruiz et al.35 demonstrated the greater reduction in resolution of the scanning direction compared to the chest wall direction for the Hologic system. A 60% reduction in resolution in the direction of tube travel was measured at a height of 45 mm from the detector surface.35
As expected, a higher system in‐plane resolution was observed with higher MTFs of projection images, and as a consequence the Gen 2 s‐DBT system has 50~60% higher system resolution than the continuous motion DBT system. As expected, the reconstruction method also influences the system resolution. Because of the unique linear x‐ray source array, the s‐DBT enables the application of the AFVR method, which makes the iterative reconstruction method practical in clinical application. Compared with commercial RTT based recon method, the AFVR method enables a further 1 cycles/mm improvement in system resolution given the same raw projection images. This result is in accordance with previous studies that have indicated iterative reconstruction processes result in sharper images with better contrast than those reconstructed with a FBP method.36
4.C. Artifact spread function (ASF)
Since no mechanical motion of the x‐ray tube is required, image acquisition time is independent of angular coverage. This gives the s‐DBT system a unique advantage, as it can capitalize on increased depth resolution without increasing imaging time. The Gen 2 system, having a larger angular span than the Gen 1 system and the GE system, has a better depth resolution as expected.37 It is interesting to note that the employment of iterative method in AVFR also enhance the depth resolution compare with the FPB method.
One limitation of this study is the difference in detector resolution across the DBT systems. Although prior evaluation at equal or worse detector resolution showed improvement in overall system resolution with the Gen 1 system, the effect of an improved detector with equal resolution to the full resolution of the Gen 2 system needs to be evaluated. Another limitation is that the systems were evaluated using phantoms, which are an indication of performance, however, to determine whether these improvements are effective in the clinical setting, they need to be clinically evaluated.
The overall improvement of in‐plane, and depth resolution of the Gen 2 system coupled with the faster image acquisition time should improve breast tomosynthesis imaging quality. The faster imaging time, improved in‐plane resolution, and depth resolution may be valuable in the reduction in false positives, and false negatives, as improved resolution may potentially translate into better patient diagnosis, and a decrease in retake and recall rates.
5. Conclusion
The Gen 2 system stationary digital breast tomosynthesis system using a new distributed CNT x‐ray source array was built and evaluated. The system characterization showed that it had a higher tube flux than the Gen 1 system, which decreased the image acquisition time. The system resolutions, as measured by in‐plane MTF and out‐of‐plane ASF show significant improvement over the first generation s‐DBT, and dramatically better than commercial available DBT systems.
Conflicts of interest
The content in this manuscript is solely the responsibility of the authors. Otto Zhou has equity ownership and also serves on the board of directors of XinRay Systems Inc. Jianping Lu also has equity ownership in XinRay Inc. Philip E. Laganis, Derrek Spronk, Houman Jafari, Kyle Olson, and Bo Gao are all employees of XinRay systems Inc., to which technologies used and evaluated in this manuscript have been or will be licensed.
Acknowledgments
This research was sponsored by XinRay Systems (HHSN261201300029C), as a subcontract to the University of North Carolina, Chapel Hill. The authors would like to thank Hologic Inc. for technical support of the Selenia Dimensions Tomosynthesis System.
References
- 1. Tabar L, Yen M, Vitak B, Chen HT, Smith RA, Duffy SW. Mammography service screening and mortality in breast cancer patients : 20‐year follow‐up before and after introduction of screening. Lancet. 2003;361:1405–1410. [DOI] [PubMed] [Google Scholar]
- 2. Tagliafico A, Houssami N, Calabrese M. Digital Breast Tomosynthesis a Practical Approach. VII: Springer International Publishing; 2010. [Google Scholar]
- 3. Sechopoulos I. A review of breast tomosynthesis. Part I. The image acquisition process. Med Phys. 2013;40:014301. [DOI] [PMC free article] [PubMed] [Google Scholar]
- 4. Lång K, Andersson I, Rosso A, Tingberg A, Timberg P, Zackrisson S. Performance of one‐view breast tomosynthesis as a stand‐alone breast cancer screening modality : results from the Malmö Breast Tomosynthesis Screening Trial, a population‐based study. Eur Radiol. 2016;26:184–190. [DOI] [PMC free article] [PubMed] [Google Scholar]
- 5. Houssami N, Macaskill P, Bernardi D, et al. Breast screening using 2D‐mammography or integrating digital breast tomosynthesis (3D‐mammography) for single‐reading or double‐reading–evidence to guide future screening strategies. Eur J Cancer. 2014;50:1799–1807. [DOI] [PubMed] [Google Scholar]
- 6. Tagliafico A, Mariscotti G, Durando M, et al. Characterisation of microcalcification clusters on 2D digital mammography (FFDM) and digital breast tomosynthesis (DBT): does DBT underestimate microcalcification clusters? Results of a multicentre study. Eur Radiol. 2015;25:9–14. [DOI] [PubMed] [Google Scholar]
- 7. Michell MJ, Iqbal A, Wasan RK, et al. A comparison of the accuracy of film‐screen mammography, full‐field digital mammography, and digital breast tomosynthesis. Clin Radiol. 2012;67:976–981. [DOI] [PubMed] [Google Scholar]
- 8. Destounis S, Morgan R, Arieno A. Digital Breast Tomosynthesis: principles and Practice. Curr Radiol Rep. 2016;4:15. [Google Scholar]
- 9. Das M, Connolly C, Glick SJ, Gifford HC. Effect of postreconstruction filter strength on microcalcification detection at different imaging doses in digital breast tomosynthesis: human and model observer studies. 2012; 8313:1‐8.
- 10. Nelson JS, Wells JR, Baker JA, Samei E. How does c‐view image quality compare with conventional 2D FFDM? Med Phys. 2016;43:2538. [DOI] [PubMed] [Google Scholar]
- 11. Qian X, Tucker A, Gidcumb E, et al. High resolution stationary digital breast tomosynthesis using distributed carbon nanotube x‐ray source array. Med Phys. 2012;39:2090. [DOI] [PMC free article] [PubMed] [Google Scholar]
- 12. Yang G, Qian X, Phan T, et al. Design and feasibility studies of a stationary digital breast tomosynthesis system. Nucl Instrum Methods Phys Res A. 2011;648:S220–S223. [DOI] [PMC free article] [PubMed] [Google Scholar]
- 13. Tucker AW, Calliste J, Gidcumb EM, et al. Comparison of a stationary digital breast tomosynthesis system to magnified 2d mammography using breast tissue specimens. Acad Radiol. 2014;21:1547–1552. [DOI] [PMC free article] [PubMed] [Google Scholar]
- 14. Calliste J, Tucker AW, Gidcumb E, et al. Initial clinical evaluation of stationary digital breast tomosynthesis. In: SPIE Medical Imaging: Physics of Medical Imaging, Vol. 9412. Orlando, FL: International Society for Optics and Photonics; 2015: 941228. [Google Scholar]
- 15. Tucker AW, Lu J, Zhou O. Dependency of image quality on system configuration parameters in a stationary digital breast tomosynthesis system. Med Phys. 2013;40:031917. [DOI] [PMC free article] [PubMed] [Google Scholar]
- 16. Tucker AW, Lee YZ, Kuzmiak CM, Calliste J, Lu J, Zhou O. Increased microcalcification visibility in lumpectomy specimens using a stationary digital breast tomosynthesis system. In: Whiting BR, Hoeschen C, eds. SPIE Medical Imaging. San Diego, CA: International Society for Optics and Photonics; 2014: 903316. [Google Scholar]
- 17. Park H‐S, Kim Y‐S, Kim H‐J, Choi J‐G, Choi Y‐W. Optimization of the key imaging parameters for detection of microcalcifications in a newly developed digital breast tomosynthesis system. Clin Imaging. 37:993–999. [DOI] [PubMed] [Google Scholar]
- 18. Sechopoulos I, Ghetti C. Optimization of the acquisition geometry in digital tomosynthesis of the breast. Med Phys. 2009;36:1199–1207. [DOI] [PubMed] [Google Scholar]
- 19. Park H‐S, Kim Y‐S, Kim H‐J, Choi Y‐W, Choi J‐G. Optimization of configuration parameters in a newly developed digital breast tomosynthesis system. J Radiat Res. 2014;55:589–599. [DOI] [PMC free article] [PubMed] [Google Scholar]
- 20. Wang X, Mainprize JG, Kempston MP, Mawdsley GE, Yaffe MJ. Digital breast tomosynthesis geometry calibration. SPIE Med Imaging Phys Med Imaging. 2007;6510:65103B. [Google Scholar]
- 21. Li X, Da Z, Liu B. A generic geometric calibration method for tomographic imaging systems with flat‐panel detectors–a detailed implementation guide. Med Phys. 2010;37:3844–3854. [DOI] [PubMed] [Google Scholar]
- 22. Shan J, Chtcheprov P, Tucker AW, et al. Stationary chest tomosynthesis using a CNT x‐ray source array. Station chest tomosynthesis using a CNT x‐ray source array. 2013;81:86680E ‐ 86680E ‐ 12. [Google Scholar]
- 23. Shan J. Development of a stationary chest tomosynthesis system using carbon nanotube x‐ray source array. 2015. [DOI] [PubMed]
- 24. Kuo J, Ringer PA, Fallows SG, Bakic PR, Maidment ADA, Ng S. Dynamic reconstruction and rendering of 3D tomosynthesis images. In: Pelc NJ, Samei E, Nishikawa RM, eds. SPIE Medical Imaging. Orlando, FL: International Society for Optics and Photonics; 2011: 796116. [Google Scholar]
- 25. Wu G, Inscoe C, Calliste J, Lee YZ, Zhou O, Lu J. Adapted fan‐beam volume reconstruction for stationary digital breast tomosynthesis. In: Hoeschen C, Kontos D, Flohr TG, eds. SPIE Medical Imaging. Orlando, FL: International Society for Optics and Photonics; 2015: 94123J. [Google Scholar]
- 26. Fujita H, Tsai D‐Y, Itoh T, et al. A simple method for determining the modulation transfer function in digital radiography. IEEE Trans Med Imaging. 1992;11:34–39. [DOI] [PubMed] [Google Scholar]
- 27. Hu Y‐H, Zhao B, Zhao W. Image artifacts in digital breast tomosynthesis: investigation of the effects of system geometry and reconstruction parameters using a linear system approach. Med Phys. 2008;35:5242–5252. [DOI] [PMC free article] [PubMed] [Google Scholar]
- 28. Zhang Y, Chan H‐P, Sahiner B, et al. A comparative study of limited‐angle cone‐beam reconstruction methods for breast tomosynthesis. Med Phys. 2006;33:3781–3795. [DOI] [PMC free article] [PubMed] [Google Scholar]
- 29. Wu T, Moore RH, Rafferty EA, Kopans DB. A comparison of reconstruction algorithms for breast tomosynthesis. Med Phys. 2004;31:2636–2647. [DOI] [PubMed] [Google Scholar]
- 30. Zhao B, Zhou J, Hu Y‐H, Mertelmeier T, Ludwig J, Zhao W. Experimental validation of a three‐dimensional linear system model for breast tomosynthesis. Med Phys. 2009;36:240–251. [DOI] [PMC free article] [PubMed] [Google Scholar]
- 31. Poludniowski G, Landry G, DeBlois F, et al. SpekCalc : a program to calculate photon spectra from tungsten anode x‐ray tubes. Phys Med Biol. 2009;54:N433–N438. [DOI] [PubMed] [Google Scholar]
- 32. Ren B, Ruth C, Wu T, et al. A new generation FFDM/tomosynthesis fusion system with selenium detector. In: Samei E, Pelc NJ, eds. SPIE Medical Imaging. San Diego, CA: International Society for Optics and Photonics; 2010: 76220B. [Google Scholar]
- 33. Ren B, Ruth C, Stein J, Smith A, Shaw I, Jing Z. Design and performance of the prototype full field breast tomosynthesis system with selenium based flat panel detector. In: Flynn MJ, ed. Medical Imaging. San Diego, CA: International Society for Optics and Photonics; 2005: 550–561. [Google Scholar]
- 34. Helvie MA. Digital mammography imaging: breast tomosynthesis and advanced applications. Radiol Clin North Am. 2010;48:917–929. [DOI] [PMC free article] [PubMed] [Google Scholar]
- 35. Rodríguez‐Ruiz A, Castillo M, Garayoa J, Chevalier M. Evaluation of the technical performance of three different commercial digital breast tomosynthesis systems in the clinical environment. Phys . Medica. 2016;1–11. [DOI] [PubMed] [Google Scholar]
- 36. Sechopoulos I. A review of breast tomosynthesis. Part II. Image reconstruction, processing and analysis, and advanced applications. Med Phys. 2013;40:014302. [DOI] [PMC free article] [PubMed] [Google Scholar]
- 37. Chawla AS, Lo JY, Baker JA, Samei E. Optimized image acquisition for breast tomosynthesis in projection and reconstruction space. Med Phys. 2009;36:4859–4869. [DOI] [PMC free article] [PubMed] [Google Scholar]


